Article

An Improved NSGA-II Algorithm Based on Adaptive Weighting and Searching Strategy

1
Key Laboratory of Knowledge Automation for Industrial Processes of the Ministry of Education, School of Automation and Electrical Engineering, University of Science and Technology Beijing, Beijing 100083, China
2
Norinco International Armament Research & Development Center, Beijing 100053, China
3
School of Civil and Resources Engineering, University of Science and Technology Beijing, Beijing 100083, China
*
Author to whom correspondence should be addressed.
Appl. Sci. 2022, 12(22), 11573; https://doi.org/10.3390/app122211573
Submission received: 18 October 2022 / Revised: 10 November 2022 / Accepted: 11 November 2022 / Published: 14 November 2022

Abstract

:
Non-dominated sorting genetic algorithm II is a classical multi-objective optimization algorithm but it suffers from poor diversity and the tendency to fall into a local optimum. In this paper, we propose an improved non-dominated sorting genetic algorithm, which aims to address the issues of poor global optimization ability and poor convergence ability. The improved NSGA-II algorithm not only uses Levy distribution for global search, which enables the algorithm to search a wider range, but also improves the local search capability by using the relatively concentrated search property of random walk. Moreover, an adaptive balance parameter is designed to adjust the respective contributions of the exploration and exploitation abilities, which lead to a faster search of the algorithm. It helps to expand the search area, which increases the diversity of the population and avoids getting trapped in a local optimum. The superiority of the improved NSGA-II algorithm is demonstrated through benchmark test functions and a practical application. It is shown that the improved strategy provides an effective improvement in the convergence and diversity of the traditional algorithm.

1. Introduction

The principle of multi-objective optimization [1] is that when multiple conflicting objectives need to be achieved in a particular situation, the optimization of one objective is often accompanied by degradation of the performance of other objectives, so it is necessary to find a set of solutions [2] that balance multiple sub-objectives to obtain the best optimization for each sub-objective.
Traditional mathematical methods cannot achieve more satisfactory results because multi-objective optimization problems are computationally difficult. Evolutionary algorithms [3] can be a good solution [4]. The most widely used evolutionary multi-objective optimization algorithm for discovering Pareto optimal solutions is known as the non-dominated sorting genetic algorithm II. In 1989, Goldberg proposed the concept of Pareto-based optimal solutions and the calculation of the individual fitness method, where the population evolves toward the Pareto optimal solution through non-inferior solutions and the corresponding selection operations.
The NSGA algorithm, which was first proposed by Professors Srinivas and Deb in the early 1990s, is based on classifying all individuals in a population at different levels. NSGA uses a non-dominated sorting method that allows good individuals to have a greater chance of being inherited by the next generation, and an adaptation sharing strategy that allows individuals to be evenly distributed and maintains population diversity. Indian scientist Deb proposed a non-dominance ranking genetic algorithm based on the NSGA algorithm in 2002 [5] and used an elite strategy by applying the Pareto dominance relationship and crowding distance mechanism to update the population.
NSGA-II has better convergence and distribution [6] because of the use of fast non-dominated sorting and crowded-distance-sorting mechanisms. However, NSGA-II has a slow convergence speed due to the use of an inefficient simulated binary crossover algorithm. It has poor convergence speed and optimization finding ability when solving complex problems [7]. With the NSGA-II algorithm applied to a wider range, some problems have gradually emerged. In the genetic operation, constant genetic parameters lead to a smaller moving space and poorer search performance during the iteration of the algorithm. Meanwhile, the NSGA-II algorithm shows the problem of falling into local optimal solutions.
The principal contributions of this study are summarized as follows:
1.
An improved non-dominated ranking genetic algorithm is proposed to enhance the search ability by using Levy flight and random walk strategy, which can provide a larger search range and better local search ability.
2.
To improve the accuracy and speed of convergence, an adaptive parameter is designed, which balances the exploration and development periods.
In the remainder of the paper, we first introduce some fundamental conceptions of multi-objective optimization problems and discuss some existing works in Section 2. At the beginning of Section 3, we present some background on NSGA-II, then introduce Levy distribution and random walk-in detail, while designing an adaptive weight to balance global exploration and local exploitation. After that, we propose the improved NSGA-II algorithm. In Section 4, we submit the results on standard test functions and a mathematical model for the parallel chillers. At the end of the article, we outline the conclusions of the study.

2. Preliminaries

2.1. Multi-Objective Optimization

In engineering, we often encounter design and decision problems under multiple criteria or multiple design objectives, which are often contradictory for finding the best design solution to satisfy these objectives, which is the multi-objective optimization problem [8]. As an example of minimizing MOPs, define the relevant concepts of MOPs as follows:
 Definition 1. 
Multi-objective optimization problem. For a MOP with n-dimensional decision variables and m-dimensional objectives, the mathematical model is defined as
min F ( x ) = f 1 ( x ) , f 2 ( x ) , , f m ( x ) , T M i ( x ) 0 , i { 1 , 2 , , p } N j ( x ) = 0 , j { 1 , 2 , , q }
where x = x 1 , x 2 , , x n Ω is the decision variable, and Ω is the decision space. F(x) is an objective function consisting of multiple mutually contradictory sub-functions, and M(x) and N(x) are constraint functions with independent variable x.
 Definition 2. 
Pareto optimal solutions [9]. In the context of multi-objective optimization, objective functions conflict with each other or cannot be compared in a simple way. The solution of a problem that is optimal in the first objective function may appear to be the worst solution in the second objective function, so people refer to a series of solutions that cannot be simply compared in the computation of multiple objective optimization problems as non-dominated solutions or Pareto optimal solutions.
 Definition 3. 
Pareto dominate. Supposing that x 1 , x 2 ϵ X are two decision variables in the objective space that satisfy the constraints, the definition of the dominance between the two solutions can be expressed as x 1 dominating x 2 if
i { 1 , 2 , , m } , f 1 x 1 f 1 x 2 j { 1 , 2 , , m } , f j x 1 < f j x 2 .
Therefore, a design x is said to be non-dominated [10] if no other feasible design dominates it.

2.2. NSGA-II Algorithm

Deb et al. proposed the fast non-dominated sorting genetic algorithm with elite strategy (NSGA-II) [5] in 2000, which specifically shows its advantages from the following three points: (1) It provides a hierarchy-based non-dominated sorting method to select the optimal solution by hierarchical sorting. Compared with the original method, the operation speed is significantly improved, unnecessary calculations are reduced, and the speed of problem solving is greatly improved. (2) The parent population is fused with the offspring population to retain the better individuals by selecting the optimal solution through an elite strategy. (3) A crowding distance comparison operator is given to solve the original problem that requires a specified shared radius, and makes the optimal solution evenly distributed [9] in space.
In order to determine the degree of superiority of each solution at the identical ranking level in the results of algorithm, a crowding distance is assigned to all solutions. The basic idea is to spread out the already solved Pareto optimal solutions from the search domain to the greatest extent possible, and this process is also a performance indicator to ensure diversity among the solutions. The crowded distance comparison operator can be used as a solution for each stage of the selection algorithm by ranking individuals in terms of crowded distance comparison and taking the top N individuals to drive the Pareto optimal front in an evenly distributed state.
The specific implementation process of NSGA-II algorithm is as follows:
Step 1. Population initialization. The population size is N, and the Gen = 1 is set as the number of evolutionary generations;
Step 2. Based on the execution of selection, crossover and mutation operators, determine whether the first generation of offspring population has been formed. If it has been generated, make the evolutionary generation Gen = 2. If not, perform the non-dominant sorting operation on the initial population and continue to perform the selection, crossover, and variation operations to produce a population of first-generation offspring with evolutionary generation Gen = 2;
Step 3. Generate a new population by integrating parent and offspring populations;
Step 4. First determine whether a new parent population has been formed, and if not, the objective function of individuals in the new population is calculated, and a new parent population is generated by performing operations such as fast non-dominance sorting, calculating crowding [11], and elite strategy. Otherwise, go to step 5;
Step 5. Generate the offspring population by performing selection, crossover, and variation operators on the generated parent population;
Step 6. First determine whether Gen is equal to the maximum evolutionary generation; if not, then make the evolutionary generation Gen = Gen + 1 and return to step 3. Otherwise, the algorithm runs to the end.

3. Improved NSGA-II Algorithm

3.1. Levy Flight Strategy for Global Search

Levy flight [12] belongs to the Markov process. In optimization problems, Levy flight covers a larger area with fewer distances and steps, which is useful to explore the unknown. The levy flight strategy grows faster than the Brownian motion due to the stochastic nature of the step size; therefore, it achieves better results than the Brownian random motion when searching in a large unknown range.

3.1.1. Levy Distribution

Levy flight belongs to random wandering, which means that its trajectory cannot be accurately predicted. Both continuous Brownian motion and Poisson processes are Levy processes, and the most essential characteristic of Levy processes is that they have smooth independent increments.
The mathematical form of the Levy distribution is as follows:
f X x ; σ , μ = σ 2 π 1 / 2 1 ( x μ ) 3 / 2 exp σ 2 ( x μ ) μ < x <
in which μ is the position parameter, which affects the left and right translation of the distribution curve so that the distribution interval is μ , , and c is the scale parameter.

3.1.2. Levy Flight

Levy flight is a random walk between short-term search and occasional long-term walk, which drives Levy flight to have an excellent capacity for overall search.
The position update function for Levy flight is as follows:
x i t = x i t + l × L e v y λ
in which x denotes the current position and l denotes the parameter to adjust the step size. The Levy distribution is often simulated by the man algorithm in many studies due to its complexity:
s = μ | ν | 1 / γ
in which μ and ν follow a normal distribution and
σ μ = Γ ( 1 + γ ) sin ( π γ / 2 ) γ · Γ [ ( γ + 1 ) / 2 ] · 2 ( γ 1 ) / 2 1 / γ
σ ν = 1
where γ usually takes the value of 1.5.
The long and short hop features of the Levy flight strategy are used to randomly update each position of the population to enhance the search ability of the global optimum, which can increase the diversity of the population distribution and find the global optimum solution more quickly.

3.2. Random Walk Strategy for Local Search

Random walk uses mixed variation and crossover to generate new solutions, which can enhance the diversity of populations to some extent and prevent the attraction of regional extremes, thus improving the capacity of local search of the algorithm. It can be used to accelerate the speed of the search for optimal solutions.
The position update formula for the random walk is as follows:
x i ( t ) = x i ( t ) + ε x j ( t ) x k ( t )
where x j t and x k t are the two random solutions in the t t h generation, and ε is the scaling factor, ε ϵ U 0 , 1 .

3.3. Framework and Details of INSGA-II Algorithm

To overcome the disadvantages of slow convergence and falling into a local optimum [13] in the NSGA-II algorithm, we use an adaptive weight [14] to balance the global search and local search ability to accelerate the convergence speed, while using Levy flight and random walk strategies to improve the global and local search ability of the algorithm, respectively.
The search mechanism of an optimization algorithm usually consists of two steps, which are the global exploration and the local exploitation. Exploration denotes the tendency of an algorithm to behave in a highly randomized manner. Significant changes in the solutions prompt further exploration of the variables space to discover their promising positions. Exploitation is the discovery of promising areas followed by the reduction in random behavior so that the algorithm can search around the promising areas.
Since Levy flight has a characteristic of walking between long and short, it can effectively improve the global search ability of the algorithm and make the population individuals evenly distributed in the space. The random walk can focus the search on the locations in the space, where the optimal solution is more likely to occur and make the algorithm converge to the optimal solution.
In the early stage of optimization, individuals in the population should be distributed extensively throughout the entire search space, with individuals converging to the global optimum during the later stage of optimization. Therefore, we design an adaptive weighting factor C in this study to balance the pre-global exploration and post-local exploitation capability of the algorithm.
The value of C decreases from 1 to 0.02 during iterations. With the increase in iterations, the algorithm gradually switches from global search into local exact search that aims to enhance the overall convergence accuracy, which is calculated as
C = 1 It 0.98 MaxIt
where It is the current number of iterations and MaxIt is the maximum number of iterations. The maximum number of iterations for the two-objective test function was set to 800, while the maximum number of iterations for the three-objective test function was set to 1500.
The offspring population individuals in the iteration are generated with the formula as follows:
X ( t + 1 ) = C × X t + α Levy ( β )
X ( t + 1 ) = ( 1 C ) × X t + α Guass ( β )
The adaptive weight factor C in this paper is considered a balanced treatment of the speed and accuracy of convergence, which also ensures that the algorithm has some global search capability at the late merit search iterations. The intuitive algorithmic flow is shown in Figure 1.
The population distance D between population G and population F is calculated as follows:
D = P G g Ω G p o s sum P F f Q F p o s min E D P F g , P F f / N C H G
where Ω is the set of solutions for a population G or F with a non-dominated ranking of 1. G and F are solutions with non-dominated ranking of 1, respectively. N C H G is the number of populations with a non-dominance ranking of 1. ED is the Euclidean distance.
The algorithm results begin to stabilize if the distance between the populations of neighboring generations is less than the acceptable population distance. The INSGA-II algorithm is converged if it satisfies one of the following conditions:
1.
The population distances of neighboring generations are consecutively less than the threshold.
2.
The number of iterations reaches the maximum set value.
The INSGA-II algorithm is implemented as follows:
1.
Initial population and set the evolutionary generation Gen = 1;
2.
Generate the first generation sub-population by the Levy flight strategy and random wandering strategy and make the evolutionary generation Gen = 2;
3.
Combine the parent population with the offspring population to form a new population.
4.
Determine whether a new parent population has been generated; if not, calculate the objective function of individuals in the new population, and perform operations, such as fast non-dominated sorting, calculating crowding, and elite strategy, to generate a new parent population. Otherwise, go to step 5;
5.
Perform adaptive iteration operations on the generated parent population to generate the child population;
6.
Determine whether the termination condition is reached or whether Gen is equal to the maximum evolutionary generation; if neither is satisfied, the evolutionary generation Gen = Gen + 1 and return to step 3. Otherwise, run to the end.

4. Case Studies

For the purpose of evaluating the performance of the proposed INSGA-II algorithm, different two-objective ZDT and three-objective DTLZ test functions are used to verify the optimization capability and to make a comparison with other common multi-objective optimization algorithms.

4.1. Pareto Performance Evaluation Metrics

In contrast to single-objective optimization algorithms, it is not possible to evaluate the performance of multi-objective optimization results in terms of only one metric for each optimization algorithm. In this subsection, we choose two common evaluation metrics [15], which are the inverted generational distance as well as hypervolume, as a way to quantify the performance of the algorithms and to compare the performance of other different methods:
1.
Inverted generational distance
IGD [16] is an average minimum distance between the solution set obtained from the search for the best and the true solution set. The decrease in the value of IGD means that the algorithm converges more effectively and is more closely related to the real Pareto front. The mathematical expression is as follows:
I G D = x P * min dis ( x , P ) P *
in which P * is the ideal Pareto front, P is the collection of optimized solutions acquired from the algorithm, min d i s x , P is the minimum Euclidean distance between the solution x of true Pareto and the found Pareto solution P obtained by the algorithm, and | P * | is the number of solutions in the solution set P * .
2.
Hypervolume
The hypervolume [17] indicator refers to the volume of the area surrounded by the optimal set of solutions obtained by the algorithm and the selected reference points in the target space. With a larger value of HV, it means that the comprehensive performance of the algorithm is better. The mathematical expression is as follows:
HV ( X , P ) = x X X v ( x , P )
The HV metric allows assessing the convergence and diversity of the dominant solution set. In addition, the HV metric is obtained without real solution sets, so it can be widely used for engineering problems with unknown results in the real world.

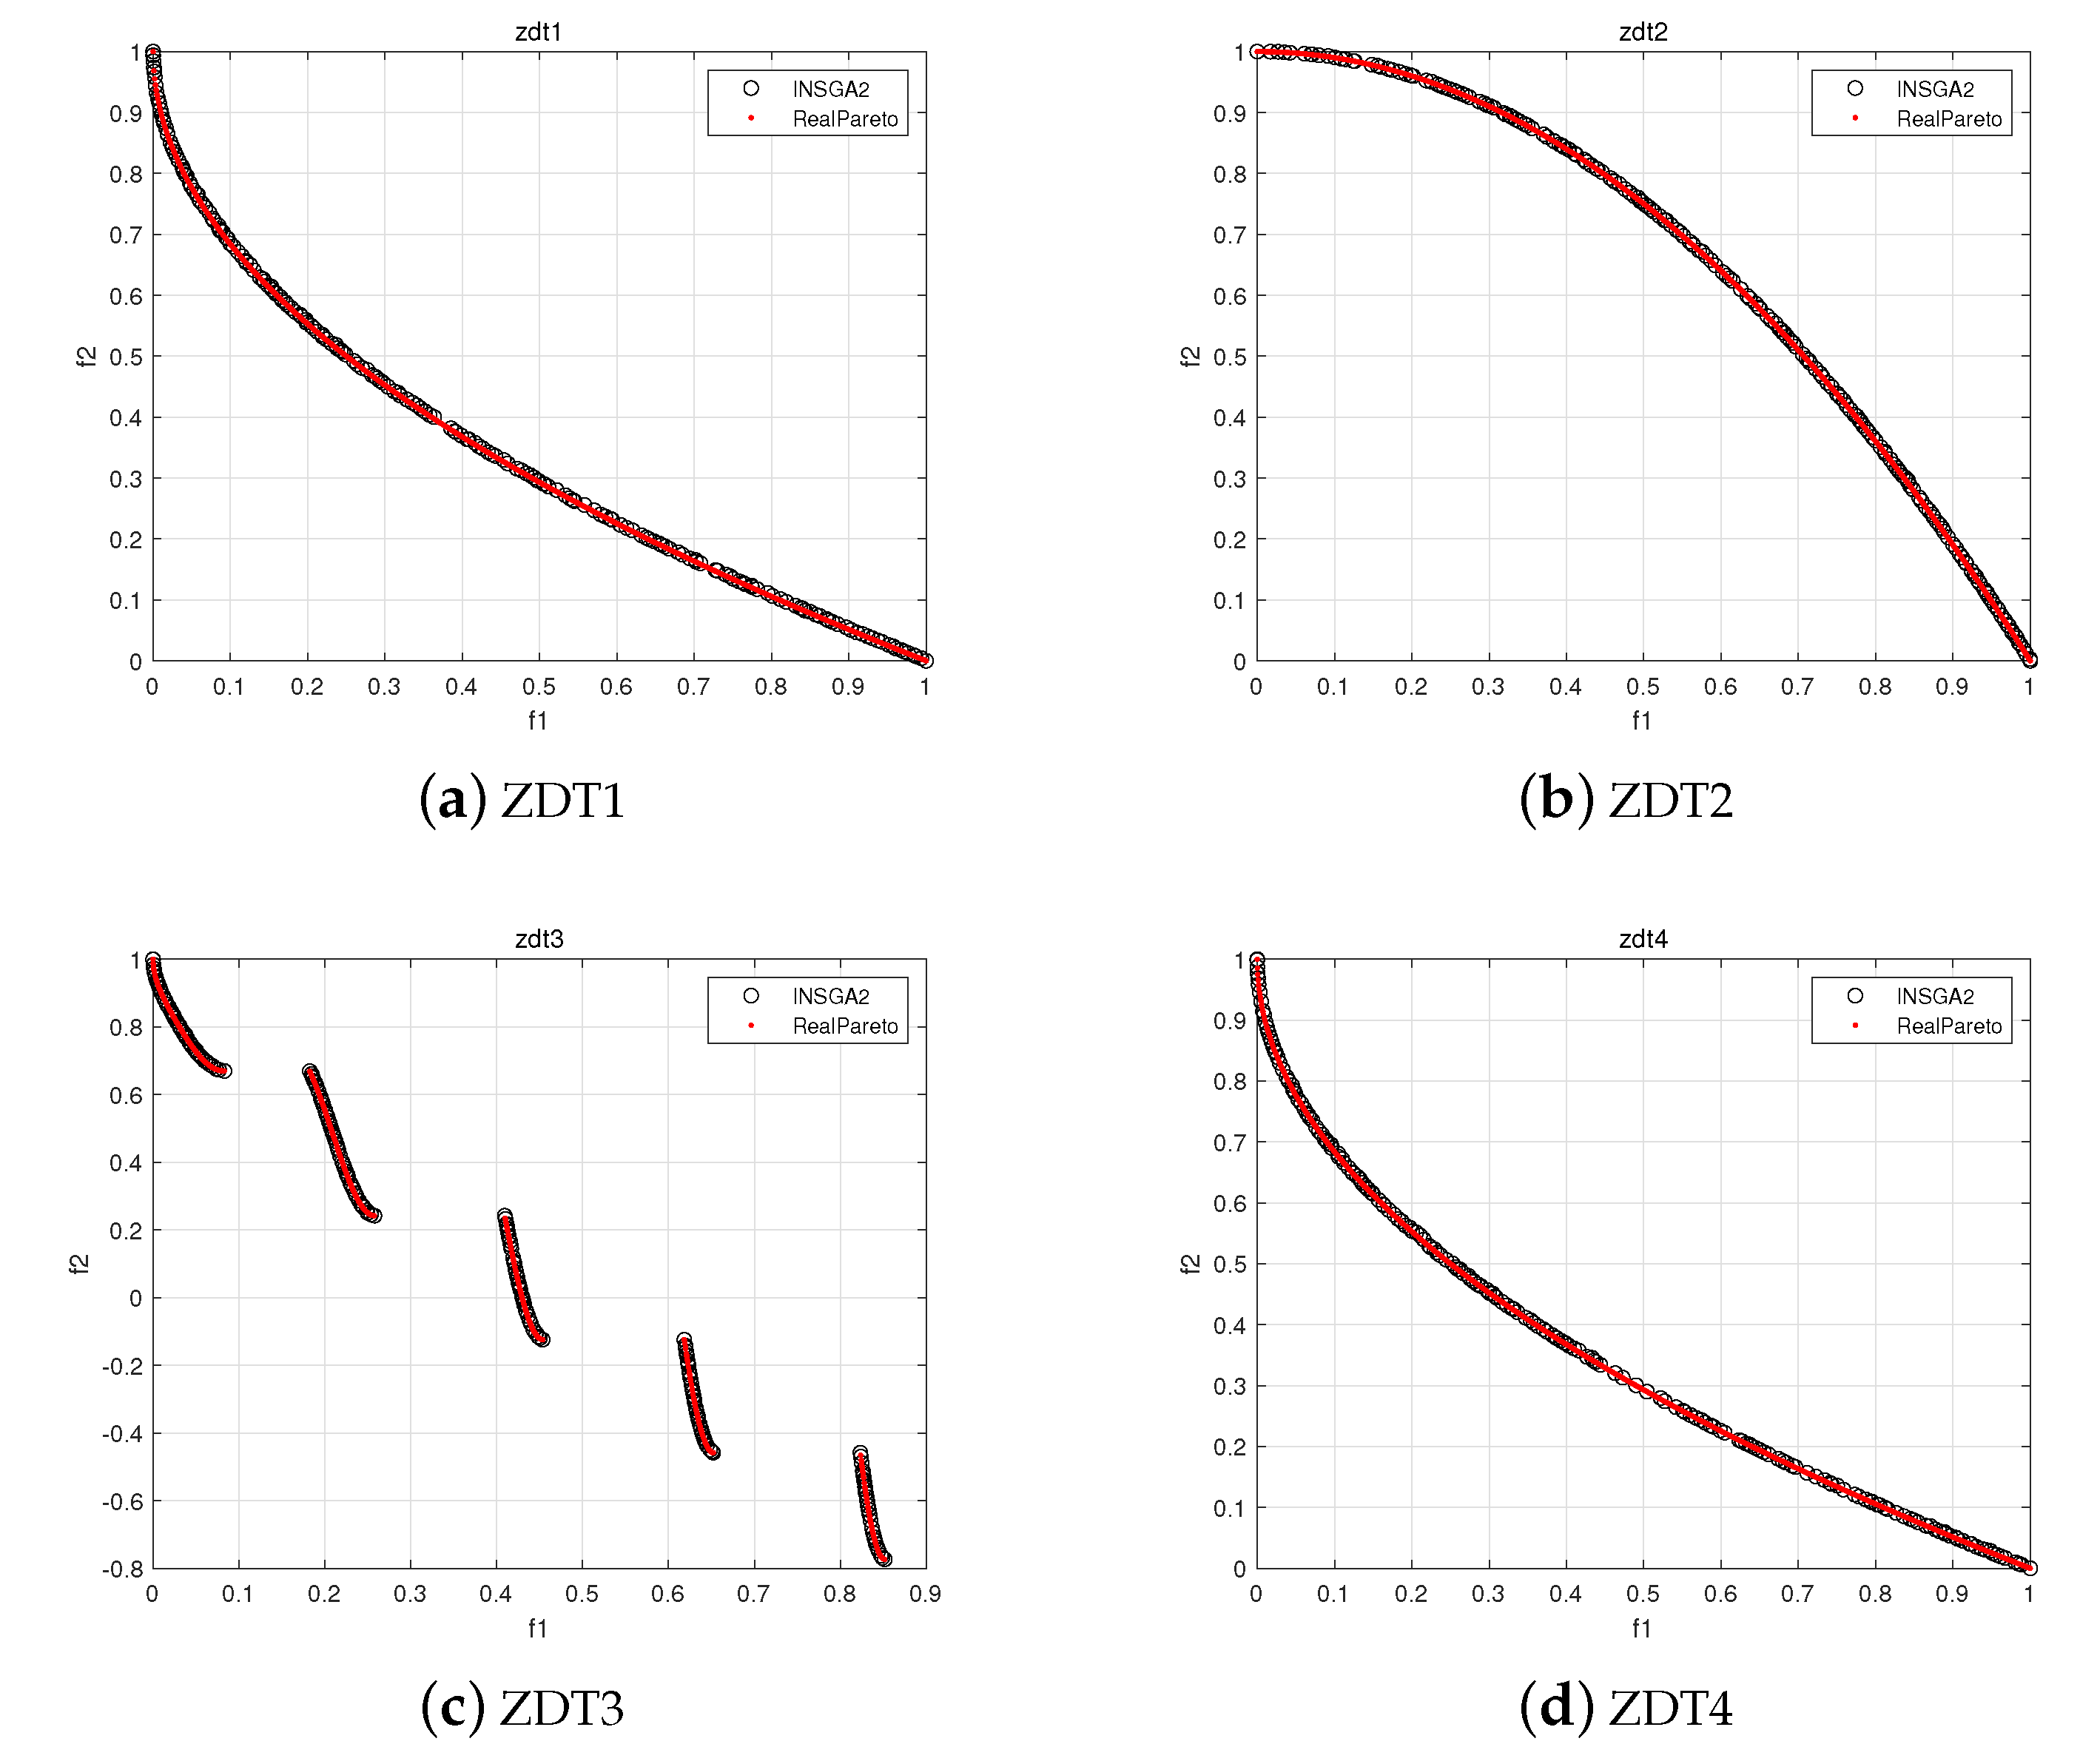
4.2. ZDT Test Functions

In order to prove the feasibility and validity of the improved NSGA-II algorithm proposed, the ZDT series of test functions [18] is selected to study the efficiency of the algorithm in solving multiple-objective optimization problems. These test functions are different, with different characteristics such as convex or concave, and their Pareto optimal frontier shapes are different, the specific descriptions and characteristics of the functions are shown in Table 1. Therefore, researchers often use these functions when conducting multi-objective optimization tests experiments. The simulation results are shown in Figure 2.
In this section, to demonstrate the capabilities of the improved NSGA-II, we perform experiments on the test functions with the original NSGA-II and other methods, such as MOEA/D [19], IBEA [20] and SPEA2 [21], as comparison algorithms.
The average values of the experimental algorithms for IGD and HV are presented in Table 2 and Table 3, respectively. (Each result is the average of the two metrics calculated for 10 independent runs of the same algorithm over the same problem.)
It is shown in Table 2 and Table 3 that the performance index of the INSGA-II algorithm is superior to four comparison algorithms on test functions. It is obvious from the above experiments that INSGA-II has better convergence accuracy and distribution performance.

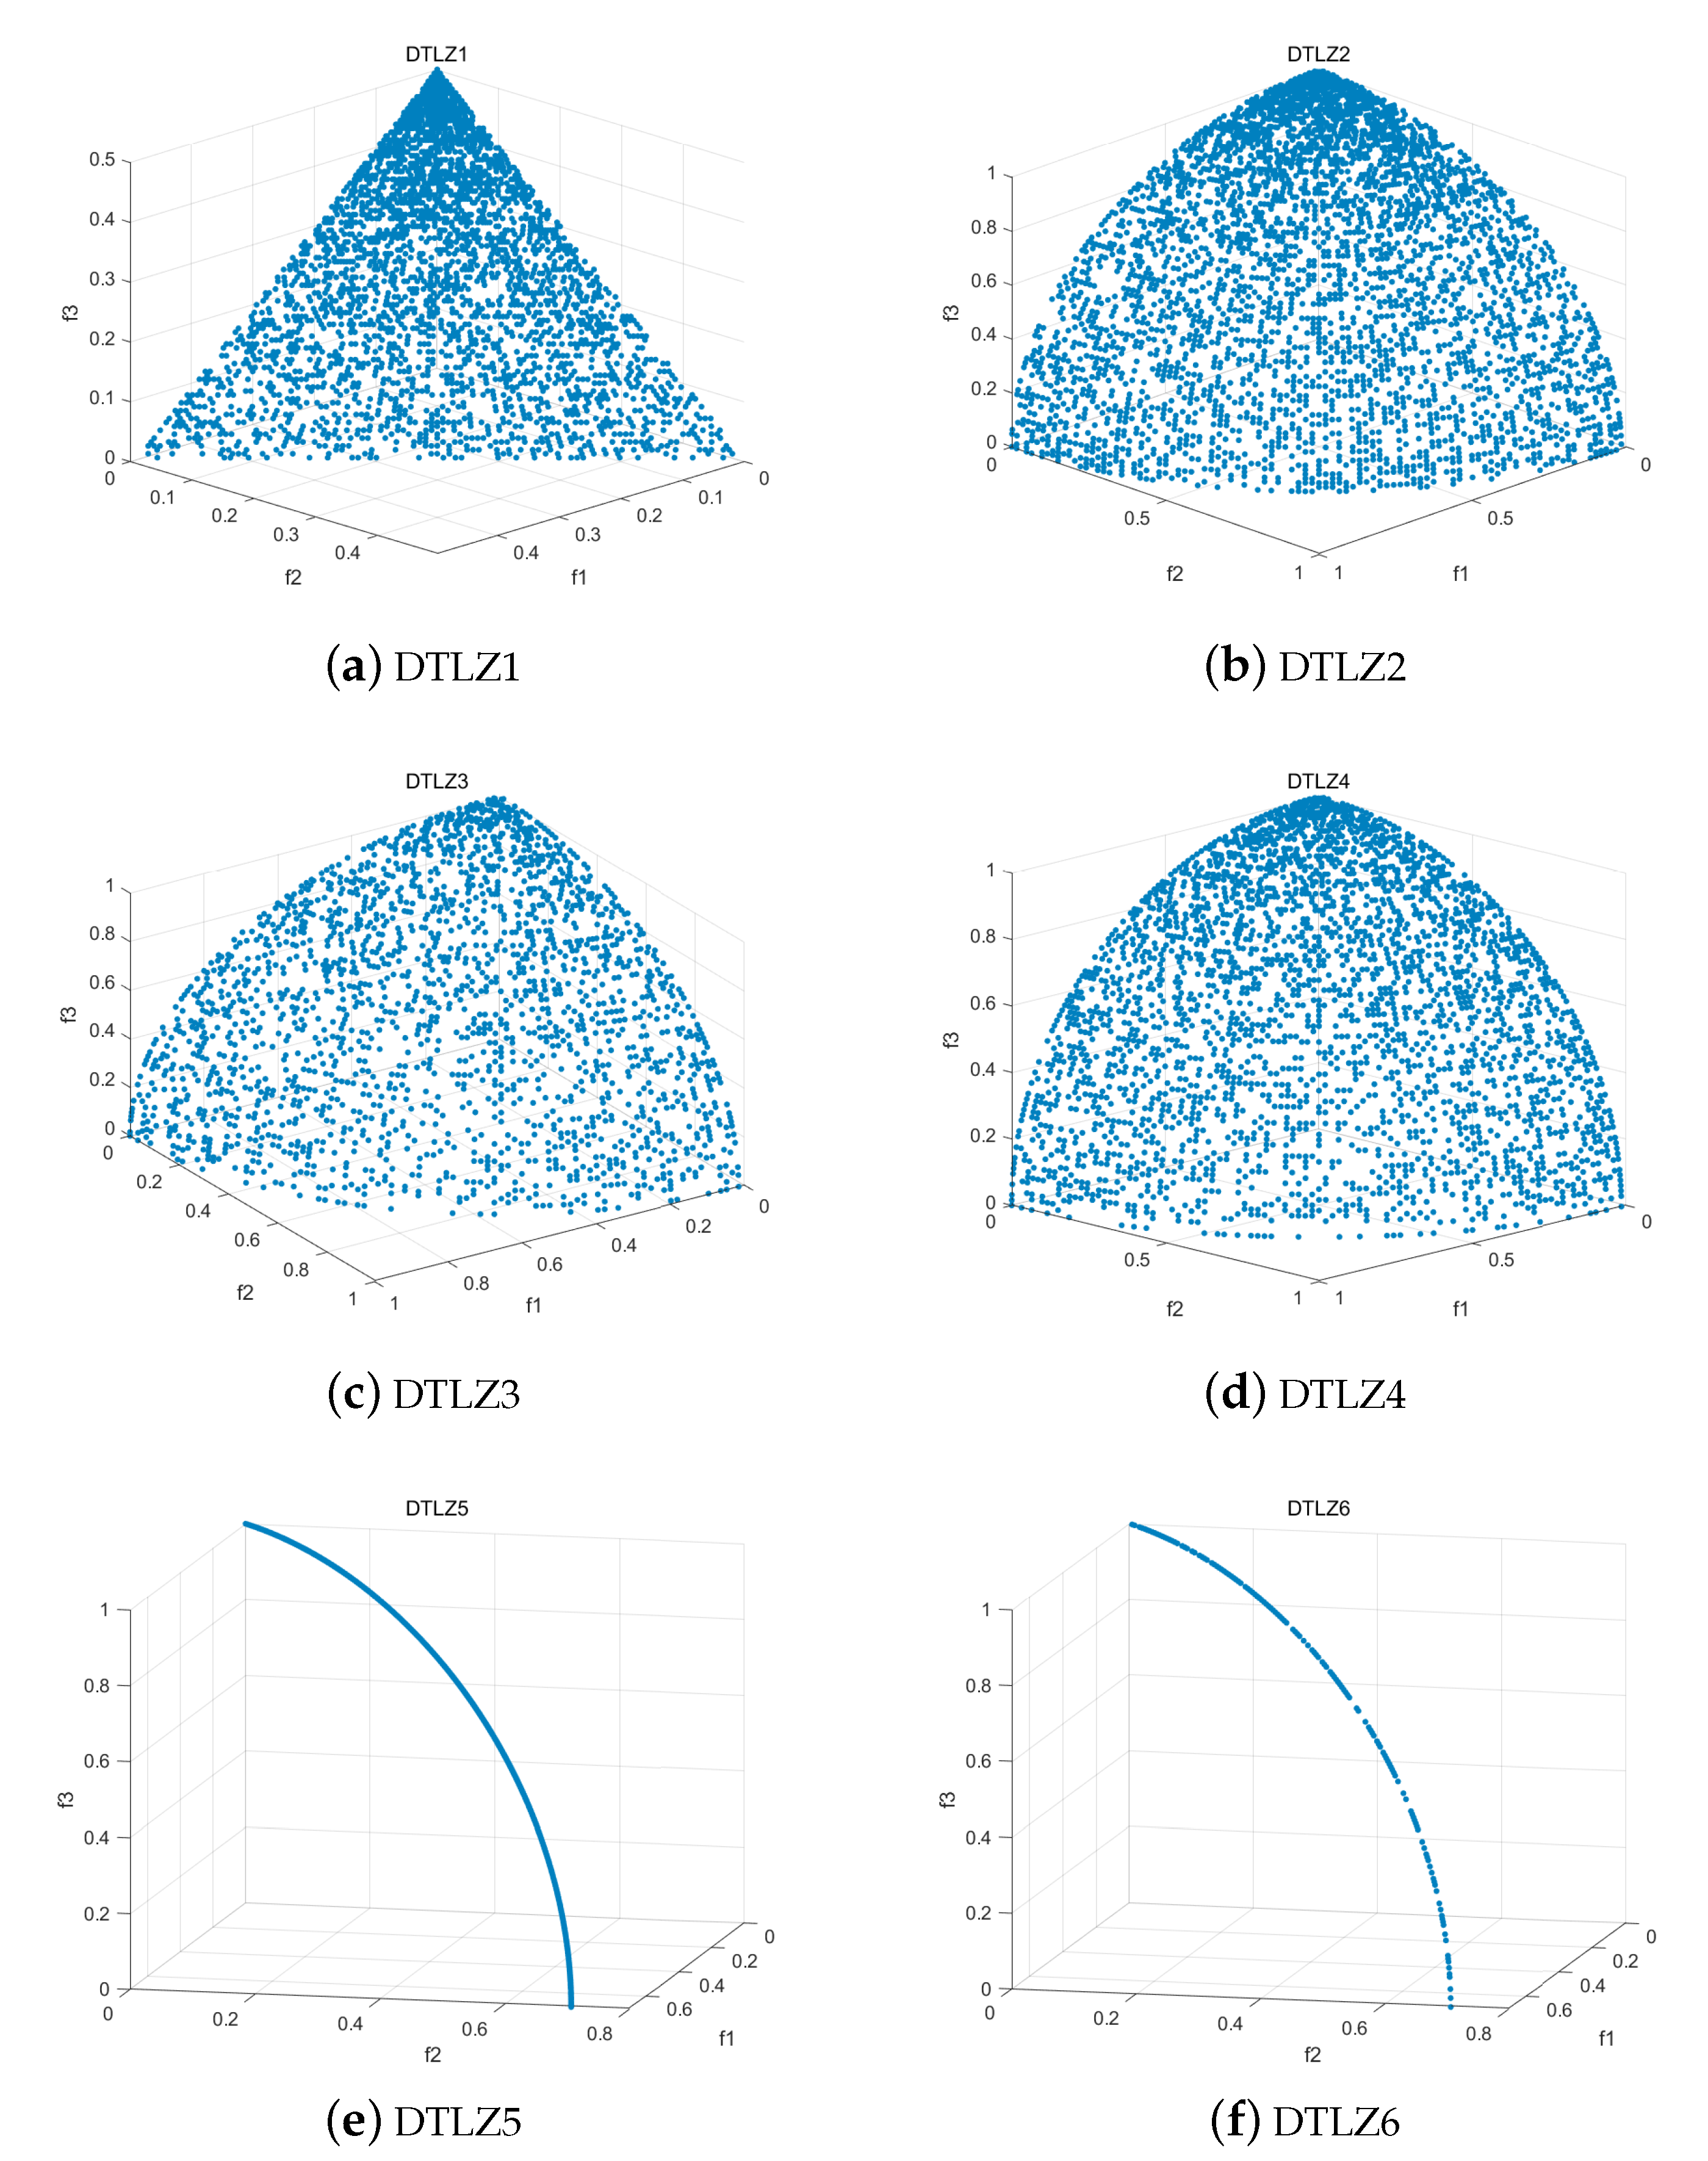
4.3. DTLZ Test Functions

In order to verify the feasibility of the algorithm proposed in this chapter in the high-dimensional multi-objective problem, the DTLZ standard test set function is selected for simulation experiments. The simulation results are shown in Figure 3 and the specific expressions are shown in Table 4.
To prove the capability of the improved NSGA-II, we conduct experiments on the test function with the original NSGA-II and other methods, such as MOEA/D [19], IBEA [20] and SPEA2 [21], as comparison algorithms.
The average values of the experimental algorithms for IGD are presented in Table 5, respectively. (Each result is the average of the two metrics calculated for 10 independent runs of the same algorithm over the same problem.)
It can be seen from Table 5, the performance index of the INSGA-II algorithm is better than those of the four compared algorithms in terms of test functions. From the above experiments, it can be seen that INSGA-II also has better convergence accuracy and distribution performance in high-dimensional multi-objective optimization problems.

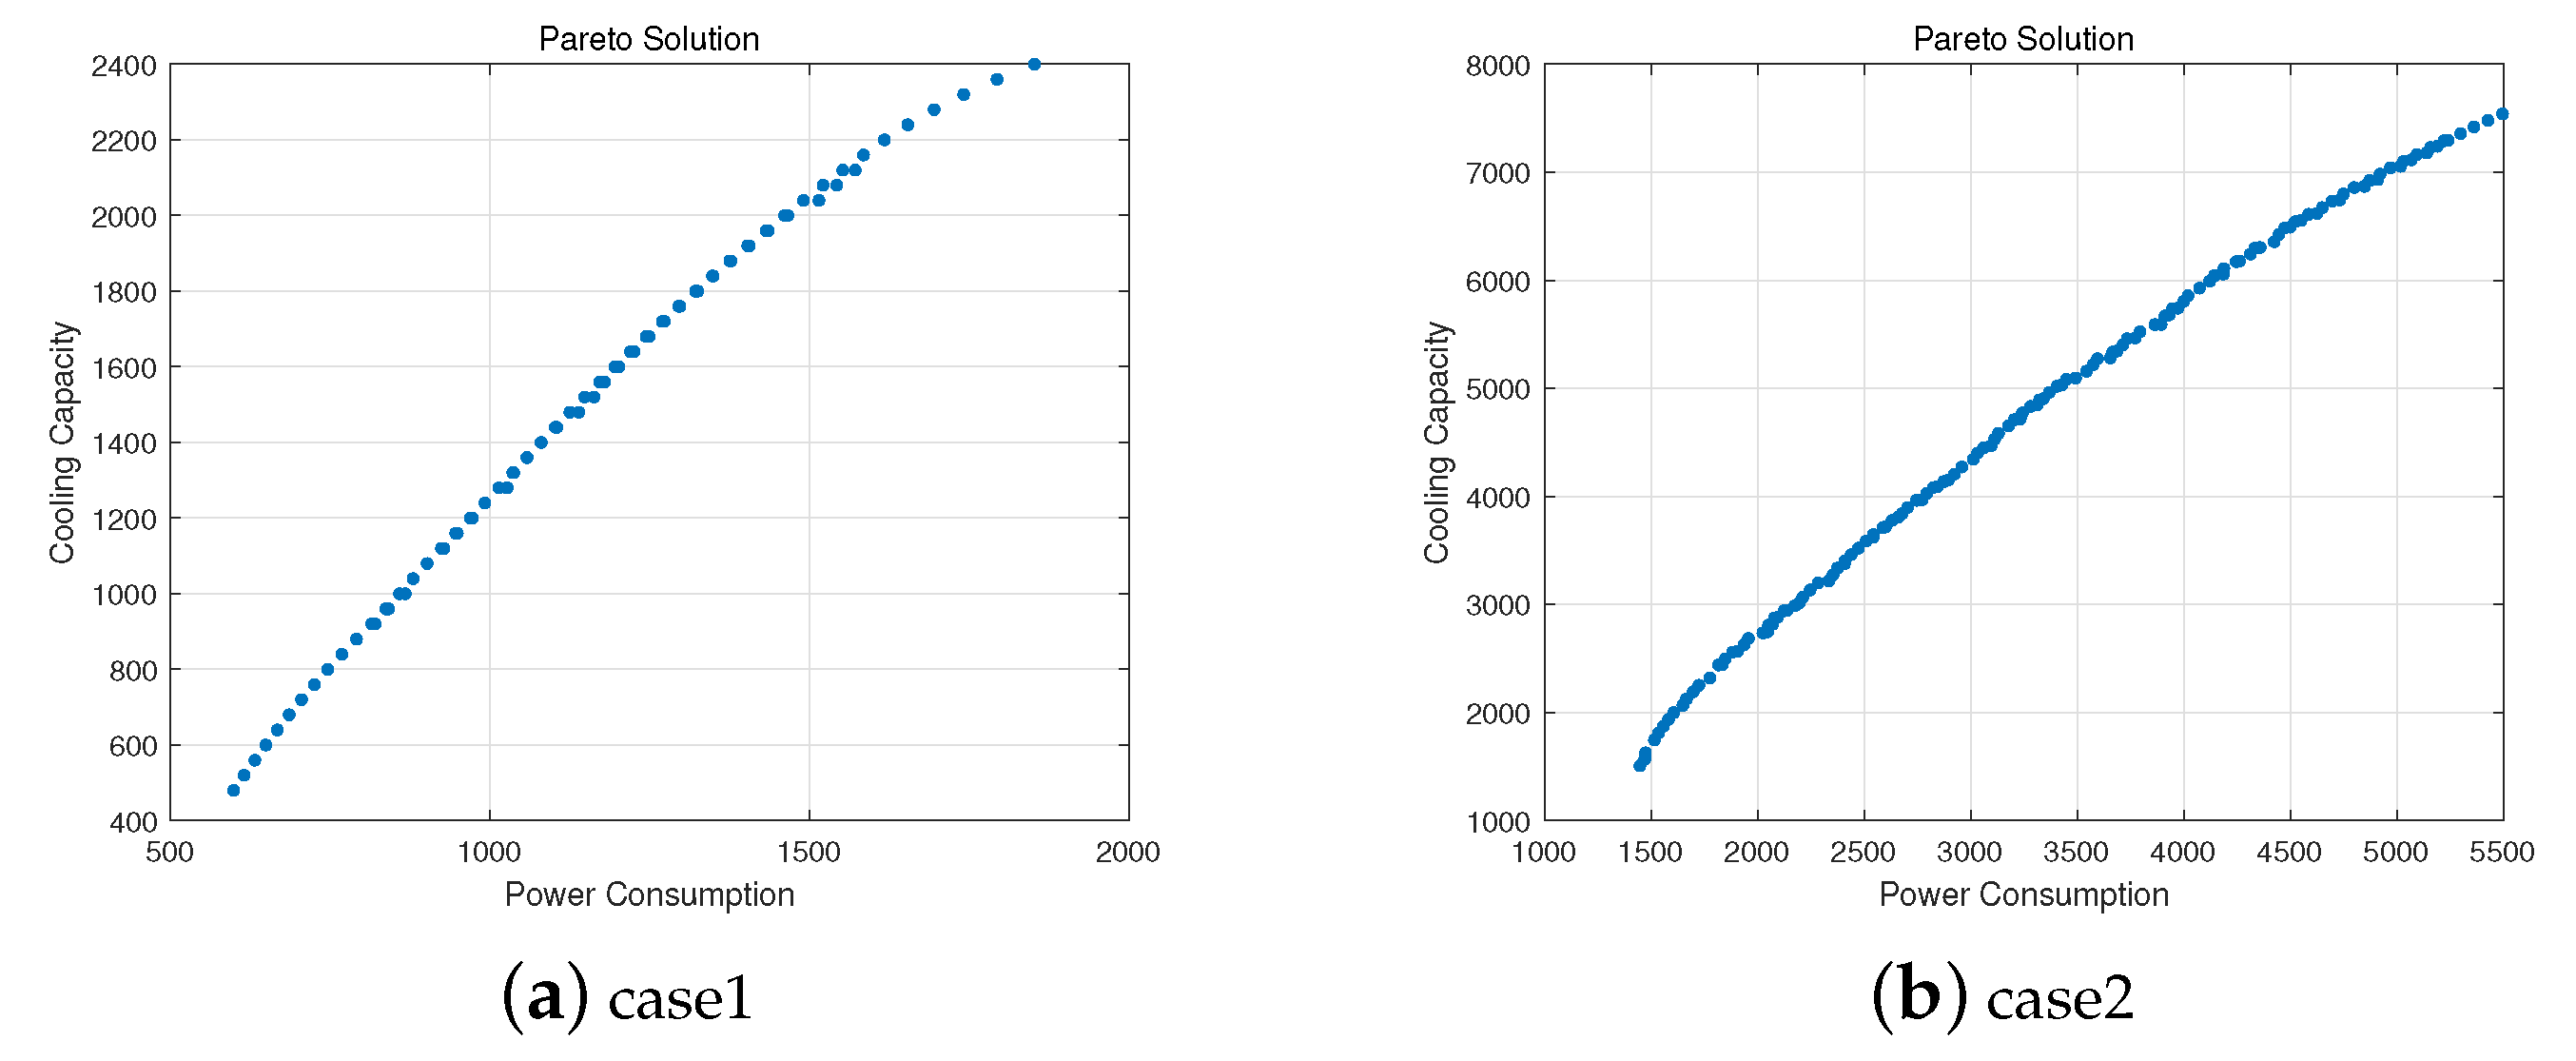
4.4. Parallel Chiller System

The proposed algorithm is applied to the chiller load distribution problem for the sake of verifying the effectiveness of the presented algorithm in practical project problems [22]. The cooling capacity required for the central air conditioning system is provided by the chilled water system, which includes chilled water pumps and a chiller system, as shown in Figure 4. Generally, the chiller system is operated jointly by multiple chillers with different refrigeration performance to manufacture chilled water, and the different refrigeration performance determines that the energy consumption of each chiller is also different. A multi-chiller system is composed of two or more chillers connected by parallel or tandem piping to a common distribution system. The chiller system can adjust its own load size so that each chiller operates at the optimal operating point.
The chiller can adjust its own load size to meet the basic end load demand so that the parallel chiller system can operate at optimal performance. In a refrigeration system, the system performs best when the total power of the chiller system is minimal and the end load demand is met. The problem of the load distribution of parallel chillers is to adjust the load distribution of the parallel chillers to achieve energy savings. At a certain wet bulb temperature, the electrical power of a concentric chiller can be presented as an optimized function of the partial load rate [23] as follows:
P i = a i + b i × P L R i + c i × P L R i 2 + d i × P L R i 3
where P i is the power of the i t h chiller, P L R i is the partial load rate of the i t h chiller, and a i , b i , and c i are the fitting coefficients of the energy consumption curve of the chiller.
An optimal distribution problem for parallel chillers is to achieve the lowest energy consumption and the highest cooling capacity. The abstraction of the actual project into a mathematical problem could be represented as the formula below:
min P = i = 1 n P i
max Q = i = 1 n P L R i × Q i
where P is the total power of multiple parallel chillers, and Q is the cooling capacity of the chiller.
A chiller system with three chillers of 800 RT cooling capacity was selected for testing in Case 1 so as to confirm that the improved NSGA-II algorithm could be implemented to tackle the load distribution issues. To further verify the algorithm in solving the load distribution problem of parallel chillers, a cooling system which consists of six chillers was selected in Case 2, including four same chillers with a cooling capacity 1280 RT and 2 other chillers of 1250 RT. The purpose was to test whether the improved NSGA-II algorithm can search for optimal values in different multi-chiller systems. Through these two classical test cases, we verified the feasibility of the INSGA-II algorithm for solving practical problems. In the two test cases, the performance parameters of the chillers are shown in Table 6.
We applied the proposed INSGA-II algorithm proposed in this paper to the parallel chiller’s cooling capacity distribution problem. The improved NSGA-II algorithm was compared with the original NSGA-II, and other methods such as MOEA/D, IBEA and SPEA2 algorithms; the simulation and optimization results are shown as follows.
In Figure 5, each point represents the optimal solution that satisfies both Equations (15) and (16).
In Table 7 and Table 8, the results of the INSGA-II algorithm are compared with the results of the NSGA-II, MOEA/D, IBEA and SPEA2 algorithms. Under the same load, the INSGA-II algorithm is more effective in saving energy, which shows the effectiveness of the INSGA-II algorithm in solving practical problems [24].

5. Conclusions

By analyzing the classical multi-objective evolutionary algorithm NSGA-II, it is found that the balance of convergence and diversity of the algorithm mainly depends on the strategy and method within the algorithm. We propose an improved NSGA-II algorithm which balances the global search ability of the algorithm in the preliminary period and the local exploitation ability in the later period by introducing adaptive parameters, and INSGA-II is able to improve the convergence speed and accuracy. At the same time, we adopt the Levy flight strategy to improve the global exploitation capability and a random walk strategy to improve the local search capability so that it can solve the problems of insufficient global search capability and the tendency to be trapped in a local optimum. To evaluate the performance of the INSGA-II algorithm proposed in this paper, it is compared with the algorithm before improvement and three other multi-objective evolutionary algorithms in the two-objective ZDT test set and three-objective DTLZ test set functions, as well as in practical engineering. The results show that the proposed algorithm has better convergence and diversity. In the future, we will analyze the complex Pareto front properties, design more efficient algorithms, and concentrate on the study of dynamic multi-objective optimization problems.

Author Contributions

Software, Writing—Original draft preparation, Visualization, J.H.; Conceptualization, Methodology, Writing—Original draft preparation, Investigation, Funding acquisition, X.Y.; Conceptualization, Supervision, Writing—Reviewing and Editing, C.W.; Data curation, Funding acquisition, Supervision, R.T.; Supervision, Writing—Reviewing and Editing, T.Z. All authors have read and agreed to the published version of the manuscript.

Funding

This work has been in part supported by the Beijing Natural Science Foundation, China under grant 4212040, the project from China Electronics Engineering Design Institute Co., Ltd. (No. SDIC2021-08).

Institutional Review Board Statement

Not applicable.

Informed Consent Statement

Not applicable.

Data Availability Statement

Data sharing not applicable.

Conflicts of Interest

The authors declare no conflict of interest.

References

  1. Coello, C.A.C.; Brambila, S.G.; Gamboa, J.F.; Tapia, M.G.C. Multi-Objective Evolutionary Algorithms: Past, Present, and Future. In Black Box Optimization, Machine Learning, and No-Free Lunch Theorems; Pardalos, P.M., Rasskazova, V., Vrahatis, M.N., Eds.; Springer International Publishing: Cham, Switzerland, 2021; pp. 137–162. [Google Scholar]
  2. Zhong, K.; Zhou, G.; Deng, W.; Zhou, Y.; Luo, Q. MOMPA: Multi-objective marine predator algorithm. Comput. Methods Appl. Mech. Eng. 2021, 385, 114029. [Google Scholar] [CrossRef]
  3. Vikhar, P. Evolutionary algorithms: A critical review and its future prospects. In Proceedings of the 2016 International Conference on Global Trends in Signal Processing, Information Computing and Communication (ICGTSPICC), Jalgaon, India, 22–24 December 2016; pp. 261–265. [Google Scholar]
  4. Nedjah, N.; Mourelle, L. Evolutionary multi-objective optimisation: A survey. Int. J.-Bio-Inspired Comput. 2015, 7, 1–25. [Google Scholar] [CrossRef]
  5. Deb, K.; Pratap, A.; Agarwal, S.; Meyarivan, T. A fast and elitist multiobjective genetic algorithm: NSGA-II. IEEE Trans. Evol. Comput. 2002, 6, 182–197. [Google Scholar] [CrossRef] [Green Version]
  6. Tian, Y.; Cheng, R.; Zhang, X.; Su, Y.; Jin, Y. A Strengthened Dominance Relation Considering Convergence and Diversity for Evolutionary Many-Objective Optimization. IEEE Trans. Evol. Comput. 2019, 23, 331–345. [Google Scholar] [CrossRef] [Green Version]
  7. Coello, C. Multi-Objective Evolutionary Algorithms in Real-World Applications: Some Recent Results and Current Challenges; Springer: Cham, Switzerland, 2015; pp. 3–18. [Google Scholar]
  8. Emmerich, M.; Deutz, A. A tutorial on multiobjective optimization: Fundamentals and evolutionary methods. Nat. Comput. 2018, 17, 585–609. [Google Scholar] [CrossRef] [PubMed] [Green Version]
  9. Zitzler, E.; Thiele, L. Multiobjective evolutionary algorithms: A comparative case study and the strength Pareto approach. IEEE Trans. Evol. Comput. 1999, 3, 257–271. [Google Scholar] [CrossRef] [Green Version]
  10. Srinivas, N.; Deb, K. Multiobjective Optimization Using Nondominated Sorting in Genetic Algorithms. Evol. Comput. 1994, 2, 221–248. [Google Scholar] [CrossRef]
  11. Kukkonen, S.; Deb, K. Improved Pruning of Non-Dominated Solutions Based on Crowding Distance for Bi-Objective Optimization Problems. In Proceedings of the 2006 IEEE International Conference on Evolutionary Computation, Vancouver, BC, Canada, 16–21 July 2006; pp. 1179–1186. [Google Scholar]
  12. Viswanathan, G.; Afanasyev, V.; Buldyrev, S.V.; Havlin, S.; da Luz, M.; Raposo, E.; Stanley, H. Lévy flights search patterns of biological organisms. Phys. A Stat. Mech. Its Appl. 2001, 295, 85–88. [Google Scholar] [CrossRef]
  13. Elarbi, M.; Bechikh, S.; Gupta, A.; Ben Said, L.; Ong, Y.S. A New Decomposition-Based NSGA-II for Many-Objective Optimization. IEEE Trans. Syst. Man Cybern. Syst. 2018, 48, 1191–1210. [Google Scholar] [CrossRef]
  14. Li, R.; Gong, W.; Lu, C. Self-adaptive multi-objective evolutionary algorithm for flexible job shop scheduling with fuzzy processing time. Comput. Ind. Eng. 2022, 168, 108099. [Google Scholar] [CrossRef]
  15. Rodríguez Villalobos, C.A.; Coello Coello, C.A. A New Multi-Objective Evolutionary Algorithm Based on a Performance Assessment Indicator. In Proceedings of the 14th Annual Conference on Genetic and Evolutionary Computation, Philadelphia, PA, USA, 7–11 July 2012; Association for Computing Machinery: New York, NY, USA, 2012; GECCO ’12, pp. 505–512. [Google Scholar]
  16. Sun, Y.; Yen, G.G.; Zhang, Y. IGD Indicator-Based Evolutionary Algorithm for Many-Objective Optimization Problems. IEEE Trans. Evol. Comput. 2018, 23, 173–187. [Google Scholar] [CrossRef] [Green Version]
  17. Ishibuchi, H.; Imada, R.; Yu, S.; Nojima, Y. How to Specify a Reference Point in Hypervolume Calculation for Fair Performance Comparison. Evol. Comput. 2018, 26, 1–29. [Google Scholar] [CrossRef] [PubMed]
  18. Deb, K.; Sinha, A.; Kukkonen, S. Multi-objective test problems, linkages, and evolutionary methodologies. In Proceedings of the 8th Annual Conference on Genetic and Evolutionary Computation, Seattle, WD, USA, 8–12 July 2006; Volume 2, pp. 1141–1148. [Google Scholar]
  19. Zhang, Q.; Hui, L. MOEA/D: A Multiobjective Evolutionary Algorithm Based on Decomposition. IEEE Trans. Evol. Comput. 2008, 11, 712–731. [Google Scholar] [CrossRef]
  20. Zitzler, E.; Künzli, S. Indicator-Based Selection in Multiobjective Search. In Proceedings of the 8th International Conference on Parallel Problem Solving from Nature, Birmingham, UK, 18–22 September 2004. [Google Scholar]
  21. Zitzler, E.; Laumanns, M.; Thiele, L. SPEA2: Improving the Strength Pareto Evolutionary Algorithm. In Proceedings of the EUROGEN Conference, Lake Como, Italy, 15 April 2001; pp. 95–100. [Google Scholar]
  22. Datta, R.; Pradhan, S.; Bhattacharya, B. Analysis and Design Optimization of a Robotic Gripper Using Multiobjective Genetic Algorithm. IEEE Trans. Syst. Man Cybern. Syst. 2016, 46, 16–26. [Google Scholar] [CrossRef]
  23. Chang, Y.C. Genetic algorithm based optimal chiller loading for energy conservation. Appl. Therm. Eng. 2005, 25, 2800–2815. [Google Scholar] [CrossRef]
  24. Tamayo-Rivera, L.; Hirata-Flores, F.I.; Ndez, J.A.R.H.; Rangel-Rojo, R. Survey of multi-objective optimization methods for engineering, structural multidisciplinary optimization. Struct. Multidiscip. Optim. 2018, 26, 369–395. [Google Scholar]
Figure 1. INSGA-II algorithm flowchart.
Applsci 12 11573 g001
Figure 2. Solutions with INSGA-II on ZDT test function.
Applsci 12 11573 g002
Figure 3. Solutions with INSGA-II on DTLZ test function.
Applsci 12 11573 g003
Figure 4. Chiller system diagram.
Applsci 12 11573 g004
Figure 5. Solutions with INSGA-II on parallel chiller’s cooling capacity distribution problem.
Applsci 12 11573 g005
Table 1. ZDT test functions and characteristics.
Function Name           Mathematical FormulaFunction Characteristic
ZDT1 f 1 ( x ) = x 1
f 2 ( x ) = g ( x ) 1 f 1 ( x ) / g ( x )
where g ( x ) = 1 + 9 · i = 2 n x i / ( n 1 )
0 x i 1 , i = 1 , 2 , L n
Convex, continuous
ZDT2 f 1 ( x ) = x 1
f 2 ( x ) = g ( x ) 1 f 1 ( x ) / g ( x ) 2
where g ( x ) = 1 + 9 · i = 2 n x i / ( n 1 )
0 x i 1 , i = 1 , 2 , L n
Concave, continuous
ZDT3 f 1 ( x ) = x 1
f 2 ( x ) = g ( x ) 1 f 1 ( x ) / g ( x ) f 1 ( x ) / g ( x ) sin 10 π x 1              
where g ( x ) = 1 + 9 · i = 2 n x i / ( n 1 )
0 x i 1 , i = 1 , 2 , L n
Concave, discontinuous
ZDT4 f 1 ( x ) = x 1
f 2 ( x ) = g ( x ) 1 f 1 ( x ) / g ( x )
where g ( x ) = 1 + 10 · ( n 1 ) + i = 2 n x i 2 10 cos 4 π x i
0 x 1 1 , 5 x i 5 , i = 2 , L n
Convex, multi-modal
Table 2. IGD metric results for ZDT function.
Test Function ComparisonAlgorithm
NSGA-IIMOEA/DIBEASPEA2INSGA-II
ZDT10.00520.02710.00410.00420.0015
ZDT20.00270.01320.00250.00320.0016
ZDT30.01430.04710.00830.00910.0032
ZDT40.00720.01470.00650.00620.0023
Table 3. HV metric results for DTLZ function.
Test Function ComparisonAlgorithm
NSGA-IIMOEA/DIBEASPEA2INSGA-II
ZDT10.71240.69510.71990.71910.9115
ZDT20.60740.58650.61750.63270.8592
ZDT30.73310.57530.74860.73620.9269
ZDT40.70830.66080.71680.72400.8866
Table 4. DTLZ Test functions and characteristics.
Function NameMathematical Formula
DTLZ1 min f 1 ( x ) = 1 2 x 1 x 2 x M 1 1 + g x M min f 2 ( x ) = 1 2 x 1 x 2 1 x M 1 1 + g x M min f M 1 ( x ) = 1 2 x 1 1 x 2 1 + g x M min f M ( x ) = 1 2 1 x 1 1 + g x M g x M = 100 x M + x i x M x i 0.5 2 cos 20 π x i 0.5
DTLZ2 min f 1 ( x ) = 1 + g x M cos x 1 π / 2 cos x M 2 π / 2 cos x M 1 π / 2 min f 2 ( x ) = 1 + g x M cos x 1 π / 2 cos x M 2 π / 2 sin x M 1 π / 2 min f M 1 ( x ) = 1 + g x M cos x 1 π / 2 sin x 2 π / 2 min f M ( x ) = 1 + g x M sin x 1 π / 2 g x M = x 1 x M x i 0.5 2
DTLZ3 min f 1 ( x ) = 1 + g x M cos x 1 π / 2 cos x M 2 π / 2 cos x M 1 π / 2 min f 2 ( x ) = 1 + g x M cos x 1 π / 2 cos x M 2 π / 2 sin x M 1 π / 2 min f M 1 ( x ) = 1 + g x M cos x 1 π / 2 sin x 2 π / 2 min f M ( x ) = 1 + g x M sin x 1 π / 2 g x M = 100 x M + x x x M x i 0.5 2 cos 20 π x i 0.5
DTLZ4 min f 1 ( x ) = 1 + g x M cos x 1 α π / 2 cos x M 2 α π / 2 cos x M 1 α π / 2 min f 2 ( x ) = 1 + g x M cos x 1 α π / 2 cos x M 2 α π / 2 sin x M 1 α π / 2 min f M 1 ( x ) = 1 + g x M cos x 1 α π / 2 sin x 2 α π / 2 min f M ( x ) = 1 + g x M sin x 1 α π / 2 g x M = x i x M x i 0.5 2
DTLZ5 min f 1 ( x ) = 1 + g x M cos θ 1 π / 2 cos θ M 2 π / 2 cos θ M 1 π / 2 min f 2 ( x ) = 1 + g x M cos θ 1 π / 2 cos θ M 2 π / 2 sin θ M 1 π / 2 min f M 1 ( x ) = 1 + g x M cos θ 1 π / 2 sin θ 2 π / 2 min f M ( x ) = 1 + g x M sin θ 1 π / 2 g x M = x 1 x M x i 0.1 θ i = π 4 1 + g x M 1 + 2 g x M x i
DTLZ6 min f 1 x 1 = x 1 min f M 1 x M 1 = x M 1 min f M ( x ) = 1 + g x M h f 1 , f 2 , , f M 1 , g g x M = 1 + 9 x M x i x M x i h = M i = 1 M 1 f i 1 + g 1 + sin 3 π f i
Table 5. IGD metric results for DTLZ function.
Test Function ComparisonAlgorithm
NSGA-IIMOEA/DIBEASPEA2INSGA-II
DTLZ10.1310.2360.0970.0890.085
DTLZ20.3770.5760.2840.2620.205
DTLZ31.7412.4641.0741.1910.807
DTLZ40.5610.8960.3200.3340.231
DTLZ50.1420.2640.0920.0890.053
DTLZ60.2780.5290.1080.0950.052
Table 6. Chiller parameters for test cases.
Test CaseChiller a i b i c i d i Capacity
Case 11100.95818.61−973.43788.55800
266.598606.34−380.58275.95800
3130.09304.5814.37799.80800
Case 21399.345−122.12770.46-1200
2287.11680.04700.48-1280
3−120.5051525.99−502.14-1280
4−19.121898.76−98.15-1280
5−95.0291202.39−352.16-1250
6191.750224.86524.04-1250
Table 7. Comparison of the optimization results of different algorithms in Case 1.
Load RequirementsNSGA-IIMOEA/DIBEASPEA2INSGA-II
21601589.41591.21574.91575.31565.3
19201419.41421.11413.41412.41406.5
16801250.61251.31247.91244.51242.5
14401007.41017.2998.3997.1994.9
1200923.1945.8862.2854.6842.7
960742.8781.4715.3712.0697.8
Table 8. Comparison of the optimization results of different algorithms in Case 2.
Load RequirementsNSGA-IIMOEA/DIBEASPEA2INSGA-II
68504768.34819.54758.04754.64743.4
64704449.64453.44432.94431.14423.3
60904185.84189.94161.64152.44142.7
57103940.73951.03922.43918.23904.6
53303656.23682.53641.43638.33626.2
Publisher’s Note: MDPI stays neutral with regard to jurisdictional claims in published maps and institutional affiliations.

