1. Introduction
The emerging integration of IoT and WSNs in various application domains has financial and societal benefits, but when these services are misused or impersonated by malicious entities, they may result in severe threats [
1]. These threats may increase from the individual to the community level depending on the capacity of the malicious entity. The extensive use of WSNs and IoT in all domains of life has great risks, such as susceptibility to different security attacks [
2]. Network availability, anonymity, confidentiality, access control, and integrity are critical in these vulnerable infrastructures, especially in networks of mobile devices. Data distribution and acquisition in WSNs and IoT is vulnerable to various problems such as mobility, snooping, espionage, and link breakage [
3]. The mobile and broadcasting nature of WSNs, along with the resource-constrained infrastructure, makes these networks susceptible to miscellaneous denial of service (DoS) attacks [
4,
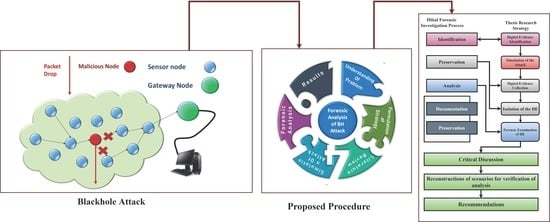
5]. This research work focuses on the blackhole attack (BH), which is a detrimental type of DoS attack. In the BH attack, a malicious node proclaims a latest and shortest route to the destination in the route-discovery phase of a source node (SN), and then the SN enters the trap and sends all data via malicious node. Consequently, the malicious node drops data packets of SN. The packet dropping behavior can encompass multiple attacker and target nodes, which may lead to an extensive DDoS attack [
6]. The forensic analysis of the BH attack in static and mobile WSNs and IoT by comparing diverse parameters is conducted in this work.
The precursory literature indicates various state-of-the-art attack mitigation schemes, but since security is never ultimate, and perfect security is just an illusion; it is imperative to investigate what, when, how, and why a particular security incident happened or is happening, and what damage it costs. The vulnerabilities and loopholes in the system need to be examined and revealed. Furthermore, damage to the system due to the incident(s) needs to be measured, and countermeasures need to be developed from the outcomes of forensic investigations.
Digital forensics (DF) for WSN and IoT is difficult due to the proliferation of devices, heterogeneity, immense network traffic, and lack of transparency in digital evidence (DE) processing. Even though IoT data might be a valuable trace of DE, the DF investigators deal with disparate challenges, from the massive range of IoT devices and improper formats to the multi-tenant cloud organization and the subsequent multi-jurisdictional requirements [
7]. Moreover, the identification, capture, discovery, and analysis of network traffic encompassing IoT infrastructure is challenging compared to traditional networks. High-speed data transmission, data extraction locations, IP addresses access, privacy, integrity, data storage on network devices, and intelligent forensic tools are key challenges in traffic analysis in IoT and WSN. Another challenge is end-to-end encryption, which means a compromise between privacy and the achievement of the DF investigation [
8,
9]. Furthermore, as many IoT nodes are accumulating and processing sensitive data, they turn into a treasure of data for malevolent entities. Thus, security and particularly the capability to identify compromised nodes, together with compiling and preserving the DE of attacks, urhently arise in the effective implementation of IoT networks [
10]. Post-mortem analysis of the attack can expose the status of the network at specific times and eventually provide traces about the nature of the attack and the identities of the malicious nodes.
The AODV routing protocol is chosen for this study because it is one of the most notable protocols that is broadly accepted and extensively used in wireless mesh networks (WMN) due to its low setup delay, large-scale implementation, loop-free setup, flatness, efficiency in a dynamic environment, and flexibility. AODV is one of the four prime routing protocols that are standardized by the Internet Engineering Task Force (IETF) MANET working group. AODV serves as the foundation for devising new routing protocols in the wireless networks domain [
11,
12,
13]. We analyze the performance of AODV in mobile WSN and IoT under the BH attack. Further, a detailed forensic analysis of the basis of diverse parameters and aspects is performed. The main contributions of this research work are given below.
The BH attack in WSNs and IoT with the AODV routing protocol is investigated in a rigorous and generic manner.
A vulnerability analysis of the AODV protocol is performed, and a forensic analysis for static as well as mobile WSN and IoT for ad hoc and traditional modes under the BH attack is carried out. The traffic patterns in the network and on the nodes are examined with the assistance of various analytical tools to assess the attack damage.
An analogy between the DF investigation of a real-life WSN/IoT and a simulated environment is devised at the device, network, and cloud levels to correlate the procedures and tools on both sides.
The networks under mobile and static mode with variation in the number of total nodes and BH nodes are reconstructed to verify the observations of forensic analysis. Further, a damage analysis on the basis of strategical positioning and cooperation of the BH nodes is conducted.
Suggestions powered by this study are provided to design routing protocols that will be amenable to DF investigations.
This paper is structured as follows:
Section 2 describes the related work. The proposed methodology for forensic analysis, artifact collection framework, and an analogy between simulated and real-time DF investigations are presented in
Section 3 followed by
Section 4, which discusses the simulation environment and results. Finally,
Section 5 concludes this work.
2. Literature Review
The BH is an active attack among the tremendously harmful possible attacks in WSN and IoT. An antagonist entity claims the shortest path to the destination via a route reply (RREP) packet to the source node, even if it does not have any route to the destination. The sender transmits all the data packets to this entity, and consequently, it drops the data packets instead of forwarding them to the destination [
14], distressing the collective throughput and energy of the nodes. The malicious entity is called a “Blackhole Node” due to the packet-absorbing behavior.
The packet-dropping behavior can be absolute or selective and can also produce a gateway to other catastrophic attacks. In absolute packet dropping, the BH node drops all of the packets, all the time, and for all the nodes. In this case, the network nodes may sense abnormality, and alternative routes may be chosen. However, the selective BH attack is very difficult to detect because the BH node may drop the packets at a selective time period or for specific nodes. Moreover, there are two categories of BH attacks, depending on the number of malicious nodes and single and cooperative BH attacks. If a single node is involved in dropping packets, then it is called a single BH attack, and if multiple nodes are involved, then it is called a cooperative BH attack [
6,
15].
The insecurity of WSN and IoT can be classified into the insecurity of nodes, routers, and data traffic. The resource-constrained environment, computational capacity, and limited transmission range make it problematic to operate an entire network steadily at a time [
6,
9,
16].The attackers usually benefit from the hop-to-hop dependency of WSN and inoculate malicious nodes in the routes [
17]. Now, the research efforts devoted to mitigating the BH attacks, the vulnerabilities of WSN and IoT, DF complications, and forensics investigations studies carried out in this domain will be discussed.
An approach [
15] functioning by distributing the network into several little zones of the same size, and allocating a unique ID to each zone is suggested to detect the BH attack. The nodes know their particular locations and affiliation by a localization algorithm and broadcast their energy level in the network and to the base station (BS). The highest-energy node is chosen as the cluster head (CH). Some mobile agents support the system by monitoring the network, and if they sense any abnormality, then they mark that specific node as a BH node and trigger a message to the CH and BS. In [
18] a control packet (CP), comprehensive extended data routing information (EDRI) is proposed to mitigate the BH attack. The EDRI table includes the parameters of nodes. The information such as neighbor ID, FROM (source), TO (destination), and BH node is included. Binary digits specify the honesty of the node. The CP has the IDs of the source node, neighbors, and a persistent random number (RN) security value. The CP cannot be transmitted by an adverse node, so it works for detecting a single BH attack. The methodology for community attacks is powered by the next hop number (NHN), CP, and a random number generator (RNG). It operates in three phases: discovery of the routes, scrutiny of the route, and elimination of the cooperative BH nodes.
A Cluster Reputation-based Cooperative Malicious Node Detection and Removal (CRCMD&R) scheme extending the AODV protocol with additional features [
19] discovers an adverse node in the route setup phase. Therefore, the information will not be transmitted through the neighbor’s nodes and malicious routes. The CH reserves three tables named legitimacy value (LV) table, neighbor’s table, and reputation value (RV) table to compute the trust values of the routes. In another anticipated system [
20], a malicious node is inserted into the network to manipulate the determined traffic by promoting the shortest path to destinations. An intrusion detection system (IDS) is mounted on each node to detect the packet drop behavior. A smart attack detection (SAD) scheme [
21] is projected for four types of attacks. Primarily, the scheme detects the type of attack first and then deals with it. The involved attacks are wormhole, sinkhole, BH, and botnet. The identification depends upon the node axis, mobility, and node number.
An intrusion avoidance system–secure data transmission (IAS-SDT)-focused appr- oach [
22] constructed on AODV and AOMDV (multipath extension) with a presumption of established routes is proposed to mitigate BH attack. A message is fragmented and encrypted using a homomorphic encryption scheme during the route configuration phase. The identifiable routes are assigned to each cluster. Only one fragment of the message is routed through every group. If an adversary drops the fragments, the alternative route is assigned until the arrival of all fragments. A tactical mitigation technique [
23] that comprehends with certainty the BH and wormhole attack in the AODV is suggested, in which the nodes in the route preserve a record for every RREP packet for a definite time with their sequence (seq) numbers. The average of all seq numbers is computed by the specified formula. To conclucde, the routes with a value greater than computed are engaged for transmission.
The critical operations of WSN and IoT and their subjected data are a significant subject for future DF. The digital evidence (DE) found in these networks is difficult compared to what the investigation community currently possesses (
Table 1). Furthermore, these systems involve inventive and enhanced prospects for data [
14]. The DF techniques applied are constructed using the DF process model entailing the processes of collection, examination, analysis, and reporting [
14,
24]. These data are crucial not only for the ongoing investigation process but for future investigations as well. The DF in these networks is challenging when it approaches accuracy issues due to the intensity of data analysis, heterogeneity, encryption, third parties, and proprietary issues bearing the risk of demolishing data integrity and granularity [
24,
25]. The complexities are increased due to the significance of identified and collected devices, indistinct network confinements, and edge-less networks [
25,
26]. The data analysis is a big challenge for the investigator’s aptitude to yield rigorous, forensically sound, and admissible DE. A study determined that the growth in the number of infested entities aggravates the harm of attack [
27].
A DF study in [
28] suggests the observer nodes for their specific area. Some algorithms are advised for the accumulation and forwarding of collected DE to BS and recreating the potential scenario for the wormhole attack. The simulation calculates the communication overhead and memory overhead. The approach successfully detects wormholes due to its strict monitoring system. Another DF study analyzed non-address spoofing flood (NASF) DDoS in MANET [
29]. A statistical examination of flow rate information and IDS log files is used to establish detection features. The detection ratio, false detection rate, and detection time are three different parameters to evaluate the NASF attack. Network forensics is a live DF analysis of traffic and is composed of pattern recognition, correlation fusion, and network traffic disability. The DE usually composed of captured traffic and network device data. Live network traffic is also captured as mature attackers may delete log files. It involves three questions and two features: Is there an adversary in the traffic? Does it cause DDoS? and What is the time of the attack [
29,
30]? The detection features (Feature I and II) are based on the statistical analysis of flow rate info and IDS log files. The detection time, rate and false detection rate are used as metrics of performance [
29,
30].
There are some other studies that examine the jamming attack in the WSN [
31,
32]. These are emphasized in the location of the clogged zone and victim nodes that damaged the network performance. A Q-learning design algorithm is used for the identification of the node location. The learning model is asynchronous and is capable of identifying the location of the the jamming area in the run-time when the attack take place. One study [
33] discussed the live forensic investigation of the man in the attack (MITM). An intrusion detection system (IDS) is activated with traffic data to watch processes, packet sniffing, and log traffic with an open source IDS snort. The Snort IDS examines the entire traffic system and explores abnormalities in the network. The Live Forensic technique is implemented in a conventional manner that comprises identification, preservation, analysis, and presentation. The results of the exploration of DE are obtained in the form of the IP Address and port. The mitigation of attacks is carried out by blocking the IP Address and port used by the attacker.
Kumar et al. [
34] analytically evaluated the information reclaimed from an IoT networking device to detect the elements caused by a security rupture by extracting flash and RAM objects from a sensor node. Network connectivity information is extracted and investigated by various scenarios. They projected a scheme with the help of a RAM dump analysis tool for the extraction, analysis, and correlation of forensic data for IPv6-based WSN deployments. An IPv6 Low-Power Wireless Personal Area Networks (6LoWPAN) traffic forensic scheme [
35] to accomplish detection and investigation of attacks against availability in WSN was projected to construct the scenarios of potential interest. This scheme is related to the previous one.
The attack mitigation approaches and DF studies related to this research are extensively discussed in this section. Notably, these approaches lack a node-to-network relation with the fluctuations in the severity of the attack, root-level DF investigation of BH attack, and position of the BH node relative to the cumulative damage resulting from the attack. Usually, the mitigation approaches describe the number of malicious nodes directly proportional to the damage to the network. This behavior is briefly analyzed in our research. The mitigation approaches presented are fair enough for their perspective and objectives but cannot be declared perfect for every situation and network environment. There is always a need for postmortem analysis of the attack for designing advanced countermeasures and fighting precariousness. Perfect security is just an illusion, as attackers breach systems regardless of robust prevention schemes.
4. Simulation and Results
This section includes the details of simulation environment, parameters, and their description. Moreover, it discusses the analysis of the outcomes of simulation. NS 3.30 on the Ubuntu 19.04 operating system on a 64-bit processor is used for the simulation of the network(s).
Table 2 contains comprehensive information about the simulation environment parameters. Multiple types of networks are simulated with a variety of parameters in order to verify the findings of forensic analysis. The first value in
Table 2 against every parameter is the network under the BH attack, which is briefly analyzed. The variations in the values are intended to verify the analysis. The critical point of the implementation is that it defines the behavior of the attack in the routing model of AODV. The mobile nodes in the network adopt a random way-point mobility model. The network converges in the first 100 s, and then it starts data transmission. Then the attack starts randomly. This means that the behavior of the attack is defined only in the source code of the AODV model. The random nodes in the network will drop packets. This work analyzes the traffic traces, the behavior of the AODV routing protocol, and the variations in the traffic patterns under the BH attack. This behavior of the network under the attack helps to follow the forensic activities thoroughly. At the start, it is not known which specific nodes or flows are going to be malicious. Therefore, a deep inspection is needed to reveal that what happened to the performance of the network. The point of interest is the time of the attack, the behavior of the AODV protocol under attack, the traffic variations due to the attack, the packet loss ratio, the end-to-end delay, the throughput, and the transmission volume. After the analysis of the attack, interesting facts about the behavior of the protocol under attack are discovered and verified by implementing different types of networks with variation of parameters and network environments. The network simulation runs for 200 s, and after completion of the simulation various types of output files are generated for analysis, such as CSV, Flow Monitor, trace, PCAP, and XML files of the simulation.
The graph of the simulation is plotted by the GNUPLOT of NS3. The .tr files are analyzed by Tracemetrics, which is an analysis tool for NS3. PCAP files are analyzed by Wireshark, which is a famous network packet analyzer tool. The XML trace file of the simulation and flowMon files are analyzed by NetAnim.
4.1. Analysis of Simulation Outcomes
This subsection briefly discusses and analyzes the simulation results of the BH attack. The pros and cons of AODV in terms of DF investigations are also considered. This may employ the other reactive routing protocols as well. The network simulation traces and the traffic flows between the nodes are analyzed to observe the traffic behavior. Then, a postmortem analysis of the attack and the hierarchy of packets in the network is conducted. It is of crucial importance to understand the route discovery process in the AODV protocol to analyze the traffic generated in the network. There are four kinds of packets used in the routing process: the route request (RREQ), route reply (RREP), HELLO, and route error (RERR) packets. The RREQ and RREP packets are used for route discovery. The RERR and HELLO packets are used for route preservation in case of any abnormality.
4.1.1. Analysis of the Flow Monitor Trace File
The Flow Monitor operates on the IP layer and measures several parameters. It is designed using a modular approach. The network probes for Flow Monitor are of four types.
Packet sent by the source node (SendOutgoing IPv4 and IPv6 traces)
The packet is forwarded by a node (UnicastForward IPv4 and IPv6 traces)
Packet received (LocalDeliver IPv4 and IPv6 traces)
Packet dropped (Drop IPv4 and IPv6 traces)
The data composed for every flow are given in
Figure 4. The flow IDs are 6 and 7. Now, we discuss flow ID 7. It is generated from the IP address 10.1.1.12 (node 13) to the IP address 10.1.1.2 (node 3), and the UDP port used is 49,153. There are 397 packets transmitted to node 3 from node 13 and 232 packets out of 397 get dropped by the BH nodes. Only 257 packets are received by the destination node. It is observed that the summation of lost and received packets is greater than the total transmitted packets. This occurs because Flow Monitor intercepts packets at IP level, and packets queued at a lower level than IP at the end of the simulation are considered lost. Packets in this flow are forwarded 1074 times. 160 packets are dropped due to the fragment timeout, and 10 packets are dropped due to the absence of a route. Other data parameters are transmission and receive bit-rate, mean delay, packets loss ratio, the number of packets transmitted, received, and lost, time for the first and the last packet transmitted and received, etc. Two types of network devices are installed on each node: the Wifi NetDevice and the loopback NetDevice. The loopback device has the IP address 127.0.0.1 on each node and is used for testing purposes.
A large number of flows are observed in the flowMon file. The total number of flows is 950. The details of each flow cannot be discussed due to the restriction of space, so the data of each flow is fetched one by one to compose a table and CSV files to plot that data. The graphs show the variations of traffic patterns regarding their Flow IDs.
Table 3 contains some of the flows selected upon the basis of the variations in the loss ratio and colored with respect to the PLR variations. The dark red flows depict a loss ratio greater than 70%, blue flows depict loss ratio less than 70% and greater than 40%, and green flows depict loss ratio less than 40%. The cumulative packets loss ratio is 28.789% for all flows. Some flows have 100% packets loss, some have 0% packets loss, and some have a packets loss in between these numbers. The total number of packets transmitted was 10,693, the total number of received packets was 7621, and the total number of lost packets was 3072. We calculate the cumulative loss of the flows and compose CSV files of the data to plot the graph. Python is used to plot graphs of the data.
Figure 5 depicts the statistics of all 950 flow IDs concerning their number of packet transmissions. The initial bars show that the packets transmission rate is up to 400 packets per flow ID. However, it then severely declines due to the BH attack.
Figure 6 contains the information about the received packets from all flow IDs. Due to the directly proportional relationship to transmission rate, the number of received packets is up to 200 for initial flow IDs, and then this number also declines. We can see that it keeps varying throughout the process but never touches the highest again.
Figure 7 depicts the number of lost packets. At the start, the packet loss is high in terms of the number of packets. It almost hit 400 packets per flow at the worsening state of attack. As we have observed, the pattern of the traffic in the past two graphs, the number of packets declines in the network communication but the ratio of sent to lost packets does not decline as per the pattern, which is depicted in the next graph. Therefore, when the transmission packets number declines, the received packets and lost packets numbers also decline.
Figure 8 shows the packet loss ratio (PLR) of all flow IDs from ID 1 to 950. The line graph frequently touches the maximum, when there is a 100% packet loss for a flow ID. The PLR is given as a percentage. We have many flows in which not even a single data packet is received by the destination IP. The PLR is 100% repeatedly throughout the axis. Furthermore, some of the flow IDs have PLR 0%. From the previous graphs, it is observed that the number of packet transmissions declines when the attack starts. Although the number of packets declines, but the damage scale of the BH remains the same until the end. In some flows, the number of the transmitted packets is very low, and they are all dropped by the BH nodes and lost. Therefore, the PLR hits the hundred-percent scale-point for several flow IDs. An excessive decline in the number of transmitted packets created a flood of AODV control packets in the network. We analyze the behavior of the attack on the IP layer of the network.
The number of all flows is 950, but when we run the network simulation without an attack in the normal state, the flows are only 371, and the total number of the transmitted packets is 2316. The BH attack caused a massive boost in the control traffic of the network and choked the network traffic, so the number of flows increased exponentially. AODV is an on-demand and reactive protocol, and the routes are demolished after use or due to some abnormality. Therefore, the attack caused the extensive flow of AODV control packets in the network, affecting the cumulative performance and energy.
4.1.2. Analysis of the PCAP Files
Wireshark works by putting the network interface card (NIC) into a promiscuous mode, and it tells NIC to accept every packet it receives. It helps to analyze the traffic patterns in real-time.
Figure 9 shows the packets captured at node number 5 and their sender and receiver IP addresses. We can observe that the senders broadcast RREQs to 10.1.1.255 (Network) and other packets to the nodes. We have included communication of only one node due to the restriction of space.
We analyzed the 50 PCAP files of all nodes and examine their network protocol hierarchy and conversations patterns. We plotted the nodes’ I/O graphs over time and analyzed the behavior of attack at the nodes level. We analyzed the behavior of attack at the network IP level in the previous Flow Monitor part. All PCAP files were merged to compose one combined file and then plot a graph of that file. Another reason for doing this is the similar behavior of all malicious nodes with respect to time, because the traffic pattern at those nodes is almost the same.
We can observe the number and hierarchy of User Datagram Protocol (UDP) data and AODV packets from
Figure 10. Their comparison shows that AODV control packets are far greater in numbers than data packets. The BH attack creates chaos in the network, which causes exponential growth in control packets traffic, causing damage to the cumulative performance of the network. From
Figure 11, we observe traffic patterns of the packets captured at all nodes and their protocol hierarchy. The first 100 s is the network convergence time, so there is no traffic of data packets till this time except a little traffic of protocols’ control packets. After that, the data packets’ transmission starts and eventually tries to grow in the network. However, the BH attack starts and affects the performance of the network. Now, an interesting pattern is observed. The attack causes a major flood of AODV control packets in the network, almost threefold to the data packets. This creates an immense network overhead, and then the damage reaches its maximum at the time span from 130 to 140 s, where the data packets decline to 0 packets per s. This is the worst situation. The BH attack behaves like a smurf attack and affects the end-to-end delay and efficiency of the network. In this time period, the attack is at its extreme extent. Again, similar behavior is observed from span 160 to 170 s, where data packets declined. Therefore, the AODV protocol behaves in an “up and down” manner. It tries to re-establish routes again, but the BH again causes the same result. As the attack takes place no matter the scale, it disturbs the long-term performance of the network.
4.1.3. NetAnim Traces
The NS3 network simulation is animated by NetAnim using an XML trace output file. Different sorts of statistics can be found, such as node activities regarding protocol characteristics, data transmission, and the types of data transmission. We extract the data of the UDP traffic from the animator to plot the graphs. Then we analyze the node-to-node UDP data transmission. The graph in
Figure 12 contains only the data transmissions of UDP. These flows only show the data flows that are intended from a sender to the receiver nodes.
Figure 12 shows that almost all nodes have communicated with one another by using UDP port number 654. The blue points scattered in the graph show this information. It can be observed from the graph that some nodes have not sent any data, i.e., node 20, 21, and 49, although they have received some.
Figure 13 depicts the stats of AODV RREPs of the nodes in the network. We can observe that node 49 has sent seven route replies. Now, as shown in the graph in
Figure 12, it did not forward any data packet to the other nodes. Therefore, it is possible to detect the BH node from the ratio of RREP packets it publishes to the data packets it forwards.
4.1.4. Little’s Law Results
Tracemetrics is a useful tool to perform a rapid analysis of the trace file produced by NS3 simulations and compute useful metrics for performance measurement and research purposes. We extract Little’s values from the trace (.tr) file by using Tracemetrics.
Figure 14 illustrates of the results of Little’s theorem. We plot a graph of the arrival rate values of the packets at the specific nodes per unit time. This informs us about the busy nodes in the network. The X-axis contains the specific node number, and the Y-axis contains the arrival rate value of the node per unit time. The busy nodes can be easily observed in the graph.
4.1.5. Throughput and Goodput of Nodes
Figure 15 contains an analysis of the throughput and goodput of the network. These results are also extracted through Tracemetrics. We can clearly observe the throughput-to-goodput ratio of the nodes. Throughput is the measurement of the amount of all data flowing through a node or link, while the goodput is the measurement of only useful data.
4.1.6. Cumulative Performance Comparison of the Network with and without BH Attack
When the simulation ends, a CSV file is generated, which contains the record of the rate of packets received with respect to the simulation time, which is in seconds. We can use GNUPLOT to plot the graph of the file.
Figure 16 depicts the graph of the standard network without attack and normal functioning. We can observe the simulation unit time (in seconds) on the X-axis and the rate of packets received per unit time in the network on the Y-axis. The purple line is for the receive rate, and the green line is for the total number of the data packets received. The packets received is the cumulative number of packets received in the network till the specific time. It is always greater than the receive rate as it is the sum of the received packets at a given time.
Figure 17 is plotted from the remnants (CSV) of the same network under the BH attack. We can see that the transmission begins from the 100th second of simulation and then shows variations. However, as we have analyzed earlier from the PCAP files, the attack was most detrimental at the period of 135 s to 145 s. We can see that the receive rate of the data packets dropped to zero in that phase. The Wireshark outputs have also depicted the similar behavior for data packets, which is shown in
Figure 11. Therefore, these results also validate previous ones.
4.1.7. PyViz Visualization Results
PyViz is an NS3 tool for live visualization, as it does not use any type of traces. It demonstrates the nodes dropping packets and the working of the mobility models in real time. We can analyze the behavior of the nodes from the number of packets the node received and the number of packets transmitted. If a node transmitted messages much less than it received, it means that there is something abnormal with it.
It can be observed from the stats of node 5 in
Figure 18 that it has received 2144 data packets and transmitted only 497 packets to other nodes. This means that it discarded around about 1650 packets. The node discarded almost 76 percent of its packets. The node 22 has also shown similar behavior. We can visualize the actual network traffic pattern and positioning of nodes via PyViz and also in the live DF tools. However, we cannot identify which specific packet is being dropped due to the BH attack or any other node or network malfunction. It is observed from the live visualization that the physical and logical position of the BH nodes in the network has a great impact on the cumulative performance of the network as well. If a BH node can publish RREP to more and more nodes, it can damage the network severely. It is also observed from the PyViz that the increasing and decreasing total number of nodes and the number of malicious nodes have a great impact on the performance of the network as well. This is briefly discussed and verified in
Section 4.1.8 with the reconstruction of different networks under different circumstances.
4.1.8. Discussion and Verification of Results
A mobile environment for 50 sensor nodes was simulated, and the behavior of a BH attack is defined in the model of the NS3 AODV routing class. The malicious behavior was not assigned to any node by default. Some nodes randomly acquired the malicious behavior because the approach aimed to forensically analyze the behavior of the network and the traffic in the presence of an attack. A significant portion of the network nodes were observed to behave maliciously.
The different types of traces from the simulated environment and live statistics of the simulation are analyzed and discussed in the PyViz. Some exciting challenges for this domain are discovered. For example, forensics investigations for these networks are very challenging because sound artifacts are difficult to obtain due to broadcast, resource-constrained, and fragile environments. Mobility induces data corruption. The network forensics for WSN and IoT is hideous because the DE that can be found from the data communication traces is insubstantial and can disappear quickly. The resource-constrained nature of the wireless devices may also vary the stability of traces.
Traditional DF mechanisms may be applied at device-level investigations but not for network traffic forensic, especially in the presence of reactive routing protocols. The reactive forensic is challenging for this purpose because solid DE is difficult to obtain from the network traffic artifacts. At the routing protocol level, we have also discovered some interesting facts related to DF investigations. Reactive routing protocols are not compatible or suitable for DF investigations due to their on-demand behavior, i.e., AODV. Routes are established on demand and demolished after their use, so we cannot have any useful route information from the routing tables. The source nodes transmit HELLO packets for route preservation in AODV. The RERR message presents the unreachable destination. Message-receiving nodes inactivate the existing route toward that destination. In the case of intense and cooperative behavior of the attack, the constant growth and load of protocol control packets can jam the cumulative performance of the network, affecting the energy. As the network size grows in terms of number of nodes, the chances of collecting useful DE declines. As the BH attack goes into a worsening state, it also behaves like a smurf attack, which is also a type of DoS. We have noticed this in the PCAP analysis in
Figure 11, where the data packet transmissions has fallen to 0, but the AODV control packets were not.
For the sake of argument, let us assume that if we develop a mechanism for all network nodes to submit each routing table or routing information to a third party node or a BS, then the on-demand protocols will then also produce a large amount of control traffic to find, sustain, and maintain routes, especially in mobile networks where the position of the nodes is continuously varying. Therefore, the networks using on-demand or reactive routing protocol are not suitable to produce forensically useful data, especially in the case of adverse attacks. The case may become more complicated with the increasing time-span of the attack. On the other side, the AODV self-healing quality is appreciable, as we have observed from the graphs in the
Figure 11 and
Figure 17.
There are also some essential aspects of the research such as the physical topology, strategic positioning, and cooperation of the network nodes. From the past literature, especially in the mitigating schemes, the damage to the network by the attack has usually been shown to be directly proportional to the number of malicious nodes in the network, but this is not always true. We have found that a lower number of malicious nodes occupying important locations can cause more damage than a high number of malicious nodes that are randomly settled. This can be observed in
Table 4,
Table 5 and
Table 6. A node that publishes fake routes to a significant number of source nodes can cause multiple types of damages to the network. In AODV, if we give responsibility to the nodes for detecting and preventing the attacks, it may work well for that specific aim but will cause an increased average end-to-end delay. We have found that it is challenging to analyze the selective behavior of the attack from the analysis of traffic in the network and packets captured at nodes. If the attack is aimed for an extended period but within small time intervals, we would not be able to identify if the packets are dropped due to the BH attack or transmission errors.
We also set up networks with different modes of physical topology with the variations in the number of malicious nodes to verify the findings of our analysis.
Table 4 depicts the statistics computed from Flow Monitor for the ad hoc networks in mobile and static modes. The first network is in the normal state, and its graph of data packets is presented in
Figure 16. This network has only 371 flows in a normal state, and the number of flows increases to 950 during a BH attack. The second network is the same, which we briefly analyzed under the BH attack in this paper. We can see the number of packets in the network exponentially grew due to the extensive number of control packets. The PLR, average E2E delay, and throughput are affected by the attack. The third network is the same as above, but we decreased the number of total number of nodes to 35 from 50. We did this to check the random behavior of the attack in a smaller number of nodes. Therefore, the PLR decreased and the E2E delay increased. In the end, the same ad hoc network in the static mode under BH attack is given. The PLR is lower, but the average E2E delay, throughput, and several control packets are affected.
We have reconstructed two other WSN environments with variation in parameters to verify the forensic analysis of this research.
Table 5 and
Table 6 contain the statistics of static and mobile WSN under BH attack, respectively. We vary the number of malicious nodes in the network to observe the behavior of the protocol and network under BH attack. A small change in the number of malicious nodes, selection of specific nodes for malicious activity, specific position of the malicious node, specific grouping between nodes for malicious activity, and environmental mode of the network has a decisive impact on the cumulative performance of the network, which we can observe from the both tables. The variations in the number of malicious nodes in
Table 5 from 10 to 14, 14 to 15, and 15 to 19 significantly impacted the total number of transmitted packets, further extending the effect on PDR and PLR. Similar behavior can also be observed from
Table 6. The fluctuations in the depicted metrics with the variation of above mentioned parameters verify our analysis.
Keeping in view the analysis and discussion, we suggest designing pro-forensic network routing protocols and wireless infrastructures. Those protocols use a combined approach of reactive and proactive routing, in which abnormal criteria could be defined for traffic in the network and on the nodes according to the nature and responsibilities of the network. A DE collector can be established. Any specified abnormality detected could be submitted to the DE collector with all the records that could be helpful for DF investigations. The abnormality-driven DE collection approach would not only diminish the extra consumption of computational resources of the network, but it would also lessen the burden of a forensic investigator by presenting the useful DE in advance. This will be investigated in our future work in this domain.


 ,
, 


