
Experimental Investigation and Optimization of a Glazed Transpired Solar Collector


Abstract
:Featured Application
Abstract

1. Introduction
2. Materials and Methods
2.1. Optimization of the GTC Design
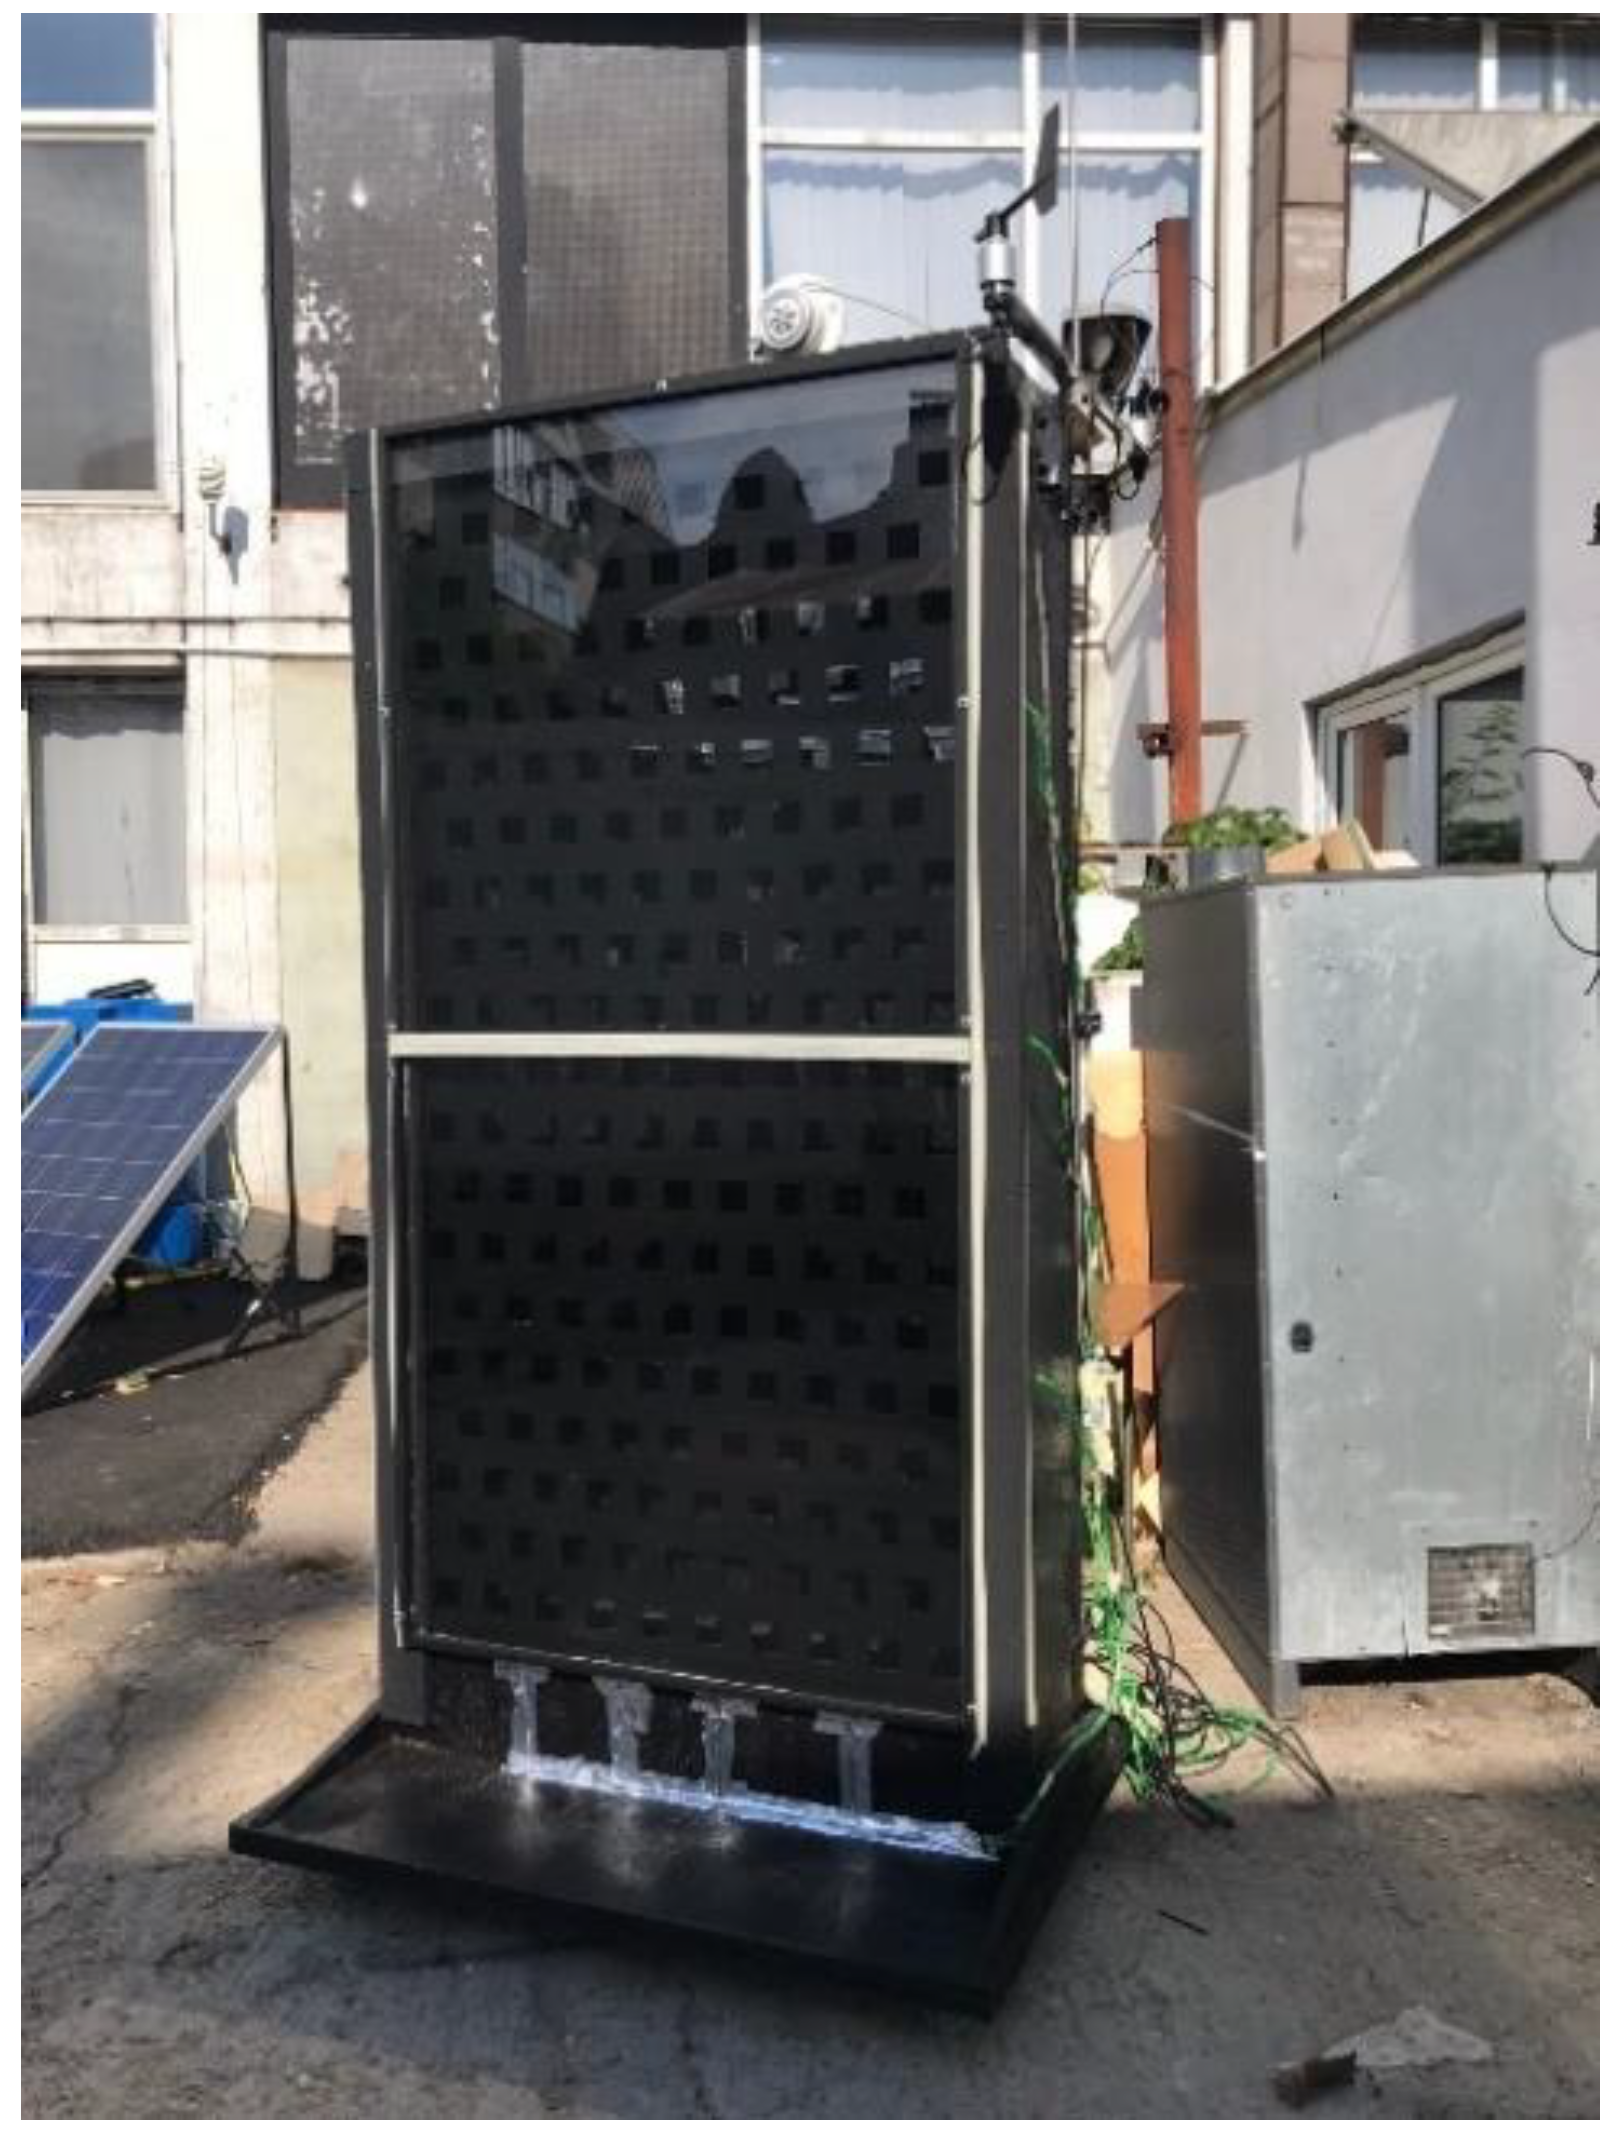
2.1.1. Experimental Set-Up and Protocol
- 4 thermocouples on the air GTC inlet (T1–4 in);
- 5 thermocouples on the air GTC outlet (T1–5 out);
- 9 thermocouples on the GTC absorber plate (T1–9p);
- 1 thermocouple on the inner surface of the GTC rear wall (Tw).
2.1.2. Results and Discussion
- Meteorological data:
- GTC thermal behavior:
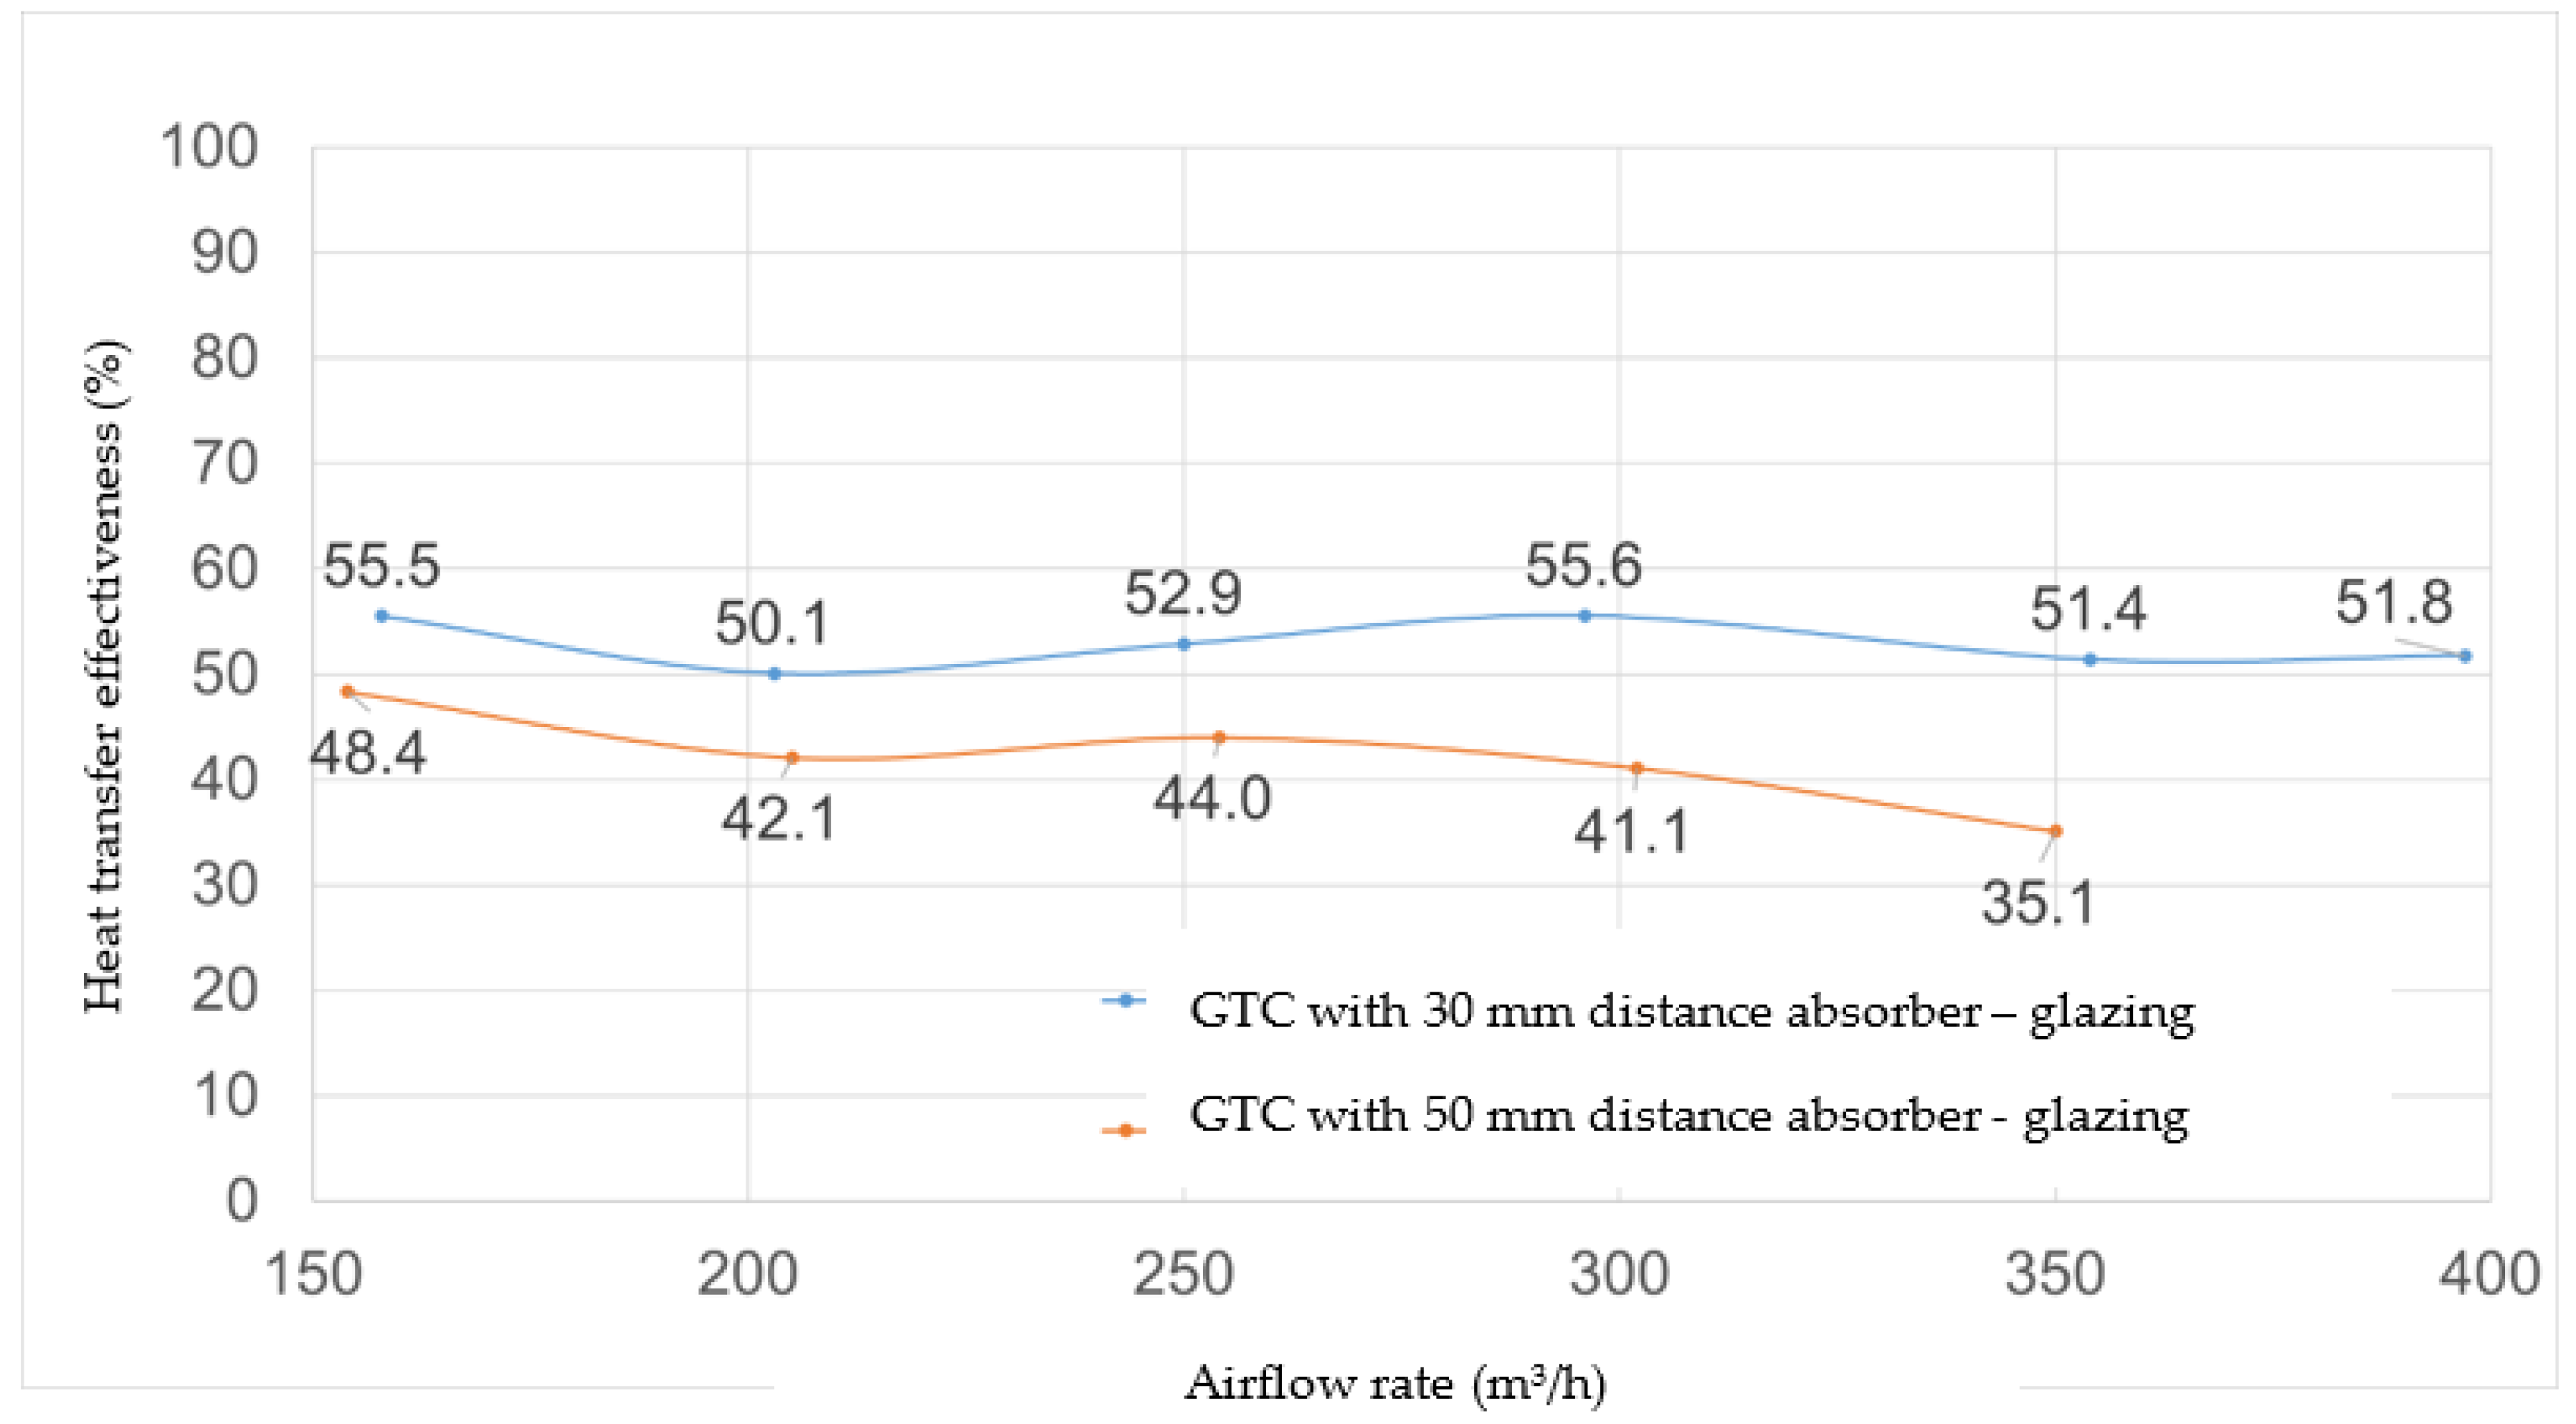
- GTC performance evaluation:
2.2. Integration of the Optimized GTC into a Building Façade
2.2.1. Experimental Set-Up and Protocol
2.2.2. Results and Discussion
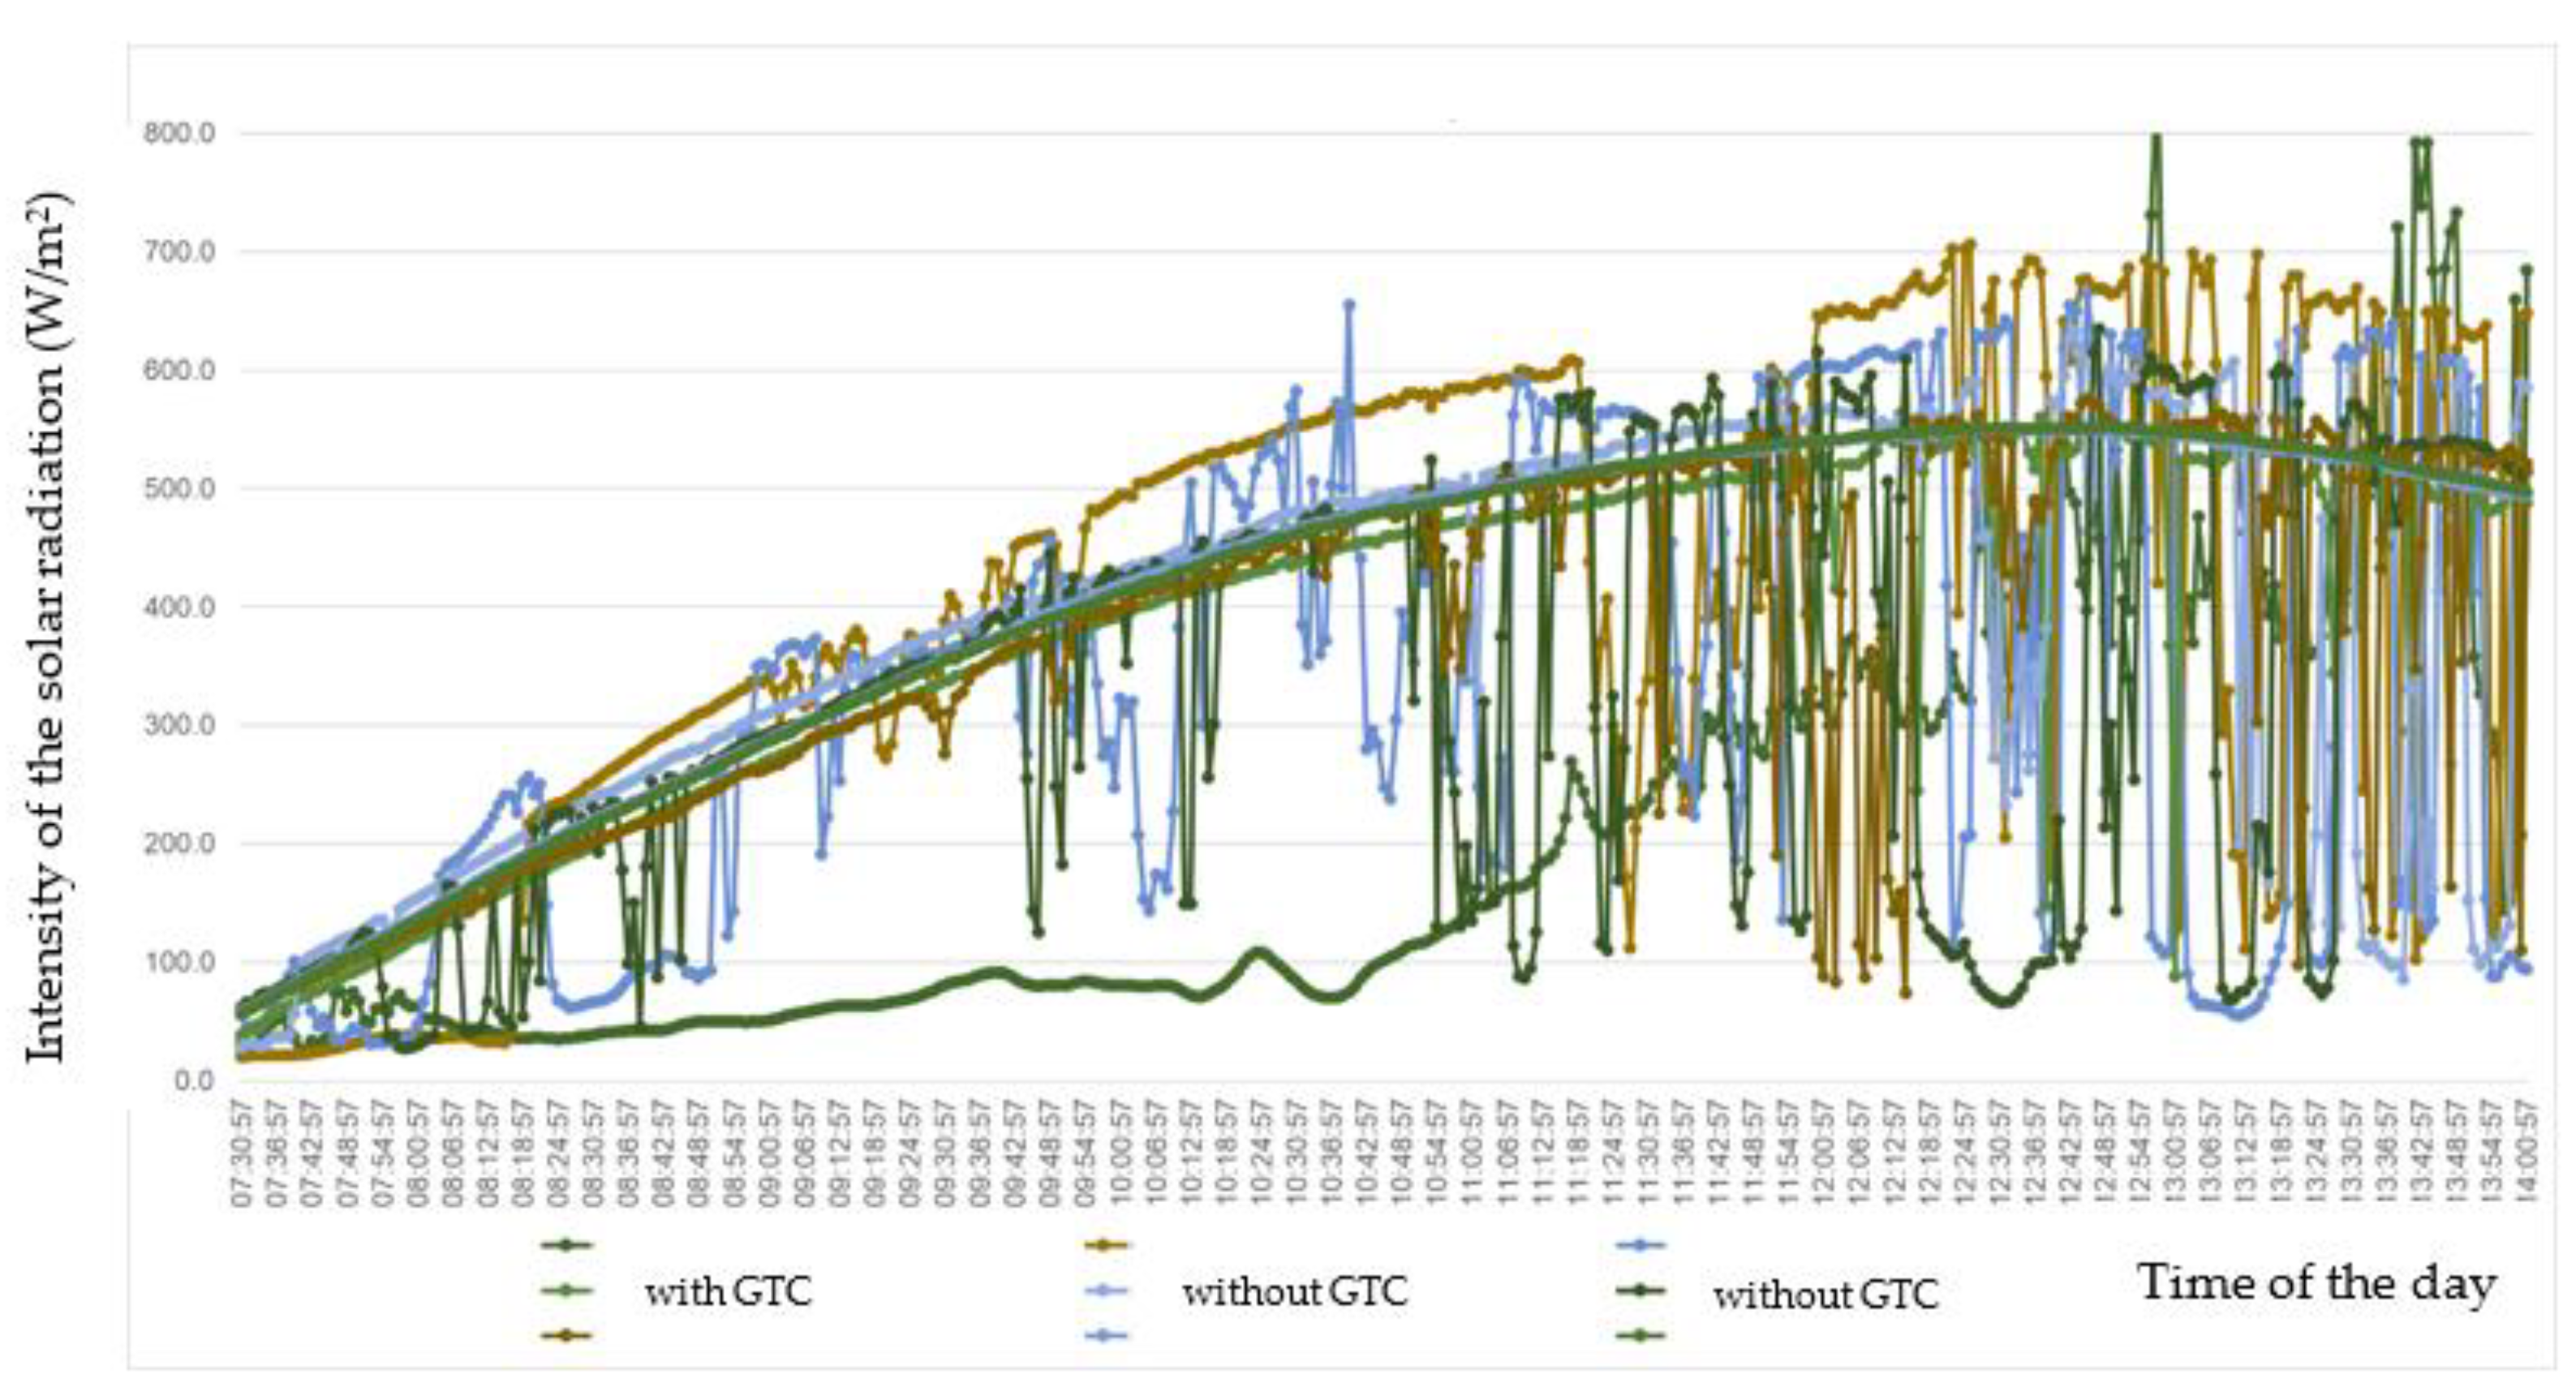
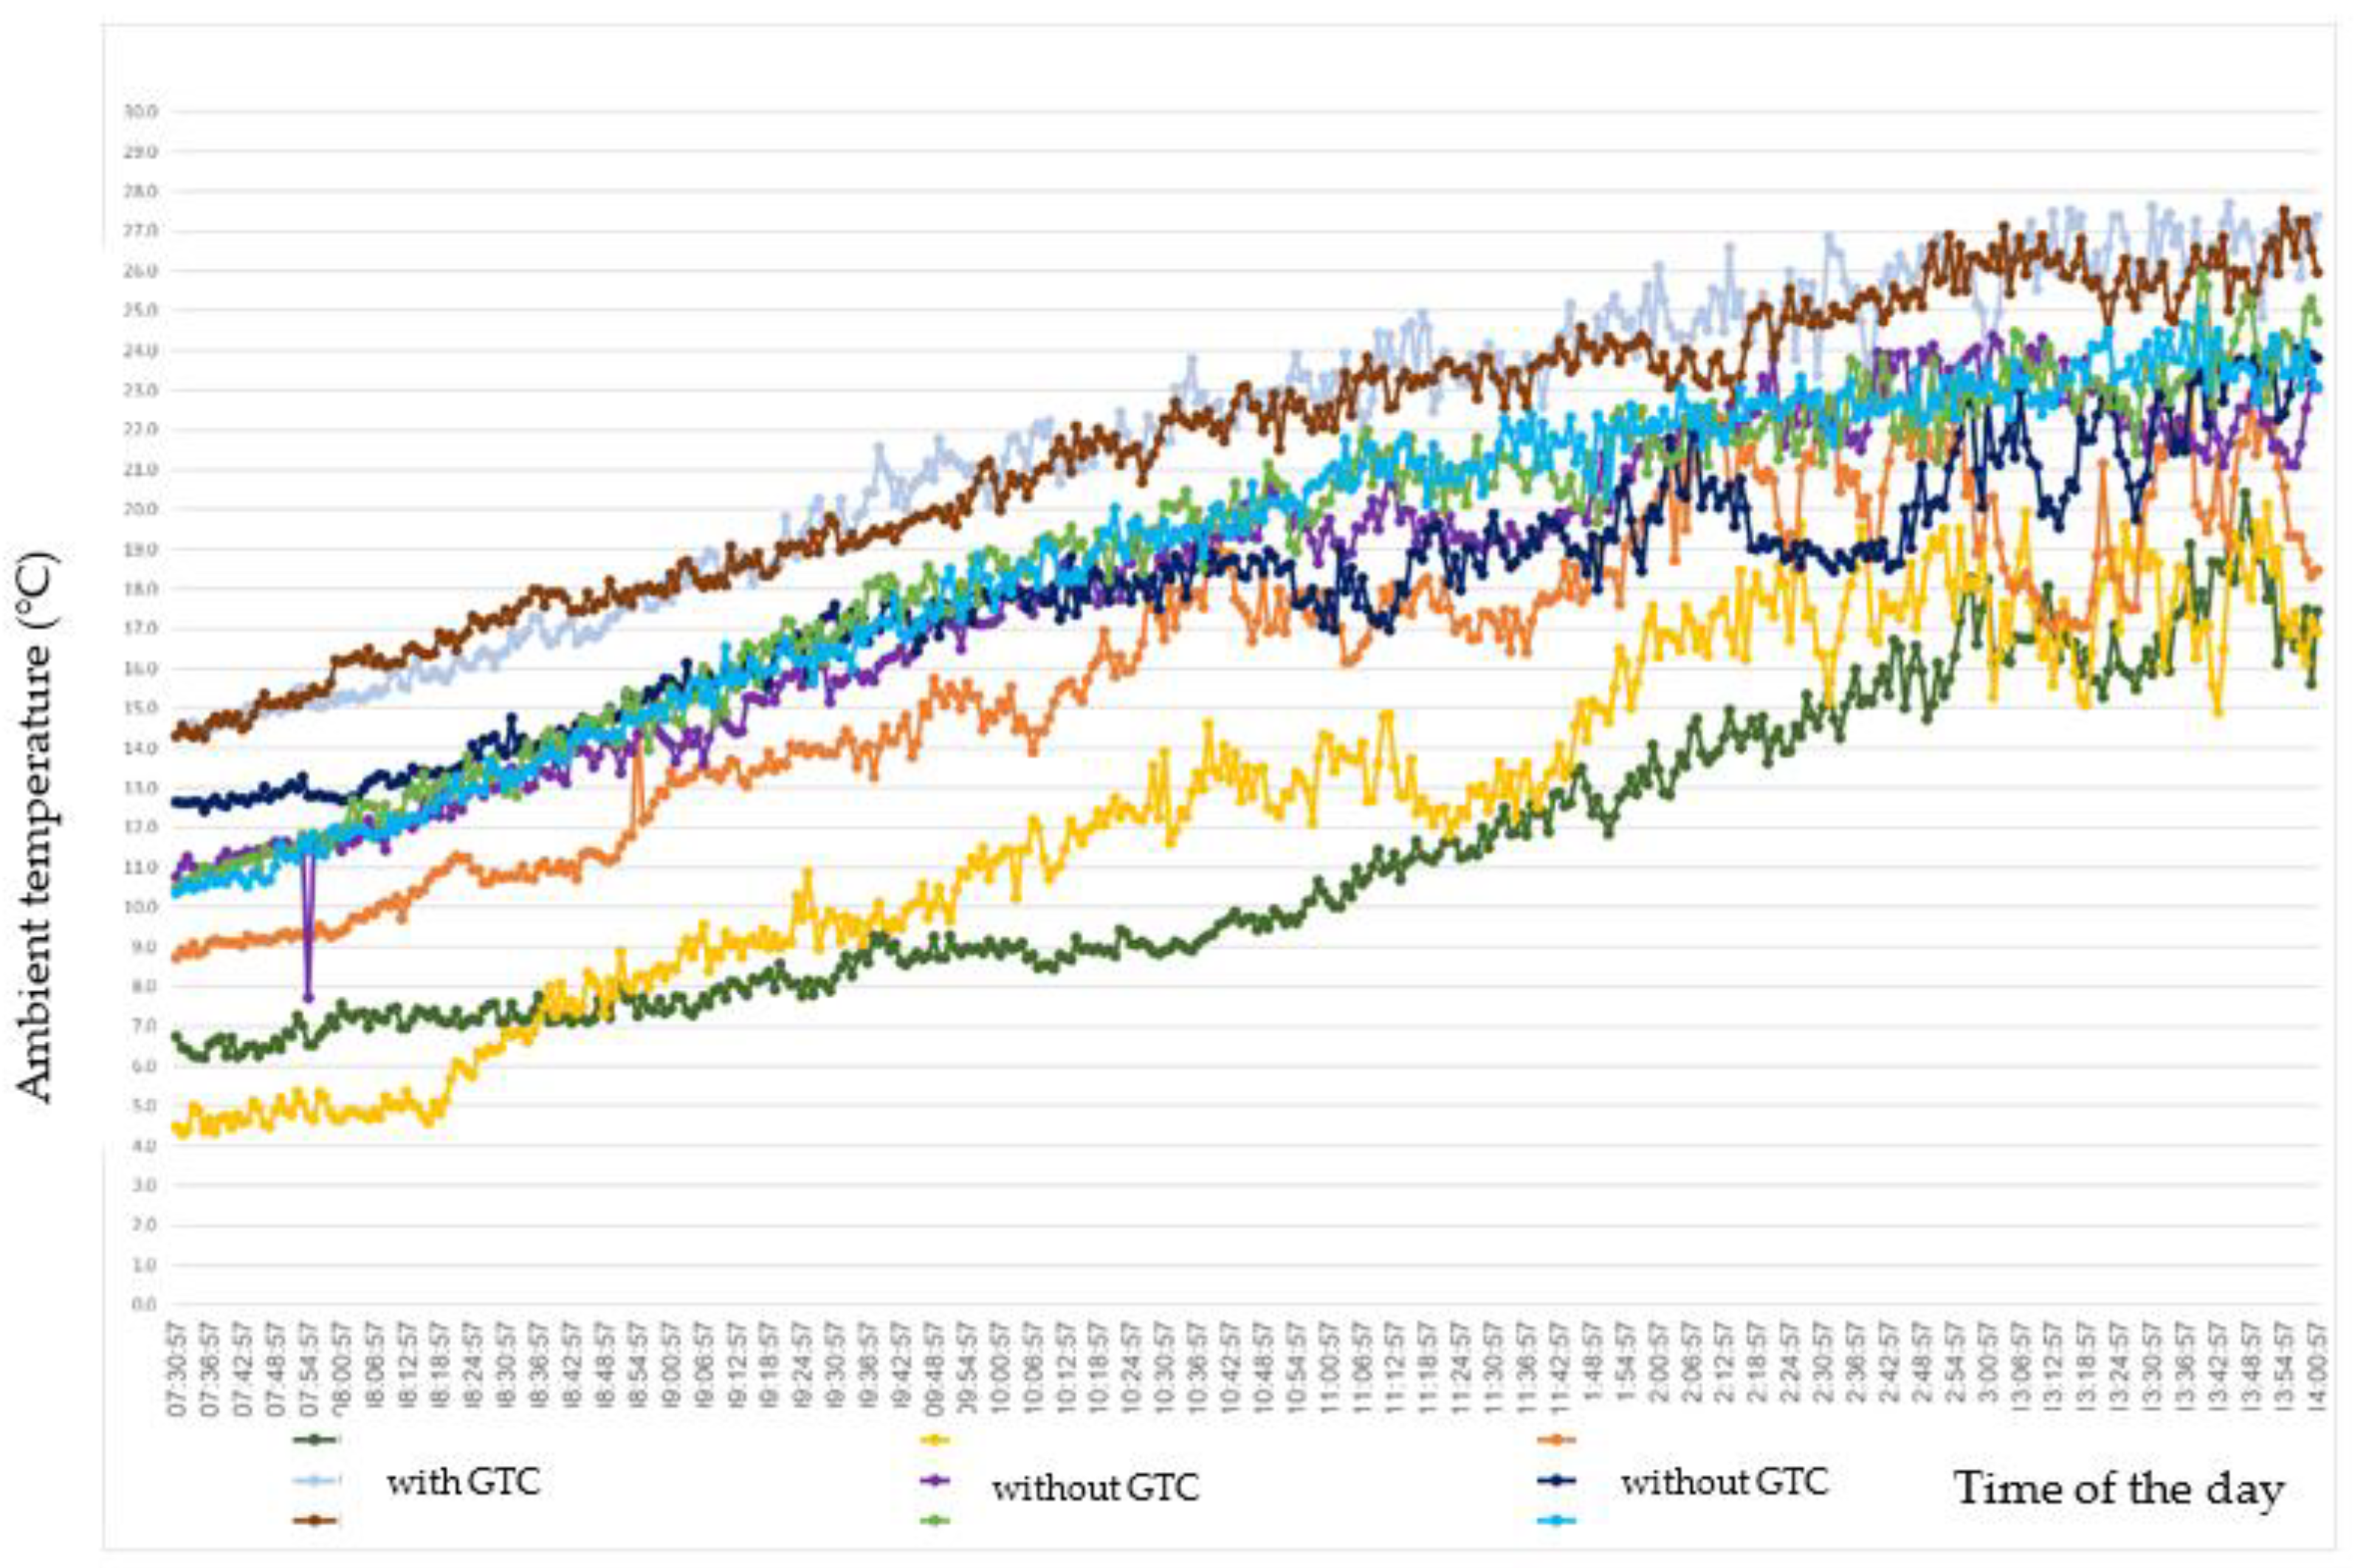
- Meteorological data:
- GTC energy-saving assessment:
3. Conclusions
Author Contributions
Funding
Institutional Review Board Statement
Informed Consent Statement
Conflicts of Interest
References
- Energy Prices: Commission Proposes Emergency Market Intervention to Reduce Bills for Europeans—Press Release 14 September 2022, Brussels. Available online: https://ec.europa.eu/commission/presscorner/detail/en/IP_22_5489 (accessed on 5 October 2022).
- European Union. Directive 2009/28/EC of the European Parliament and of the Council of 23 April 2009 on the promotion of the use of energy from renewable sources and amending and subsequently repealing Directives 2001/77/EC and 2003/30/EC. Off. J. Eur. Union 2009, 140, 16–62. [Google Scholar]
- European Union. Directive (EU) 2018/2001 of the European Parliament and of the Council of 11 December 2018 on the promotion of the use of energy from renewable sources. Off. J. Eur. Union 2018, 328, 82–209. [Google Scholar]
- European Environment Agency. Share of Energy Consumption from Renewable Sources in Europe. Available online: https://www.eea.europa.eu/ims/share-of-energy-consumption-from (accessed on 27 October 2022).
- Moschella, M.; Tucci, M.; Crisostomi, E.; Betti, A. A Machine Learning Model for Long-Term Power Generation Forecasting at Bidding Zone Level. In Proceedings of the 2019 IEEE Pes Innovative Smart Grid Technologies Europe (ISGT-Europe) Conference, Bucharest, Romania, 29 September–2 October 2019. [Google Scholar]
- Ceglia, F.; Marrasso, E.; Roselli, C.; Sasso, M. Time-evolution and forecasting of environmental and energy performance of electricity production system at national and at bidding zone level. Energy Convers. Manag. 2022, 265, 115772. [Google Scholar] [CrossRef]
- Pfeifer, A.; Herc, L.; Bjelic, I.B.; Duic, N. Flexibility index and decreasing the costs in energy systems with high share of renewable energy. Energy Convers. Manag. 2021, 240, 114258. [Google Scholar] [CrossRef]
- Gaspari, M.; Lorenzoni, A. The governance for distributed energy resources in the Italian electricity market: A driver for innovation? Renew. Sustain. Energy Rev. 2018, 82, 3623–3632. [Google Scholar] [CrossRef]
- Winkler, J.; Gaio, A.; Pfluger, B.; Ragwitz, M. Impact of renewables on electricity markets—Do support schemes matter? Energy Policy 2016, 93, 157–167. [Google Scholar] [CrossRef]
- Ceglia, F.; Marrasso, E.; Roselli, C.; Sasso, M. An innovative environmental parameter: Expanded Total Equivalent Warming Impact (Un paramètre environnemental innovant: Impact de réchauffement total équivalent étendu). Int. J. Refrig. 2021, 131, 980–989. [Google Scholar] [CrossRef]
- 2021 Global Status Report for Buildings and Construction. Available online: https://globalabc.org/resources/publications/2021-global-status-report-buildings-and-construction (accessed on 6 October 2022).
- Weiss, W.; Spörk-Dür, M. Global Market Development and Trends in 2021. In Solar Heat Worldwide, 2022th ed.; Detailed Market Figures 2020; AEE—Institute for Sustainable Technologies: Gleisdorf, Austria, 2022; pp. 8–32. [Google Scholar]
- Reichl, C.; Kramer, K.; Thoma, C.; Benovsky, P.; Lemee, T. Comparison of modelled heat transfer and fluid dynamics of a flat plate solar air heating collector towards experimental data. Sol. Energy 2015, 120, 450–463. [Google Scholar] [CrossRef]
- Paya-Marin, M.A. Chapter 5—Solar Air Collectors for Cost-Effective Energy-Efficient Retrofitting. In Cost-Effective Energy Efficient Building Retrofitting; Woodhead Publishing: Cambridge, UK, 2017; pp. 141–168. [Google Scholar]
- Goyal, R.K.; Tiwari, G.N.; Garg, H.P. Effect of thermal storage on the performance of an air collector: A periodic analysis. Energy Convers. Manag. 1998, 39, 193–202. [Google Scholar] [CrossRef]
- Leon, M.A.; Kumar, S. Mathematical modeling and thermal performance analysis of unglazed transpired solar collectors. Sol. Energy 2007, 81, 62–75. [Google Scholar] [CrossRef]
- Budea, S. Solar Air Collectors for Space Heating and Ventilation Applications—Performance and Case Studies under Romanian Climatic Conditions. Energies 2014, 7, 3781–3792. [Google Scholar] [CrossRef] [Green Version]
- Wang, X.L.; Bo, L.; Bi, H.Q.; Yu, T. A simplified method for evaluating thermal performance of unglazed transpired solar collectors under steady state. Appl. Therm. Eng. 2017, 117, 185–192. [Google Scholar] [CrossRef]
- Gunnewiek, L.H.; Hollands, K.G.T.; Brundrett, E. Effect of wind on flow distribution in unglazed transpired-plate collectors. Sol. Energy 2002, 72, 317–325. [Google Scholar] [CrossRef]
- Bal, L.M.; Satya, S.; Naik, S.N. Solar dryer with thermal energy storage systems for drying agricultural food products: A review. Renew. Sustain. Energy Rev. 2010, 14, 2298–2314. [Google Scholar] [CrossRef]
- Shukla, A.; Nkwetta, D.N.; Cho, Y.J.; Stevenson, V.; Jones, P. A state of art review on the performance of transpired solar collector. Renew. Sustain. Energy Rev. 2012, 16, 3975–3985. [Google Scholar] [CrossRef]
- Mund, C.; Rathore, S.K.; Sahoo, R.K. A review of solar air collectors about various modifications for performance enhancement. Sol. Energy 2021, 228, 140–167. [Google Scholar] [CrossRef]
- Kenna, J.P. The thermal trap solar collector. Sol. Energy 1983, 31, 335–338. [Google Scholar] [CrossRef]
- Cordeau, S.; Barrington, S. Performance of unglazed solar ventilation air pre-heaters for broiler barns. Sol. Energy 2011, 85, 1418–1429. [Google Scholar] [CrossRef]
- Chan, H.Y.; Zhu, J.; Ruslan, M.H.; Sopian, K.; Riffat, S. Thermal analysis of flat and transpired solar facades. Energy Procedia 2014, 48, 1345–1354. [Google Scholar] [CrossRef] [Green Version]
- Belusko, M.; Saman, W.; Bruno, F. Performance of jet impingement in unglazed air collectors. Sol. Energy 2008, 82, 389–398. [Google Scholar] [CrossRef]
- Brown, C.; Perisoglou, E.; Hall, R.; Stevenson, V. Transpired Solar Collector Installations in Wales and England. Energy Procedia 2014, 48, 18–27. [Google Scholar] [CrossRef] [Green Version]
- Peci, F.; Taboas, F.; Comino, F.; de Adana, M.R. Experimental study of a modular Unglazed transpired collector Façade for building refurbishment. Sol. Energy 2020, 201, 247–258. [Google Scholar] [CrossRef]
- Li, X.L.; Zheng, S.J.; Tian, G.; Zhang, L.; Yao, W.X. A new energy saving ventilation system assisted by transpired solar air collectors for primary and secondary school classrooms in winter. Build. Environ. 2020, 177, 106895. [Google Scholar] [CrossRef]
- Tajdaran, S.; Kendrick, C.; Hopkins, E.; Bonatesta, F. Geometrical optimisation of Transpired Solar Collectors using design of experiments and computational fluid dynamics. Sol. Energy 2020, 197, 527–537. [Google Scholar] [CrossRef]
- Collins, M.R.; Abulkhair, H. An evaluation of heat transfer and effectiveness for unglazed transpired solar air heaters. Sol. Energy 2014, 99, 231–245. [Google Scholar] [CrossRef]
- Konttinen, P.; Salo, T.; Lund, P.D. Degradation of unglazed rough graphite-aluminium solar absorber surfaces in simulated acid and neutral rain. Sol. Energy 2005, 78, 41–48. [Google Scholar] [CrossRef]
- Gao, L.X.; Bai, H.; Mao, S.F. Potential application of glazed transpired collectors to space heating in cold climates. Energy Convers. Manag. 2014, 77, 690–699. [Google Scholar] [CrossRef]
- Zheng, W.D.; Li, B.J.; Zhang, H.; You, S.J.; Li, Y.; Ye, T.Z. Thermal characteristics of a glazed transpired solar collector with perforating corrugated plate in cold regions. Energy 2016, 109, 781–790. [Google Scholar] [CrossRef]
- Gao, M.; Fan, J.H.; Furbo, S.; Xiang, Y.T. Energy and exergy analysis of a glazed solar preheating collector wall with non-uniform perforated corrugated plate. Renew. Energy 2022, 196, 1048–1063. [Google Scholar] [CrossRef]
- Zhang, T.T.; Tan, Y.F.; Zhang, X.D.; Li, Z.G. A glazed transpired solar wall system for improving indoor environment of rural buildings in northeast China. Build. Environ. 2016, 98, 158–179. [Google Scholar] [CrossRef]
- Nahar, N.M.; Garg, H.P. Free convection and shading due to gap spacing between an absorber plate and the cover glazing in solar energy flat-plate collectors. Appl. Energy 1980, 7, 129–145. [Google Scholar] [CrossRef]
- Charvat, P.; Klimes, L.; Pech, O. Experimental and numerical study into solar air collectors with integrated latent heat thermal storage. In Proceedings of the Conference on Central Europe towards Sustainable Building (CESB13), Prague, Czech Republic, 26–28 June 2013. [Google Scholar]
- Karim, M.A.; Hawlader, M.N.A. Performance investigation of flat plate, v-corrugated and finned air collectors. Energy 2006, 31, 452–470. [Google Scholar] [CrossRef]
- El-Sebaii, A.A.; Aboul-Enein, S.; Ramadan, M.R.I.; Shalaby, S.M.; Moharram, B.M. Thermal performance investigation of double pass-finned plate solar air heater. Appl. Energy 2011, 88, 1727–1739. [Google Scholar] [CrossRef]
- El-Sebaii, A.A.; Aboul-Enein, S.; Ramadan, M.R.I.; Shalaby, S.M.; Moharram, B.M. Investigation of thermal performance of-double pass-flat and v-corrugated plate solar air heaters. Energy 2011, 36, 1076–1086. [Google Scholar] [CrossRef]
- Chabane, F.; Moummi, N.; Benramache, S. Experimental study of heat transfer and thermal performance with longitudinal fins of solar air heater. J. Adv. Res. 2014, 5, 183–192. [Google Scholar] [CrossRef] [PubMed] [Green Version]
- Ozgen, F.; Esen, M.; Esen, H. Experimental investigation of thermal performance of a double-flow solar air heater having aluminium cans. Renew. Energy 2009, 34, 2391–2398. [Google Scholar] [CrossRef]
- Omojaro, A.P.; Aldabbagh, L.B.Y. Experimental performance of single and double pass solar air heater with fins and steel wire mesh as absorber. Appl. Energy 2010, 87, 3759–3765. [Google Scholar] [CrossRef]
- El-khawajah, M.F.; Aldabbagh, L.B.Y.; Egelioglu, F. The effect of using transverse fins on a double pass flow solar air heater using wire mesh as an absorber. Sol. Energy 2011, 85, 1479–1487. [Google Scholar] [CrossRef]
- Gao, M.; Wang, D.J.; Liu, Y.F.; Wang, Y.Y.; Zhou, Y. A study on thermal performance of a novel glazed transpired solar collector with perforating corrugated plate. J. Clean. Prod. 2020, 257, 120443. [Google Scholar] [CrossRef]
- Croitoru, C.V.; Năstase, I.; Bode, F.I.; Meslem, A. Thermodynamic investigation on an innovative unglazed transpired solar collector. Sol. Energy 2016, 131, 21–29. [Google Scholar] [CrossRef]
- Bejan, A.S.; Teodosiu, C.; Croitoru, C.V.; Catalina, T.; Năstase, I. Experimental investigation of transpired solar collectors with/without phase change materials. Sol. Energy 2021, 214, 478–490. [Google Scholar] [CrossRef]
- Croitoru, C.; Bode, F.; Teodosiu, C.; Catalin, T.; Bejan, A.S. Experimental investigation of an enhanced transpired air solar collector with embodied phase changing materials. J. Clean. Prod. 2022, 336, 130398. [Google Scholar]
- Berville, C.; Bode, F.; Croitoru, C. Numerical Simulation Investigation of a Double Skin Transpired Solar Air Collector. Appl. Sci. 2022, 12, 520. [Google Scholar] [CrossRef]
- Bejan, A.S.; Labihi, A.; Croitoru, C.V.; Bode, F.; Sandu, M. Experimental Investigation of the Performance of a Transpired Solar Collector Acting as a Solar Wall. In Proceedings of the ISES Solar World Congress 2017, Abu Dhabi, United Arab Emirates, 29 October–2 November 2017. [Google Scholar]
- Zhang, T.T.; Tan, Y.F.; Yang, H.X.; Zhang, X.D. The application of air layers in building envelopes: A review. Appl. Energy 2016, 165, 707–734. [Google Scholar] [CrossRef]
- Van Decker, G.W.E.; Hollands, K.G.T.; Brunger, A.P. Heat-exchange relations for unglazed transpired solar collectors with circular holes on a square or triangular pitch. Sol. Energy 2001, 71, 33–45. [Google Scholar] [CrossRef]
- Ferahta, F.Z.; Bougoul, S.; Médale, M.; Abid, C. Influence of the Air Gap Layer Thickness on Heat Transfer Between the Glass Cover and the Absorber of a Solar Collector. Fluid Dyn. Mater. Process. 2012, 8, 339–351. [Google Scholar]
- Taylor, J.R. An Introduction to Error Analysis—The Study of Uncertainties in Physical Measurements, 2nd ed.; University Science Books: Sausalito, CA, USA, 1997; pp. 45–92. [Google Scholar]
- American Society of Heating, Refrigerating and Air-Conditioning Engineers. ANSI/ASHRAE Standard 62.1-2022, Ventilation and Acceptable Indoor Air Quality, 2022th ed.; ASHRAE: Peachtree Corners, GA, USA, 2022. [Google Scholar]


| Instrument | Type | Parameter | Range | Uncertainty |
|---|---|---|---|---|
| Thermocouple | K (NiCr-Ni) | Temperature | −10…+105 °C | ±0.2 °C |
| Air flow meter | FlowFinder mk2 | Air flow | 10…550 m3/h | 3% |
| Digital sensor | Almemo FHAD 46-C2 | Ambient temperature | −20…+60 °C | ±0.2 °C |
| Cup-type anemometer | Almemo FVA 615 2 | Wind velocity | 0.5…50 m/s | 3% |
| Wind vane | Almemo FVA 614 | Wind direction | 0…360° | ±5° |
| Star pyranometer | Almemo FLA 628 S | Solar radiation intensity | 0…1500 W/m2 | <3% |
| Parameter/ Day (Airflow Rate) | 11 October (158 m3/h) | 12 October (203 m3/h) | 13 October (250 m3/h) | 14 October (296 m3/h) | 15 October (354 m3/h) | 16 October (397 m3/h) |
|---|---|---|---|---|---|---|
| Ambient temperature (°C) | 26.5 | 25.2 | 28.1 | 28.4 | 21.5 | 21.8 |
| Solar radiation intensity (W/m2) | 770.7 | 785.8 | 758.9 | 719.4 | 771.0 | 755.7 |
| Wind velocity (m/s) | 0.32 | 0.46 | 0.35 | 0.17 | 0.13 | 0.15 |
| Parameter/ Day (Airflow Rate) | 18 October (154 m3/h) | 19 October (205 m3/h) | 20 October (254 m3/h) | 21 October (302 m3/h) | 23 October (350 m3/h) |
|---|---|---|---|---|---|
| Ambient temperature (°C) | 22.6 | 25.1 | 23.7 | 28.4 | 22.8 |
| Solar radiation intensity (W/m2) | 681.9 | 659.7 | 685.6 | 684.5 | 617.8 |
| Wind velocity (m/s) | 0.21 | 0.16 | 0.11 | 0.12 | 0.27 |
| Parameter/ Day (Airflow Rate) | 11 October (158 m3/h) | 12 October (203 m3/h) | 13 October (250 m3/h) | 14 October (296 m3/h) | 15 October (354 m3/h) | 16 October (397 m3/h) |
|---|---|---|---|---|---|---|
| ΔT = Toutlet − Tinlet (°C) | 18.1 | 13.9 | 13.4 | 12.6 | 11.2 | 10.2 |
| Absorber plate temperature (°C) | 57.8 | 54.6 | 53.3 | 48.7 | 41.5 | 39.5 |
| Parameter/ Day (Airflow Rate) | 18 October (154 m3/h) | 19 October (205 m3/h) | 20 October (254 m3/h) | 21 October (302 m3/h) | 23 October (350 m3/h) |
|---|---|---|---|---|---|
| ΔT = Toutlet − Tinlet (°C) | 13.2 | 9.6 | 9.6 | 8.1 | 5.4 |
| Absorber plate temperature (°C) | 52.7 | 48.9 | 44.9 | 43.9 | 39.3 |
| Envelope Component | Thermal Resistance (m2 °C/W) |
|---|---|
| wall | 1.47 |
| floor | 0.30 |
| roof | 1.47 |
| window | 0.59 |
| door | 0.82 |
| solar wall | 1.33 |
| Parameter/Configuration (Day) | Without GTC (10 May 2021) | Without GTC (11 May 2021) | With GTC (18 May 2021) |
|---|---|---|---|
| ambient temperature (°C) | 18.9 | 18.8 | 21.8 |
| solar radiation intensity (W/m2) | 411 | 410 | 387 |
| Energy Consumption/ Configuration (Day) | Without GTC (10 May 2021) | Without GTC (11 May 2021) | With GTC (18 May 2021) |
|---|---|---|---|
| Container heating (kWh) | 1.12 | 1.23 | 0.94 |
| Hour/Configuration (Day) Temperature (°C) | Without/With GTC (15 April 2021) | Without/With GTC (16 April 2021) | Without/With GTC (21 April 2021) | Without/With GTC (18 May 2021) |
|---|---|---|---|---|
| 8 | 7.3/9.4 | 6.5/9.3 | 11/12.2 | 16.5/17.7 |
| 9 | 8.4/11 | 9.7/18.1 | 14.1/21.0 | 19.8/23.9 |
| 10 | 9.3/12.4 | 12.5/27.0 | 16.7/26.8 | 22.2/30.2 |
| 11 | 11.9/17.2 | 13.8/28.1 | 17.8/28.9 | 23.9/34.5 |
| 12 | 15.1/25 | 17.6/35.6 | 21.0/35.5 | 25.3/37.0 |
| 13 | 17.1/30.7 | 17.6/33.7 | 19.5/30.3 | 26.6/37.4 |
| Hour/Configuration (Day) Ventilation Load (W) | Without/With GTC (15 April 2021) | Without/With GTC (16 April 2021) | Without/With GTC (21 April 2021) | Without/With GTC (18 May 2021) |
|---|---|---|---|---|
| 8 | 354/304 | 374/306 | 265/236 | 133/104 |
| 9 | 328/265 | 296/94 | 190/24 | 53/- |
| 10 | 306/231 | 229/- | 128/- | -/- |
| 11 | 243/116 | 198/- | 101/- | -/- |
| 12 | 166/- | 106/- | 24/- | -/- |
| 13 | 118/- | 106/- | 60/- | -/- |
Publisher’s Note: MDPI stays neutral with regard to jurisdictional claims in published maps and institutional affiliations. |
© 2022 by the authors. Licensee MDPI, Basel, Switzerland. This article is an open access article distributed under the terms and conditions of the Creative Commons Attribution (CC BY) license (https://creativecommons.org/licenses/by/4.0/).
Share and Cite
Teodosiu, C.I.; Sima, C.; Croitoru, C.; Bode, F. Experimental Investigation and Optimization of a Glazed Transpired Solar Collector. Appl. Sci. 2022, 12, 11392. https://doi.org/10.3390/app122211392
Teodosiu CI, Sima C, Croitoru C, Bode F. Experimental Investigation and Optimization of a Glazed Transpired Solar Collector. Applied Sciences. 2022; 12(22):11392. https://doi.org/10.3390/app122211392
Chicago/Turabian StyleTeodosiu, Catalin Ioan, Catalin Sima, Cristiana Croitoru, and Florin Bode. 2022. "Experimental Investigation and Optimization of a Glazed Transpired Solar Collector" Applied Sciences 12, no. 22: 11392. https://doi.org/10.3390/app122211392