1. Introduction
Computational Intelligence is well established and pervasive in technological and social contexts, providing the highest benefit to address those problems for which a useful mathematical modeling is not available or too complex to be practical. Network security is one such field. Specifically, traffic monitoring and analysis are key security functions of modern networks that lend themselves naturally to being implemented by exploiting computational intelligence tools.
Broadly speaking, traffic monitoring and analysis consist of observing network traffic flows and applying classification to identify different types of flows, e.g., with respect to management of differentiated quality of service or in relation with security functions. As for the latter application, identification of anomalous or malicious traffic is the primary goal. Such traffic may consist of isolated packets or complex flows, depending on the purpose of the attack and its complexity. The aim of automated tools to identify anomalous and malicious traffic can be:
to assist network operator staff in network management and safeguarding of services;
to filter/mark/block suspicious traffic;
to identify different attacks for network diagnostics and reporting or to strengthen defenses in an optimized way, given the available resources;
to provide robust self-management of networks.
Network traffic attacks are most prominent in wireless networks, e.g., WiFi networks. The pervasive nature of this kind of access, and in general, the increasing reliance on access networks for accomplishing more and more tasks both in professional and personal contexts, set a strong demand for robust networks, able to identify and block even sophisticated attacks in an automatic way. The widely available computing and processing power of networking elements inevitably shifts the highest interest in machine learning-based approaches. This kind of approach is further fostered by considering that identifying and classifying network traffic attacks does not lend itself to mathematical modeling as laws of Physics would do. On the other hand, anomalous and even malicious behavior can be revealed with respect to regular traffic, as a long series of works over the last two decades have shown. In other words, the information to identify attacks is essentially there, yet it is not easy at all to extract the relevant information and to exploit it.
We have already shown in [
1,
2] that many attacks on WiFi networks can be identified with very high success probability by means of classification algorithms looking at a single packet (more precisely, MAC frame in the WiFi context) at a time. When scanning the traffic over the wireless channel, each single packet can be labeled as being regular traffic or belonging to one of several different attack types. For many attack types, this kind of classification is very promising, exceeding success ratio levels of 90% or 95%.
There are, however, other attacks that cannot be easily identified. This depends mostly on the fact that those attacks are mounted by means of several steps, each one involving one or possibly more packet exchange(s) between the attacker node and its victims. What is lacking in single-packet analysis is a way to unveil the structure of the attack evolution over multiple packets, thus taking care of modeling relations between entities in the specific input domain.
To overcome this limitation, in the present work, we consider sequences of packets captured from the network traffic. In addition, however, rather than working on sequences of packets (as already explored in [
3]), we derive graphs from ordered sequences of packets being transmitted over the network and use elements of those graphs to build an alphabet of symbols to encode the information carried in the traffic stream useful to classify attacks.
The purpose of this work is to compare a multi-labelled Granular Computing-based approach with a conventional Graph Neural Network, in order to perform network traffic classification. Specifically, we aim to study network anomalies from a higher semantic level, described by network graphs directly built from buffered frames captured from a monitor host. For this purpose, the main contributions of this paper are described as follows:
We introduce a structured domain representation by a preprocessing strategy able to extract weighted network graphs directly from buffered frames;
We formally define the network anomaly detection problem as a non-exclusive supervised problem in graph domain;
We introduce a Granular Computing approach in the graph domain aimed at network traffic anomaly detection and automatic analysis;
Furthermore, we provide an extensive analysis of two consolidated approaches revised to work in a multi-label context, the aforementioned Granular Computing-based one and a genetically optimized Graph Neural Network;
Next, we show experimental results and performance analysis of such two consolidated approaches for graph machine learning, applied to network traffic classification.
Lastly, we describe the model interpretability and knowledge discovery capabilities of the considered approaches, as applied to the specific application domain of network traffic anomaly detection.
These contributions are particularly important in order to build prediction systems that are able not only to achieve state-of-the-art performances as other analyzed works, but also to keep focus on improving models’ human interpretability, obtaining further semantic insights on the analyzed data.
The remainder of the paper is organized as follows: In
Section 2, we summarize a review of recent works focusing on machine learning on structured domains and anomaly detection in telecommunications networks, particularly concerning IEEE 802.11 networks. Next, in
Section 3, we describe the dataset used, introducing the dissimilarity measures adopted in the starting features space and in the graph structured domain, and explaining the sequences to graphs procedure along with the supervised problems we are going to test. In
Section 4, we detail how the GRALG classification system works, by formally recalling each key component behavior and describing its application on the target dataset. In
Section 5, we perform an overview of the GNN architecture used as baseline to compare results with GRALG. Furthermore, in
Section 6, we outline results analysis, comparing performances obtained with other state-of-the-art papers and previous works. Lastly, in
Section 7, we sum up details concerning proposed solutions, along with results analysis obtained so far, and provide further points for future works.
2. Related Works
Recent developments in communication networks allowed us to build faster and more reliable communication services which can be accessed more easily and safely thanks to several security protocols available.
The complexity of this new kind of technology requires new approaches to perform monitoring, anomaly detection and intrusion detection both to evaluate Quality of Service Key Performance Indicators [
4,
5] and to check activity from potential attackers [
6,
7].
Furthermore, since this aspect concerns both wired and wireless communications technologies, new paradigms are studied in both ways, such as Software Defined Networking (SDN). In fact, Segura et al. in [
6] provide a study concerning the usage of the SDN paradigm to perform both centralized and distributed intrusion detection in resource-constrained wireless networks.
High data rate, low latency, and high volumes of data require a set of processing techniques that should be easily scalable both in terms of capacity and functionality. For this purpose, adaptive signal processing and machine learning provide exactly these kinds of capabilities, thanks to the possibility to build models from sets of examples and multiple ways to scale to previously unseen situations.
Dietz et al., for example, studied machine learning-based performance prediction algorithms for SDN environments [
8], providing case studies both on real and synthetic networks. Results taken from a centralized and a distributed architecture show the feasibility to perform network status prediction based on the considered features.
In this context, wireless communications are a flexible technology able to connect different kinds of devices, from enterprise environments to industrial Internet of Things. Both 5G and IEEE 802.11 WiFi standards offer key capabilities for deployment in such scenarios, so they are subject to constant security reviews.
In fact, in [
9], in order to perform a security analysis of the 5G Core Network components, the authors employ a machine learning approach to assist in the definition and processing of attack graphs. In this way, they have been able to find multiple vulnerabilities and novel attacks on the Authentication and Key Agreement protocol.
Concerning IEEE 802.11 WiFi networks, attack analysis and intrusion detection have been particularly studied.
Starting from the publication of the Aegean WiFi Intrusion Detection dataset in [
10], multiple works have tackled the problem. Notably, in [
11], Kolias et al. proposed a new approach based on Particle Swarm algorithms able to achieve an interesting level of accuracy and, at the same time, generate a set of
IF-THEN human-readable rules.
Despite multiple works having achieved interesting results by processing individual network packets and frames (e.g., by means of several techniques not only related to Deep Learning [
12,
13]), processing network flows is still required to achieve state-of-the-art performance able to handle deployments in real scenarios [
14].
Moreover, it is important to notice the changes, which are constantly evolving, that network technology and services are subject to, due to evolving quality of service and security requirements. Hence, computational intelligence models further require increasingly-deeper knowledge discovery capabilities, simplifying human interpretability and support in decision-making. As an attempt to overcome this limitation, in this work, we further study these kinds of problems, redefining the original supervised problem in the graph domain. This allows us to model the relationships linking raw WiFi frames, with a Granular Computing-based approach able to describe network status on multiple semantic levels. Graph signal processing and machine learning are a florid research field when it comes to dealing with structured data such as graphs. These kinds of approaches have been proven successful in multiple scenarios, from bioinformatics to social networks [
15].
In our case, we aim to represent the specific status of the target WiFi network as a graph, defined in a precise time interval. This graph represents what is happening in the network in terms of multiple parameters (such as exchanged data and delay).
To do so, we employ two consolidated techniques: the first one based on a Granular Computing approach [
16], and the second one based on Graph Neural Networks [
17].
In this way, we can perform a deep analysis of the two different approaches in terms of:
3. Dataset Description
The present work is the result of a set of research efforts that began in [
1], aiming to improve automatic network traffic recognition in different situations. Specifically, in this case, we aim to recognize attacks on the network infrastructure by defining a supervised problem in a non-metric space. The elements of the input space are graphs representing how information flows through the network in a specific time frame.
Simulations have been performed on the Aegean WiFi Intrusion Detection Dataset (
http://icsdweb.aegean.gr/awid/ accessed on 20 August 2022) [
10] that is a rigorous attempt to capture the inner workings of a WiFi Small Office Home Office (SOHO) network environment. Basically, it includes heterogeneous legit devices (such as smartphones, workstations and other smart devices), along with the attacker WiFi station and monitoring device to capture frames exchanged by other stations.
The WiFi network setup used in the collection of AWID data employs the WEP security protocol to secure information traffic. This choice arises from the need to be able to deeply study multiple kinds of attacks while keeping frame capture and labeling procedures as simple as possible. This dataset gives valuable insights into the anomaly and attack detection problem in WiFi networks thanks to the large number of details included for each captured MAC frame (i.e., more than one hundred features). Moreover, fourteen different types of attacks have been implemented as well as realistic production of legitimate traffic flows. The extensiveness of considered scenarios and the abundant data made available with the AWID dataset make it a useful tool to assess algorithms validation both in terms of classes recognition capabilities and in terms of management of a huge amount of data.
Frames are divided into fifteen classes, hierarchically organized in the following four macro-classes:
Flooding: Attacks of this kind exploit unauthenticated management and control mechanisms [
18] by forging vast amounts of frames in order to disrupt communications by flooding the available medium. These kinds of attacks can be used to build more sophisticated strategies, such as in WiFi
Impersonation attack scenarios.
Frame Injection: This macro-class includes attacks that exploit vulnerabilities in the WEP security cryptographic protocols. More in depth, the attacker uses the Access Point (AP) as an oracle to check cryptographic correctness of frames. Repeating this process multiple times, the attacker can retrieve cryptographic key material information.
Impersonation: This set of attacks is a key component to prepare more complex adversary scenarios, where the attacker tries to impersonate the access point by exploiting similar vulnerabilities as described before.
Normal: Lastly, this macro-class collects network traffic of legitimate users connected through multiple smart devices.
The present work has been developed by employing a subset of the AWID dataset, containing patterns of 15 classes (which distribution has been detailed in
Table 1).
3.1. Dissimilarity Measure
Captured MAC frames (generically referred to also as “packets” in the following) include a variety of features describing different fields with different numerical needs.
Designing an appropriate dissimilarity measure (non necessarily metric) for the problem and data at hand is a key facet for the success of any pattern recognition system. Furthermore, it is possible to define parametric dissimilarity measures thanks to a weighting vector
[
19].
As shown in
Table 2, we consider patterns composed by a mixture of numerical (integer- or real-valued), discrete nominal and Boolean features. Furthermore, for the purpose of this work, numerical features are assumed to be normalized in
. To perform processing on patterns (i.e., packets) defined in the starting features space, we adopt the following dissimilarity measure (already proposed in [
1,
2,
20]) ad-hoc tailored to this heterogeneous structure. Let
and
be two generic patterns, then:
if the
ith feature is numerical, the dissimilarity between homologous features reads as their absolute difference:
if the
ith feature is nominal or Boolean, the dissimilarity between homologous features reads as the discrete distance:
Finally, if we allow each feature to be weighted independently by means of a weighting vector
, the overall dissimilarity measure reads as:
where
n is the number of considered features. Since each dissimilarity measure between homologous features (see Equations (
1) and (
2)) assumes values in
, it is straightforward to prove that Equation (
3) also assumes values in range
.
3.2. Dynamic Time Warping
The preprocessing phase requires dealing with structured data in the form of sequences of packets. In order to be able to compare these kinds of objects and evaluate distances, we introduce the Dynamic Time Warping (DTW) algorithm [
21]. The DTW algorithm is a function
which maps a pair of sequences to a non-negative real-valued dissimilarity value (that can be further normalized). Formally, it is defined as the solution of the following optimization problem:
where
is a suitable cost function (i.e., a dissimilarity measure between sequence’s elements),
is the alignment path, and
is the set of all admissible paths between sequences
s and
t. Such optimization problem can be solved in multiple ways, among which we choose the dynamic programming one (synthesized in Algorithm 1). Recalling that sequences are made of structured data that represent WiFi frames, the dissimilarity measure
in Equation (
4) is the one described in
Section 3.1 (namely, Equation (
3)):
| Algorithm 1: DTW Routine |
![Applsci 12 11303 i001]() |
3.3. Graph Edit Distance
Graph Edit Distances (GEDs) [
15,
22,
23] are dissimilarity measures belonging to the wide family of edit distances, extending a set of consolidated and well-known dissimilarity measures defined on sequences (e.g., the Levenshtein distance [
24]) towards graphs. If in a discrete finite domain, such as the string domain, the edit distance can be simply evaluated as the minimum number of insertions, substitutions and deletion of letters needed to transform a given string into a target one, the same does not hold where annotations of atomic objects can be equipped with arbitrary data structures. In other words, the “exactness” of a match is always guaranteed in the string domain (i.e., two letters are the same or not), but it is rarely guaranteed in the graph domain (i.e., only in cases when nodes and/or edges are equipped with categorical attributes).
Amongst the several GEDs available in the literature, our choice fell on the node Best Match First (nBMF) GED. In short, the nBMF similarity measure starts by matching (in a greedy manner) most similar nodes first, where the similarity between nodes is evaluated thanks to a suitable dissimilarity measure
. Then, possible edges between each pair of previously-found similar nodes are searched for in both graphs to be compared: if found, this counts as an edge substitution whose cost is given by a suitable dissimilarity measure
defined on the edge labels domain. The difference between the order of the two graphs accounts for the nodes’ deletion and insertion, whereas the existence of induced edges in only one of the two graphs yields an edge deletion or insertion. Full mathematical details on nBMF can be found in [
25].
As will be clear in
Section 3.4, in this work, we deal with graphs whose nodes are equipped with MAC addresses and whose edges are equipped with a 6-elements real-valued vector. Therefore, we let
be the discrete distance (i.e., the dissimilarity is 0 or 1 depending on whether the two nodes
and
share the same MAC address or not) and we let
be the
-norm between the feature vectors of two given edges
and
.
3.4. Buffering and Graphs Building Procedure
As anticipated, many research works focused on single-frame analysis [
1,
2,
10,
14,
20], mainly highlighting that a subset of attacks can be effectively identified on a per-frame basis. As instead, in this work, we perform a study of the anomaly detection problem in WiFi networks expressed in the graph domain.
To this end, we define a preprocessing strategy that builds a new dataset, starting from a simple First-In-First-Out (FIFO) queue that collects B consecutive packets captured on the channel. We use this buffer as a B-length window that we slide over the time series of captured packets in order to build a new dataset made of sequences of packets. Meta-data are attached to each captured packet in the original dataset, assessing whether that packet belongs to legitimate traffic or, if it is an attack packet, what kind of attack it belongs to. Since each sequence could contain packets belonging to different classes, the new sequence-based dataset will be labeled in a non-exclusive manner, thus associating multiple labels to each sequence.
At this point, we introduce the graph building procedure, which aims to extract the information brought by sequences built from the FIFO buffer and to build a corresponding graph for each sequence. Let us consider a sequence
of length
B. Formally, we define the mapping
, which associates the set of sequences
with the set of graphs
. Each graph
includes nodes corresponding to all MAC addresses found in frames that belong to
, and edges defined by the source–destination MAC addresses pairs found in the frames of the sequence
. Each edge, then, is weighted with a vector of elements described by the following equation:
where
i and j refer to MAC addresses found in frames belonging to ;
and are respectively the normalized mean length and payload size of frames sent on that link;
is the normalized mean of the received signal strength for that frame (taken from the field
radiotap.dbm_antsignal listed in
Table 2);
and are respectively the normalized mean sequence number and fragment number for data frames on that link;
is the average time of arrival of frames on that link.
The whole sequence-to-graphs transformation is sketched in
Figure 1. Lastly, by using a multi-label iterative stratification procedure [
26], we perform training (
), validation (
), and test (
) set splitting for the proposed experiments. Brief dataset statistics are resumed in
Table 3.
3.5. Training Set Compression in Sequences Domain
The amount of (structured) data contained in the training set boosts the complexity of the whole training procedure. In order to improve processing speed and overall accuracy, we aim to reduce this complexity by performing a compression stage on the training set.
The compression strategy consists of the execution of the Basic Sequential Algorithmic Scheme (BSAS) [
27]. BSAS is a clustering algorithm that aims to isolate per-label cluster representative patterns [
28] to build a new compressed training set.
This step is performed in the sequence domain since the dissimilarity measure in
Section 3.1 and the DTW in
Section 3.2 for this kind of structured data do not require specific critical parameter tuning, especially if compared to the GED in
Section 3.3.
The BSAS hyperparameters have been chosen as follows:
maximum cluster radius ;
maximum number of allowed clusters .
Two values of have been used in order to study two kinds of scenarios that is a strongly compressed training set and a larger one.
3.6. Supervised Exclusive and Non-Exclusive Problems Definitions
In this section, we formally introduce the supervised problems that we are going to explore and analyze in this paper.
Due to the complexity of non-exclusive (multi-label) supervised problems, we need to define a baseline problem in order to be able to compare testing results. To this end, we aim to verify classification accuracy of the proposed approach in a basic situation where the main objective consists of distinguishing normal traffic from anomalies.
The problem is defined as the search of the best set of hyperparameters so that we can effectively approximate the target process , which maps to each instance of the input space X, a specific label of the set .
Hence, all traffic flows belonging to any kind of anomaly/attack form a single class in this problem statement. In this way, we can perform a starting analysis of the Granular Computing capabilities of the GRALG classification system, trying to isolate key substructures of complex, heterogeneous network traffic.
To further improve the above definition, we consider that the analysis on different semantic levels of telecommunication networks implies the association of a set of labels to each kind of structured data that represents multiple network packets.
For this reason, we tackle a new supervised problem where each network graph of the starting structured space is mapped to a multi-label (a specific set of labels) that belongs to . In this way, we build a system that automatically learns this association and tries to give insight into label relationships.
Lastly, by considering the different nature of the two supervised problems, we take into account the mean accuracy and the Jaccard similarity score as performance metrics. The rationale behind these choices follows. Since the number of instances per class are unbalanced, a mean accuracy measure is required in order to avoid implicit weighting phenomena. On the other hand, the non-exclusive supervised problem requires a specific performance metric, namely the Jaccard similarity score [
29], which is defined as follows:
The definition holds for a specific pair of multi-labels . This measure can be extended to the entire dataset, by taking the mean value of all the measures obtained.
4. The GRALG Classification System
Granular Computing Approach for Labelled Graphs (GRALG) is a classification system suitable for dealing with (fully) labelled graphs grounded on the Granular Computing paradigm [
30,
31]. GRALG was originally proposed in [
32] and later improved in [
33,
34,
35,
36,
37,
38], addressing some computational drawbacks in the original implementation. As anticipated, GRALG follows the Granular Computing paradigm, hence it aims at automatically extracting pivotal mathematical entities known in the technical literature as
information granules, able to characterize the data at hand as much as possible. GRALG exploits such information granules in order to cast the graph classification problem towards a Euclidean space, where standard statistical pattern recognition tools can be used without alterations. To accomplish these tasks, GRALG relies on four macro-blocks, described in the following
Section 4.1,
Section 4.2,
Section 4.3 and
Section 4.4 and highlighted in
Figure 2, whereas, in
Section 4.5, we describe how the four blocks cooperate in order to synthesize the classification model. In the following, we give an overview of the GRALG classification system, highlighting its main characteristics, and we refer the interested reader to our previous works for a thorough description. Let us recall the graph dataset
to be partitioned into three non-overlapping sets, namely the training (
), validation (
) and test set (
).
4.1. Extractor
The Extractor block is in charge of extracting from graphs in a suitable set of candidate information granules. With graph classification problems, suitable information granules can be intended as pivotal, meaningful and/or recurrent subgraphs drawn from the training data.
Due to the relatively small size of the training graphs, GRALG populates the set of candidate information granules thanks to an exhaustive extraction of the subgraphs belonging to the training graphs, up to a maximum order of five nodes per subgraph.
4.2. Granulator and Alphabet Synthesis
The set of candidate information granules
is forwarded to the Granulator block, which is in charge of extracting a suitable subset
of meaningful granules of information to be collected in an alphabet of symbols
. In order to accomplish this task, the Granulator runs a clustering procedure [
16] and the representative elements of well-formed clusters are considered as meaningful granules of information.
Specifically, the Granulator receives from the Extractor block and runs a Basic Sequential Algorithmic Scheme (BSAS) free-clustering procedure on it. BSAS is driven by the following inputs:
a dissimilarity measure between graphs;
a value which determines the maximum radius of the resulting cluster;
a value Q which determines the maximum number of clusters that can be spawned;
a suitable way to determine the representative element of a cluster: since BSAS will work in the graph domain, the choice fell on using the medoid of each cluster as its representative element [
39].
In order to analyze the data at different levels of granularity (i.e., resolution), BSAS runs several times for different values of
. Without loss of generality, the considered values of
are collected in a vector
. Regardless of the value of
, each cluster in each partition is then evaluated by means of a cluster quality index that jointly takes into account its cardinality (i.e., number of patterns) and compactness (i.e., average pattern-to-center distance) and only the centers of well-formed (i.e., compact and populated) clusters are admitted to be part of the alphabet. Mathematically speaking, the cluster quality index is defined as:
namely, as a linear convex combination between the compactness of the cluster
and its cardinality
weighted by a trade-off parameter
. The compactness of the cluster is defined as the average pattern-to-center distance:
where
is the
ith pattern of cluster
, and
is the representative element of the cluster. Instead, the cardinality of the cluster is defined as the relative size of the cluster
with respect to the overall number of candidate information granules:
Since both and are negative-oriented, a cluster is considered for being part of the alphabet if and only if its quality index is below a threshold . The medoids whose clusters satisfy such condition compose the alphabet of symbols .
4.3. Embedder
The set of granules of information collected in the alphabet is exploited by the Embedder block in order to build an embedding space in which classification can be performed by means of any statistical pattern recognition system available in the current literature.
To do so, the Embedder exploits the so-called symbolic histograms [
36], defined as an integer-valued vector containing the number of occurrences of each symbol in
within the graph
to be embedded, i.e.,:
where
is the alphabet of symbols and where
is the enumeration function that counts the number of times each symbol
appears in
. The counting procedure, in turn, exploits the same dissimilarity measure
already used in the Granulator block in order to seek for an (inexact) match between the symbols under analysis
and the constituent parts of the graph
to be embedded. If the dissimilarity measure is below a given value
, a match is considered as a ’hit’ and a new occurrence is found. In order to scale the matching threshold in a symbol-aware fashion, we set:
where
is the cluster whose representative element is
, and
is the compactness of the cluster (see Equation (
8)).
The symbolic histogram in Equation (
10) is evaluated for all graphs in
yielding the instance matrix
, suitable to train the classifier.
4.4. Classifier
The Classifier receives
from the Embedder block and trains a classification system on
. Eventually, the classifier also receives the embedded version of
(i.e.,
) to address the performance of the classifier. In this work, the classifier is set as a simple
K-Nearest Neighbours (
K-NN) decision rule [
40] with
.
4.5. Model Training and Testing
The model training starts with the Extractor block, which returns the set of candidate information granules .
In order to optimize the parameters of the overall system to maximize the performance of the classifier, a genetic algorithm [
41] is used. Each individual from the evolving population is identified by a genetic code of the form
where:
is the maximum number of allowed clusters for the BSAS clustering algorithm;
is the compactness-vs.-cardinality weight in Equation (
7);
is the threshold for discarding unpromising clusters when it comes to build the alphabet ;
, , , , , are the six GED weights for insertion, deletion, substitutions of nodes and edges.
Each individual from the evolving population:
runs the Granulator;
runs the Embedder;
runs the Classifier;
and the performance of the Classifier in correctly predicting the labels in , joined with the alphabet cardinality, marks the fitness function of the individual.
At the end of the genetic optimization, one obtains the optimal alphabet
and the two embedded matrices
and
against
. In order to further reduce the size of the alphabet, a second lightweight genetic algorithm can be employed for feature selection. In this case, the genetic code reads as a binary mask:
and each individual from the evolving population:
receives and ;
projects and on the subspace spanned by 1’s in its genetic code (i.e., binary mask), yielding and ;
trains the classifier on , evaluates its performance on , and, along with the alphabet cardinality, yields the fitness function for the individual.
At the end of the second genetic optimization, we retain the reduced alphabet and the training set instance matrix embedded against . The classifier, trained on , is finally tested on (i.e., instance matrix obtained by embedded against ), yielding the final performance on the test set of the synthesized classification model.
6. Results
In this section, we outline the experimental results obtained over the AWID dataset introduced in
Section 3. Specifically, we show two sets of experiments, namely the binary classification problem and the non-exclusive one (see
Section 3.6).
By considering the parameters involved in the whole processing stage, we identified six different simulation setups for and .
As regards the classification capabilities of the two models, final results are expressed in terms of mean accuracy and Jaccard similarity score (binary and non-exclusive classification problem, respectively). Conversely, as regards the model complexity, alphabet cardinality and the number of GCN layers serve as performance indices for GRALG and GNN, respectively.
Table 4 shows that, despite the difficulty to deal with such a complex problem, results are comparable with those obtained in [
3]. This is particularly true if the granulated training set is big enough to bring a fair amount of information from the entire training graphs. Indeed, both solutions seem sensitive to the number of graphs in the training set. The GRALG classification system outperforms the GNN when the buffer length
B used to build the graphs is bigger than or equal to 20 frames.
The model complexity obtained for the binary supervised problem is shown in
Table 4. Since the number of dense layers is fixed, the GNN complexity reads as the number of GCN layers chosen by the genetic algorithm in the interval
. Our results show that the optimization procedure converges to 2 or 3 layers.
More precisely, we can obtain an estimate of the asymptotic complexity of the GNN by taking into account Graph Convolution Layer and Dense Layer sizes:
where
is the number of GCN layers of the network,
C is the numbers of input channels,
F is the number of features maps,
,
and
are the sizes of the first, second and last dense layers, respectively (in our case, 32, 16 and 1, respectively).
As GRALG is concerned, instead, the alphabet cardinality marks the dimensionality of the embedding space. If compared with our previous analysis (i.e., performed by buffering a sequence of packets with no transformation towards the graph domain [
3]), we can see that the resulting alphabet is larger, yielding embedding space(s) with more than 120 features (i.e., information granules), after the feature selection step. This represents a physiological increase in terms of model complexity due to the deeper topological information brought by graphs. Formally, we can formulate an upper-bound complexity estimate for GRALG with the following expression:
where
is the alphabet size, and
and
are contributions related to the two nBMF GED stages (i.e., edge matching and node matching, respectively).
Equations (
16) and (
17) are a parametric estimate of the complexity of both systems, useful to assess the trend of computing time as the size of the involved model and/or data grows. They show that the computational complexity of the proposed classification approach is polynomial in all system size parameters.
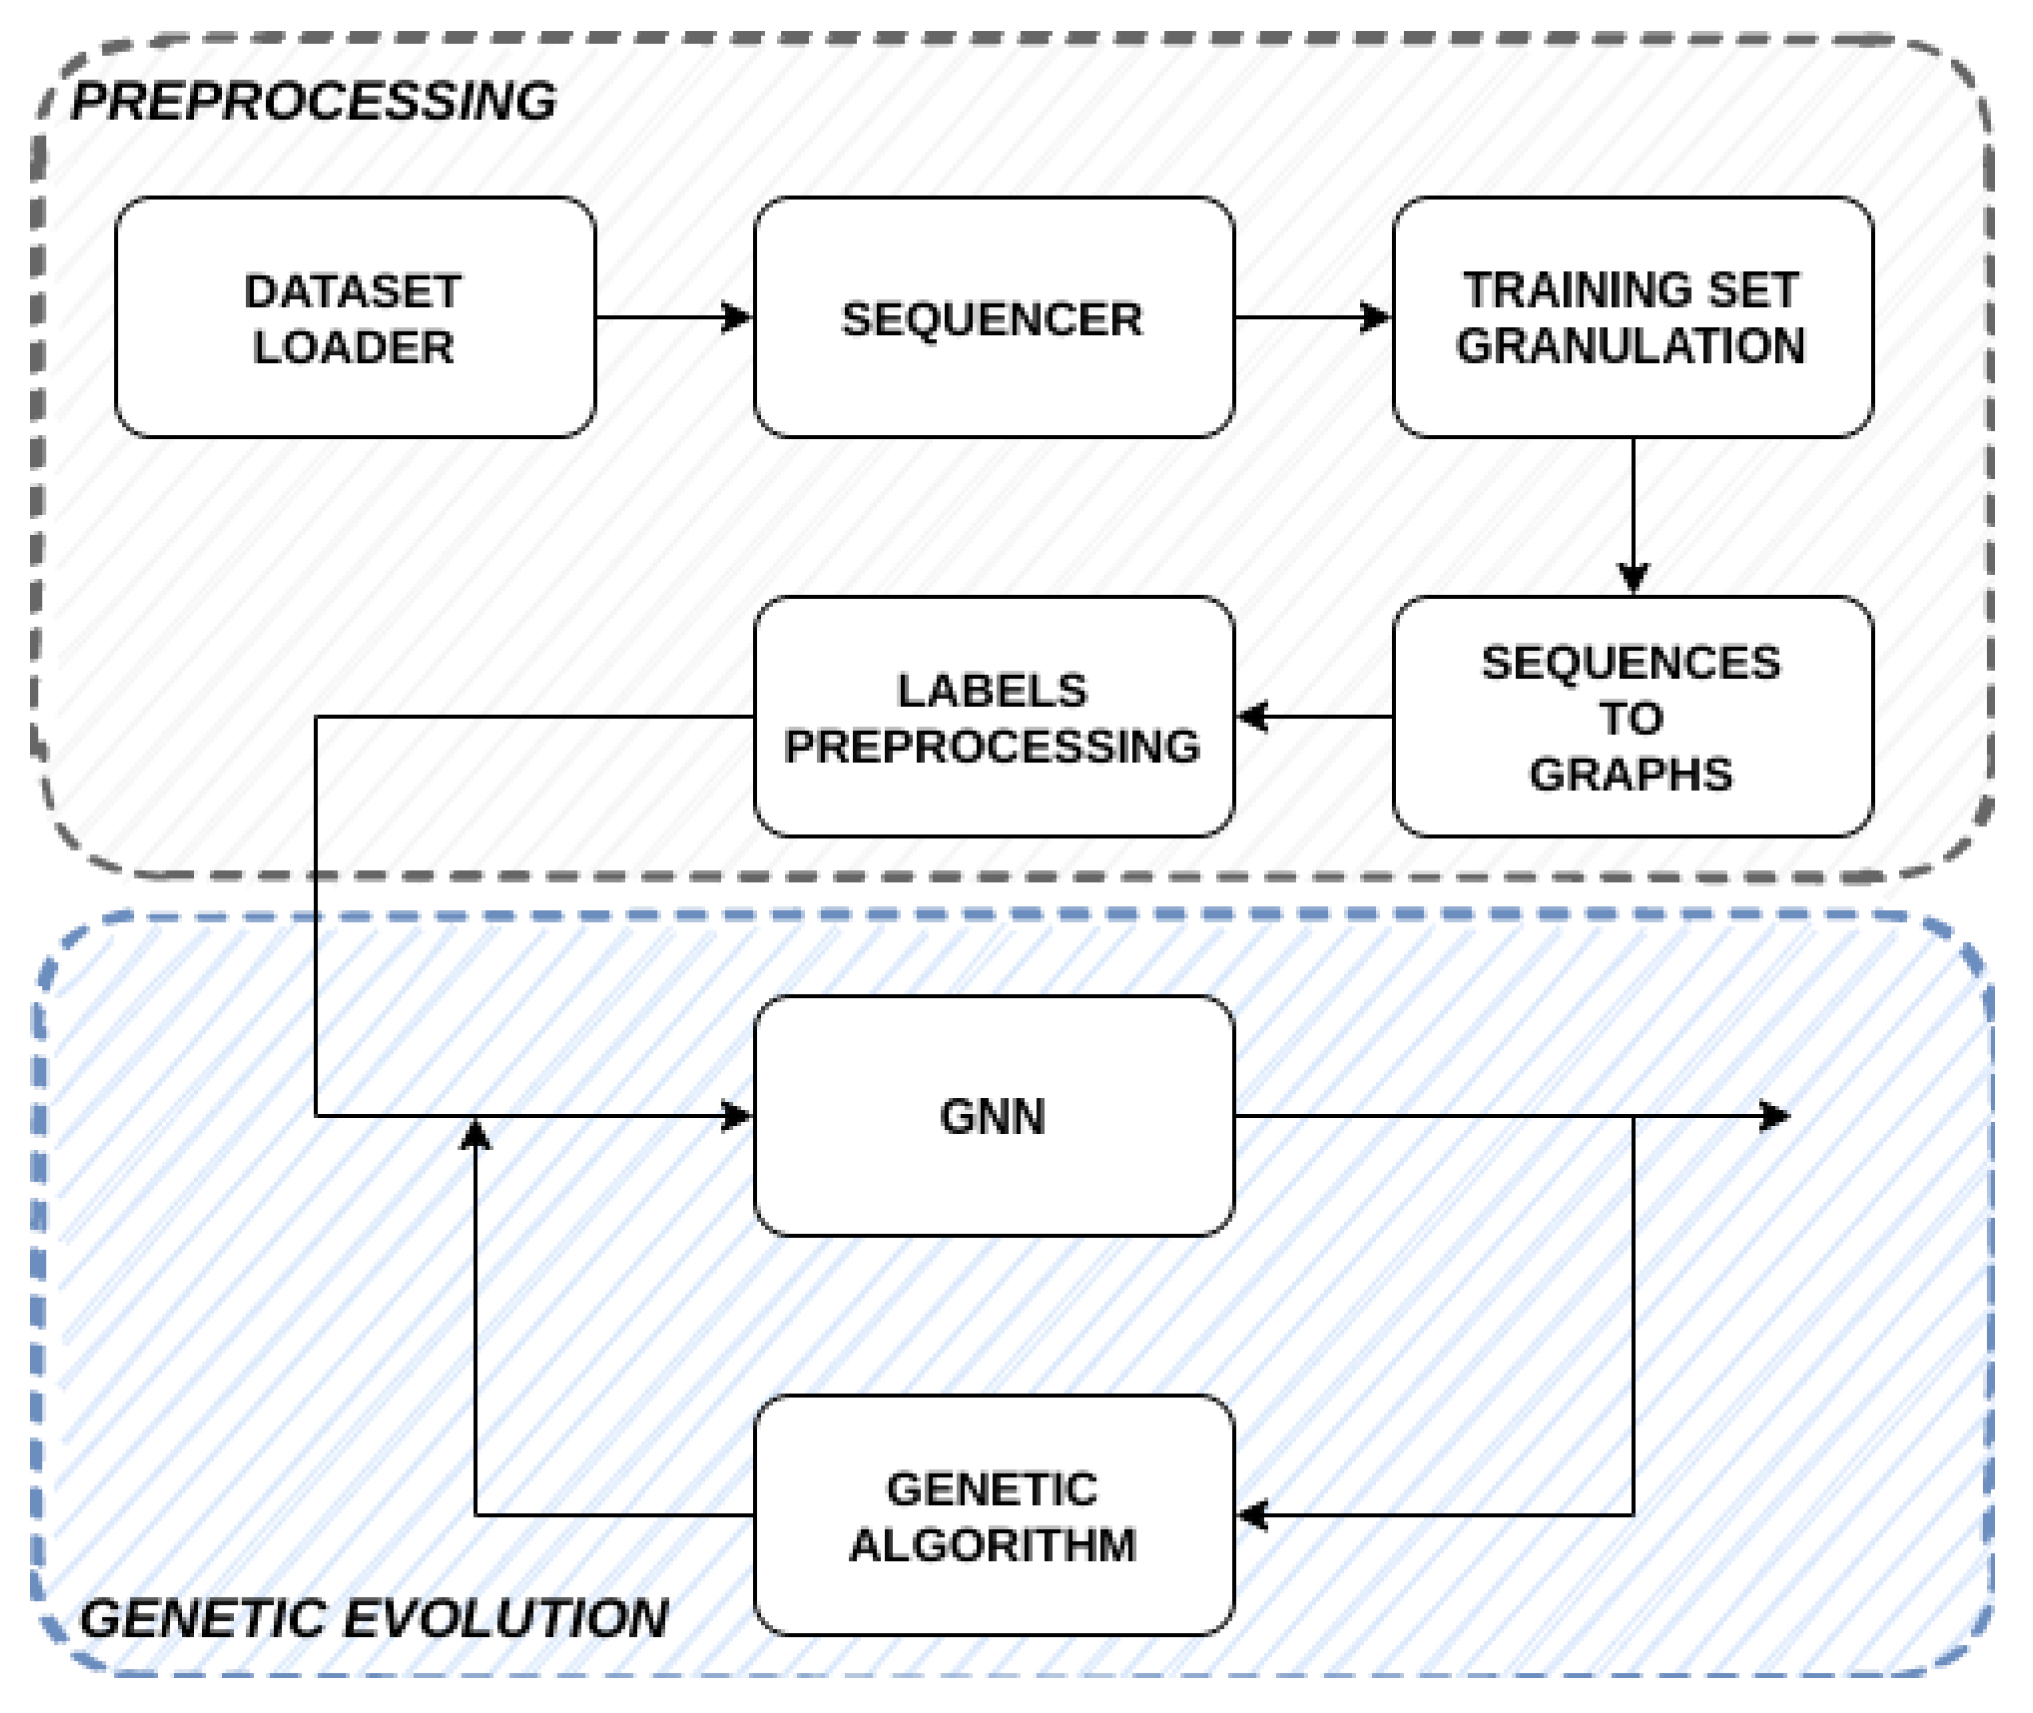
Numerical results shown in this paper have been obtained by using the Python programming language. A real-time implementation of the inference algorithm provided by the trained model requires a compiled high performance programming language such as C++, Rust or Go and a dedicated hardware platform, correctly provisioned with respect to the throughput of the network under attack.
Figure 5 illustrates a scheme of the processing flow of the proposed anomaly detection algorithms when applied in test mode, i.e., when looking at network traffic and using the trained classification algorithm to produce an inference. We believe that an implementation of the proposed model is affordable for most network device platforms (e.g., on board a WiFi router or a high-end WiFi Access Point). A lightweight design could also be conceived, trading-off the accuracy of the model predictions with its complexity, e.g., by reducing the cardinality of the symbol alphabet with genetic optimization, where the weight of complexity versus accuracy is used as a knob to manage the trade-off.
We can also observe that, in this first batch of simulations, the cardinality of the alphabet does not seem to be correlated to the buffer length. This is probably due to the fact that, given the small size of the network, the vast majority of the frames on the medium are from legit terminals. The graphs’ sizes seems to increase when the network is subject to flooding attacks, which try to disrupt correct communications behavior by sending multiple management or control frames (rts, cts or power_saving).
Table 5 shows the results on the non-exclusive supervised problem, where both solutions achieve a Jaccard similarity score of ∼70%, with the best ones achieved for buffer length
. A similar phenomenon has been observed in [
3], where a larger buffer length yields a larger amount of
normal traffic, which constitutes the majority of instances in the dataset.
The compressed training set cardinality plays a key role also in this case, with the GRALG classification system that is able to achieve interesting results with fewer examples, conversely to the GNN which requires a larger set of training graphs to learn from. Moreover, mean complexity value tends to be lower in this case than the binary supervised problem, with alphabet cardinality of ∼150 symbols and a number of GCN layers often equal to 2. This is mainly due to the greater complexity of the non-exclusive supervised problem, thus requiring further study and developments in classifying multi-labels. Moreover, decision surfaces of the non-exclusive problem are less defined and precise than those taken from the binary classification problem, resulting in slightly better performances in the latter case. As regards the model complexities, GRALG’s alphabet cardinality is high during the first optimization stage (in the order of hundreds of symbols), and correctly filtered in the second stage. Results also show that the GNN needs to process graphs mainly considering the second order neighborhood in order to maximize the performances: we think that this aspect is linked to the size of the network graphs themselves provided by the AWID dataset.
As anticipated before, if we consider the different nature of the supervised problems analyzed in this work, it is not possible to perform a direct and fair comparison with other works (a summary of which can still be found in
Table 6). This is due to multiple reasons: first, the supervised problem itself is defined in a completely different domain, in which aggregated data are represented with a graph structure; second, preprocessing patterns in the graph domain require the definition of a non-exclusive supervised problem, where a set of labels should be predicted for each graph instance; lastly, the purpose of the proposed Granular Computing approach consists of both building a human-interpretable white/grey box model and going towards state-of-the-art performances. Anyhow, we can make some considerations regarding currently used approaches and the impact of results. Thus, as a further performance assessment, in the following, we compare the results provided by our approach against those proposed in [
11,
14,
43,
44].
In [
10], Kolias et al. proposed the AWID dataset as a first benchmarking tool for WiFi network intrusion detection analysis. They performed a first analysis of supervised algorithms behavior on this kind of data. Results showed that
impersonation and
flooding attacks are the most difficult attack classes to recognize, along with the
normal class itself. In [
1], this result has been confirmed, while at the same time improving final accuracy and providing a first approach to automatic knowledge discovery, by means of a genetic optimization-based feature selection.
These results has been further confirmed in [
11], where, despite the resulting accuracy of ∼78%, the proposed algorithm has been able to build human readable
IF-THEN rules. In this work, instead of explicitly outputting human-readable rules, we aim to return the information granules of the optimal alphabet
resulting from the optimization process. This approach allows us to give insight into the network status, thus isolating key pieces of attack patterns and improving model and classes interpretability. A key aspect that we think is fundamental in this kind of scenario concerns the possibility to further exploit the knowledge discovery capabilities, applying them to analyze peculiar complex classes, e.g., the
normal one.
Multiple works included different approaches to implement data preprocessing and classification pipeline.
For instance, Qin et al. [
43] proposed a two-dimensional data cleaning preprocessing strategy able to introduce a new supervised problem which is then tackled with Support Vector Machines. Despite some difficulties in the correct recognition of
impersonation and
flooding attacks, it has shown interesting accuracy for the
normal traffic class. Both the GRALG classification system and the GNN are able to outperform Qin’s work in
impersonation recognition, for both the binary supervised problem and the non-exclusive one, with different values of the buffer length
B and the maximum number of clusters
.
A further analysis has been carried out in [
14], where, after a starting statistical analysis, Hidden Markov Models have been coupled with Kernel Density Estimation approaches to target the prediction of a subset of classes. Results obtained shows interesting precision and recall values for multiple classes (i.e.,
arp,
deauthentication), despite the false alarm rate that tends to be high for
impersonation attacks.
Both [
14,
43] did not cope with white box models, thus reducing knowledge discovery capabilities in their respective approaches. Although the use of queues in [
14] allowed the authors to perform processing on a higher semantic level, the knowledge discovery capabilities are limited due to the lack of an adaptive process. For this reason, in this work, we employed suitable evolutionary optimization procedures to find the best alphabet for each problem, yielding key subgraphs that characterize target anomalies.
In [
44], the authors employed a similar statistical preprocessing strategy to perform feature selection and fed training instances to an ensemble of classifiers, similarly as in [
1]. The whole classifier is made as an ensemble of techniques including Bagging [
45], Random Forests [
46] and Gradient Boosting [
47], from which the best is taken specifically for each class. Reported results include high level of accuracy and F1-score, and yet confusion matrices still show that
impersonation and
flooding attack introduce errors both in terms of false positives and false negatives. Despite processing single instances having the possibility to be effective with specific classes, it does not allow for discovering recurrent features on higher semantic levels, or taking into account the whole structure of the input instances’ space. This implies a loss of information when dealing with classes composed by structured exchange of data, thus limiting classification performances for complex anomalies and attacks such as
cafe_latte or
evil_twin. In fact, in this case, white box modeling capabilities are realized by means of random forests, which allow for exploiting key features during the training phase.
In order to improve knowledge discovery capabilities, in this work, we propose to take into account the possibility to model data transmission between network nodes. This is achieved by firstly performing a preprocessing strategy which aims to represent instances in the graph domain and then adopting a Granular Computing-based approach. In this way, the output of the training algorithm is able to return insights about the status of the network by means of recurrent and meaningful subgraphs, a feature completely lacking in all approaches that follow a single-packet analysis.


