Article

CBA-CLSVE: A Class-Level Soft-Voting Ensemble Based on the Chaos Bat Algorithm for Intrusion Detection

1
School of Information Engineering, Institute of Disaster Prevention, Beijing 101601, China
2
School of Cyberspace Security, Beijing University of Posts and Telecommunications, Beijing 100876, China
3
College of Information Science and Engineering, Xinjiang University, Urumqi 830046, China
*
Author to whom correspondence should be addressed.
Appl. Sci. 2022, 12(21), 11298; https://doi.org/10.3390/app122111298
Submission received: 18 September 2022 / Revised: 30 October 2022 / Accepted: 3 November 2022 / Published: 7 November 2022

Abstract

:
Various machine-learning methods have been applied to anomaly intrusion detection. However, the Intrusion Detection System still faces challenges in improving Detection Rate and reducing False Positive Rate. In this paper, a Class-Level Soft-Voting Ensemble (CLSVE) scheme based on the Chaos Bat Algorithm (CBA), called CBA-CLSVE, is proposed for intrusion detection. The Support Vector Machine (SVM), K-Nearest Neighbor (KNN) and Decision Tree (DT) are selected as the base learners of the ensemble. The Chaos Bat Algorithm is used to generate class-level weights to create the weighted voting ensemble. A weighted fitness function considering the tradeoff between maximizing Detection Rate and minimizing False Positive Rate is proposed. In the experiments, the NSL-KDD, UNSW-NB15 and CICIDS2017 datasets are used to verify the scheme. The experimental results show that the class-level weights generated by CBA can be used to improve the combinative performance. They also show that the same ensemble performance can be achieved using about half the total number of features or fewer.

1. Introduction

Shortly, the Cyber Security Law, which has been in force for more than five years in China, will be revised for the first time. It is expected to increase the maximum penalty to 5% of annual revenue. Cyber security has been paid more and more attention. How to identify various attacks quickly and in real time, especially unforeseen attacks, is an inevitable problem at present. An Intrusion Detection System (IDS) can identify the existing or ongoing intrusion and has become an important research object in the field of information security.
The IDS technique is mainly composed of misuse detection and anomaly detection [1,2,3,4]. Misuse detection, also called signatures-based detection, focuses on detecting attacks using signatures. Generally, misuse detection systems consist of a set of signature databases that must be updated in time to detect the latest attack types. The advantage of misuse detection is that the False Positive Rate is low, and the detailed attack types and possible causes can be obtained. However, misuse detection lacks the ability to detect unknown attacks, has a high False Positive Rate and needs to maintain a huge signature database. Anomaly detection needs to define a normal profile. Once the network behavior deviates from the normal behavior, it is considered that an attack has occurred. Anomaly detection has strong generalization ability and can identify unknown attacks. Its disadvantage is that it has a high False Positive Rate and cannot provide the possible causes of anomalies. Although the IDS has been developed for decades, it still faces many challenges, such as lower Detection rate and high False Negative Rate and False Positive Rate [1,2,3,4].
Machine-learning methods have been widely used to improve the performance of IDS. However, each machine-learning method has its advantages and disadvantages. The No Free Lunch (NFL) theorem points out that different machine-learning algorithms have their own application scenarios and there is no optimal and universal algorithm [5]. Ensemble learning, sometimes called a multiple classifier system or committee-based learning, completes the learning task by constructing and combining multiple learners. The ensemble methods are widely used to solve various problems because of their advantages in accuracy, stability and generalization [6,7]. According to whether the types of the generated base learners are the same, the ensemble methods can be divided into homogeneous methods and heterogeneous methods. For the homogeneous method, the same learning algorithm is used to generate base learners. The Random Forest (RF) method, a well-known ensemble learning method, belongs to this type, in which all its base learners are in the Decision Tree. In the heterogeneous method, different technologies with different performances are used to form base learners.
Ensemble learning mainly involves generation, system topology and combination. In the first period, a large number of base learners to be ensembled are trained. There are six main ways to generate accuracy and diverse base learners, including different initializations, different parameters, different architectures, different classifier models, different training sets and different feature sets [8]. In the second stage, the base learners generated above can be organized in a parallel or serial manner. In the parallel structure, the classifiers are independent. In the serial topology, base learners are applied sequentially. First, the lead base learner in the sequence has to make a decision. If the main learner fails to decide, the task is handed over to the secondary learner, and so on. Most of the ensemble models reported in the literature adopt the parallel topology. In the last stage, the results of the base learner are combined to make the final decision.
Some methods use a function to combine the outputs of all base learners. The combining method includes the weighting method, probabilistic methods, evidential reasoning-based approaches and meta-learning methods [9]. The ideal combination method should be able to use the advantages of the base learners and minimize their disadvantages. There are three output types of the base learner, including crisp labels, class rankings and soft outputs. The three types of output carry different amounts of information. Among them, the soft output contains the highest amount of information, while the crisp labeling method has the least amount of information. Liu et al. [10] believe that the combination methods can also be classified into three groups. The crisp labels can be combined by voting approaches while the class rankings can be combined by class set reduction/reordering approaches. The Bayesian rule, fuzzy integrals and evidential reasoning can be applied to merge the soft outputs [10]. However, with the increase of the data complexity, some flexible methods are needed as the combination methods of the ensemble, which can be adjusted according to the attributes of the dataset used. Some scholars indicate that the efficiency of combinatorial methods can be improved by assigning weights to the classifiers [11]. Sava et al. [12] point out that it is necessary to assign weights to different base learners according to their performance in the heterogeneous learning. Cao et al. [13] provide two weight-optimization methods under the framework of the Class-Level Soft-Voting Ensemble. They suggest that the class-specific soft-voting method can refine the weights from classifiers to classes and improve the combinative performance.
In this paper, the Class-Level Soft-Voting Ensemble (CLSVE) is used for intrusion detection. Through literature research and extensive empirical analysis, the Support Vector Machine (SVM), K-Nearest Neighbor (KNN) and Decision Tree (DT) are selected as the base learners [14,15,16,17]. On the other hand, the Chaos Bat Algorithm with Opposition-Based Learning (OBL) is used for the weight optimization of the ensemble. The Bat Algorithm (BA) has better performance than the Genetic Algorithm (GA) and Particle Swarm Optimization Algorithm (PSO) [18]. However, it still has the disadvantages of the declining population diversity and local convergence in the searching processes [19,20]. Note that the combination of chaos and metaheuristic algorithms is a promising research field [21]. Due to its dynamic characteristics, chaotic mapping has been widely recognized in the field of optimization, which makes the Optimization Algorithm explore the search space more actively and globally. Moreover, the OBL strategy [22], which aims to boost the efficiency of the Bat Algorithm, is also used for the initialization of the population. Therefore, a new soft-voting scheme based on the Chaos Bat Algorithm with Opposition-Based Learning is used to combine the base learners of the ensemble.
In short, the main contributions of this paper are as follows:
(1)
An improved ensemble framework named CBA-CLSVE is proposed. The Class-Level Soft-Voting Ensemble (CLSVE) is selected for intrusion detection.
(2)
The Chaos Bat Algorithm (CBA) with the Opposition-Based Learning method is used to generate class-level weights to create the weighted voting ensemble.
(3)
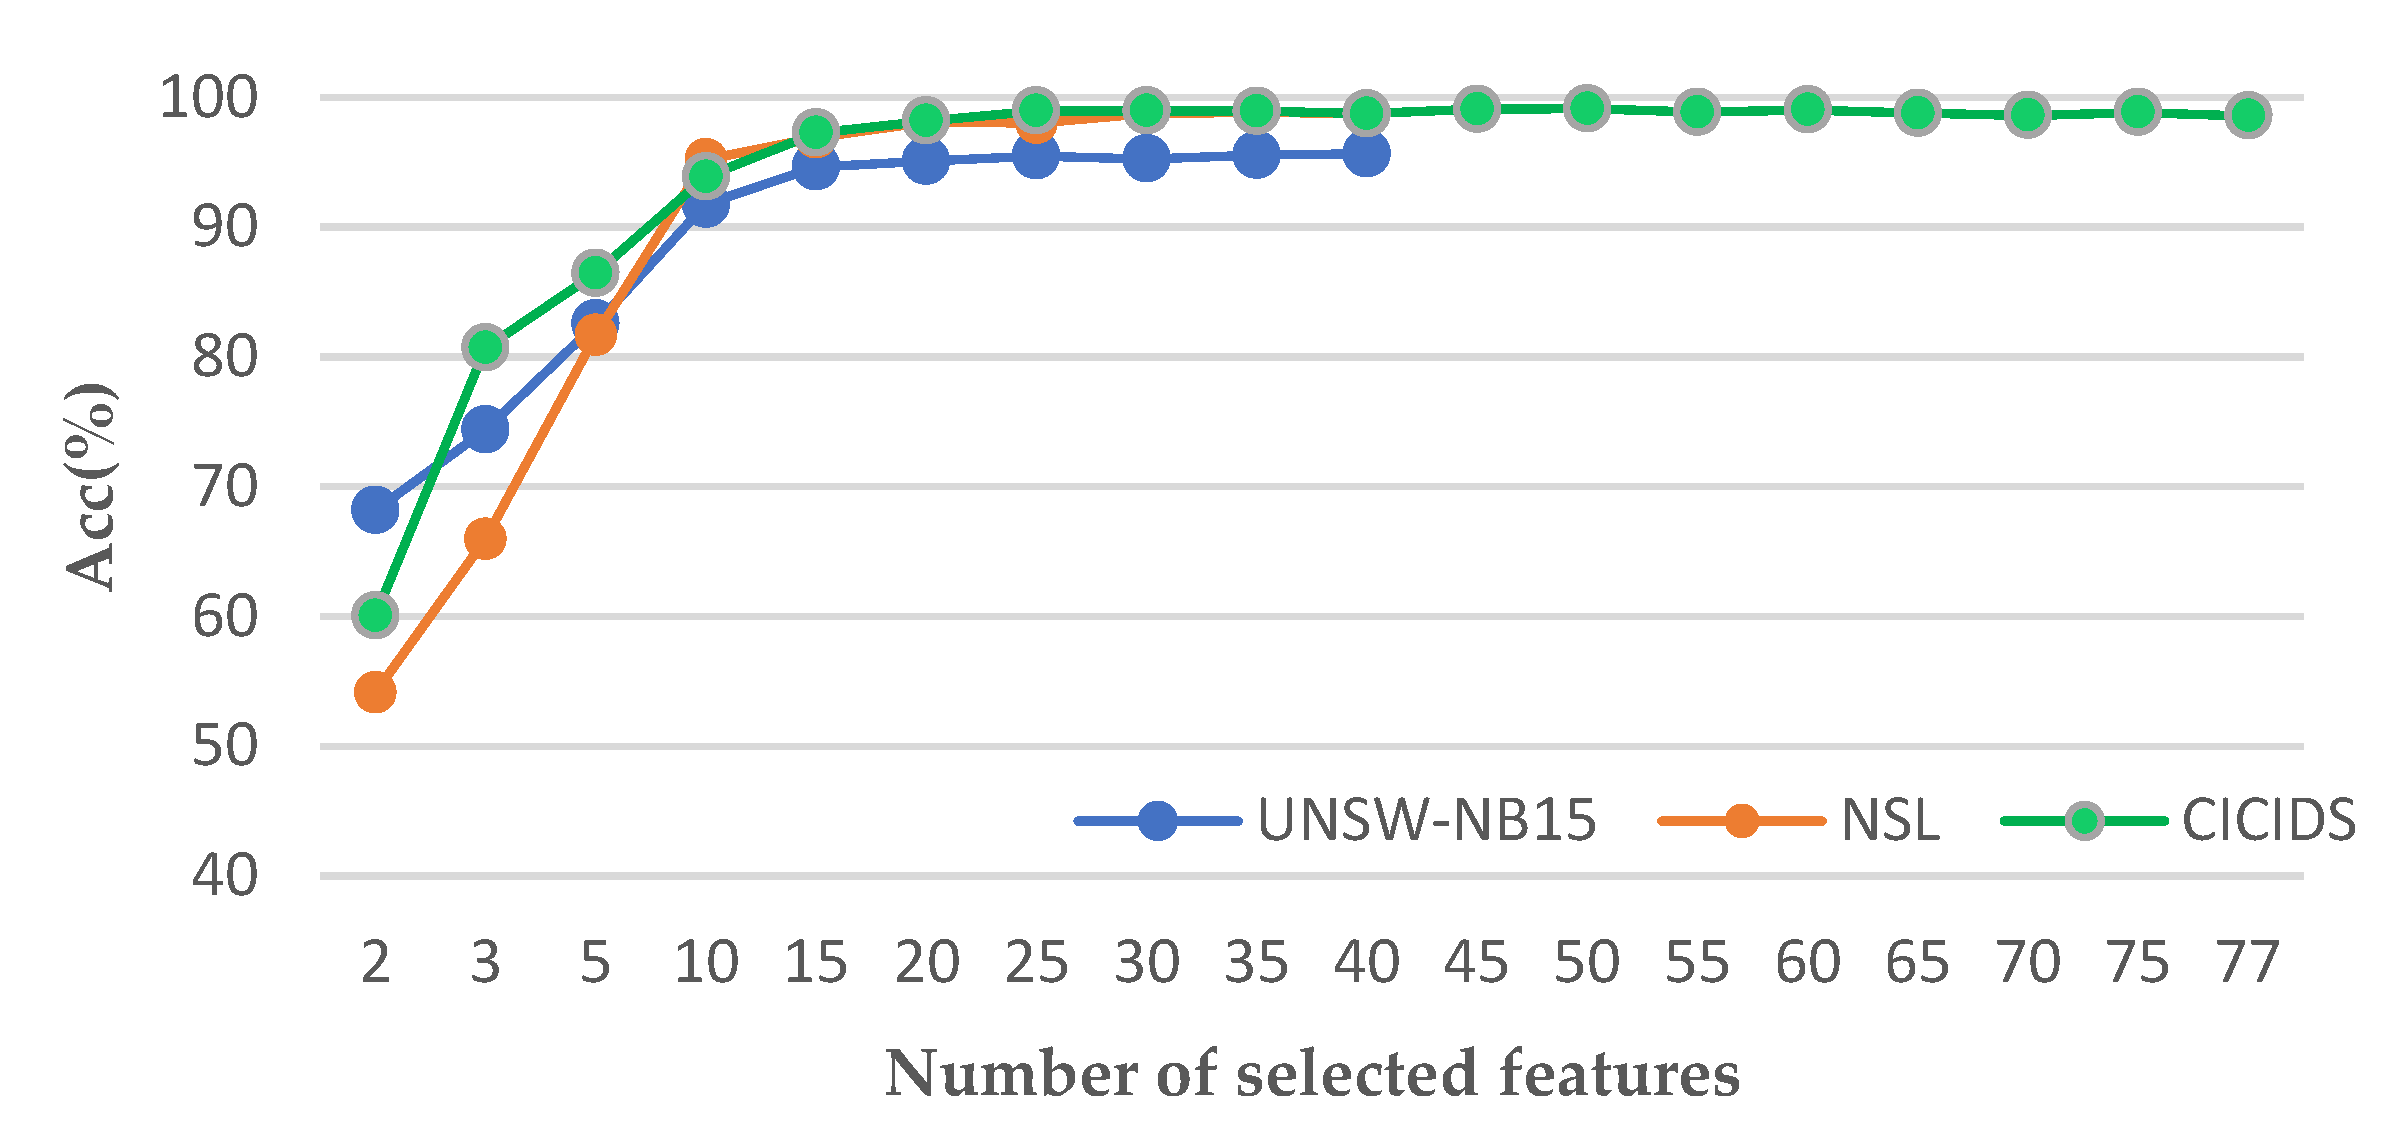
The soft-voting schemes are compared with the hard-voting methods based on the same learners. We also compare the performance of different voting ensemble methods with or without feature selection. It is verified that the Class-Level Soft-Voting method based on the CBA can be used to improve the ensemble performance. It also shows that the same performance of the ensemble can be obtained with half the total number of features or fewer.
The organization of the paper is as follows. The related work is provided in Section 2. Section 3 presents the background including the hard-voting and soft-voting method, the base learners and the basic Bat Algorithm. The proposed CBA-CLSVE framework for intrusion detection is described in Section 4. The experimental results are introduced in Section 5. The paper is concluded in Section 6.

2. Related Work

A large number of machine-learning algorithms, including shallow or deep learning, are applied to intrusion detection. Gu et al. [23] proposed a hybrid model containing SVM and Naïve Bayes (NB). Naïve Bayes was used to generate high-quality data and then sent to the SVM classifier. Liu et al. [24] applied the KNN and the Arithmetic Optimization Algorithm (AOA) to the intrusion detection. The AOA was used to optimize the relevant parameters of KNN. Kan et al. [25] designed an intrusion-detection model based on the Convolutional Neural Network (CNN) and PSO for the Internet of Things (IoT). Sahu et al. [26] introduced an attack-detection mechanism combining CNN and LSTM to detect infected devices in the Internet of Things.
There are also many intrusion-detection mechanisms based on ensemble learning. Amini et al. [27] proposed a new ensemble method using the Radial Basis Function (RBF) neural networks. To increase the diversity of classifiers, classifiers were trained using different subsets that were divided by the Fuzzy C-Means (FCM) method. The membership grade generated by the fuzzy clustering technology was used as the classifier weight to combine multiple classifiers. Experimental results showed that the proposed method has a better detection effect for small classes of samples compared with simple voting and weighted majority voting. Gu et al. [28] proposed an intrusion-detection framework based on an SVM ensemble. The authors used the ratio transformations technique to improve the quality of training data. The FCM method was also used to enhance the diversity of SVM classifiers. Finally, the authors used a nonlinear combination method to aggregate these SVM classifiers. Yang et al. [29] proposed a Gradient Boosting Decision Tree (GBDT) parallel quadratic ensemble learning method for intrusion detection. Firstly, the traditional ensemble learning method GBDT was used to make the prediction based on the spatial feature, and the temporal method Bidirectional Gated Recurrent Unit (Bi-GRU) was employed to capture the temporal information. Then, the GBDT model and Bi-GRU model were combined to form a quadratic ensemble. Euh et al. [30] introduced tree-based ensemble learning models such as AdaBoost, XGBoost, RF, extra trees and rotation trees for malware detection. Gao et al. [31] introduced an adaptive ensemble method for intrusion detection. The base classifiers, including DT, RF, KNN, and deep neural network, were combined using the voting method with class weights. The weights can be obtained by calculating the training accuracy of each algorithm for different attack types.
The ensemble learning, especially the weighted voting scheme, can also be applied to other fields, such as bankruptcy prediction, text sentiment classification, Named Entity Recognition (NER), etc. Zelenkov et al. [32] proposed an ensemble method for bankruptcy prediction in which GA was used to select relevant features and classifier weights. In the ensemble, the most extensive models, including Logistic Regression (LR), KNN, SVM, NB, and DT, were used. Zelenkov et al. [33] proposed an ensemble model for bankruptcy prediction in which different classifiers were combined by the soft-voting rule. The ensemble model can minimize the False Positive Rate (FPR) and False Negative Rate (FNR) simultaneously. Onan et al. [34] proposed a static classifier-selection ensemble for text sentiment classification in which five different classifiers were combined. A multi-objective Differential Evolution Algorithm was used to generate class-level weights. Saleena et al. [35] introduced a weighted ensemble approach for tweet sentiment analysis in which the NB, RF, SVM and LR were used as the basic classifiers. The weight of each classifier is obtained by its training accuracy. Saha et al. [36] proposed a classifier ensemble scheme using the weighted voting based on GA for NER. The experiments showed that instead of completely eliminating some classifiers, it is better to quantify the voting amount for each class in each classifier. Ekbal et al. [37] designed a classifier ensemble technology-based on the Maximum Entropy (ME), Conditional Random Field (CRF) and SVM. The multi-objective simulated annealing technique was used to determine the appropriate votes for each class per classifier in NER.
In summary, in most weighted voting ensembles, the classifier-level weight is usually used instead of class-level weight. The weight can be obtained according to the training result or using a metaheuristics method such as the Genetic Algorithm. To our knowledge, the method of using an improved Bat Algorithm to generate the class-level weight has not been reported. This paper explains the research conducted around this technique.

3. Background

3.1. The Hard-Voting and Soft-Voting Method

The voting method is the most widely used and important classifier-fusion method. Suppose that the combined classifier consists of T single classifiers hi (opposite = 1, 2,…, T). The learner hi will predict the sample label from the label set {c1, c2,…, cN}. The fusion method needs to combine the decision results of T classifiers and output the final label. Suppose that the output of classifier hi for the input sample x is a Q-dimensional vector (h1i(x), h2i(x), …, hNi(x))T, where hji(x) represents the output of classifier hi that belong to the jth class. The value of hji(x) has different types, such as the binary label and the probability label.
The voting method using the binary label is also called hard voting. The binary labels can be combined through the majority voting or the weighted voting method [13].
  • The majority voting method can be described as follows:
H ( x ) = arg   max j ( i = 1 T h j i ( x ) ) ,   h j i ( x ) { 0 , 1 }
  • The majority voting method is suitable for all base learners with the same performance. However, in practical applications, the performance of the base learners is different, which requires different weights. Therefore, weighted voting came into being.
    H ( x ) = arg   max j ( i = 1 T w i × h j i ( x ) ) ,   h j i ( x ) { 0 , 1 }
    where w i [ 0 ,   1 ] indicates the weight of classifier hi and a large weight means stronger classification performance.
If the output of a classifier is the class posterior probability, the base classifiers can be combined by the soft-voting method. There are two appropriate types of weight coefficients in the soft-voting method, including the classifier level and the class level [13].
  • The classifier-level weight represents the weight for each base classifier. The final output can be described as follows:
H ( x ) = arg   max j ( i = 1 T w i × h j i ( x ) ) ,   h j i ( x ) [ 0 , 1 ]
  • The class-level weight represents the weight of each base classifier for an output class. This method considers that the classifier has different prediction performance with different output classes. The final output can be described as follows:
    H ( x ) = arg   max j ( i = 1 T w i j × h j i ( x ) ) ,   h j i ( x ) [ 0 , 1 ]
    where w i j [ 0 ,   1 ] represents the weight of class j for classifier hi.

3.2. The Base Learners

3.2.1. Support Vector Machine

The SVM has good generalization performance and computational efficiency based on the principle of structural risk minimization [38]. The training samples can be expressed as {(x1, y1),(x2, y2),…,(xQ, yQ)}, xi   RD, yi   {−1, +1}. The SVM separates two different classes of samples by selecting an optimized hyperplane to maximize the difference between the two classes, which can be described as the following optimization problem:
min w , b , ξ = { 1 2 w 2 + C i = 1 l ξ i }
The constraint is yi (w · xi-b) 1 − ξ i , ξ i 0 , i = 1, …, l, where w is the vector perpendicular to the hyperplane, C is the penalty factor, ξ i is a sparse variable.

3.2.2. K-Nearest Neighbor

The KNN is a simple and effective supervised classification technology, which can directly solve the multi-classification problem [24]. The KNN believes that birds of a feather flock together, and the test sample class is consistent with that of its nearest neighbors. The Euclidean distance is often used to evaluate the sample distance, expressed as:
d ( x i , x j ) = k = 1 D ( x i k x j k ) 2

3.2.3. Decision Tree

The DT models have many techniques such as ID3, C4.5, CART, etc. Their difference lies in the different standards for calculating features, such as information entropy, information gain, information gain rate, Gini coefficient, etc. [39]. The CART tree takes the Gini coefficient as an index. Assuming that there are n classes and the probability that the sample belongs to class i is pi, the Gini coefficient is defined as:
G i n i ( p ) = i = 1 N p i ( 1 p i ) = 1 i = 1 N p i 2

3.3. The Basic Bat Algorithm

The BA is a new Swarm Intelligence Optimization Algorithm that simulates the foraging behavior of bats [18]. Due to its strong robustness, simple parameter settings and better global search, it is applied to various optimization problems.
Suppose that bats use echolocation to sense the distance between themselves and the target and can distinguish the target from the background obstacles. The i-th bat flies at the spatial position Xi at the speed Vi, and conducts a target search with varying frequency f and loudness A. The bat adjusts the pulse emissivity r according to the distance between itself and its prey. The frequency f, speed V and position X of bats are updated according to the following formula,
f i = f m i n + ( f m a x - f m i n ) × r a n d ( )
V i t = V i t - 1 + ( X i t - X * ) × f i
X i t = X i t - 1 + V i t
where fmin and fmax denote the frequency minimum and maximum, respectively, Vit and Xit represent the speed and position of the i-th bat at time t, and X* is the global optimal position.
The frequency f, pulse emission rate R and loudness A change as follows:
r i t = r i 0 × [ 1 - e x p ( - γ t ) ]
where γ are the specified coefficients.

4. The Class-Level Soft-Voting Ensemble Based on the Chaos Bat Algorithm for Intrusion Detection

4.1. The Chaos Bat Algorithm with Opposition-Based Learning (CBA)

To improve the global convergence of the population, a Chaos Bat Algorithm based on the sinusoidal chaotic map is proposed. The chaos is an aperiodic phenomenon that is the characteristic of nonlinear systems [40]. Here, the sinusoidal map is used, described as follows [41]:
x k + 1 = a x k 2 sin ( π x k )
where xk is a chaotic variable, k represents the number of the iteration. When a = 2.3 and x0 = 0.7, it can be expressed as
x k + 1 = sin ( π x k )
Since the range of chaotic variables and random variables to be replaced is the same, they are all between 0 and 1. There is no need to conduct interval mapping in this paper.
Chaos initialization: For metaheuristic Optimization Algorithms, the initial solution of the population is often generated randomly. The pseudo random numbers, computer-generated numbers, are not real random numbers. However, the quality of initialization will directly affect the convergence speed and accuracy of the algorithm. In this paper, the chaos initialization and the OBL strategy are combined to improve the quality of the initialization solution. The sinusoidal map is used for the initialization of the population.
The opposite value x ¯ for the real value x [ u ,     l ] can be calculated as follows:
x ¯ = u + l - x
where x ¯ indicates the opposite position of the bat’s actual position.
The pulse emission rate based on chaos: In the original BA, the pulse emission r decreases monotonically as the iteration goes on. The literature shows that better results can be obtained when r changes disorderly [40,41]. In this paper, the sinusoidal chaotic sequences were used to tune r.

4.2. The CBA-CLSVE Framework for Intrusion Detection

The CBA-CLSVE framework for intrusion detection is divided into three stages. In the first stage, the chi-square index is used for feature selection, that is, to find the optimal subset and delete irrelevant and redundant features. In the second stage, the dataset is divided into training dataset and testing dataset based on the feature subset. The SVM, KNN and DT methods are selected as the base classifiers for the ensemble model, and the Class-Level Soft-Voting strategy is used to integrate the above base classifiers. The class-level weight of each classifier is determined by the Chaos Bat Algorithm. In the third stage, the class-level weights are then used in the soft-voting ensemble to obtain the final evaluation result of the ensemble for each output class.
The flowchart of the CBA-CLSVE for intrusion detection is shown in Figure 1.

4.2.1. Individual Representation

Assuming that there are M classifiers and N output classes, the individual length should be M × N. The weight value represents the voting power of the classifier for each class and the real number coding method is adopted. As shown in Figure 2, it is a string representation for a problem with three classifiers and three classes. The length of the string is 9. According to the given weight value, Classifier 3 has the highest weighted voting power in the final decision of the first output class and the second output class, and Classifier 1 has the highest weighted voting power in the final decision of the third output class.

4.2.2. Fitness Function Definition

The Detection Rate (DR) and False Positive Rate (FPR), also called the False Alarm Rate (FAR), are the most commonly used indicators to evaluate the performance of IDSs. The optimization problem proposed in this paper is a multi-objective optimization problem that involves the two measures mentioned above. Multi-objective optimization can be transformed into single-objective optimization by designing a weighted fitness function. An ideal intrusion-detection model will have a higher Detection Rate and a lower False Positive Rate. Hence, a weighted fitness function Fit, shown below, can be proposed:
Maximize Fit = w1 × DR + w2 × (1 − FPR)
where w1 and w2 represents the weights for the Detection Rate and the False Positive Rate. A higher fitness Fit means better intrusion-detection performance.
The Class-Level Soft-Voting Ensemble is shown in Algorithm 1. The proposed Class-Level Soft-Voting Ensemble scheme based on the Chaos Bat Algorithm for intrusion detection can be described in Algorithm 2.
Algorithm 1: The Class-Level Soft-Voting Ensemble
Input: the parameters used for the base learners, training dataset with labels, the class-level weight
Output: the confusion matrix or other evaluation indicators.
  • for each base learner do
  • probabilityMatrix = learner. predict_proba(train_data)
  • for each row do
  • probabilityMatrix[row] = weight × probabilityMatrix[row]
  • end for
  • end for
  • predict _ label = argmax t = 1 T probabilityMatrix
  • get the confusion matrix = confusion_matrix(train_label, predict_label) or other indicators
Algorithm 2: CBA-CLSVE
Input: the parameters used for the base learners and the BA, training and testing dataset with labels
Output: the final result of the proposed model.
  • The SelectKBest function is used to select appropriated features
  • Training:
  • Initialize the bat’s population using the chaos and opposition-based learning strategy
  • Compute the initial fitness of each bat to find the best search agent X*
  • Initialize the value of the chaotic map x0 randomly
  • for each iteration do
  • Update the chaotic variable using the sinusoidal map
  • for each individual do
  • Update the positions and other important metrics of the individual
  • Update the fitness = ensemble_model (train_data, train_label, the position)
  • Find the best individual based on their fitness values
  • end for
  • end for
  • return the optimal position, that is, the class-level weights to create the ensemble
  • Testing:
  • testing accuracy, confuse matrix = ensemble_model (test_data, test_label, the optimal weight)

5. The Experiments

The evaluation, experimental environment, specific experimental process and results analysis will be introduced in detail below.

5.1. Evaluation

There are four indicators to describe intrusion-detection results as follows: True Positive (TP), False Positive (FP), True Negative (TN) and False Negative (FN). TP indicates that the attacks are correctly judged, TN denotes that the normal behavior is predicted as normal, FP represents that the normal behavior is judged as attacks, and FN represents that the attacks are wrongly predicted as normal. In this paper, the Accuracy (Acc), Detection Rate (DR), False Positive Rate (FPR) and F1 measure are used to evaluate the performance of different methods, which are defined as follows [42]:
A c c u r a c y = T P + T N T P + T N + F P + F N
D R = T P T P + F N
F P R = F P F P + T N
P r e c i s i o n = T P T P + FP
R e c a l l = T P T P + FN
F 1 = 2 × P r e c i s i o n × R e c a l l P r e c i s i o n + R e c a l l

5.2. Experimental Descriptions

In this paper, NSL-KDD, UNSW-NB15 and CICIDS2017 datasets are used to evaluate the algorithm proposed.
  • KDD99 is the most famous and widely used dataset in the intrusion-detection field. However, it has been more than 20 years and does not cover various known attacks. More importantly, it has a large number of duplicate records, which will lead to algorithm deviation. NSL-KDD [43], a revised version of KDD99 that overcomes some native shortcomings of KDD99, is proposed. Like KDD99, each TCP connection record is represented by 42 items, with 41 attribute characteristics and 1 type identifier in NSL-KDD.
  • The UNSW-NB15 dataset [44] is generated by the Australian Security Laboratory using the IXIA PerfectStrom tool. The real normal network traffic and artificial attack traffic in modern networks are combined in the dataset. The dataset contains 9 types of attacks and 43 features in total. The first feature represents the sample number and can be deleted, so there are 42 available features.
  • The CICIDS2017 dataset [45] is provided by the Canadian Institute of Network Security. It contains the real normal and attack traffic and is more suitable for simulating the existing network environment. In the CICIDS2017, the CICFlowMeter is used to extract more than 80 network flow features, including 6 basic features and more than 70 functional features.
It is worth noting that the attack classes for the KDD99 and CICIDS2017 datasets include the main attack class and the sub-attack class. According to the literature, the main attack class is used in this paper. The number of features and the attack classes contained in the three datasets are shown in Table 1.
The described experiments were carried out on an Intel® Core™ i5 CPU @ 1.70 GHz computer with 4.00 GB RAM running Windows10 Enterprise Edition (64 bit). The proposed soft-voting ensemble scheme was implemented using Python. The machine-learning classifiers used in this paper were implemented by calling the scikit-learn class library [46]. The PyCharm community edition 4.0.6 (Windows version) was used as the programming tool, and the program compiler environment was Python 3.7.0 (Windows version).
Data preprocessing, including data cleaning, data normalization, feature selection, and data segmentation, was performed. The train_test_split () method in the scikit-learn was used to perform the dataset segmentation. The randomly selected data was divided into training set and testing set according to the ratio of 1:1. The SelectKBest function in the scikit-learn library was used to select features. The importance of features was evaluated by the chi-square value.

5.3. Experimental Results

To eliminate the influence of random error, the 10-fold cross-validation method was used. The parameters of the Chaos Bat Algorithm were selected empirically; the population size and the number of iteration are 25 and 100, respectively. The other important parameters of the methods used were all selected empirically and are shown in Table 2.
The scores_function of sklearn. SelectKBest was used to obtain the scores of different features. The scores of features in the NSL-KDD, UNSW-NB15 and CICIDS2017 datasets are shown in Figure 3. The serial number of the features is in accordance with the abscissa, the ordinate score for the curve for result analysis. As can be seen in Figure 3, these features are ranked into a specified range: [0, 30,000], [0, 20,000] and [0, 20,000], respectively. The features with the highest scores are 39, 34 and 11 in the three datasets. In each dataset, almost half of the features have lower scores and some features with a 0 score also exist, especially in the CICIDS2017 dataset.
The proposed model is trained based on different numbers of features. After the training, the appropriate ensemble weights were obtained. Finally, different numbers of features (2, 3, 5, 10, 15, 20,…) were fed into the proposed method, and the three classification accuracy curves were obtained, as shown in Figure 4. The orange curve, blue curve and green curve represent the test accuracy based on NSL-KDD, NUSW-NB15 and CICIDS2017 datasets, respectively. The change trends of the three accuracy curves are similar. As the number of selected features increases, the testing accuracy increases rapidly at the beginning, and finally shows a stable trend. It is observed that the maximum accuracy is achieved when the number of features is about 20, 19 and 25 in the three datasets.
Suppose that the features of different datasets are represented by Fn, and n means the serial number of the features, which starts from 1. The more relatively important features of different datasets based on chi-square filtering technology are shown in Table 3. The quantity of selected features is derived from Figure 4.
Next, the hard-voting method was compared with the soft-voting model on the three datasets. The hard-voting model includes the majority voting and the weighted voting methods. The soft-voting includes the no weight, classifier-level weight and class-level weight methods. For the above five methods, the weight only exists in the weighted voting method, the classifier-level weight method and class-level weight method. The majority voting and the no weight methods do not use the weight. It is worth noting that the weights of the three weight voting methods mentioned above are all obtained by the Chaos Bat Algorithm (CBA) with the Opposition-Based Learning method. As shown in Section 4.2.1, the individual in the Bat Algorithm represents the weight. Since there are 3 classifiers and 5, 10 and 7 output categories on the three datasets, the length of the weight is the same as the individual length, which is 15, 30 and 21, respectively, in the NSL-KDD, UNSW-NB15 and CICIDS2017 datasets. The length of the weight of the weighted voting and the classifier-level weight methods is the same as the classifiers used in the ensemble. The weight comparison of different voting ensemble methods is shown in Table 4.
Meanwhile, two experiments were carried out to verify whether feature selection may improve the results. Table 5, Table 6 and Table 7 provide the experimental results of the performance comparisons of the base learners and different voting ensemble methods without feature selection on the three datasets. The results of the performance comparisons of the base learners and different voting ensemble methods with feature selection on the three datasets are shown in Table 8, Table 9 and Table 10.
Table 5, Table 6, Table 7, Table 8, Table 9 and Table 10 clearly show that the voting ensemble methods have better and more stable predictive performance than the base learners. The KNN performs best on the NSL-KDD and CICIDS2017 datasets, while it performs worst on the UNSW-NB15 dataset. SVM has a high False Positive Rate on the CICIDS2017. The performance of DT is stable, but it is still inferior to the ensemble learning method. Table 5, Table 6, Table 7, Table 8, Table 9 and Table 10 show that the class-level weight method obtained better performance in Detection Rate, FPR, acc and F1 compared to other ensemble methods. By comparing the results presented in Table 8, Table 9 and Table 10 to the ones in Table 5, Table 6 and Table 7, it can be seen that feature selection has positive significance because it can improve the efficiency of the models. Even if half of the features or more are omitted, these models can still maintain considerable performance.
Moreover, to verify the search and convergence capabilities of the CBA, the proposed weight-optimization scheme will be compared with the basic BA and GA. The GA is implemented by calling the scikit-opt library [47]. There are many important parameters to be specified in GA. In particular, the n_dim represents the number of variables in the problem to be optimized, which is the same as the individual length. The results of the performance comparisons of the CLSVE based on different Optimization Algorithms on the three datasets are shown in Table 11. It should be noted that feature selection is performed. Table 11 shows that the performance of the proposed CBA-CLSVE is better than the BA-based CLSVE and GA-based CLSVE.
Figure 5, Figure 6 and Figure 7 provides the experimental results of the proposed method when the number of iterations of the GA, BA and CBA methods are 10 and 20, respectively. Figure 5, Figure 6 and Figure 7 show that the method tends to converge with the increase of iteration times and population size, and the fitness value of the method gradually increases. It can be seen that CBA performs well in terms of training efficiency and search ability.
Finally, the proposed method was compared with other models, such as XGBoost [48], etc., for intrusion detection on the UNSW-NB15 dataset. The comparison includes the feature selection methods, the classification method, the number of features used, DR, FPR, ACC, and F1 for intrusion detection. Table 12 shows that CBA-CLSVE outperforms other models with few features.

6. Conclusions

CBA-CLSVE is a Class-Level Soft-Voting Ensemble for intrusion detection. In ensemble learning, Support Vector Machine, K-Nearest Neighbor, and Decision Tree are combined to construct an ensemble model with better generalizability, robustness and prediction performance. To improve the global convergence of the population, a CBA based on a tent chaotic map is proposed to generate the class-level weight. A weighted fitness function combining the Detection Rate and the False Positive Rate is defined in the CBA. The hard-voting and soft-voting methods are used to combine results from different base learners. The CBA-based voting methods with weights (whether hard voting or soft voting) are designed. The performance of different voting ensemble methods with or without feature selection are compared. Finally, to compare with the CBA-based method, the BA and the GA approaches are also used to combine the expert opinions. The approaches mentioned above were empirically compared using the NSL-KDD, UNSW-NB15 and CICIDS2017 datasets. The experimental results show that the class-level weights optimized by the CBA can be used to improve the combinative performance and the same performance of the ensemble can be obtained with half of the total number of features or fewer. It also shows that the CBA method has better results in searching performance and efficiency than the basic BA and GA methods. In this paper, the heuristic algorithm is used to integrate the base learners, which can improve the ensemble performance. Therefore, our future work will involve improving current heuristic algorithms or proposing new intelligent heuristic algorithms. In addition, studying other methods for integrating the base learners will be the direction of our efforts.

Author Contributions

Methodology, Y.S.; validation, Y.S., K.Z., Y.Y., S.L. and M.H.; investigation, Y.S. and Y.Y.; resources, Y.S. and S.L.; data curation, Y.S.; writing—original draft preparation, Y.S.; writing—review and editing, Y.S.; visualization, Y.S.; supervision, K.Z. and M.H.; project administration, M.H.; funding acquisition, M.H. All authors have read and agreed to the published version of the manuscript.

Funding

This research was funded by the Fundamental Research Funds for the Central Universities, grant number ZY20215151, the Earthquake Science and Technology Spark Program Youth Project Research, grant number XH21057Y and the Natural Science Project of Xinjiang University Scientific Research Program, grant number XJEDU2021Y003.

Institutional Review Board Statement

Not applicable.

Informed Consent Statement

Not applicable.

Data Availability Statement

“NSK-KDD” at http://nsl.cs.unb.ca/NSL-KDD, accessed on 10 August 2022; “UNSW-NB15” at https://www.unsw.adfa.edu.au/unsw-canberra-cyber/cybersecurity/ADFA-NB15-Datasets, accessed on 12 August 2022; “CICIDS2017” at https://www.unb.ca/cic/datasets/ids-2017.html, accessed on 12 August 2022.

Conflicts of Interest

The authors declare no conflict of interest.

References

  1. Kumar, V.; Sinha, D.; Das, A.K.; Pandey, S.C.; Goswami, R.T. An integrated rule based intrusion detection system: Analysis on UNSW-NB15 data set and the real time online dataset. Clust. Comput. 2020, 23, 1397–1418. [Google Scholar] [CrossRef]
  2. Ayo, F.E.; Folorunso, S.O.; Abayomi-Alli, A.A.; Adekunle, A.O.; Awotunde, J.B.; Awotunde, J.B. Network intrusion detection based on deep learning model optimized with rule-based hybrid feature selection. Inf. Secur. J. A Glob. Perspect. 2020, 29, 267–283. [Google Scholar] [CrossRef]
  3. Guezzaz, A.; Benkirane, S.; Azrour, M.; Khurram, S. A reliable network intrusion detection approach using decision tree with enhanced data quality. Secur. Commun. Netw. 2021, 2021, 1230593. [Google Scholar] [CrossRef]
  4. Liu, X.; Li, T.; Zhang, R.; Wu, D.; Liu, Y.; Yang, Z. A GAN and feature selection-based oversampling technique for intrusion detection. Secur. Commun. Netw. 2021, 2021, 9947059. [Google Scholar] [CrossRef]
  5. Wolpert, D.H.; Macready, W.G. No free lunch theorems for optimization. IEEE Trans. Evol. Comput. 1997, 1, 67–82. [Google Scholar] [CrossRef] [Green Version]
  6. Sagi, O.; Rokach, L. Ensemble learning: A survey. Wiley Interdiscip. Rev. Data Min. Knowl. Discov. 2018, 8, e1249. [Google Scholar] [CrossRef]
  7. Dong, X.; Yu, Z.; Cao, W.; Shi, Y.; Ma, Q. A survey on ensemble learning. Front. Comput. Sci. 2020, 14, 241–258. [Google Scholar] [CrossRef]
  8. Cruz, R.M.O.; Sabourin, R.; Cavalcanti, G.D.C. Dynamic classifier selection: Recent advances and perspectives. Inf. Fusion 2018, 41, 195–216. [Google Scholar] [CrossRef]
  9. Jurek, A.; Bi, Y.; Wu, S.; Nugent, C. A survey of commonly used ensemble-based classification techniques. Knowl. Eng. Rev. 2014, 29, 551–581. [Google Scholar] [CrossRef]
  10. Liu, Z.G.; Pan, Q.; Dezert, J.; Martin, A. Combination of classifiers with optimal weight based on evidential reasoning. IEEE Trans. Fuzzy Syst. 2018, 26, 1217–1230. [Google Scholar] [CrossRef]
  11. Costa, V.S.; Farias, A.D.S.; Bedregal, B.; Santiago, R.H.; Canuto, A.M.D.P. Combining multiple algorithms in classifier ensembles using generalized mixture functions. Neurocomputing 2018, 313, 402–414. [Google Scholar] [CrossRef] [Green Version]
  12. Savargiv, M.; Masoumi, B.; Keyvanpour, M.R. A new ensemble learning method based on learning automata. J. Ambient. Intell. Humaniz. Comput. 2022, 313, 3467–3482. [Google Scholar] [CrossRef]
  13. Cao, J.; Kwong, S.; Wang, R.; Li, X.; Li, K.; Kong, X. Class-specific soft voting based multiple extreme learning machines ensemble. Neurocomputing 2015, 149, 275–284. [Google Scholar] [CrossRef]
  14. Maseer, Z.K.; Yusof, R.; Bahaman, N.; Mostafa, S.A.; Foozy, C.F.M. Benchmarking of machine learning for anomaly based intrusion detection systems in the CICIDS2017 dataset. IEEE Access 2021, 9, 22351–22370. [Google Scholar] [CrossRef]
  15. Kilincer, I.F.; Ertam, F.; Sengur, A. Machine learning methods for cyber security intrusion detection: Datasets and comparative study. Comput. Netw. 2021, 188, 107840. [Google Scholar] [CrossRef]
  16. Naseri, T.S.; Gharehchopogh, F.S. A feature selection based on the farmland fertility algorithm for improved intrusion detection systems. J. Netw. Syst. Manag. 2022, 30, 1–27. [Google Scholar] [CrossRef]
  17. Abdan, M.; Seno, S.A.H. Machine learning methods for intrusive detection of wormhole attack in mobile Ad Hoc network (MANET). Wirel. Commun. Mob. Comput. 2022, 2022, 2375702. [Google Scholar] [CrossRef]
  18. Yang, X.; Gandomi, A.H. Bat algorithm: A novel approach for global engineering optimization. Eng. Comput. 2012, 29, 464–483. [Google Scholar] [CrossRef] [Green Version]
  19. Li, M.W.; Wang, Y.T.; Geng, J.; Hong, W.C. Chaos cloud quantum bat hybrid optimization algorithm. Nonlinear Dyn. 2021, 103, 1167–1193. [Google Scholar] [CrossRef]
  20. Lin, N.; Tang, J.; Li, X.; Zhao, L. A novel improved bat algorithm in UAV path planning. J. Comput. Mater. Contin. 2019, 61, 323–344. [Google Scholar] [CrossRef]
  21. Kaur, G.; Arora, S. Chaotic whale optimization algorithm. J. Comput. Des. Eng. 2018, 5, 275–284. [Google Scholar] [CrossRef]
  22. Tizhoosh, H.R. Opposition-Based Learning: A New Scheme for Machine Intelligence. In Proceedings of the Computational Intelligence for Modelling, Control and Automation, 2005 and International Conference on Intelligent Agents, Web Technologies and Internet Commerce, International Conference On, Vienna, Austria, 28–30 November 2005. [Google Scholar]
  23. Gu, J.; Lu, S. An effective intrusion detection approach using SVM with naïve Bayes feature embedding. Comput. Secur. 2021, 103, 102158. [Google Scholar] [CrossRef]
  24. Liu, G.; Zhao, H.; Fan, F.; Liu, G.; Xu, Q.; Nazir, S. An enhanced intrusion detection model based on improved kNN in WSNs. Sensors 2022, 22, 1407. [Google Scholar] [CrossRef] [PubMed]
  25. Kan, X.; Fan, Y.; Fang, Z.; Cao, L.; Xiong, N.N.; Yang, D.; Li, X. A novel IoT network intrusion detection approach based on adaptive particle swarm optimization convolutional neural network. Inf. Sci. 2021, 568, 147–162. [Google Scholar] [CrossRef]
  26. Sahu, A.K.; Sharma, S.; Tanveer, M.; Raja, R. Internet of Things attack detection using hybrid deep learning model. Comput. Commun. 2021, 176, 146–154. [Google Scholar] [CrossRef]
  27. Amini, M.; Rezaeenour, J.; Hadavandi, E. A neural network ensemble classifier for effective intrusion detection using fuzzy clustering and radial basis function networks. Int. J. Artif. Intell. Tools 2016, 25, 1550033. [Google Scholar] [CrossRef]
  28. Gu, J.; Wang, L.; Wang, H.; Wang, S. A novel approach to intrusion detection using SVM ensemble with feature augmentation. Comput. Secur. 2019, 86, 53–62. [Google Scholar] [CrossRef]
  29. Yang, J.; Sheng, Y.; Wang, J. A GBDT-Paralleled Quadratic Ensemble Learning for Intrusion Detection System. IEEE Access 2020, 8, 175467–175482. [Google Scholar] [CrossRef]
  30. Euh, S.; Lee, H.; Kim, D.; Hwang, D. Comparative analysis of low-dimensional features and tree-based ensembles for malware detection systems. IEEE Access 2020, 8, 76796–76808. [Google Scholar] [CrossRef]
  31. Gao, X.; Shan, C.; Hu, C.; Niu, Z.; Liu, Z. An Adaptive Ensemble Machine Learning Model for Intrusion Detection. IEEE Access 2019, 7, 82512–82521. [Google Scholar] [CrossRef]
  32. Zelenkov, Y.; Fedorova, E.; Chekrizov, D. Two-step classification method based on genetic algorithm for bankruptcy forecasting. Expert Syst. Appl. 2017, 88, 393–401. [Google Scholar] [CrossRef]
  33. Zelenkov, Y.; Volodarskiy, N. Bankruptcy prediction on the base of the unbalanced data using multi-objective selection of classifiers. Expert Syst. Appl. 2021, 185, 115559. [Google Scholar] [CrossRef]
  34. Onan, A.; Korukoglu, S.; Bulut, H. A multiobjective weighted voting ensemble classifier based on differential evolution algorithm for text sentiment classification- ScienceDirect. Expert Syst. Appl. 2016, 62, 1–16. [Google Scholar] [CrossRef]
  35. Saleena, N. An ensemble classification system for twitter sentiment analysis. Procedia Comput. Sci. 2018, 132, 937–946. [Google Scholar]
  36. Saha, S.; Ekbal, A. Combining multiple classifiers using vote based classifier ensemble technique for named entity recognition. Data Knowl. Eng. 2013, 85, 15–39. [Google Scholar] [CrossRef]
  37. Ekbal, A.; Saha, S. A multiobjective simulated annealing approach for classifier ensemble: Named entity recognition in Indian languages as case studies. Expert Syst. Appl. 2011, 38, 14760–14772. [Google Scholar] [CrossRef]
  38. Mohammadi, M.; Rashid, T.A.; Karim, S.H.T.; Aldalwie, A.H.M.; Tho, Q.T.; Bidaki, M.; Rahmani, A.M.; Hosseinzadeh, M. A comprehensive survey and taxonomy of the SVM-based intrusion detection systems. J. Netw. Comput. Appl. 2021, 178, 102983. [Google Scholar] [CrossRef]
  39. Panigrahi, R.; Borah, S.; Bhoi, A.K.; Ijaz, M.F.; Pramanik, M.; Kumar, Y.; Jhaveri, R.H. A consolidated decision tree-based intrusion detection system for binary and multiclass imbalanced datasets. Mathematics 2021, 9, 751. [Google Scholar] [CrossRef]
  40. Su, L.; Yang, K. Improved chaotic bat algorithm and its application in multi-objective operation of cascade reservoirs considering different ecological flow requirements. Environ. Earth Sci. 2021, 80, 709. [Google Scholar] [CrossRef]
  41. Gandomi, A.H.; Yang, X.S. Chaotic bat algorithm. J. Comput. Sci. 2014, 5, 224–232. [Google Scholar] [CrossRef]
  42. Shen, Y.; Zheng, K.; Wu, C.; Yang, Y. A nature-inspired multiple kernel extreme learning machine model for intrusion detection. KSII Trans. Internet Inf. Syst. (TIIS) 2020, 14, 702–723. [Google Scholar]
  43. Archibe, U.K. NSL Data. 2006. Available online: http://nsl.cs.unb.ca/NSL-KDD (accessed on 10 August 2022).
  44. UNSW-NB15. 2015. Available online: https://www.unsw.adfa.edu.au/unsw-canberra-cyber/cybersecurity/ADFA-NB15-Datasets (accessed on 12 August 2022).
  45. CICIDS2017. Available online: https://www.unb.ca/cic/datasets/ids-2017.html (accessed on 12 August 2022).
  46. scikit-learn[EB/OL]. Available online: http://scikit-learn.org/stable/ (accessed on 6 August 2022).
  47. scikit-opt[EB/OL]. Available online: https://github.com/guofei9987/scikit-opt (accessed on 20 August 2022).
  48. AlHosni, N.; Jovanovic, L.; Antonijevic, M.; Bukumira, M.; Zivkovic, M.; Strumberger, I.; Mani, J.; Bacanin, N. The XGBoost model for network intrusion detection boosted by enhanced sine cosine algorithm. In Proceedings of the Third International Conference on Image Processing and Capsule Networks ICIPCN 2022. Lecture Notes in Networks and Systems, Bangkok, Thailand, 20–21 May 2022. [Google Scholar]
  49. Talita, A.S.; Nataza, O.S.; Rustam, Z. Naïve bayes classifier and particle swarm optimization feature selection method for classifying intrusion detection system dataset. J. Phys. Conf. Ser. IOP Publ. 2021, 1752, 012021. [Google Scholar] [CrossRef]
  50. Shettar, P.; Kachavimath, A.V.; Mulla, M.M.; Hanchinmani, G. Intrusion detection system using MLP and chaotic neural networks. In Proceedings of the 2021 International Conference on Computer Communication and Informatics (ICCCI), Coimbatore, India, 27–29 January 2021. [Google Scholar]
  51. Ahmad, I.; Basheri, M.; Iqbal, M.J.; Rahim, A. Performance comparison of support vector machine, random forest, and extreme learning machine for intrusion detection. IEEE Access 2018, 6, 33789–33795. [Google Scholar] [CrossRef]
  52. Bhati, B.S.; Rai, C.S. Ensemble Based Approach for Intrusion Detection Using Extra Tree Classifier. In Intelligent Computing in Engineering; Springer: Singapore, 2020; pp. 213–220. [Google Scholar]
  53. Fitni, Q.R.S.; Ramli, K. Implementation of ensemble learning and feature selection for performance improvements in anomaly-based intrusion detection systems. In Proceedings of the 2020 IEEE International Conference on Industry 4.0, Artificial Intelligence, and Communications Technology (IAICT), Bali, Indonesia, 27–29 June 2020. [Google Scholar]
Figure 1. The flowchart of the CBA-CLSVE for intrusion detection.
Applsci 12 11298 g001
Figure 2. Individual representation.
Applsci 12 11298 g002
Figure 3. The score of each feature in the NSL-KDD, UNSW-NB15 and CICIDS2017 datasets.
Applsci 12 11298 g003
Figure 4. Different number of features and their corresponding testing accuracy on the NSL-KDD, UNSW-NB15 and CICIDS2017 datasets.
Applsci 12 11298 g004
Figure 5. The fitness of the heuristic algorithms on the NSL-KDD when the iterations are 10 and 20.
Applsci 12 11298 g005
Figure 6. The fitness of the heuristic algorithms on the UNSW-NB15 when the iterations are 10 and 20.
Applsci 12 11298 g006
Figure 7. The fitness of the heuristic algorithms on the CICIDS2017 when the iterations are 10 and 20.
Applsci 12 11298 g007
Table 1. A brief summary of the NSL-KDD, UNSW-NB15 and CICIDS2017 datasets.
DatasetNumber of FeaturesNumber of TypesType of Attacks
NSL-KDD415Probe, DoS, U2R and R2L
UNSW-NB154210Fuzzers, Analysis, Backdoor, DOS, Exploit, Generic, Reconnaissance, Shellcode and Worm
CICIDS2017777Patator, web-attack, DoS, Infiltration, Bot and PortScan
Table 2. Parameters for the base learners.
MethodsParameters
Support Vector MachineC = 1, kernel = ‘rbf’, gamma = ‘auto’
K-Nearest Neighborsn_neighbors = 3
Decision Treecriterion = ‘gini’, random_state = 0, max_depth = 20, min_samples_leaf = 20,
Chaos Bat AlgorithmA = 0.5, fmin = 0, fmax = 2, r is obtained by chaotic mapping
Table 3. The selected features based on the chi-square filtering technology.
DatasetThe Selected FeaturesQuantity
NSL-KDDF12, F14, F22, F23, F25, F26, F27, F28, F29, F30, F31, F33, F34, F35, F36, F37, F38, F39, F40, F4120
UNSW-NB15F3, F9, F10, F11, F13, F20, F21, F22, F23, F28, F31, F32, F33, F34, F35, F36, F40, F41, F4219
CICIDS2017F2, F11, F13, F14, F19, F21, F23, F24, F31, F39, F40, F41, F42, F43, F44, F46, F47, F48, F52, F54, F66, F67, F74, F76, F7725
Table 4. The weight comparison of different voting ensemble methods.
ModelsUse the Weight or Not?Length of the Weight
Hard votingThe majority votingnoN/A
The weighted votingyes3
Soft votingNo weightnoN/A
The classifier-level weightyes3
The class-level weightyes15, 30 or 21
Table 5. Performance comparisons of the base learners and different voting ensemble methods without feature selection on the NSL-KDD dataset.
ModelsDR (%)FPR (%)Acc (%)F1 (%)
SVM97.593.6597.2297.99
KNN98.703.2798.0898.60
DT96.874.9796.3097.30
The majority voting98.304.1897.5598.24
The weighted voting98.843.8598.0098.56
No weight98.593.0298.1098.63
The classifier-level weight98.722.6598.3098.77
The class-level weight99.403.7398.4598.89
Table 6. Performance comparisons of the base learners and different voting ensemble methods without feature selection on the UNSW-NB15 dataset.
ModelsDR (%)FPR (%)Acc (%)F1 (%)
SVM99.8922.0695.2297.05
KNN93.1516.6791.0794.27
DT98.3017.9895.3897.22
The majority voting99.0518.9995.6997.40
The weighted voting 97.5419.2594.3296.52
No weight99.3420.1695.4097.18
The classifier-level weight99.3721.0395.2797.11
The class-level weight99.8320.9595.1196.93
Table 7. Performance comparisons of the base learners and different voting ensemble methods without feature selection on the CICIDS2017 dataset.
ModelsDR (%)FPR (%)Acc (%)F1 (%)
SVM99.1913.6096.6097.90
KNN99.562.8399.1299.46
DT99.364.4298.6699.18
The majority voting99.544.0298.8799.31
The weighted voting99.331.8099.1299.46
No weight99.382.2799.0799.43
The classifier-level weight99.711.9899.3999.63
The class-level weight98.971.1498.9599.35
Table 8. Performance comparisons of the base learners and different voting ensemble methods with feature selection on the NSL-KDD dataset.
ModelsDR (%)FPR (%)Acc (%)F1 (%)
SVM96.495.6195.8396.95
KNN98.194.1697.4898.20
DT96.656.1495.7796.91
The majority voting97.533.2497.2997.80
The weighted voting98.384.6997.4198.11
No weight97.634.3097.0497.87
The classifier-level weight98.254.1497.5098.18
The class-level weight98.574.9097.4998.19
Table 9. Performance comparisons of the base learners and different voting ensemble methods with feature selection on the UNSW-NB15 dataset.
ModelsDR (%)FPR (%)Acc (%)F1 (%)
SVM98.9221.0594.2696.35
KNN91.0318.2188.9492.72
DT98.9418.8395.5097.26
The majority voting99.0520.4195.0796.96
The weighted voting 97.7820.2893.7996.09
No weight99.0920.9094.9596.89
The classifier-level weight98.9421.1494.7396.74
The class-level weight99.4922.5994.6296.65
Table 10. Performance comparisons of the base learners and different voting ensemble methods with feature selection on the CICIDS2017 dataset.
ModelsDR (%)FPR (%)Acc (%)F1 (%)
SVM98.9611.9696.8498.06
KNN99.623.0999.1399.47
DT98.884.5598.2598.93
The majority voting99.502.7299.0899.43
The weighted voting99.623.4799.0399.41
No weight99.631.7799.3799.61
The classifier-level weight99.832.4899.4199.64
The class-level weight99.830.5999.7599.85
Table 11. Performance comparisons of the Class-Level Soft-Voting Ensemble (CLSVE) with feature selection based on different Optimization Algorithms on the three datasets.
ModelsDR (%)FPR (%)Acc (%)F1 (%)
NSL-KDDBA-CLSVE97.504.2196.9797.78
GA-CLSVE97.414.9896.6797.58
CBA-CLSVE97.904.3197.2197.98
UNSW-NB15BA-CLSVE99.0621.5094.6696.68
GA-CLSVE99.0624.0094.1896.40
CBA-CLSVE99.2322.2994.8196.82
CICIDS2017BA-CLSVE99.211.2599.1299.46
GA-CLSVE99.672.2799.3199.57
CBA-CLSVE99.743.2699.1899.50
Table 12. Comparison results with other approaches for intrusion detection on the UNSW-NB15 dataset.
ModelsFeature SelectionClassification Method#FeaturesDR (%)FPR (%)Acc (%)F1 (%)
XGBoost [48]N/ADT4298.7517.1695.2597.01
Naïve bayes [49]N/ANB4298.9458.0680.0386.88
MLPClassifier [50]N/AMLP4299.4121.4394.8296.77
Random Forest [51]N/ADT4299.3518.7395.5097.20
Extra-tree ensemble [52]N/AExtra-tree4297.9816.6994.7896.70
Hete-ensemble [53]Spearman’s rank LR, DT, GradientBoosting2399.0218.9794.8796.75
CBA-CLSVEChi squareSVM, KNN, DT1999.4221.0295.1797.02
Publisher’s Note: MDPI stays neutral with regard to jurisdictional claims in published maps and institutional affiliations.

