Article

Geometric–Statistical Model for Middle-Ear Anatomy and Ventilation

by
Marian Rădulescu
1,†,
Adela-Ioana Mocanu
2,*,
Ionela Teodora Dascălu
3,†,
Mihai-Adrian Schipor
4 and
Horia Mocanu
5,†
1
Department of ENT&HNS, Faculty of Medicine, “Carol Davila” University of Medicine and Pharmacy, 020021 Bucharest, Romania
2
Department of ENT&HNS, Polimed Medical Center, 040067 Bucharest, Romania
3
Department of Orthodontics, Faculty of Dental Medicine, University of Medicine and Pharmacy of Craiova, 200349 Craiova, Romania
4
Institute of Astronomical and Physical Geodesy, Technical University of Munich, 80333 Munich, Germany
5
Department of ENT&HNS, Faculty of Medicine, “Titu Maiorescu” University, 031593 Bucharest, Romania
*
Author to whom correspondence should be addressed.
These authors contributed equally to this work.
Appl. Sci. 2022, 12(21), 11287; https://doi.org/10.3390/app122111287
Submission received: 26 September 2022 / Revised: 2 November 2022 / Accepted: 3 November 2022 / Published: 7 November 2022
(This article belongs to the Section Biomedical Engineering)

Abstract

:
The ventilation of the middle-ear (ME) is achieved by the mucosa covering the bony cavities of this segment, which we have previously defined as consisting of two distinct epithelial areas, each representing an independent organ with characteristic function: the D-Organ and the F-Organ. The D-Organ corresponds to the epithelium covering the Antrum walls (belonging to the central cavities of the middle-ear) and the walls of mastoid and petrous cavities (peripheral cavities of the ME); it ensures the D-Function, the biophysical process comparable to that of energy-consuming ionic membrane pumps, works against electrical trans-membrane gradients to transfer gas molecules against trans-membrane and trans-cellular pressure gradients. The F-Organ corresponds to the epithelium covering the Protympanum, Tympanic Cavity and Aditus ad Antrum (central cavities of ME). The F-Function is represented by the permeability of cell membranes for respiratory gases. This is a general function of all cells and the size of the cellular membrane surface (luminal and basal) and the height of the cell (distance between the two membranes) determines the diffusion flow for each molecular type of gas. The present work aims to give an original point of view on middle-ear geometry and precedence over ME mucosa affliction or structural-anatomic type of the mastoid (pneumatic, pneumato-diploic, diploic, sclerotic). This type of approach to the problem has never been attempted since the two organs have never been previously defined. We aim to establish a clear topographic structure for these two organs within the reference system represented by the anatomy of ME cavities and to establish the reasons why the mastoid and petrous cavitary system grow or stop growing at a certain point in the life of an individual.

1. Introduction

The inside of ME cavities has been defined as representing one of the three state parameters (volume ) that completely defines a thermo-dynamic system εT consisting of a mix ε of σ types of respiratory gases saturated with water vapors at absolute temperature ((1)–(4)):
εT = εT (pε, Vε, Tε)
Tε = 310.15 °K
tε = 37 °C
T0 = 273.15 °K
The partial pressure of water vapors p ε H 2 O is a function of barometric pressure p0 and temperature so that, since p0 and Tε are constant, p ε H 2 O is also constant throughout all processes and states to be discussed ((5) and (6)) [1,2,3]:
p0 = 760 torr
p ε H 2 O = p ε H 2 O ( p 0 , T ε ) = 47 t o r r = c o n s t
It has also been stated that the ME epithelium represents the interface between the thermodynamic system εT and the external environment, the latter also being a completely defined thermodynamic system MT [4]. It has also been experimentally proven that the ME mucosa is mandatorily constituted of two distinct regions, each conducting its own work, L U F and L U D of equal size and opposite directions [4,5]. The exchange in mechanical work between the two systems (εT and MT) insures thermodynamic equilibrium between them, according to the 1st Principle of Thermodynamics.
The first region of ME mucosa is the F-Organ representing a surface element for the diffusion of the three types of respiratory gases σ, according to Fick’s law, from the ME to the internal environment of the body, based on pressure difference Δ p σ between σ types of respiratory gases on each side of the surface, within the time interval τ.
The second region of ME mucosa is the D-Organ which pumps within a time interval τ (same as described for the F-Organ) the same quantity mΔ or νΔ of gas mix diffused through the F-Organ so that the mass mε and total pressure pε of the gas mix inside the ME remain constant [4].
We aim to establish a clear topographic structure for the two defined organs within the reference system represented by the anatomy of ME cavities, namely, to specify a biunique correspondence between the D and F-Organ and the two epithelial regions of the mucosa covering the ME cavities.
Our study is based on purely theoretical calculation and anatomical measurements already established as valid by other studies but the novelty is the accurate description of two previously undefined organs, D and F, and their extent within the ME. We aim to establish a totally new paradigm of mastoid growth, pathology and anatomy.
The current knowledge in Embryology, Anatomy, Histology and Cytology constitutes the starting point for the present work. We especially study the data that has no categorical and definitive explanation at this point: the bony cavities of the middle-ear reach full development within the 7th month of intrauterine growth (Protympanum, Tympanic cavity*, Aditus and Antrum) [6]; the Protympanum, Aditus and Antrum reach maximum volume starting from the 7th month of fetal development [6]; the tympanic cavity* registers only a 20% increase in volume and only within the first 6 months after birth which could be explained by the change in tympanic membrane (TM) position during this period [6]; the volume of inner ear bone cavities (osseous labyrinth) reaches full development simultaneously with the central cavities of the ME, only the ottic capsule has an appositional growth, simultaneous to the post-natal development of the body [6]; the tympano-ossicular apparatus reaches its maximum dimensions during the 7th fetal month [6]; the amplitude of peripheral ME cavities development (mastoid and petrous systems) is a random independent continuous statistic variable, governed by the normal law of probability (Gauss-Laplace Law) [7,8,9,10,11]; the probability of chronic inflammation of ME mucosa is inversely proportional to the amplitude of mastoid cavitary system development but the connection is yet to be explained in a categorical and definitive fashion [7,8,9,10,11].

2. Materials and Methods

The fundamental question in otology as stated in the 19th century is: who has precedence, the anatomic structure of the mastoid (4 types of structures related to the degree of pneumatization*) or the affliction of the ME mucosa?
Some otologists such as Diamant considered that the Anatomic type of mastoid has precedence and stated the endogenous hypothesis (genetical) according to which the types of mastoids are genetical characteristics and the sclerotic and diploic types predispose or facilitate disease. Other authors such as Wittmack stated that the disease comes first and type of mastoid is determined by its presence, formulating the exogenous hypothesis (environmental). Disease, in turn, is determined by aggressive agents both from the environment or within the organism and therefore external to the epithelial cells of the mucosa, hence the name of the theory. The authors of the present article advocate for the exogenous theory and all previous, present or future works will aim to prove its validity.
From the previous paragraphs, we retain the fact that various parts of the ME function differently as far as anatomic growth is concerned. If we consider this behavior as geometric-chronological division criteria, we will obtain, as the first of the ME division, the following two members:
-
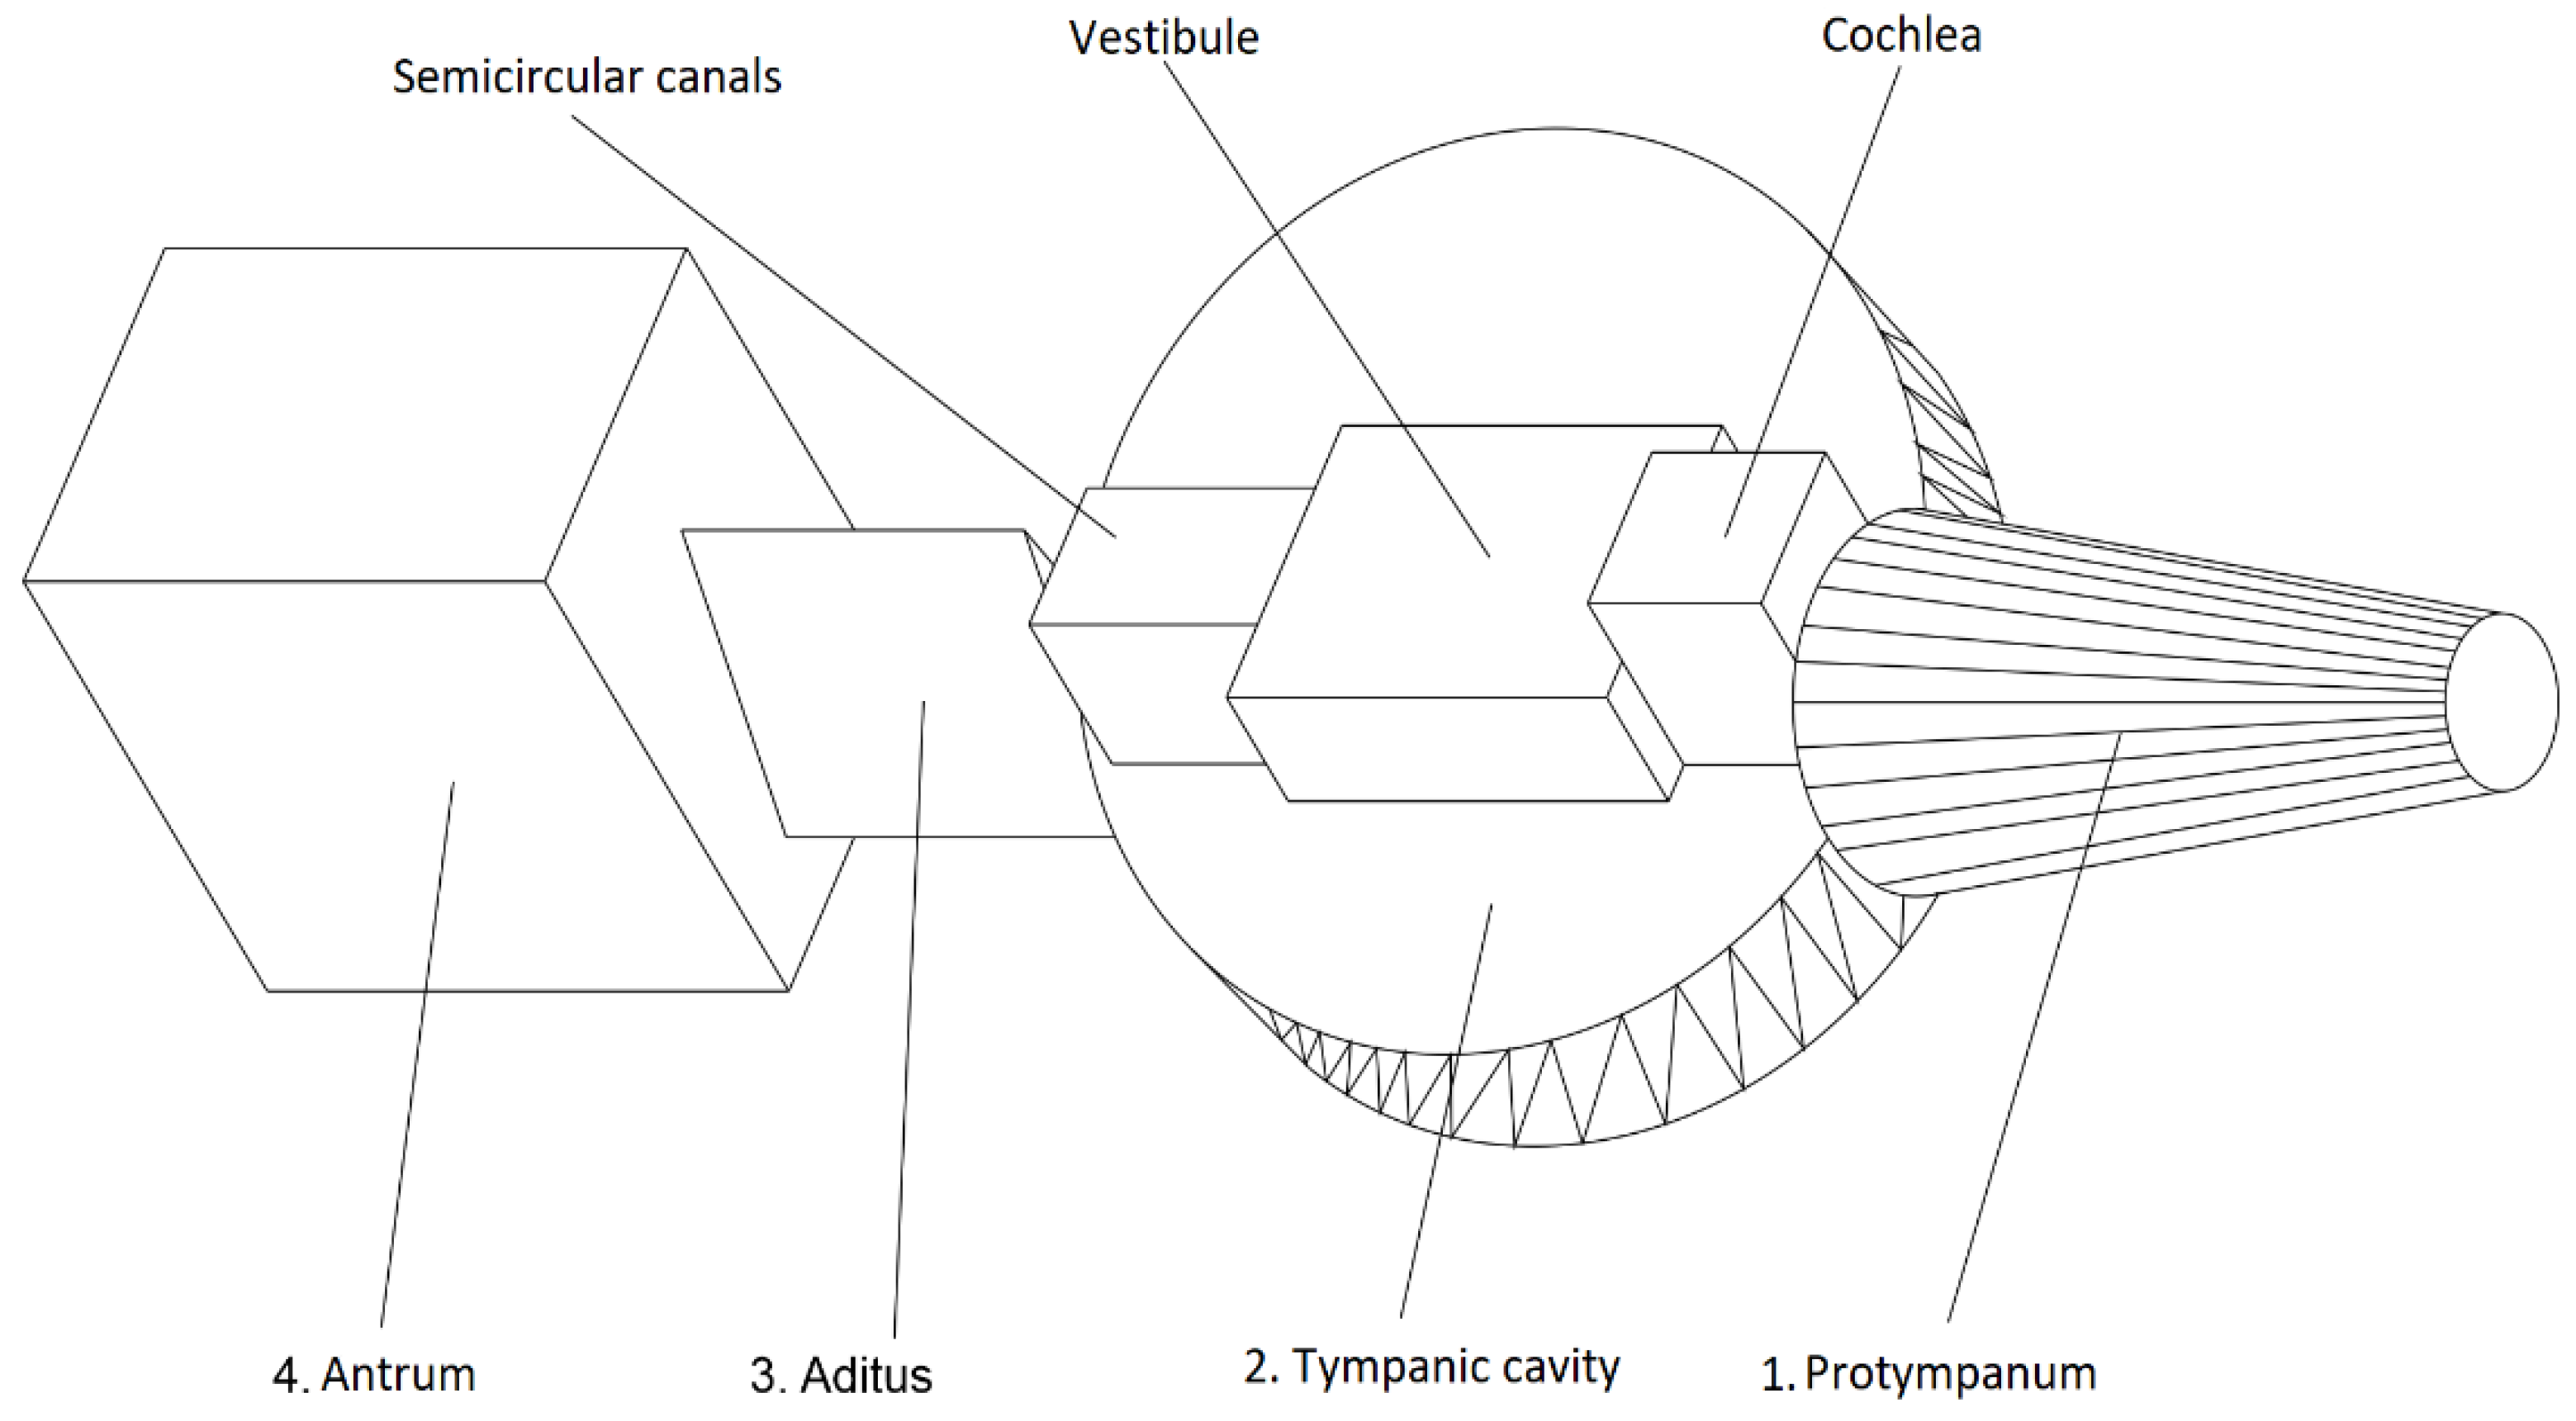
The ME with constant geometry (invariable; immutable; fixed) includes the Protympanum, Tympanic cavity*, Aditus and Antrum. All these segments have the same dimensions* throughout post-natal life starting from the 7th month of fetal life; (this statement assumes the calculated error—[7]):
E*: E* = −5.1%
-
The ME with variable geometry includes mastoid and petrous cavities.
It has been proven, both histologically and cytologically [12,13,14,15,16,17,18], that the epithelium of the ME mucosa is composed of two distinct regions with specific characteristics:
-
Pseudo-unistratified heterogenous epithelium and unistratified but with a pattern of prism-shaped cell of dominant variable dimension hF, perpendicular to the basal membrane (Figure 1). This type of epithelium can be found in most of the mucosa with immutable geometry (Protympanum; Tympanic cavity, Aditus). The value of the height hF is at a maximum in the Protympanum, minimum in the Aditus and has mean values in the Tympanic cavity;
-
Homogenous unistratified epithelium made up of pavement cells of dominant dimension parallel to the basal membrane and constant minimal dimension hD perpendicular to the basal membrane (Figure 1). This is the epithelium of the mucosa covering the Antrum (central cavity of fixed geometry), and the peripheral cavities of the ME (mastoid and petrous)—ME of variable geometry.
By correlating the anatomic (macroscopic) and histologic and cytologic (microscopic) points of view, we can conclude that the ME has a dual structure as follows:
-
An anatomic macroscopic support, of constant geometry (immutable) throughout the course of life, for a F heterogenous epithelium, pseudo-unistratified and unistratified, but with a prism-shaped pattern and completely defined mean sizes (see the geometric modeling that follows). This represents an epithelial surface AF of constant size throughout life, of mean thickness hF, also constant throughout life.
-
An anatomic macroscopic support, of variable geometry (increasing size in all three dimensions, with a completely defined growth rate), for a D homogenous epithelium, of constant thickness hD. This represents an epithelial surface AD of constant thickness hD, increasing surface with a completely defined growth rate. We will define the growth rate as an analytic function of the growth rate of total body mass of an individual and also of the state of the D-cell population state of health expressed in statistical terms.
Thus, these two regions of the epithelium of the ME mucosa are completely defined by the following geometric parameters: epithelial areas AF and AD; epithelial thickness (height) hF and hD. The existence of these two regions is necessary and sufficiently established by the necessity of the two thermodynamic systems εT and MT to exchange mechanical work to reach thermodynamic equilibrium, opposing the existing pressure difference Δpσ [3,4,5]. The geometric properties specific to each epithelial area, (8) and (9), reflect the F and D functions they fulfill:
F = F(AF, hF)
D = D(AD, hD)
Establishing a correspondence between the regions and the two Organs F and D is reduced to establishing a connection between the physical-physiological processes involved and the geometric characteristics of F and D epithelium (the constant of AF area, progressive growth of AD area and the inequality hF > hD). This correspondence will, in turn, answer all of the following questions:
-
Why is the area AF constant throughout life?
-
Why is the area AD increasing simultaneously to the increase in body mass?
-
Why are there circumstances when AD stops growing?
-
Why does the inequality hF > hD even exist?

3. Results

The geometric-statistical-probabilistic model of the macroscopic and microscopic anatomic structure of the ME and its ventilation function is a completely formalized system and the answer to the previously stated questions will be interpreted as solutions to numerical applications of this mathematic model. We need numerical values for the discussed geometric measures: AF, AD, hF and hD. Foror hF and hD, since a direct measurement on histologic samples for AF and AD was possible, a geometric-statistical model of the temporal bone (TB) corresponding to the newborn and an identical model corresponding to an adult were used. This geometric model of the TB started from assimilating the neuro-cranium to a sphere whose internal and external radius were obtained by statistical analysis of numerical values previously published in the literature [7,8,9,10,11]. From these, we have extracted the regular geometrical shape assimilated to the TB (Figure 2). For such a regular shape, all sizes can be calculated at any given time. In both situations (direct measurement or geometric-statistical model), the mean numerical values were used since these have the optimal statistical relevance.
The F-cell is modeled as a parallelepiped with a square base of side lF and height hF:
lF = 1.8 × 10⁻³ [cm]
hF = 3.75 × 10⁻³ [cm]
The D-cell is modeled as a parallelepiped with a square base of side lD and height hD:
lD = 2.6 × 10⁻³ [cm]
hD = 4.5 × 10⁻⁴ [cm]
The base surface SD is
SD = (lD)2 = 6.76 × 10⁻⁶ [cm2]
In newborns (nb), the numerical values of the areas AF = A n b F and AD = A n b D are:
A n b F = 8.79   [ cm 2 ]
A n b D = 21.99   [ cm 2 ]
In adults, the numerical values of the areas AF and AD are:
A F = A n b F = A a F = 8.79   [ cm 2 ]
A a D = 160.02   [ cm 2 ]
In newborns, the total volume Vε of middle-ear cavities is V ε n b
V ε n b = 2.06   [ cm 3 ]
In adults, the total volume Vε of middle-ear cavities is V ε a
V ε a = 12.42   [ cm 3 ]
These values are similar to those previously reported in the literature after processing various CT images of the TB [19,20,21,22,23,24,25].
The area AD of height hD is composed of a finite number n S D of functional units (D-cells) equal to:
n S D = A D S D
SD = (lD)2 = 6.76 × 10⁻⁶ [cm2]
This number n S D is in fact the numerical value of the D-cell population (the ND cardinal of the statistic D-population). The area AF of height hF acts as a single functional unit. A functional unit SD produces* in the interval τ, the energy Q i D which it transforms with η efficiency into useful mechanical work L U i D [1].
  η = L u s e f u l L c o n s u m e d = Q u s e f u l Q c o n s u m e d = Q U i D Q i D = L U i D L i D
η 0.27
L U i D = η Q i D = Q U i D
Thus, according to [21], the area AD will produce* the useful energy Q U D :
Q U D = Q U i D A D S D
Q U D = n S D Q U i D = i = 1 n S D Q U i D
(*the statement relates to actualization of stocked energy within phosphate highly strained bonds, which means consumption of metabolic energy is not producing it, in the strictest sense).
The area AF precisely consumes this energy Q U D acting as surface element for the diffusion of respiratory gases as per Fick’s law. The consumption of energy Q U D is directly proportional to the thickness hF and inversely proportional to the area AF:
Q U D = h F A F = Q U i D A D S D
Equation (25) gives us the metabolic energy consumption Q i D of one single D-cell as:
Q i D = 1 η Q U i D
From Equation (28), we deduce how the useful consumption of metabolic energy Q U i D for each D-cell is an analytical function of the geometric measures discussed for AF, AD, hF and SD:
Q U i D = h F S D A F A D
By comparing this consumption in newborns and adults, we will have the following mathematical expression resulting from (16)–(18) and from the axiom of invariable mean dimensions of cells throughout extrauterine life:
Q U i D n b Q U i D a = h F S D A n b F A n b D × A a F A a D h F S D = A a D A n b D = 7.28
Q U i D n b Q U i D a = A a D A n b D = 7.28
In other words, by increasing the area AD, which means increasing the size of the peripheral cavitary system of the ME (mastoid and petrous), we can obtain a decrease of 7.28 times in the consumption of metabolic energy by the D-Organ. This means that the growth of the peripheral cavitary system is a complex functional adapting mechanism to reduce energy consumption. This function is analogous to the function of the ionic pumps located in the cellular membrane. As a consequence, the D-Function is mandatorily linked to the structure of the D-cell membrane. The D-Function represents a completely defined fraction ΠD of the total area SD of the membrane of the apical pole of the D-Cell (Figure 3).
The fraction complementary to ΠD is ΠF*:
ΠF*= 1 − ΠD
The fraction ΠF* of the area SD fulfills the general function F* (permeability of cellular membrane to respiratory gases; a general function for all cells).
By axiomatic assumption, we consider an equality between the two fractions which leads us to using (33) to:
ΠD = ΠF* = Π = ½
This results in the general function F* to be defined by the sum AF*
AF* = AF + (Π × AD),
where:
Π = ½
is the numeric value for each of the previously discussed fractions.
By replacing AF with the sum AF* in (31), after replacing with the equalities (16)–(18), the expression (31) then becomes:
Q U i D n b Q U i D a = A a F A a D A n b F A n b D = ( A F + Π A a D ) A a D ( A F + Π A n b D ) A n b D = 32.661
α = ( A F + Π A a D ) ( A F + Π A n b D ) = 4.486
Q U i D n b Q U i D a = α A a D A n b D
A a D A n b D = 7.28
In other words, after the previously discussed corrections have been applied (F*), we can state that the metabolic energy consumption of the D-cell in adults is 32.7 times lower than in newborns. We should also state that these solutions have been determined by considering a status-quo previously experimentally ascertained [6,7,8,9,10,11,12,13,14,15,16,17,18] as follows:
-
The constant numerical value of epithelial area AF ((15) and (17));
-
The growth of epithelial area AD, expressed by the inequation ADa/ADnb > 1;
-
The uneven thickness of epithelium F and D, expressed by the inequality hF > hD.
This state of fact represents the subject to previously formulated questions. The mathematical expressions and their solutions are the justified answers to these questions. We have proven that the two epithelial areas, F and D, reflect in a necessary and sufficient way the F and D functions of the two homonymous organs. We can state with reasonable proof that:
-
The D-Organ is the epithelium of the mucosa covering the Antrum (central cavity of the ME) and the peripheral cavities (mastoid and petrous);
-
The F-Organ is the epithelium of the mucosa covering the Protympanum, Tympanic cavity and Additus (central cavities of the ME).

4. Discussions

The dynamics of the biological pump D are completely defined by the volume flow VOD. Generally speaking, the biological pump D is the D-Cell itself. Between the useful consumption of metabolic energy QDUi of the D-cell (30) and the volume flow VOD produced by this cell, there is a directly proportional rapport. The mathematical expression of the volume flow VOD is:
V O D = V Δ n S D τ = V Δ S D A D τ
where:
-
nSD is the total number of D-Cells according to (21);
-
VΔ is the volume corresponding to the mas mΔ or to the number of mols νΔ which is the object of simultaneous transfer between the two thermodynamic systems εT and MT via exchange of useful mechanical work within the time interval τ [4]:
V Δ = V ε Δ p p ε
where Vε and pε are the state parameters of the thermodynamic system εT (volume Vε and pressure pε) and Δp is the difference in pressure between the two thermodynamic systems εT and MT.
An increase in the peripheral cavitary system of the ME (mastoid) is equivalent to an increase in total volume Vε of ME cavities and as consequence an increase in volume VΔ (42):
V Δ a = V Δ n b V ε a V ε n b
The comparison between the volume flow in adults VODa and newborns VODnb is given by the following equation {according to (37)–(39) and (41)}:
V n b O D V a O D = V Δ n b S D A n b D τ n b × A a D τ a V Δ a S D = V Δ n b × A a D   × τ a V Δ a × A n b D × τ n b
V n b O D V a O D = Q U i D n b Q U i D a = α A a D A n b D = 32.66
This means that the volume flow VODa, pumped by the D-cell for an adult, is 32.7 times lower than the volume flow VODnb, pumped by the D-cell for a newborn, yet another expression of adaptive mechanisms to reduce metabolic energy consumption necessary for achieving the D-Function. This mechanism is based precisely on the dual macro- and microscopic anatomic structure of the ME based on its geometric properties AF, AD, hF, hD.
Based on (19), (20), (38) and (43)–(45), the rapport between the time intervals for adults τa and newborns τnb are completely defined by the following mathematical expression (also see Table 1):
τ a = τ n b × α × V ε a V ε n b = τ n b × 27.047
The increase in this time interval in which the exchange of mechanical work takes place between the two thermodynamic systems [4] is the key to providing a definitive and reasoned answer to capital question: why does the peripheral cavitary system of the ME (the mastoid) grow?
Since both organs, F and D perform mechanical work which becomes trading coin between two thermodynamic systems, thus providing thermodynamic equilibrium, the two organs F and D can be defined by a process physical quantity, which is a function of the mechanical work and time, called Power P:
P = L U τ
An increase in time τ determines a decrease in installed power of the two organs F and D (47).
That is why the mastoid grows!
An increase in the peripheral cavitary system of the ME is an anatomic-physiological adaptive mechanism, governed by the laws of physics (the laws of perfect gases and the principles of thermodynamics), by which the installed power of the two organs F and D significantly and simultaneously decreases. As such, the necessary energy consumption for achieving D-Organ function decreases and the saved energy is made available for other cellular functions. A decrease in the installed power of the F-Organ is reflected by a decrease in the flow of diffusion for respiratory gas mix. The flow is inversely proportional to time τ and the latter is increased by mastoid growth:
τa = 27.047⋅τnb
This provides the answer for the question: why is the area AF constant throughout life? We have already shown that the area AF of the epithelium F performing the F-Function is the constant term of the sum in (35) and represents the total surface through which real diffusion of gases takes place (F*-Function). By using the equalities in (38), (43) and (46) to compare the volume flow VOF* of the diffusion F* in adults V a O F * and the volume flow V n b O F * of the diffusion F* in newborns we conclude that volume flow in adults is 22.3% lower than in newborns (also see Table 2):
V a O F * = V Δ a τ a
V n b O F * = V Δ n b τ n b
V a O F * V n b O F * = V Δ a τ a × τ n b V Δ n b
V a O F * = V n b O F * α = 1 α × V n b O F *
1 α = 0.223
Comparing the total diffusion area  A a F * through which total diffusion F* is achieved in adults, and the corresponding area A n b F * in newborns, shows through its mathematical expression resulted from (38) that AF*a is 4.5 times larger than AF*nb.
A a F * = A F + Π A a D
A n b F * = A F + Π A n b D
A a F * A n b F * = A F + Π A a D A F + Π A n b D = α = 4.486
The results of the comparisons above are apparently paradoxical:
There is a decrease in real diffusion flow F* (F*-Function) concomitant with an increase in total real diffusion area AF* (35) by 4.5 times.
This completes the demonstration regarding the decrease in Installed power of the F*-Organ, through:
-
Growth of the peripheral cavitary system of the ME (mastoid) (40), (32), (16), (18);
-
Constant value (invariability) of the other segments of the ME (17).
The intuitive image on the amplitude of decrease in Installed power of the F*-Organ is best depicted as follows: if the diffusion surface increases 4.5 times (56), and is directly proportional to the diffusion flow, an apparently paradoxical decrease (by 22.3%) in the flow ((52) and (53)), signifies a decrease in Power P (47) caused by an increase in time period τ ((46) and (48)), since useful mechanical work LUF* is directly proportional to flow: LUF*~VOF*.
We consider that a more plastic description of the physical phenomena involved is necessary. As an example, everyone notices that after going for a day at the beach, the parent’s inflatable mattress deflates annoyingly slower that the child’s inflatable beach ball even though both valves have the same caliber. This valve situation is similar to the constant diffusion area AF (F-Organ) throughout life. This underlines the relationship between time and volume, perceived as physical parameters. The mattress deflates slower which means that the physical process parameter called Power is small and inversely proportional to time. The inflatable ball is at least 10 times smaller and has more Power, thus deflating faster.
This analogy depicts the most accessible parameter of the two thermodynamic systems we discussed (εT—adult and εT—newborn)—total volume Vε of ME cavities for adults Vaε (20) and newborns Vnbε (19).
The equalities (19), (20), (57), (42), (43), (46), (47) and (48) constitute formalizations of this global comparison which helps us represent the objective cause of ME peripheral cavity system volume growth.
Finally, this objective cause is the need for a decrease in useful metabolic energy QDUi consumed by each D-Cell in order to accomplish its task of biological energy consuming pump.
The increase in the peripheral cavitary system of the ME is an anatomic-physiological mechanism to accomplish a decrease in energy use for D-cells. This signifies an increase in total volume of the cavity (increase in the sum of all constituting volumes). These cavities are layered with unicellular epithelium made up of D-cells. The macroscopic anatomic support for the D-Epithelium comprises basal membrane; lamina propria; submucosa; and periosteum; bone. The tridimensional growth of this anatomic support is strictly controlled by the multiplying process of the D-Cells (the increase in D-cell population equivalent to the increase in the Epithelial Area AD).
The D-cell population on the surface of the Antrum is constant throughout the post-natal life or, in other words, a new generation constantly replaces the old one (this area is one of the terms in the constant sum AF (15) and (17)).
(AF = AProtympanum + ATympanic cavity + AAditus + AAntrum)
Topographically, the Antrum belongs to the fixed geometry middle-ear but functionally to the D-Organ.
The thermodynamic systems εT and MT are comprised of the ε mixture of σ respiratory gas types; thus, the D-Organ is comprised of σ species of pumps corresponding to the gas species. The dynamics and kinematics of each species of pump is governed by Dalton’s Law of partial pressures (in a mixture of non-reacting gases, the total pressure exerted is equal to the sum of the partial pressures of the individual gases).
We only have to answer one more vital question: why does the peripheral cavity system of the middle-ear (the mastoid) stop growing? The answer will come by objectively analyzing the cause of its growth. This is an interaction between the laws of physics and the D-cell population. The only factor that could be considered inconsistent in this relationship is the D-cell population which can be either healthy (normal) or afflicted (abnormal). Thus, we conclude that the health of the D-cell population is the necessary and sufficient condition for proper functioning of the aforementioned mechanism. Depending on the physiological state of each D-cell, the increase in D-cell population proves to be:
-
Useful (decreases the cell energy consumption); or
-
Useless, (does not decrease the cell energy consumption) at which point there is a process cessation.
The usefulness is measured by decreasing the installed power of the D-Organ or decreasing the energy consumption of each D-cell separately. The moment when the growth of the D-cell population is annulled is the moment when the maximum ratio of afflicted D-cells is reached. Starting here, an increase in D-cell population will no longer decrease the installed power of the D-Organ or the energy consumption of each D-cell separately.
This means that determining the maximum ratio of afflicted D-cells yjMAX is extremely important. The key to solving this problem is the fraction Π and its numeric value. As previously demonstrated, each of the functions D and F* have a fraction (ΠD and ΠF*) completely defined by the lumen membrane surface of the D-cell, and the two fractions are complementary ((33) and (34)). This leads to:
ΠD = ΠF* = Π = ½
We consider axiomatically that Π = ½. This numeric value of Π has the following significance (Figure 4):
  • Determines the numeric values of the ratio xj of healthy D-cells within the D-cell population:
    x j max = 2 Π = 1 = 100 %
    x j min = 1 Π = 0.5 = 50 %
  • Determines the numeric values of the ratio yj of afflicted D-cells:
    y j max = 1 x j min = 1 ( 1 Π ) = 0.5 = 50 %
    y j min = 1 x j max = 1 2 Π = 0 = 0 %
  • The determinations above are based on the sufficiently substantiated expression:
    x j = 1 y j
Given the relations between the three terms: Π, xj and yj, we determine yjMAX by solving a system of first-degree algebraic equations. This system enunciates the following problem:
-
For which numeric value of Π*, the ratio of metabolic energy consumption QDUit1 and QDUit2 of the D-cell, measured at two different moments t1 and t2, becomes equal to 1 (one) (QDUit1 = QDUit2) (QDUit1/QDUit2 = 1) (no decrease in energy consumption), and during the considered interval the area AD increased by one unit [1 cm2] (AD + 1)?
In other words,
-
For which numeric value of Π*, the increase in the D-cell population (AD + 1) {(12), (14), (21) and (22)} becomes useless since it determines no decrease in energy consumption for each D-cell separately or no decrease in installed power for the whole of the D-Organ?
The system of first-degree algebraic equations is:
y j M A X = Π ( 1 Π * )
x j M I N = 1 ( 1 Π * ) Π
Q U i t 1 D Q U i t 2 D = 1
where:
according to Equations (28), (30), (54), (35), (17) and to equalities:
A t 1 F = A t 2 F = A F
A t 1 F * = A t 1 F + Π A t 1 D
which derive from (17), (54) and (35)
Q U i t 1 D = h F S D ( A F + Π A t 1 D ) A t 1 D
and according to equalities
A t 2 D = A t 1 D + 1
A t 2 F * = A F + Π * × A t 2 D
Q U i t 2 D = h F S D [ A F + Π * ( A t 1 D + 1 ) ] ( A t 1 D + 1 )
the Equation (65) becomes:
Q U i t 1 D Q U i t 2 D = [ A F + Π * ( A t 1 D + 1 ) ] ( A t 1 D + 1 ) ( A F + Π × A t 1 D ) A t 1 D = 1
From (72), we extract Π*:
Π * = A t 1 D ( A F + Π A t 1 D ) A F ( A t 1 D + 1 ) ( A t 1 D + 1 ) 2 = 0.4408
According to equalities (16), (17) and the axiomatically established equality (74):
A t 1 D = A n b D = 21.99
The solutions to the equation systems are:
Π * = 0.4408
from (63) and (75) results
y j M A X = Π ( 1 Π * ) = 0.28
from (64) and (75) results
x j M I N = 1 ( 1 Π * ) Π = 0.72
The answer to the question: why does the mastoid stop growing? as seen on X-ray or CT-scans, the reason is that at least 28% of the cell of the Danaid Organ [4] are afflicted, thus rendering the further growth useless in terms of metabolic energy saving. This is a permanent state—the growth process will never restart. We can now postulate that between the state of the D-Organ (health/disease) and its growth, there is a direct causal connection as follows:
D-Organ HealthME Mucosa Health → Large Mastoid (pneumatic)
D-Organ DiseaseME Mucosa Disease → Small Mastoid (diploic; sclerotic)
This connection is also a statistic direct causal link, thus completely quantitatively defined which is extremely important for ME pathology and clinical follow-up.
The answer to the question: which came first, the disease or the anatomic conformation of the mastoid? is easily enounced as follows: the growth of the mastoid takes place for as long as the ratio of afflicted D-cells stays between 0% and 27%, and the growth stops when the ratio is between 28% and 50%.
The state of the D-Organ (health or disease) can be statistically quantitatively defined (Figure 5). The two states are complementary and able to coherently and noncontradictory explain the chronic inflammatory pathology of the ME. In other words, the state of the ME mucosa is completely determined by the state of the D-Organ.
A three-dimensional representation of the ME within the temporal bone is necessary to determine the positioning of the D and F-Organ. The temporal bone is modeled as a compounded regular geometric solid, formed by two other regular geometric solids: a right pyramid with a triangular base and a spherical crown. This compounded geometry resembles a thumbtack (Figure 6).
The F-Organ is the invariable geometry ME (fixed geometry), compounded regular geometric solid formed of four regular coaxial tangent geometric solids (Figure 2):
  • One truncated cone (Protympanum);
  • One cylinder (Tympanic cavity);
  • One right prism with a triangular base (Aditus);
  • One cube (Antrum);
-
All these solids share a symmetry axis;
-
This axis is identical to the line representing the collinear heights of the pyramid and the spherical crown (also constituting the symmetry axis of the thumbtack);
-
Thus, the fixed geometry ME (F-Organ) is a cavity with shape described above, a cavity within the thumbtack (the temporal bone) (Figure 2).
The D-Organ is the variable geometry ME (peripheral cavities of the ME); the inner space of the thumbtack is delimited as follows (Figure 7):
  • On the exterior by the lateral total surface of the thumbtack.
  • On the interior by the lateral total surface of the fixed geometry ME (central or axial cavities of the ME).
The geometric model of the temporal bone (in adults) shows the following endo-temporal spatial structure expressed by the numeric values of its topographic division’s ratios (Figure 8).
  • The segment around the Protimpanum represents 7% of the D-cell population;
  • The segment around the Tympanic cavity represents 18% of the D-cell population;
  • The segment around the Aditus represents 10% of the D-cell population;
  • The segment around the Antrum represents 65% of the D-cell population.
The endo-temporal spatial structure of the D-Organ is the second statistic quantitative measure that completely defines the state of the organ and consequently the health state of the ME mucosa (the first being the ration of afflicted D-cells), which is extremely important in otology practice.
The mastoid air cell system (MACS) spreads widely and irregularly inside the pyramid-shaped temporal bone and is therefore very difficult to measure directly. Middle-ear pathology and the subsequent hearing loss are two of the most serious problems confronting the otologist and could be caused by a number of clinical and environmental factors [26]. Understanding the pneumatization and anatomic layout is paramount for successfully draining inflammatory lesions. The distribution of middle-ear mucosa lesions is 10% for lesions localized in the anterior and 90% of posterior lesions to a frontal conventionally drawn geometric plan running through the middle of the tympanic cavity, dividing the axial and coaxial spaces of the ME (by ME we understand the sum of protympanum and the cells around it, tympanic cavity with corresponding cells, aditus and antrum with peri-adital cells, mastoid antrum with peri-antral cells) into two segments, anterior and posterior, to the defined geometric plan [27,28].
A number of methods for measuring the size of mastoid pneumatization have been reported: the water-weight method, pressurized transducer method and planimetric method [24,29,30]. The development of radiology has opened new windows into assessing the volume of the mastoid cells and a positive correlation between volume and surface area of MACS has been shown [29,31]. The volume of interconnected air cells is difficult to measure and planimetric [10,25,31,32,33] and volumetric [10,25,30,34,35,36,37] methods have been used. Byun et al. use software manipulated computed tomography scans of 54 normal TBs to conclude that the range of volume and surface area of the MACS is wide even in subjects with normal ME and this large variation should be considered when studying the volume or surface of MACS [24].
In accordance with our conclusions, the study by Sadé and Fuchs [38] reports that cholesteatomas in the attic and mastoid are mainly associated to poorly pneumatized mastoids (sclerotic or diploic), in both adults and children and cholesteatomas of the tympanic cavity, with an intact TM (congenital cholesteatomas) [39] usually associate to pneumatized mastoid processes.
Csakany et al. [25] also report that functional volume of MACS in children with otitis media with effusion acts as a pressure buffer and the surface area for gas exchange is small, which has a negative effect on mastoid pneumatization. The size of pneumatization may also be associated with the propensity of the epithelium to opportunistically expend [40,41]. A study by Zhao et al. [21] reports a mean volume of TB pneumatization of 1.17 ± 0.44 mL under 1 year of age and 6.81 ± 1.93 mL in adults similar to our calculations of 2.06 mL in newborns and 12.42 mL in adults. Schillinger et al. [40] states that pneumatization ceases after puberty whilst other studies claim that it continues throughout life at different rates [32,37,40,42,43]. Diamant et al. [8] advocate for the genetic theory (endogenous hypothesis) of mastoid pneumatization whilst other authors such as Wittmaack [7] support the environmental theory (exogenous hypothesis) which states that the degree of epithelization is influenced by external factors such as by episoded of otitis media or tubal disorders during childhood. The authors of the present article advocate for the exogenous theory and all previous, present or future works will aim in proving its validity.

5. Conclusions

The F-Organ performs the F-Function, is localized within the first three central cavities or fixed geometry cavities of the ME-Protympanum, Tympanic cavity and Aditus ad antrum and is formed of the epithelium mucosa lining of these cavities.
The D-Organ is localized within the Antrum (axial cavity of fixed geometry) and within the peripheral variable geometry cavities-mastoid and petrous cells. It is formed of the epithelium of the mucosa lining these cavities.
The D-Organ can be found in one of the two complementary states, health or disease, and determines the health/disease status of the entire mucosa in the ME. These complementary states are completely defined by statistic quantitative parameters and represent random mass phenomena governed by normal law of distribution of Gauss-Laplace. The essential characteristic of random mass phenomena is the tendency towards constant occurrence frequency or prevalence within a given general statistical population.
The relationship between the health status of the D-Organ and the health status of the ME mucosa is one of cause → effect. The same relationship exists between the disease status of the D-Organ and the disease status of the ME mucosa. Both are statistic causal relationships.
The two states of the D-Organ are the two complementary events of a certain event called the existence of the D-Organ.
The health status of the D-Organ is based on the presence of a number of healthy D-cells (D-function active at an optimal level) and ratio within the closed interval [0.73; 1] and a number of diseased D-cells (D-function abolished) and ratio within the closed interval [0; 0.27]. The health status of the D-Organ determines:
  • An increase in D-cell numbers (mastoid growth);
  • A decrease in metabolic energy consumption of the D-cell for performing the D-function;
  • The optimal function, independent of time, of the D-Organ and of each healthy D-cell (no risk of malfunction, reliability R, R(t) = 1).
The disease status of the D-Organ is based on the presence of a number of diseased D-cells (D-function abolished) and ratio within the closed interval [0.28; 0.5], and a number of healthy D-cells (D-function active) and ratio within the closed interval [0.5; 0.72]. The disease status of the D-Organ determines:
  • The stopping of mastoid growth (stopping the increase in D-cell population);
  • An increase in metabolic energy consumption of the healthy D-cells for performing the D-function;
  • Fatigue or aging of the D-function of healthy D-cells as the subject grows older [rick of malfunction, reliability R, R(t) → 0)]. The attrition finally leads to abolishing the D-function of all the initially healthy D-cells. In other words, the disease status of the D-Organ is evolving (gets worst in time) and this process ends when all D-cells become diseased (defective-D-function abolished) and the entire D-Organ will be non-functional or defective. The ultimate physiological expression of this process is the abolishment of the ventilation function of the ME.
The relationships between the two states of the D-Organ (health-disease) is statistically causal and consequently the same relationships govern the ME mucosa. Diseased ME mucosa results from irreversible lesions of the D-cells, which abolishes the D-function; all other functions of the cells remain intact. The irreversible lesion determines chronic disease-chronic otitis media by generating chronic inflammation (abnormal inflammatory response of the tissues by self-maintenance of specific inflammatory reactions) and continuous clinical aggravation.
By comparison, an acute otitis media determines an acute inflammatory reaction (normal response of tissues) which ends once the causing agent is eliminated. Thus, an acute otitis media develops on normal mucosa (healthy ME) and once it is healed, leaves behind the same normal mucosa (totally reversible phenomenon to previous healthy ME status). We conclude that there is no relation between the appearance of acute otitis media and chronic otitis media. We also conclude that the term, inflammatory chronic disease of the middle-ear mucosa (ICD-MEM), is a much more suitable term for defining all clinical types of chronic otitis media.

Author Contributions

M.R., I.T.D. and H.M. have contributed equally to this work and should, therefore, be considered first authors of this article. Conceptualization, M.R. and H.M.; methodology, M.R., H.M. and I.T.D.; software, A.-I.M. and M.-A.S.; validation, M.R., I.T.D. and H.M.; formal analysis, A.-I.M., H.M. and I.T.D.; investigation, M.R., H.M. and I.T.D.; resources, A.-I.M., M.-A.S. and H.M.; data curation, H.M., M.-A.S. and A.-I.M.; writing—original draft preparation, M.R. and H.M.; writing—review and editing, M.R. and I.T.D.; visualization, M.R., H.M. and I.T.D.; supervision, H.M. and M.R.; project administration, H.M., M.R. and I.T.D. A.-I.M. and M.-A.S. have made substantial contributions to the acquisition, analysis and interpretation of the data and gave a final view of the article. A.-I.M. and M.-A.S. were also responsible of the data analysis and graphical representation of the results and gave a final view of the article. All authors have read and agreed to the published version of the manuscript.

Funding

No funding was received.

Institutional Review Board Statement

Not applicable.

Informed Consent Statement

Not applicable.

Data Availability Statement

Not applicable.

Conflicts of Interest

The authors declare no conflict of interest.

References

  1. Guyton, A.C. Textbook of Medical Physiology, 8th ed.; WB Saunders Company: Philadelphia, PN, USA; Harcourt Brace Jovanovich Inc.: San Diego, CA, USA, 1991; pp. 2, 274, 433–437, 744, 792. [Google Scholar]
  2. Best, C.H.; Taylor, N.B. The Physiological Basis of Medical Practice, A Text in Applied Physiology, 6th ed.; The Williams & Williams Company: Baltimore, MD, USA, 1955; Part III, Chapter 31. [Google Scholar]
  3. Piiper, J. Physiological Equilibria of Gas Cavities in the Body. In Respiration, Handbook of Physiologie, A Critical Comprehensive Presentation of Physiological Knowledge and Concepts; Fenn, W.O., Rahn, H., Eds.; American Physiological Society: Washington, DC, USA, 1965; Volume 2, pp. 1205–1218. [Google Scholar]
  4. Radulescu, M.; Mocanu, H.; Nechifor, A.; Mocanu, A.I. Thermodynamic Model for Middle-Ear Ventilation—Defining The D-Organ by Comparison to The Eustachian Tube (Re-Interpretation of A Classic Experiment and Review of Literature). Acta Tech. Napoc. Ser. Appl. Mat. Mec. Eng. 2022, 65, 69–78. [Google Scholar]
  5. Yee, A.L.; Cantekin, E.I. Effect of Changes in Systemic Oxygen Tension on Middle Ear Gas Exchange. Ann. Otol. Rhinol. Laryngol. 1986, 95, 369–372. [Google Scholar] [CrossRef] [PubMed]
  6. Eby, T.L.; Nadol, J.B. Postnatal Growth of the Human Temporal Bone—Implication for Cochlear Implants in Children. Ann. Otol. Rhinol. Laryngol. 1986, 95, 356–364. [Google Scholar] [CrossRef]
  7. Almour, R.X. The Practical Application of Wittmaack’s Theory of Pneumatization. Ann. Otol. Rhinol. Laryngol. 1933, 42, 112–125. [Google Scholar] [CrossRef]
  8. Diamant, M. Otitis and Pneumatization of the Mastoid Bone; Hakon Olsons Boktryckeri: Lund, Sweden, 1940; pp. 1–149. [Google Scholar]
  9. Tumarkin, A. On the Nature and Significance of Hypocellularity of the Mastoid. J. Laryngol. Otol. 1959, 73, 33–34. [Google Scholar] [CrossRef] [PubMed]
  10. Palva, T.; Palva, A. Size of the Human Mastoid System. Acta. Otolaryngol. Stockh. 1966, 62, 237–251. [Google Scholar] [CrossRef]
  11. Tos, M.; Stangerup, S.E.; Andreassen, U.K. Size of the Mastoid Air Cells and Otitis Media. Ann. Otol. Rhinol. Laryngol. 1985, 94, 386–392. [Google Scholar] [CrossRef]
  12. Junqueira, L.C.; Carneiro, J.; Long, J.A. Basic Histology, Lange Medical Publications; Appleton-Century-Crofts: Norwalk, CT, USA; Los Altos, CA, USA, 1986; pp. 64–76, 80–82, 140–165, 227, 380–386. [Google Scholar]
  13. Shimada, T.; Lim, D.J. Distribution of Cilliated Cells in the Human Middle Ear. Ann. Otol. Rhinol. Laryngol. 1972, 81, 203. [Google Scholar] [CrossRef] [PubMed]
  14. Sammut, J.J. Disposition of the Middle Ear Mucosa. J. Laryngol. 1968, 82, 238. [Google Scholar] [CrossRef] [PubMed]
  15. Hentzer, E. Ultrastructure of the Normal Mucosa in the Human Middle Ear, Mastoid Cavities and Eustachian Tube. Ann. Otol. Rhinol. Laryngol. 1970, 79, 1143. [Google Scholar] [CrossRef]
  16. Sadé, J. Middle Ear Mucosa. Arch. Otolaryngol. Head Neck Surg. 1966, 84, 131. [Google Scholar] [CrossRef] [PubMed]
  17. Hilding, D.A. Ultrastructure of Middle Ear Mucosa and Organisation of Cilliary Matrix. Ann. Otol. Rhinol. Laryngol. 1971, 80, 306. [Google Scholar] [CrossRef] [PubMed]
  18. Hentzer, E. Histologic Studies of the Normal Mucosa in the Middle Ear, Mastoid Cavities and Eustachian Tube. Ann. Otol. Rhinol. Laryngol. 1970, 79, 825. [Google Scholar] [CrossRef] [PubMed]
  19. Murata, K.; Isano, M.; Azuma, H.; Ito, A.; Kimura, H. Computerized Assessment of Pneumatization in Temporal Bone. In Proceedings of the Abstract Book, XVI World Congress of Otorhinolaryngology Head and Neck Surgery, Sydney, Australia, 2–7 March 1997; pp. 254–255. [Google Scholar]
  20. Azuma, H.; Isano, M.; Murata, K.; Ito, A.; Tanaka, H.; Kawamoto, M. Morphological Characterization of Air Cells in Temporal Bone by Digital Processing of C.T. Images. In Proceedings of the Abstract Book, XVI World Congress of Otorhinolaryngology Head and Neck Surgery, Sydney, Australia, 2–7 March 1997; Volume 317. [Google Scholar]
  21. Zhao, P.; Ding, H.; Lv, H.; Li, J.; Liu, X.; Yang, Z.; Wang, Z. Growth pattern of temporal bone pneumatization: A computed tomography study with consecutive age groups. Surg. Radiol. Anat. 2018, 41, 221–225. [Google Scholar] [CrossRef]
  22. Munhoz, L.; Hiroshi Iida, C.; Abdala, R., Jr.; Abdala, R.; Arita, E.S. Mastoid Air Cell System: Hounsfield Density by Multislice Computed Tomography. J. Clin. Diagn. Res. 2018, 12, TC01–TC03. [Google Scholar] [CrossRef]
  23. Lima, M.A.R.; Farage, L.; Cury, M.C.L.; Bahmad, F., Jr. Mastoid surface area-to-volume ratios in adult brazilian individuals. Braz. J. Otolaryngol. 2013, 9, 446–453. [Google Scholar] [CrossRef] [Green Version]
  24. Byun, S.W.; Lee, S.S.; Park, J.Y.; Yoo, J.H. Normal Mastoid Air Cell System Geometry: Has Surface Area Been Overestimated? Clin. Exp. Otolaryngol. 2016, 9, 27–32. [Google Scholar] [CrossRef] [PubMed]
  25. Csakanyi, Z.; Katona, G.; Josvai, E.; Mohos, F.; Sziklai, I. Volume and Surface of the Mastoid Cell System in Otitis Media with Effusion in Children: A Case-Control Study by Three-Dimensional Reconstruction of Computed Tomographic Images. Otol. Neurotol. 2011, 32, 64–70. [Google Scholar] [CrossRef]
  26. Neagu, A.; Mocanu, A.I.; Bonciu, A.; Coadă, G.; Mocanu, H. Prevalence of GJB2 gene mutations correlated to presence of clinical and environmental risk factors in the etiology of congenital sensorineural hearing loss of the Romanian population. Exp. Ther. Med. 2021, 21, 612. [Google Scholar] [CrossRef] [PubMed]
  27. Mocanu, H.; Mocanu, A.I.; Bonciu, A.; Coada, G.; Schipor, M.A.; Radulescu, M. Analysis of long-term functional results of radical mastoidectomy. Exp. Ther. Med. 2021, 22, 1216. [Google Scholar] [CrossRef] [PubMed]
  28. Mocanu, H.; Mocanu, A.I.; Coada, G.; Bonciu, A.; Schipor, M.A.; Radulescu, M. Analysis of long-term anatomic results of radical mastoidectomy. Exp. Ther. Med. 2022, 23, 156. [Google Scholar] [CrossRef] [PubMed]
  29. Park, M.S.; Yoo, S.H.; Lee, D.H. Measurement of surface area in human mastoid air cell system. J. Laryngol. Otol. 2000, 114, 93–96. [Google Scholar] [CrossRef] [PubMed]
  30. Koc, A.; Ekinci, G.; Bilgili, A.M.; Akpinar, I.N.; Yakut, H.; Han, T. Evaluation of the mastoid air cell system by high resolution computed tomography: Three-dimensional multiplanar volume rendering technique. J. Laryngol. Otol. 2003, 117, 595–598. [Google Scholar] [CrossRef] [PubMed]
  31. Valtonen, H.J.; Dietz, A.; Qvarnberg, Y.H.; Nuutinen, J. Development of mastoid air cell system in children treated with ventilation tubes for early-onset otitis media: A prospective radiographic 5-year follow-up study. Laryngoscope 2005, 115, 268–273. [Google Scholar] [CrossRef]
  32. Cinamon, U. The growth rate and size of the mastoid air cell system and mastoid bone: A review and reference. Eur. Arch. Otorhinolaryngol. 2009, 266, 781–786. [Google Scholar] [CrossRef]
  33. Hug, J.E.; Pfaltz, C.R. Temporal bone pneumatization. A planimetric study. Arch. Otorhinolaryngol. 1981, 233, 145–156. [Google Scholar] [CrossRef]
  34. Flisberg, K.; Zsigmond, M. The size of the mastoid air cell system. Planimetry-direct volume determination. Acta Otolaryngol. 1965, 60, 23–29. [Google Scholar] [CrossRef]
  35. Todd, N.W.; Pitts, R.B.; Braun, I.F.; Heindel, H. Mastoid size determined with lateral radiographs and computerized tomography. Acta Otolaryngol. 1987, 103, 226–231. [Google Scholar] [CrossRef]
  36. Vrabec, J.T.; Champion, S.W.; Gomez, J.D.; Johnson, R.F., Jr.; Chaljub, G. 3D CT imaging method for measuring temporal bone aeration. Acta. Otolaryngol. 2002, 122, 831–835. [Google Scholar] [CrossRef]
  37. Lee, D.H.; Jun, B.C.; Kim, D.G.; Jung, M.K.; Yeo, S.W. Volume variation of mastoid pneumatization in different age groups: A study by three-dimensional reconstruction based on computed tomography images. Surg. Radiol. Anat. 2005, 27, 37–42. [Google Scholar] [CrossRef]
  38. Sadé, J.; Fuchs, C. A comparison of mastoid pneumatization in adults and children with cholesteatoma. Eur. Arch. Otorhinolaryngol. 1994, 251, 191–195. [Google Scholar] [CrossRef] [PubMed]
  39. Derlacki, E.L. Etiological aspects in congenital cholesteatoma. In Cholesteatoma. First International Conference; McCabe, B., Sadé, J., Abramson, M., Eds.; Aesculapius: Birmingham, AL, USA, 1977; pp. 208–211. [Google Scholar]
  40. Schillinger, R. Pneumatization of the mastoid. Radiology 1939, 33, 54–67. [Google Scholar] [CrossRef]
  41. Zollikofer, C.P.; Weissmann, J.D. A morphogenetic model of cranial pneumatization based on the invasive tissue hypothesis. Anat. Rec. 2008, 291, 1446–1454. [Google Scholar] [CrossRef] [PubMed] [Green Version]
  42. Chatterjee, D.; Ghosh, T.B.; Ghosh, B.B. Size variation of mastoid air cell system in Indian people at different age groups: A radiographic planimetric study. J. Laryngol. Otol. 1990, 104, 603–605. [Google Scholar] [CrossRef] [PubMed]
  43. Isono, M.; Ito, A.; Nakayama, K.; Miyashita, H.; Saito, K.; Murata, K. Computerized assessment of developmental changes in the mastoid air cell system. Int. Congr. Ser. 2003, 1254, 487–491. [Google Scholar] [CrossRef]
Figure 1. The F-cell is shaped as a parallelepiped with a square base of side lF and height hF; the D-cell is shaped as a parallelepiped with a square base of side lD and height hD.
Applsci 12 11287 g001
Figure 2. Three-dimensional representation of the fixed geometry middle-ear and inner-ear according to the geometric model of the temporal bone.
Applsci 12 11287 g002
Figure 3. The apical pole of the D-cell with the two fractions of its surface for D-Function and F*-Function.
Applsci 12 11287 g003
Figure 4. Explanation of the significance on numerical values for the Π fraction.
Applsci 12 11287 g004
Figure 5. The complementary states of the D-Organ (middle-ear mucosa).
Applsci 12 11287 g005
Figure 6. Three-dimensional representation of the temporal bone according to the geometric model for an adult: 1—right pyramid with a triangular base; 2—spherical cap.
Applsci 12 11287 g006
Figure 7. Three-dimensional rapport between the temporal bone of the adult and the fixed geometry middle-ear cavities, on an axial section of the two regular geometric coaxial compound bodies. The image defines within the section plan the space available for the existence of the middle-ear peripheral cavity system (mastoid and petrous), also defined as the space available for the existence of variable geometry middle-ear (Danaid Organ).
Applsci 12 11287 g007
Figure 8. Endo-temporal three-dimensional representation of the D-Organ expressed by numerical values of the weight of its topographic divisions: (a) segment around the Protympanum 7% of D-cell population; (b) segment around the Tympanic cavity 18%; (c) segment around the Aditus 10%; (d) segment around the Antrum 65%.
Applsci 12 11287 g008
Table 1. Time τ for the bilateral transfer of the mass mΔ of gas mix between the two thermodynamic systems εT and MT.
Gas TypeDiffusion Time [seconds]
O2CO2N2Gas Mix
Diffusion timeτO2τCO2τN2τamestec = (τO2⋅VOF∗O2/VOF∗) + (τCO2⋅VOF∗CO2/VOF∗) + (τN2⋅VOF∗N2/VOF∗)
Newborn6.610.36512.363.71
Adult178.789.87334.3100.344
Table 2. Mean Volume Flow over 24 h for the real diffusion (F*) of respiratory gases from the Middle-ear cavities to the internal environment of the human body.
Volume Flow [cm3/24 h]
Gas TypeO2CO2N2Total Gas Mix
Newborn110.872317.97858.873287.71
Adult102.672146.44795.312254.55
Publisher’s Note: MDPI stays neutral with regard to jurisdictional claims in published maps and institutional affiliations.

