

Poka Yoke Meets Deep Learning: A Proof of Concept for an Assembly Line Application


Abstract
:1. Introduction
1.1. Related Works
1.1.1. Equipment Control
1.1.2. Quality Control
1.1.3. Process Control
1.2. Bibliography Summary and Project Positioning
- Sensors: The main sensors used to implement the solution; for the solution to be robust, they must be few, cheap, and resistant to a hostile environment;
- Data Processing technique (DP): The processing technique for the data collected by the sensors; for example, using machine learning approaches.
- Proactive or Reactive (P/R): As proposed by [1], a proactive Poka Yoke avoids the onset of the defect, whereas a reactive Poka Yoke performs detection without prevention.
- Physical, Functional or Symbolic (P/F/S): The definition proposed by [32] and cited by [33] whereby a physical Poka Yoke blocks the flow of mass, energy, or information without being dependent on an operator’s interpretation; a functional Poka Yoke can be activated or deactivated following an event without depending on the interpretation of the operator, while a symbolic Poka Yoke can require an interpretation in accordance with the situation. This definition is again used to classify both technologies explicitly classified as a Poka Yoke by the authors and technologies of various nature monitoring quality parameters and ensuring the management or elimination of defects.
- Human-in-the-Loop (HIL): Whether human operators are involved in the operations.
- Cost: The expected cost depending on the technologies and solutions used.
2. Materials and Methods
2.1. Assembly Line Redefinition
2.1.1. The “As-Is” Analysis
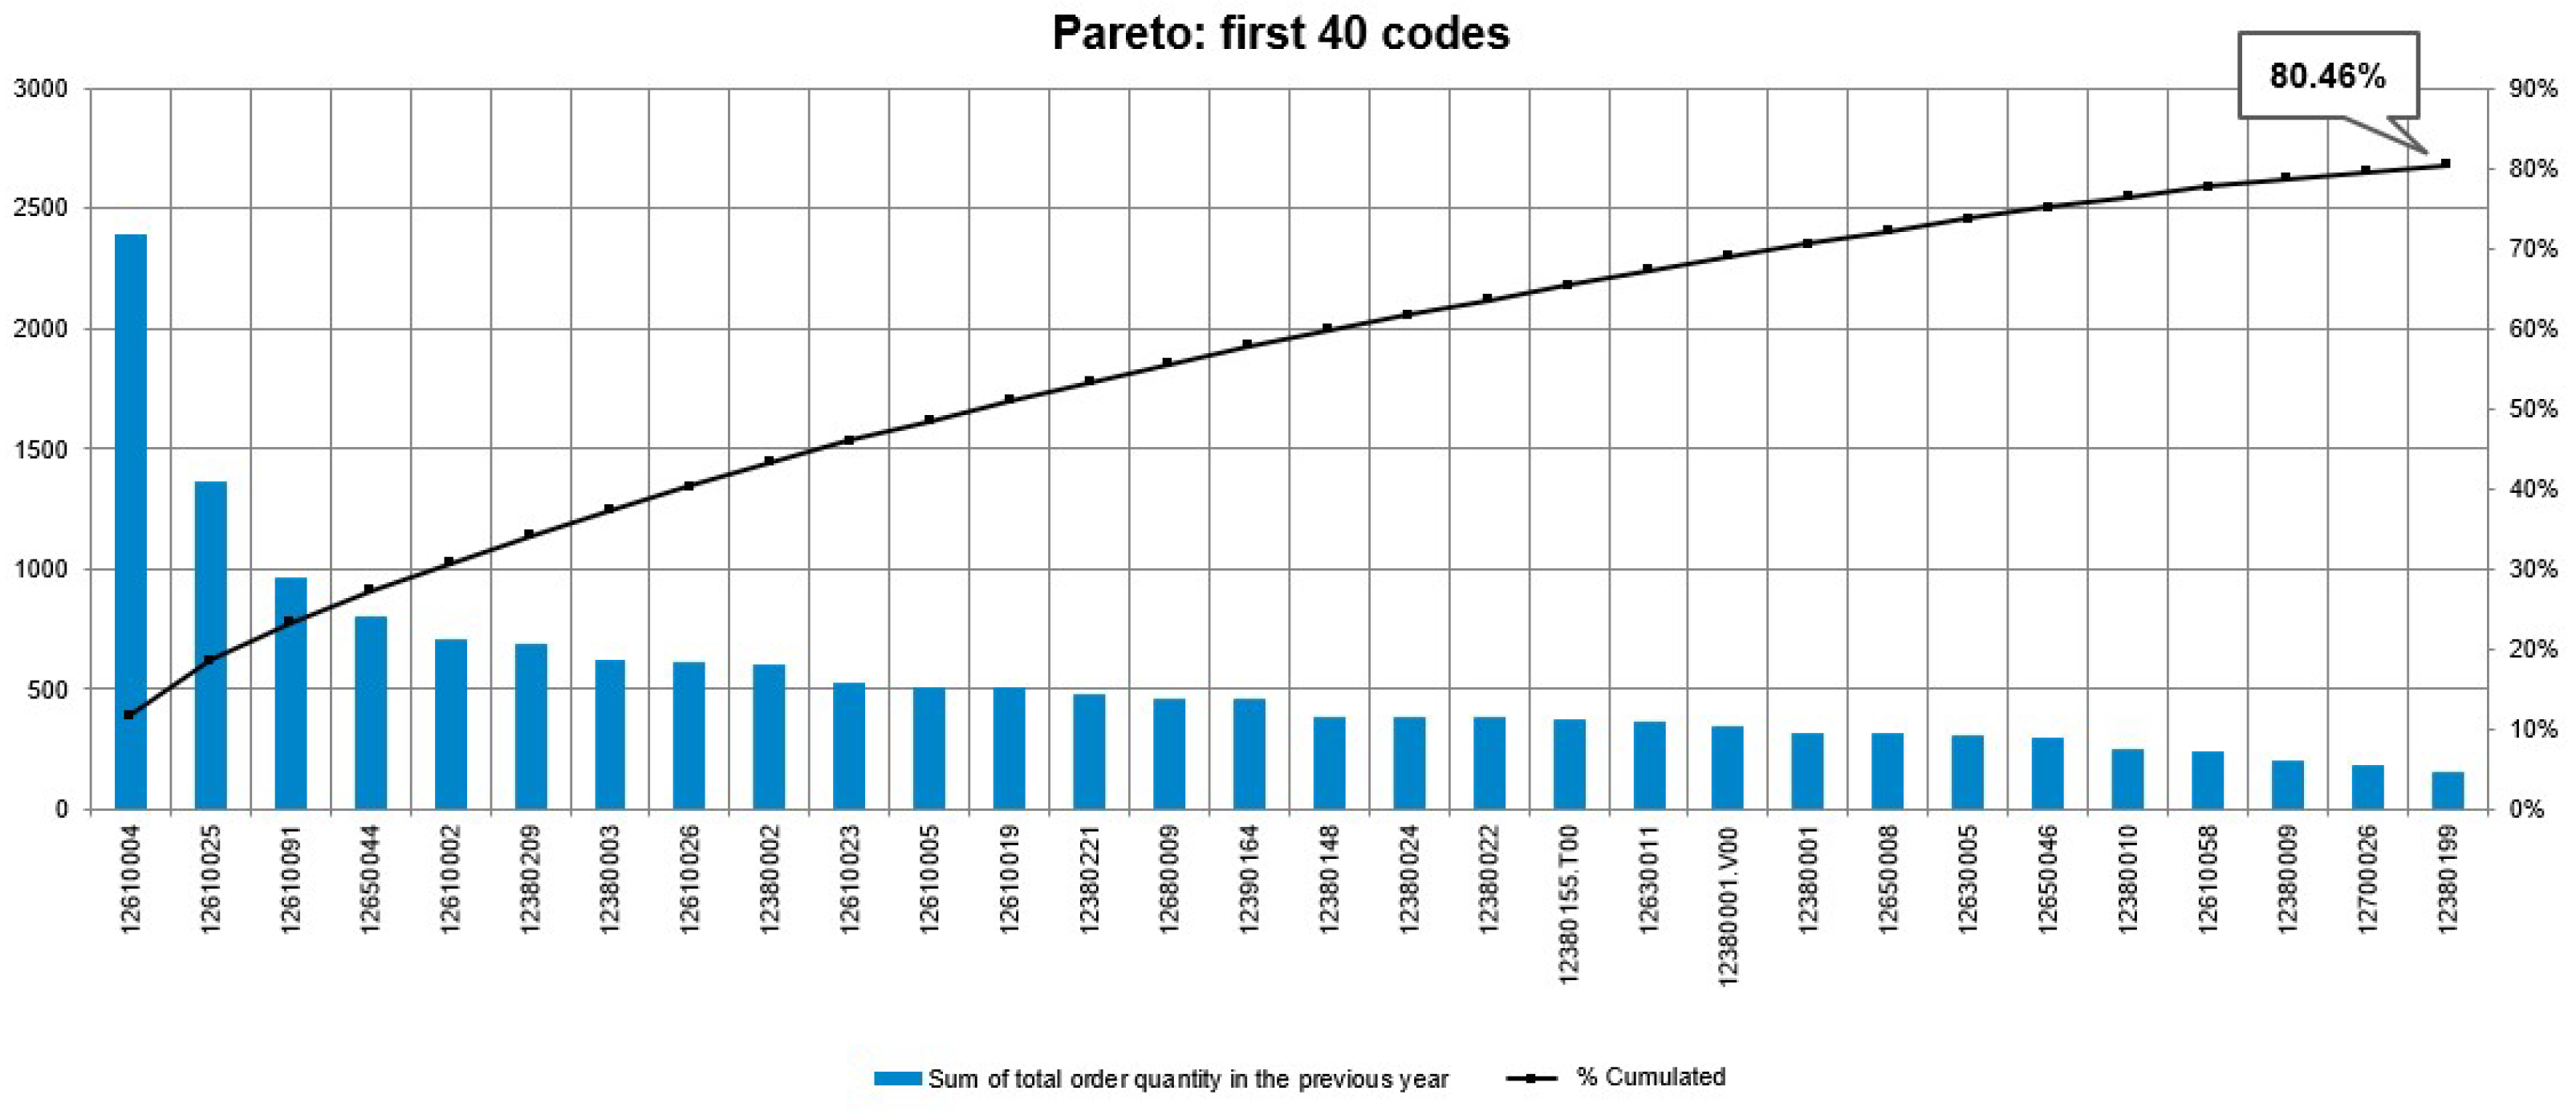
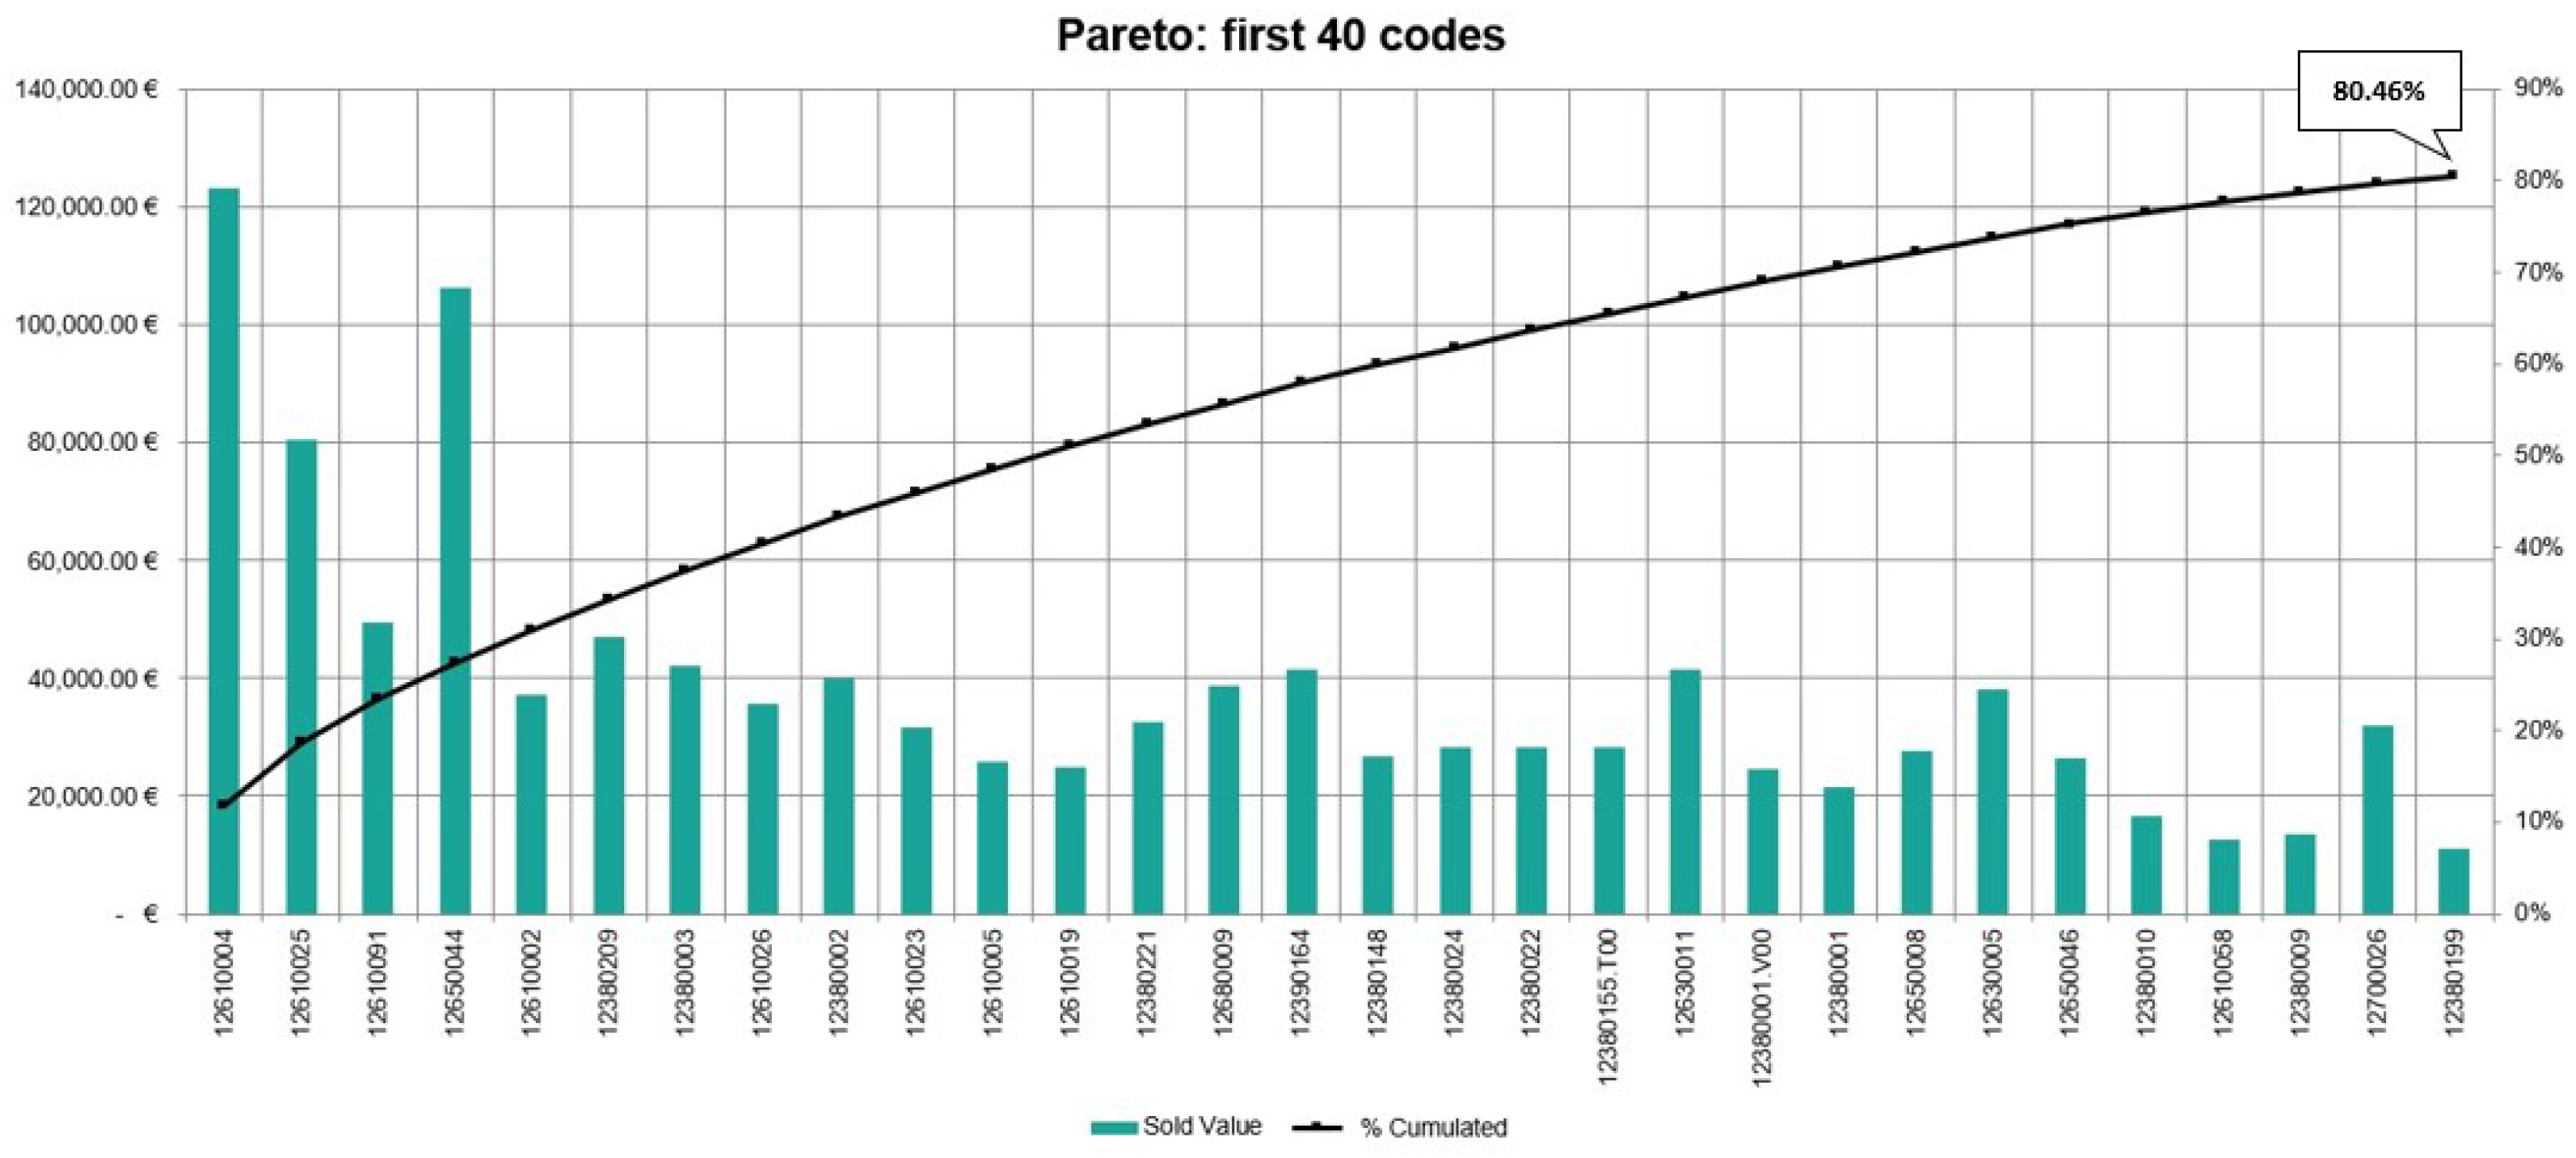
- Choice of model product—that is, the product that involves the highest level of resources or that brings the highest contribution to annual revenue (crucial choice because of the high number of finished products – almost 200 codes in the catalogue; to produce a significant improvement, it is necessary to choose as a reference the model that impacts the most on the business).
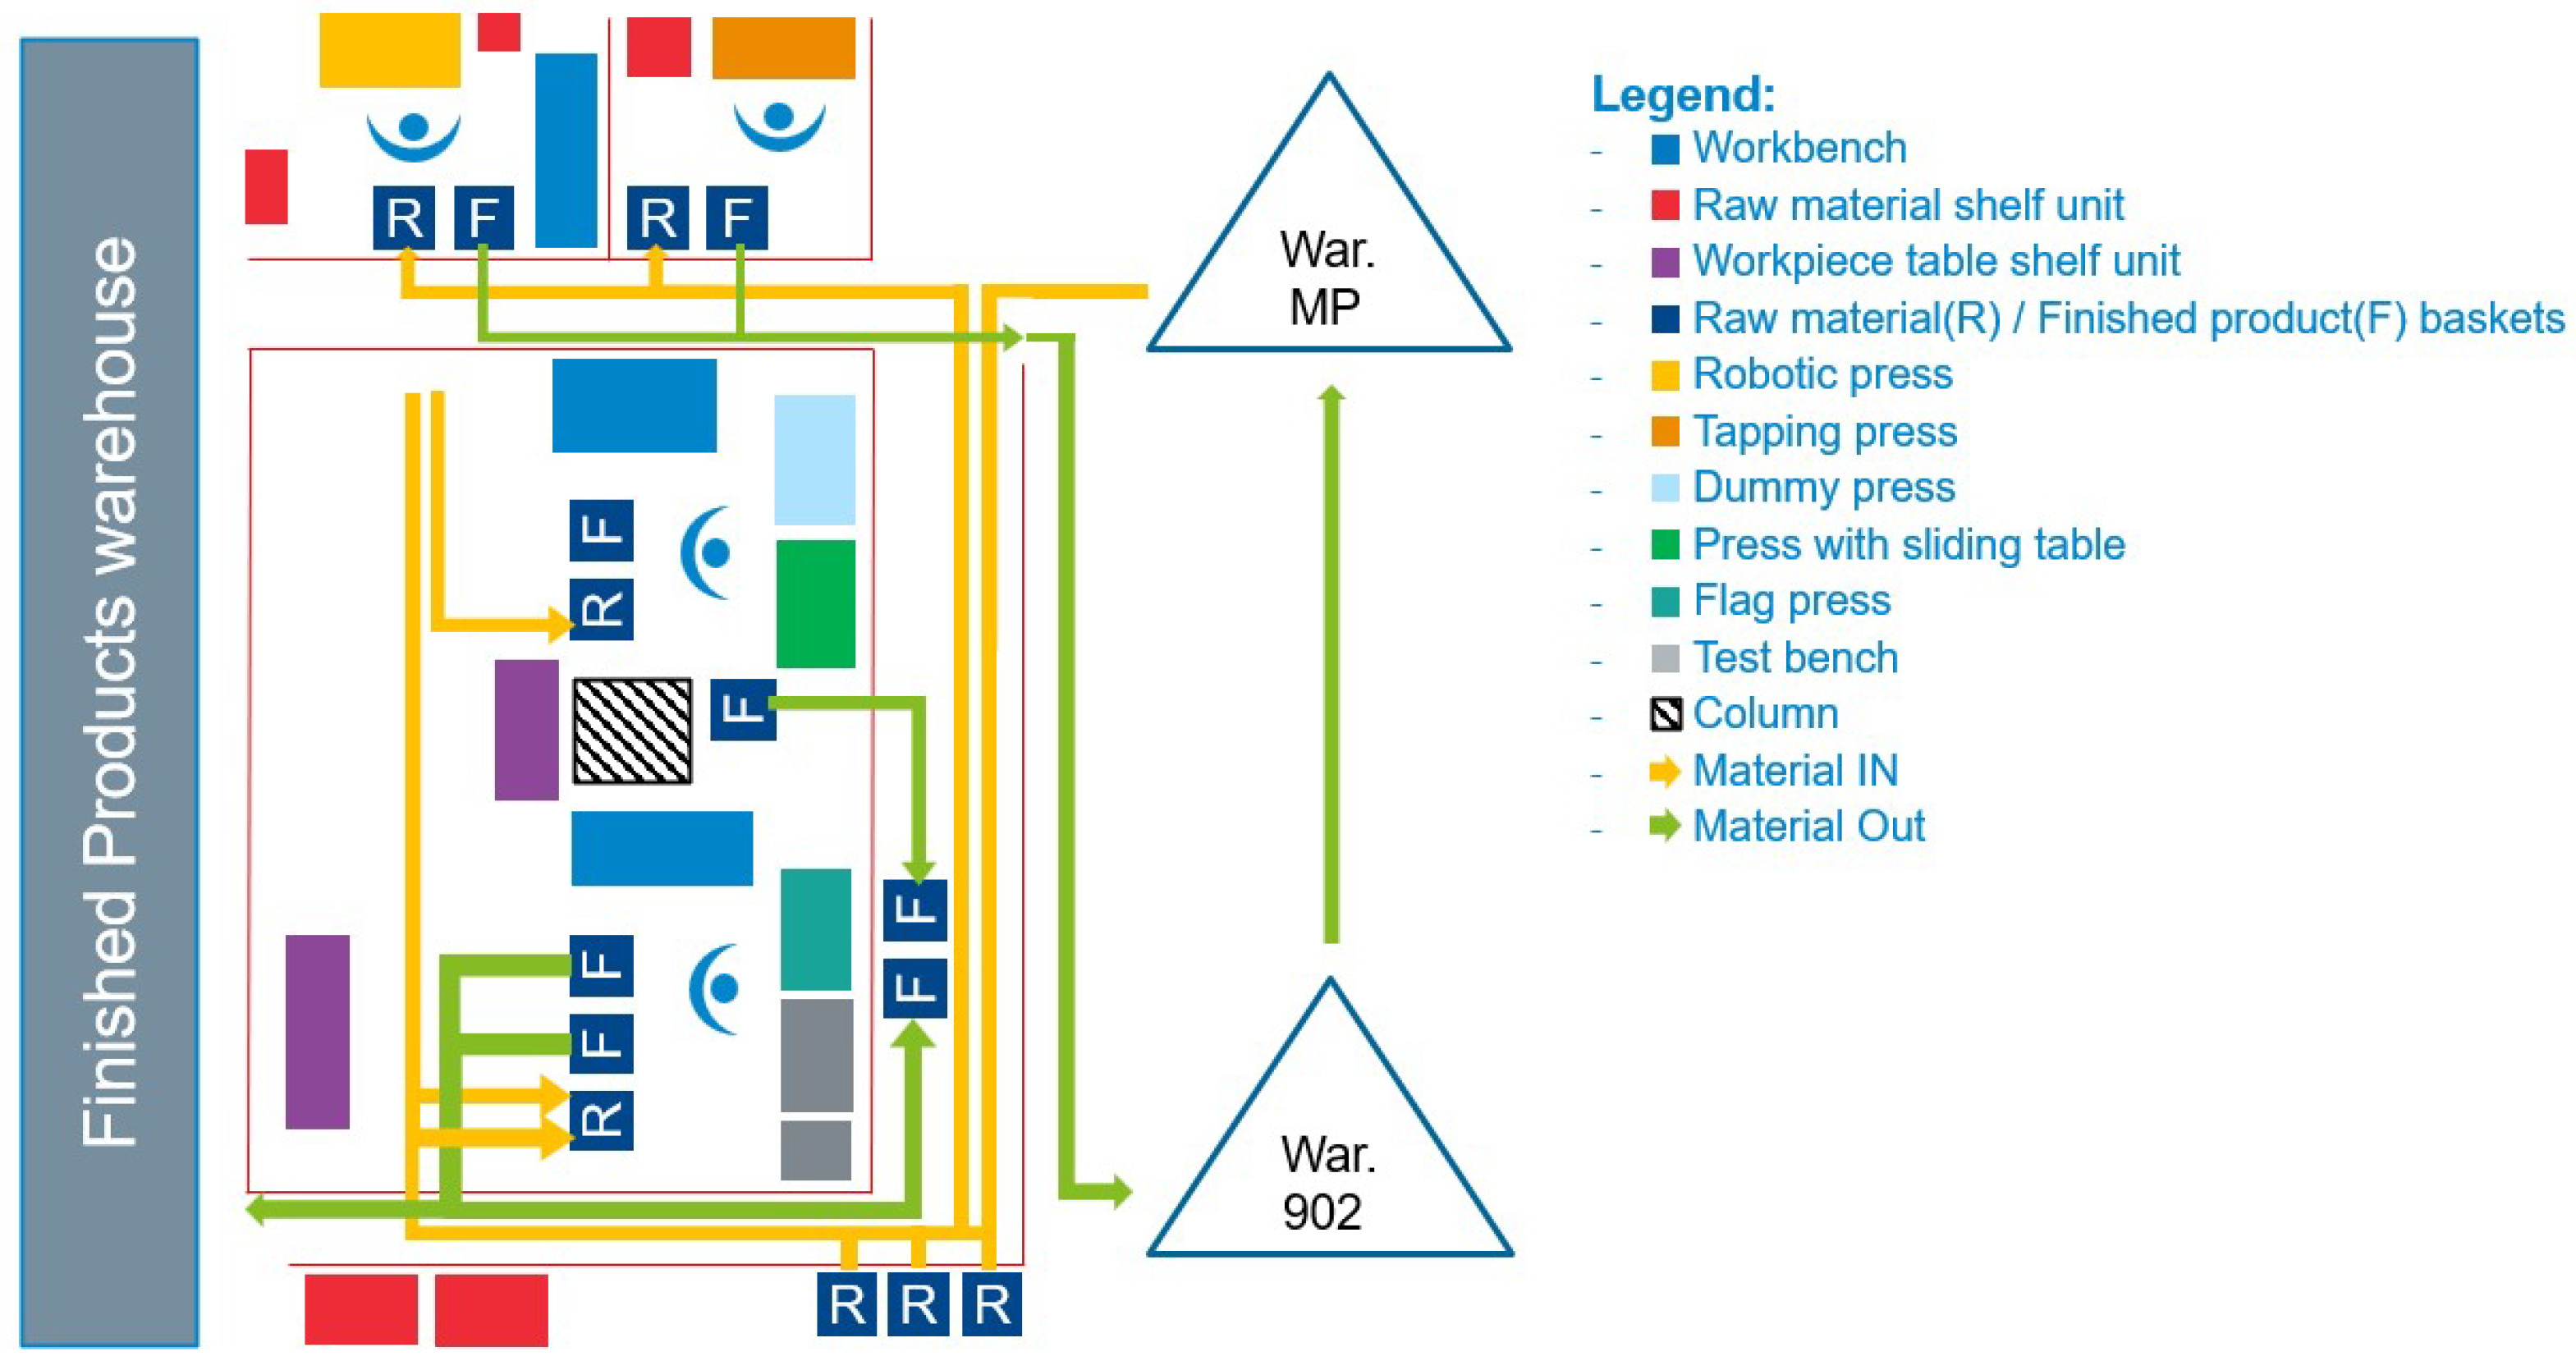
- Layout analysis, which maps the actual disposal of the existing infrastructure in the “as-is” state.
- Material flow analysis, which maps the material flow between the areas and the other plant infrastructure in the “as-is” state.
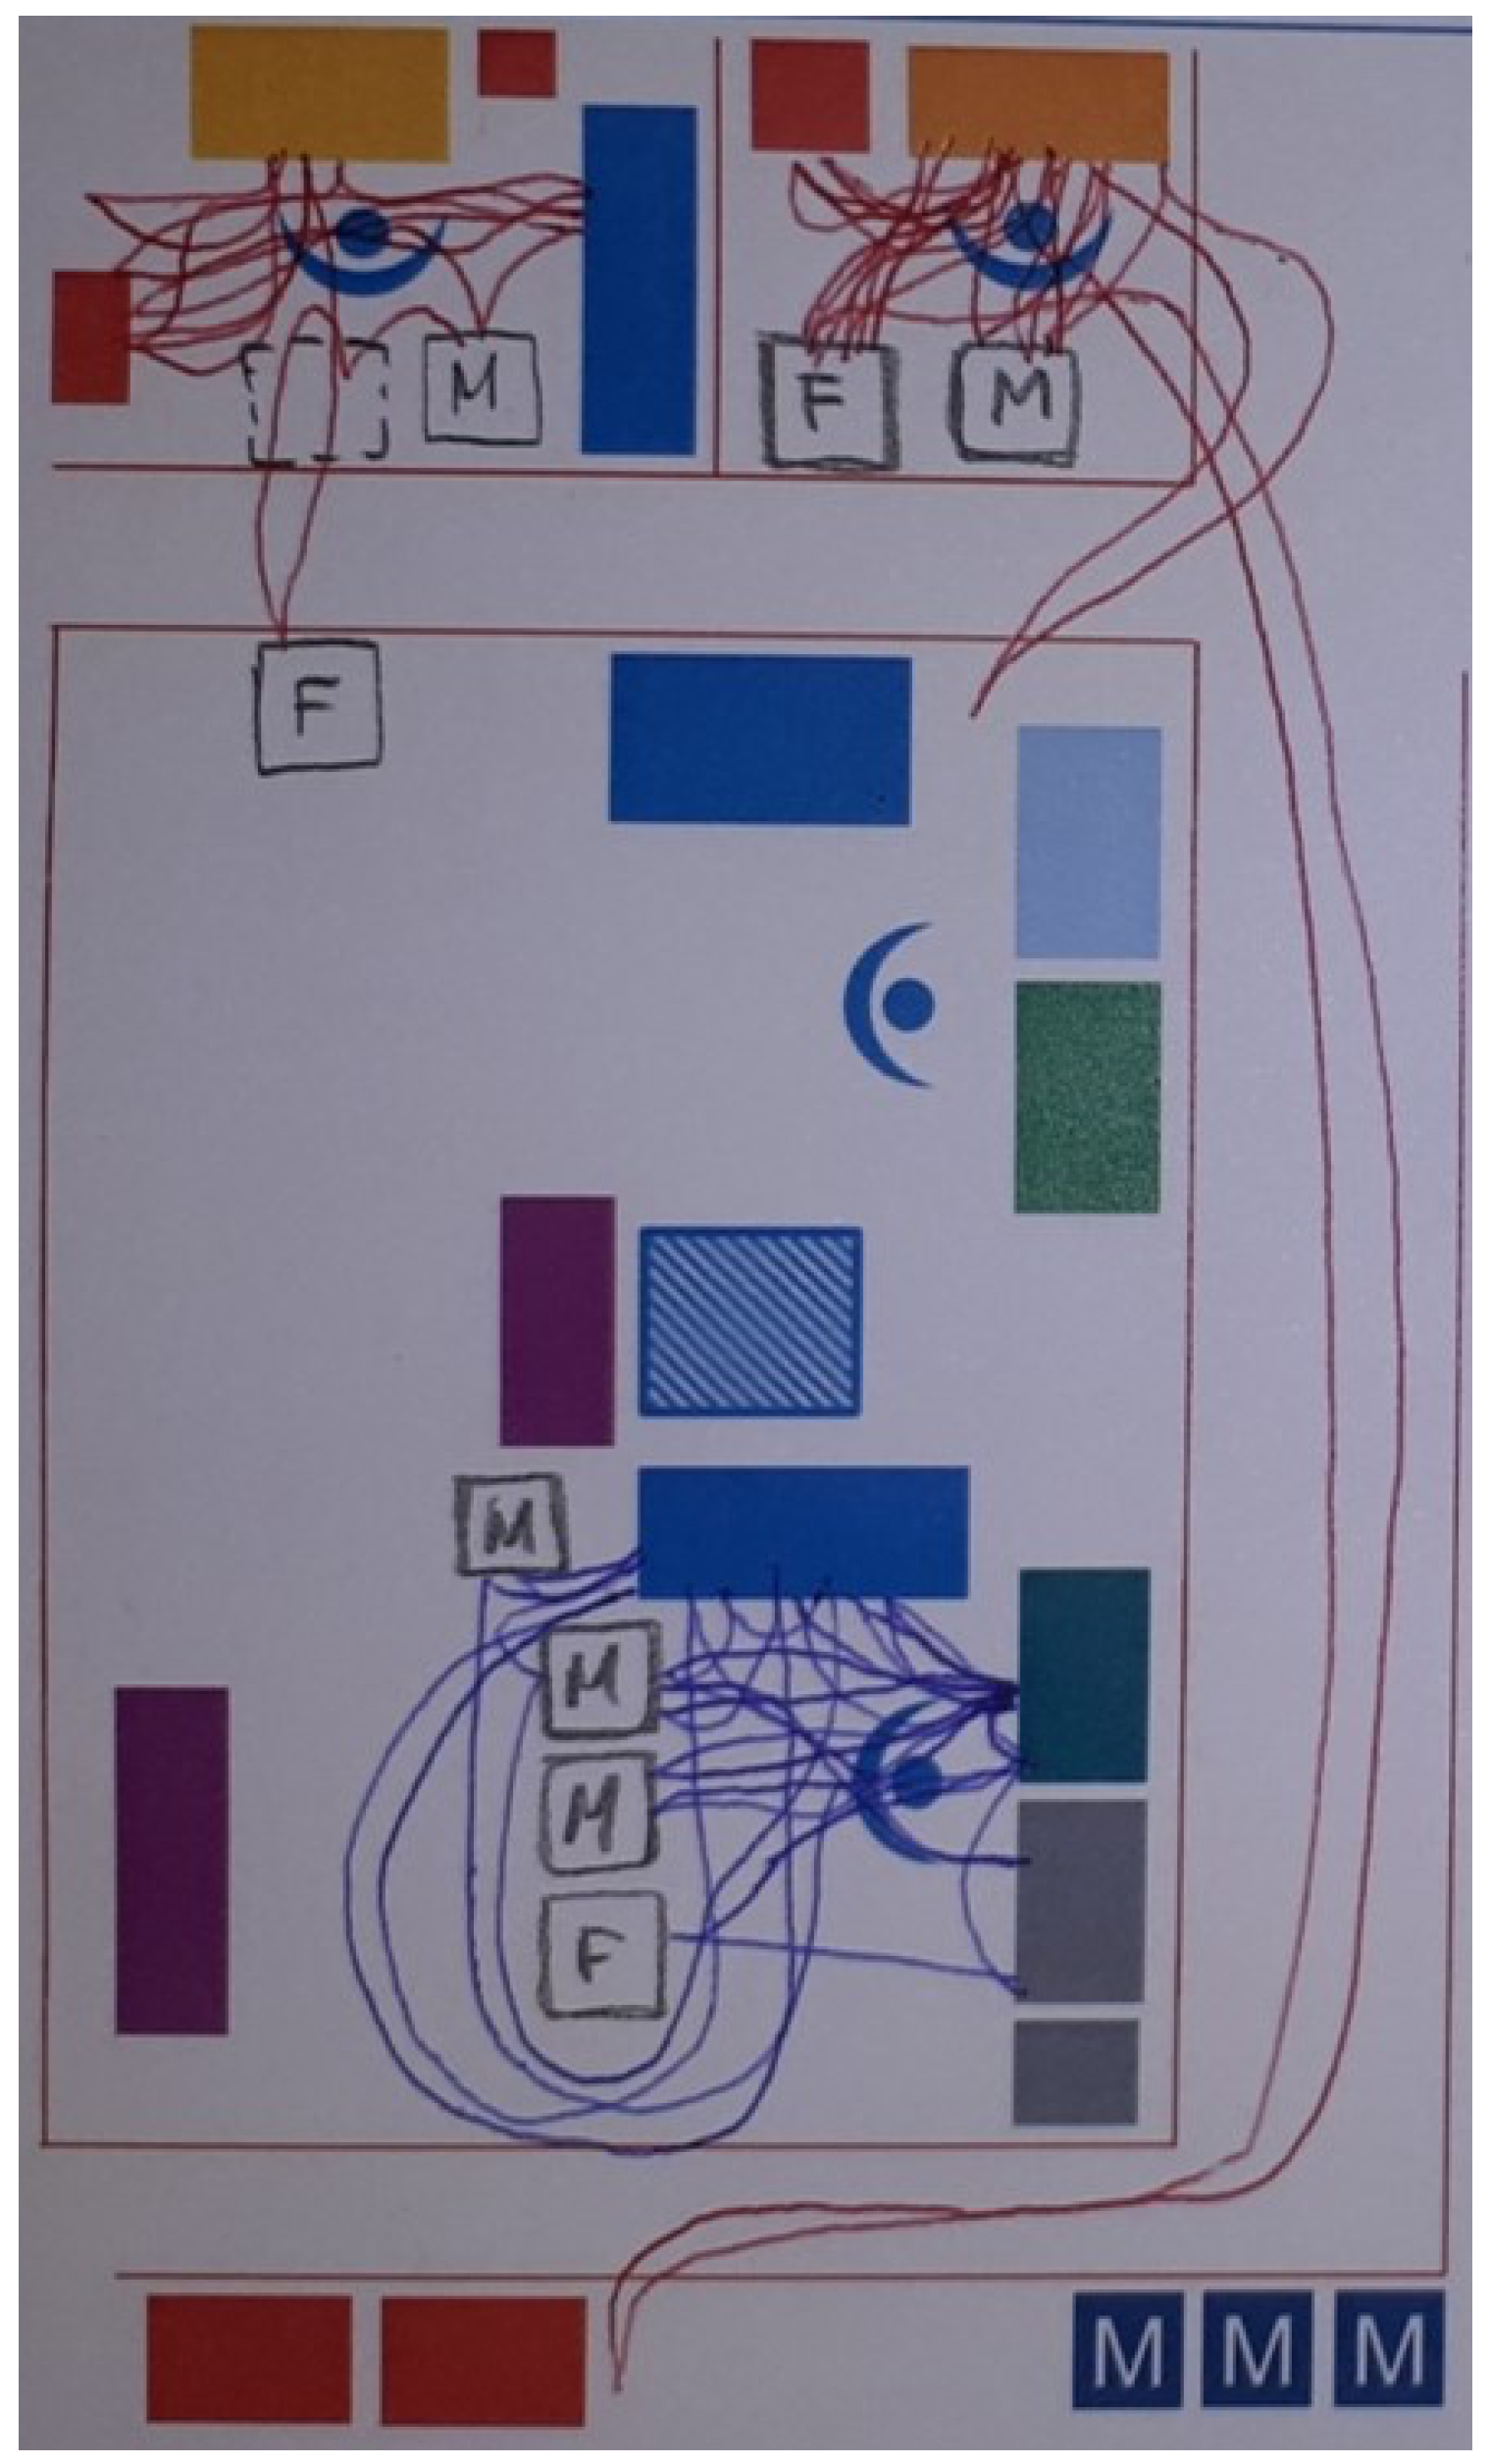
- A spaghetti chart, which maps the assembly operators moving in the area in the “as-is” state.
- Mura analysis, which identifies and classifies all the wastes that emerged in the previous analysis.
- Limits of actions, to analyse the constraints given by management in the project implementation.
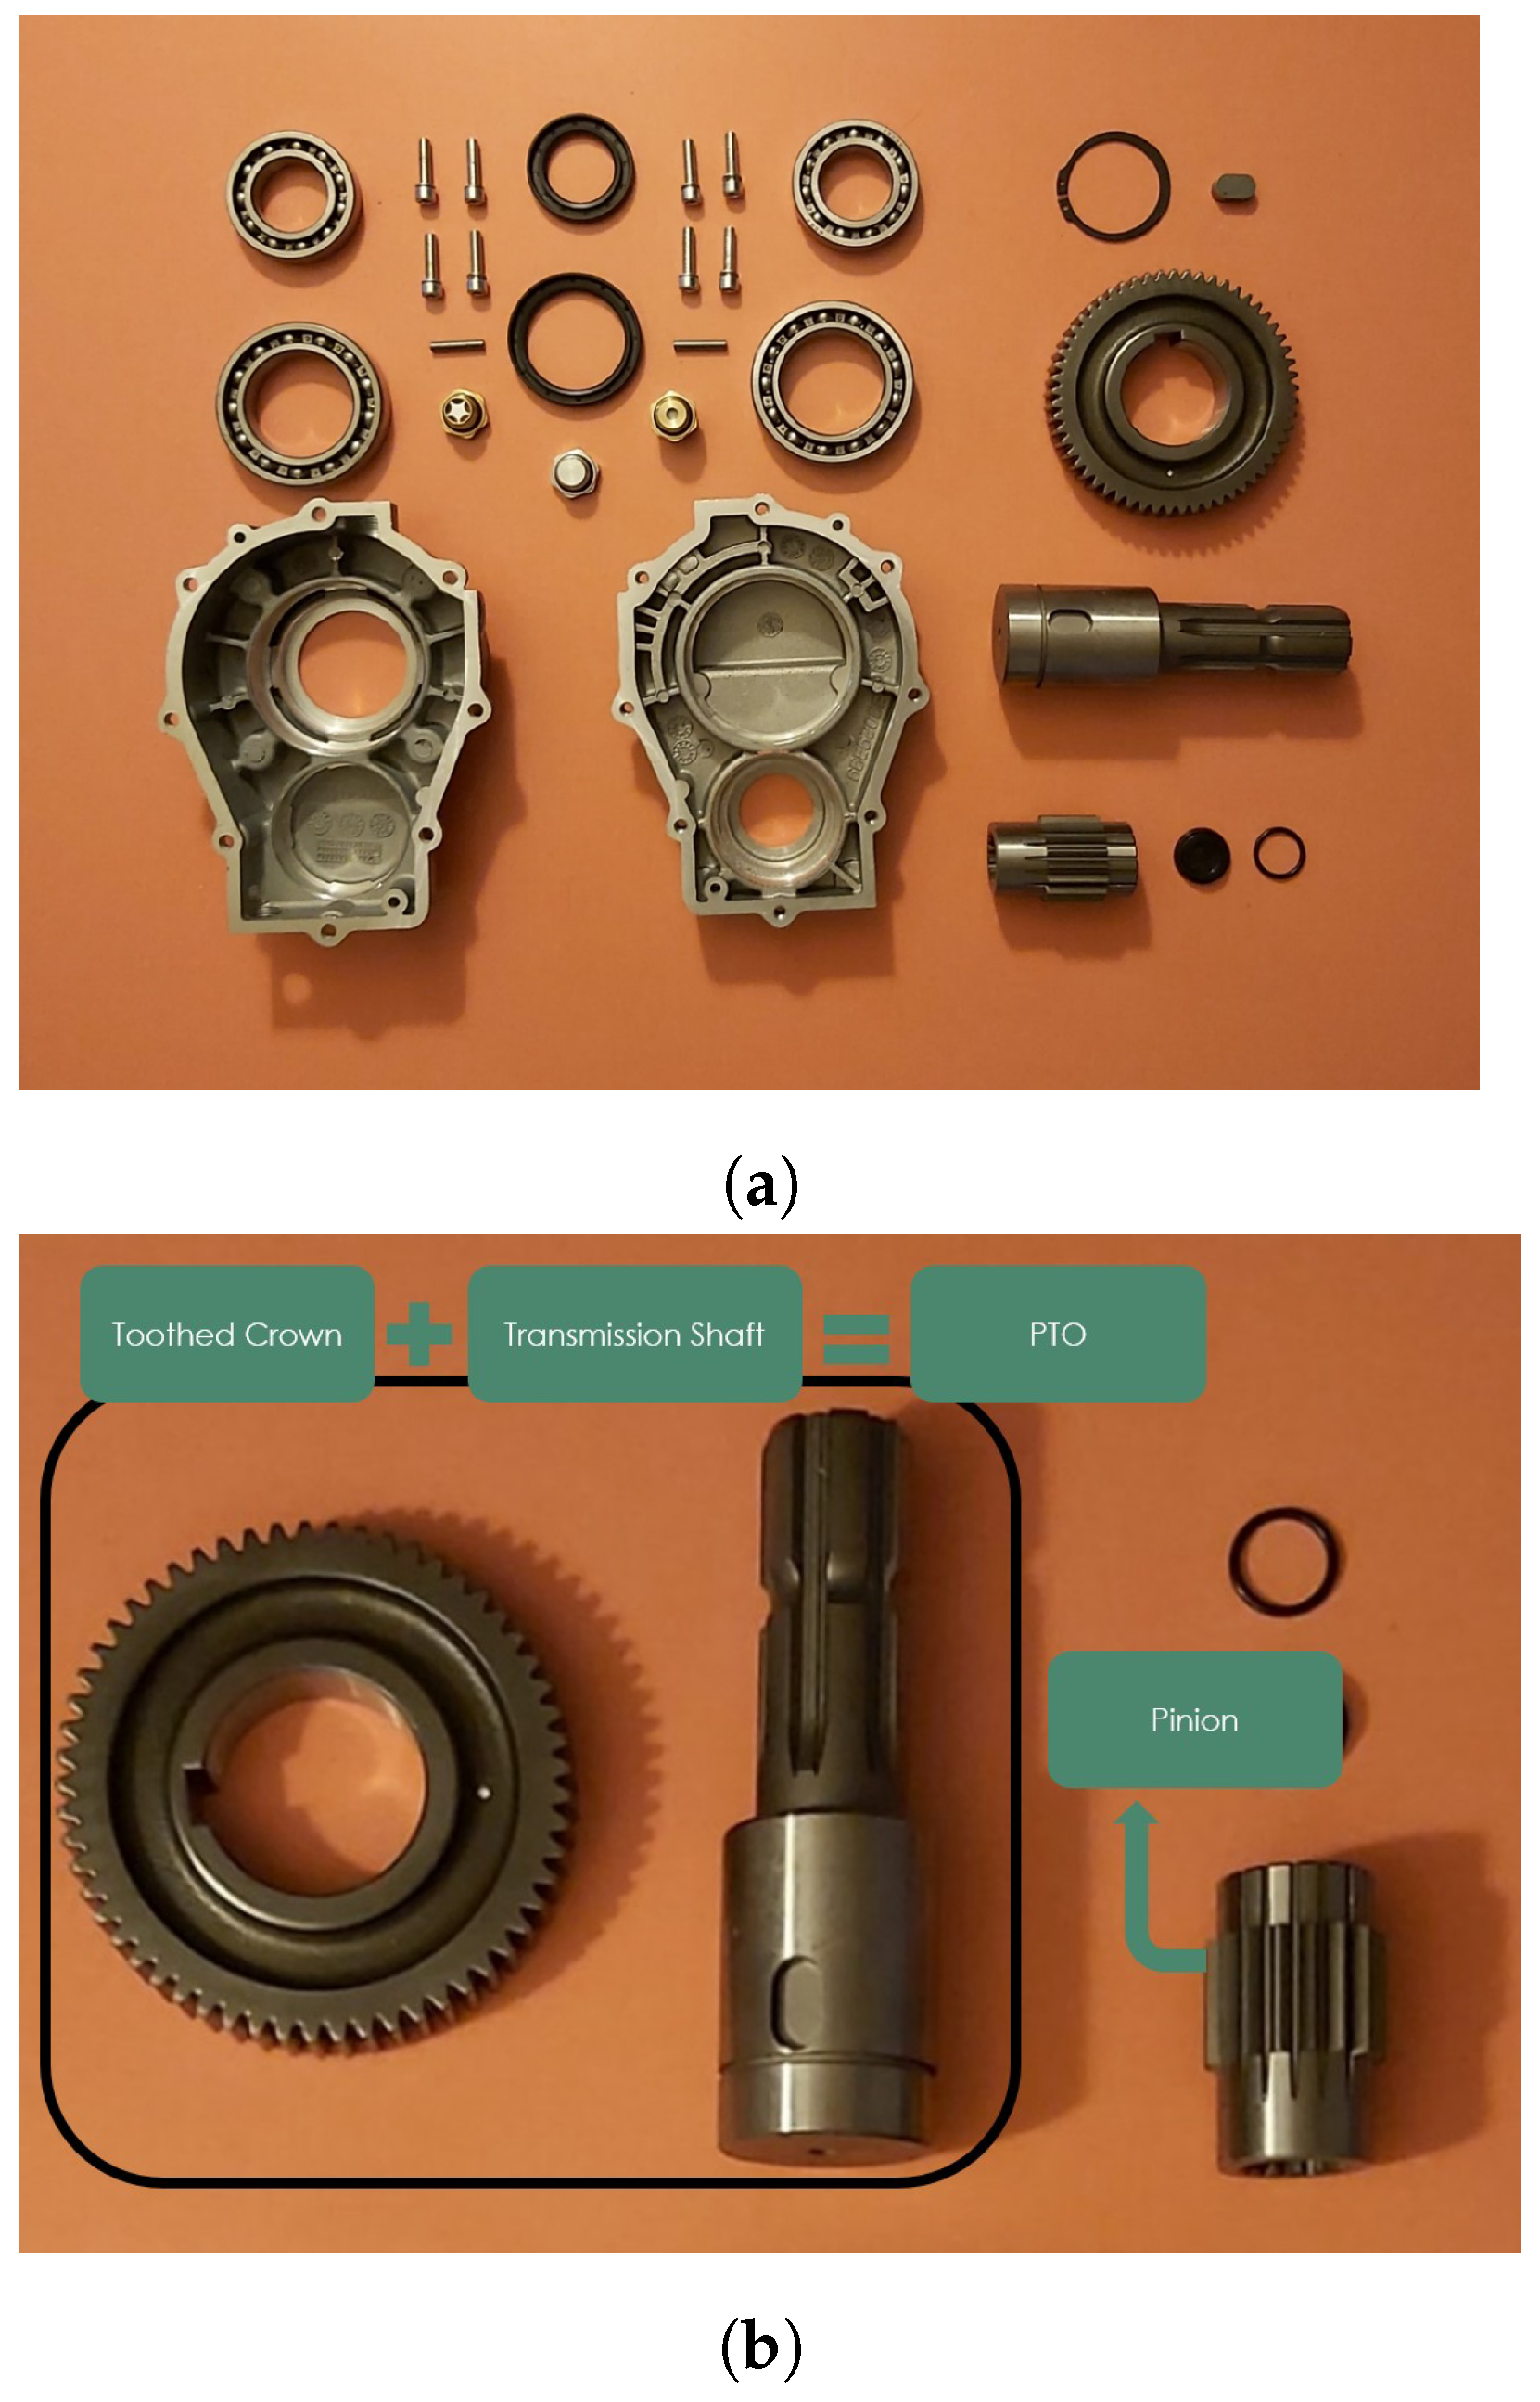
Choice of the Model Product
Layout Analysis
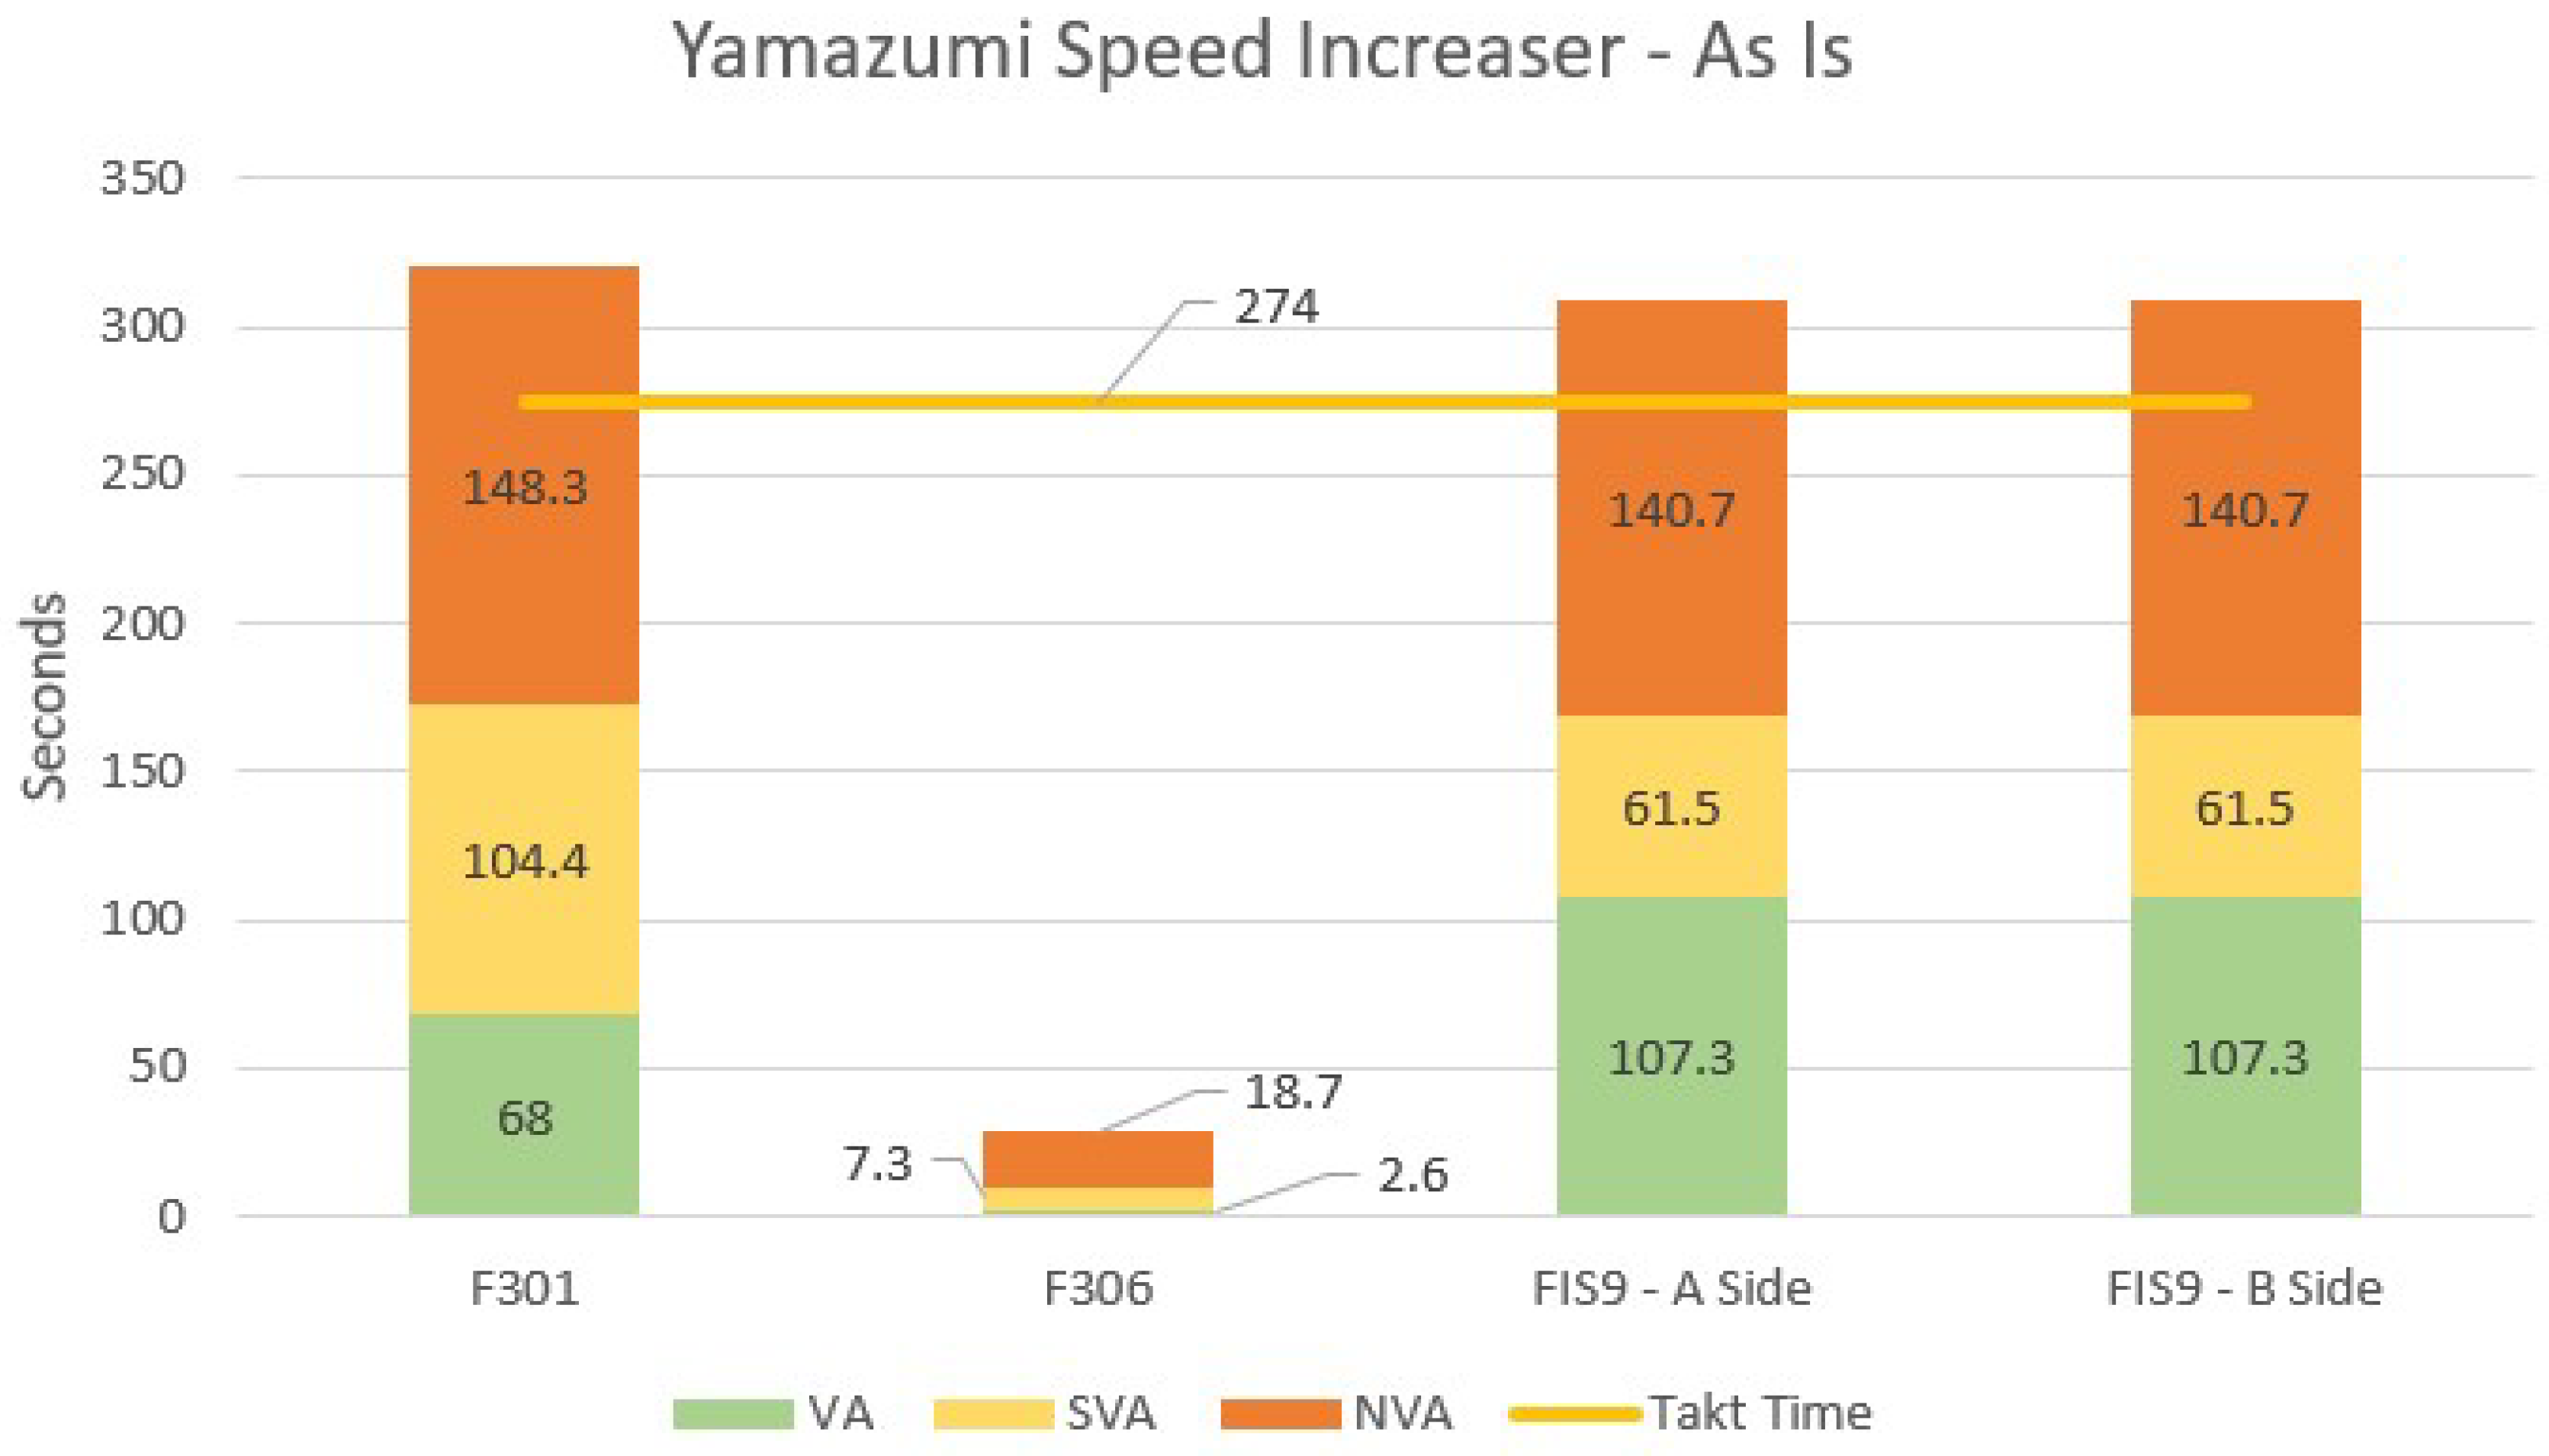
- Island F301, where the crankcase and cover sub-groups are pre-assembled.
- Island F306, where the pinion sub-groups are pre-assembled.
- Island FIS9, where the multiplier assemblies are completed, and which is further divided into two sub-areas: area A, where assemblies are completed only for small-to-medium multipliers; area B, where the assembly of large multipliers and, if necessary, also of medium-to-small multipliers is performed.
Material Flow Analysis
Spaghetti Chart
- The operator of the F301 station takes about 60 steps during the analysis, resulting in a total length of 45 m.
- The operator of the F306 area takes 103 steps, resulting in a total distance of 77.25 m.
- The operator of the FIS9-B area takes 75 steps, resulting in a total distance of 56.25 m.
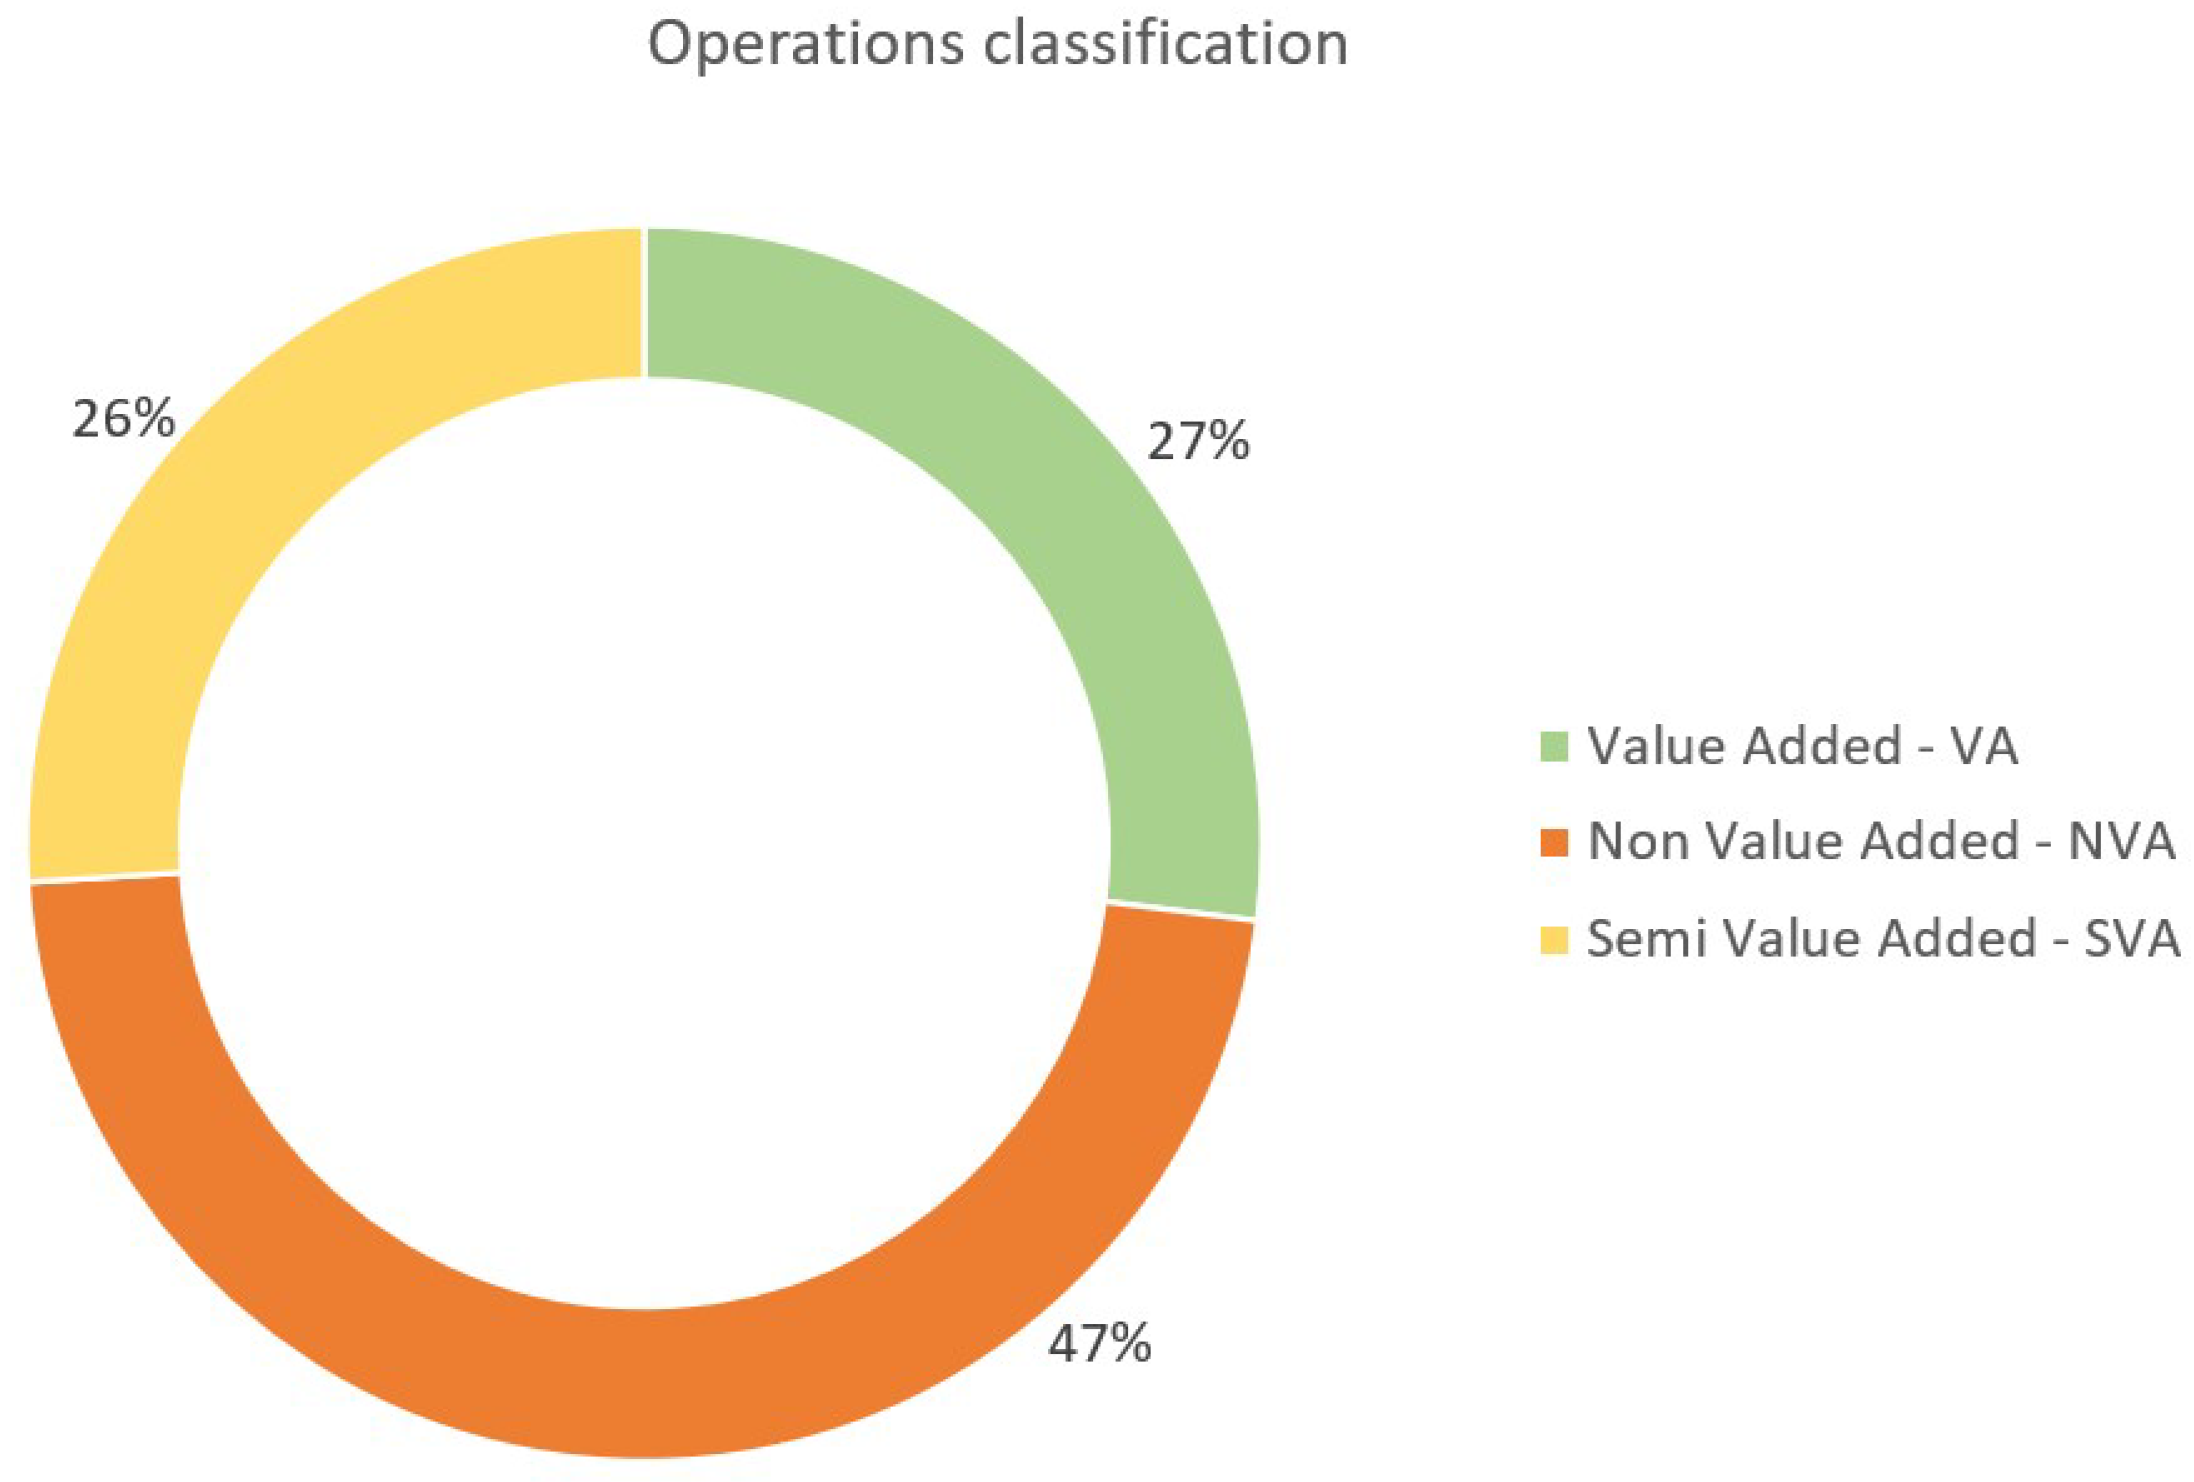
Muda Analysis
- Total cycle time: 658.8 s/pc.
- Non-value added operations (NVA): 47%.
- Semi-value added operations (SVA): 26%.
- Value added operations (VA): 27%.
- Overproduction, represented by two pre-assemblies; these were never launched as a result of the customer’s order, but the output materials were produced “for the warehouse”, thus representing a waste of space, resources, and capital immobilisation.
- Useless stocks: The pre-assembled items were stored waiting for the customer order, thus occupying space; even the related raw materials were not ordered and stored “when needed”, but were actually immobilised “for the warehouse”.
- Useless movements: The materials were moved around the plant twice more than needed, leading to delays and increased risks of damaging the material itself.
- Useless or expensive processes: This waste refers to the operations carried out by assembly operators. In fact, they not only carried out the assembly operations, but used to move baskets and crates to prepare their working areas; in addition, they took care of the material unpacking, waste management, and missed material retrieval.
Limits of Action
- Maximising the reuse of the existing equipment.
- Freeing at minimum one of the three working areas involved in the “as-is” state.
- Implementing a solution with an investment payback not larger than 1 year.
2.1.2. The Proposed “To-Be” Solution
Market Requests, Forecasts, and Takt Time
- Market request: 22,515 pieces/year.
- Daily hours available: 8 h/day.
- Work shifts: 1 shift/day.
- Available days per year: 230 days/year.
- Minimum physiological break: 7% (4% physiological, 3% fatigue - based on internal standards).
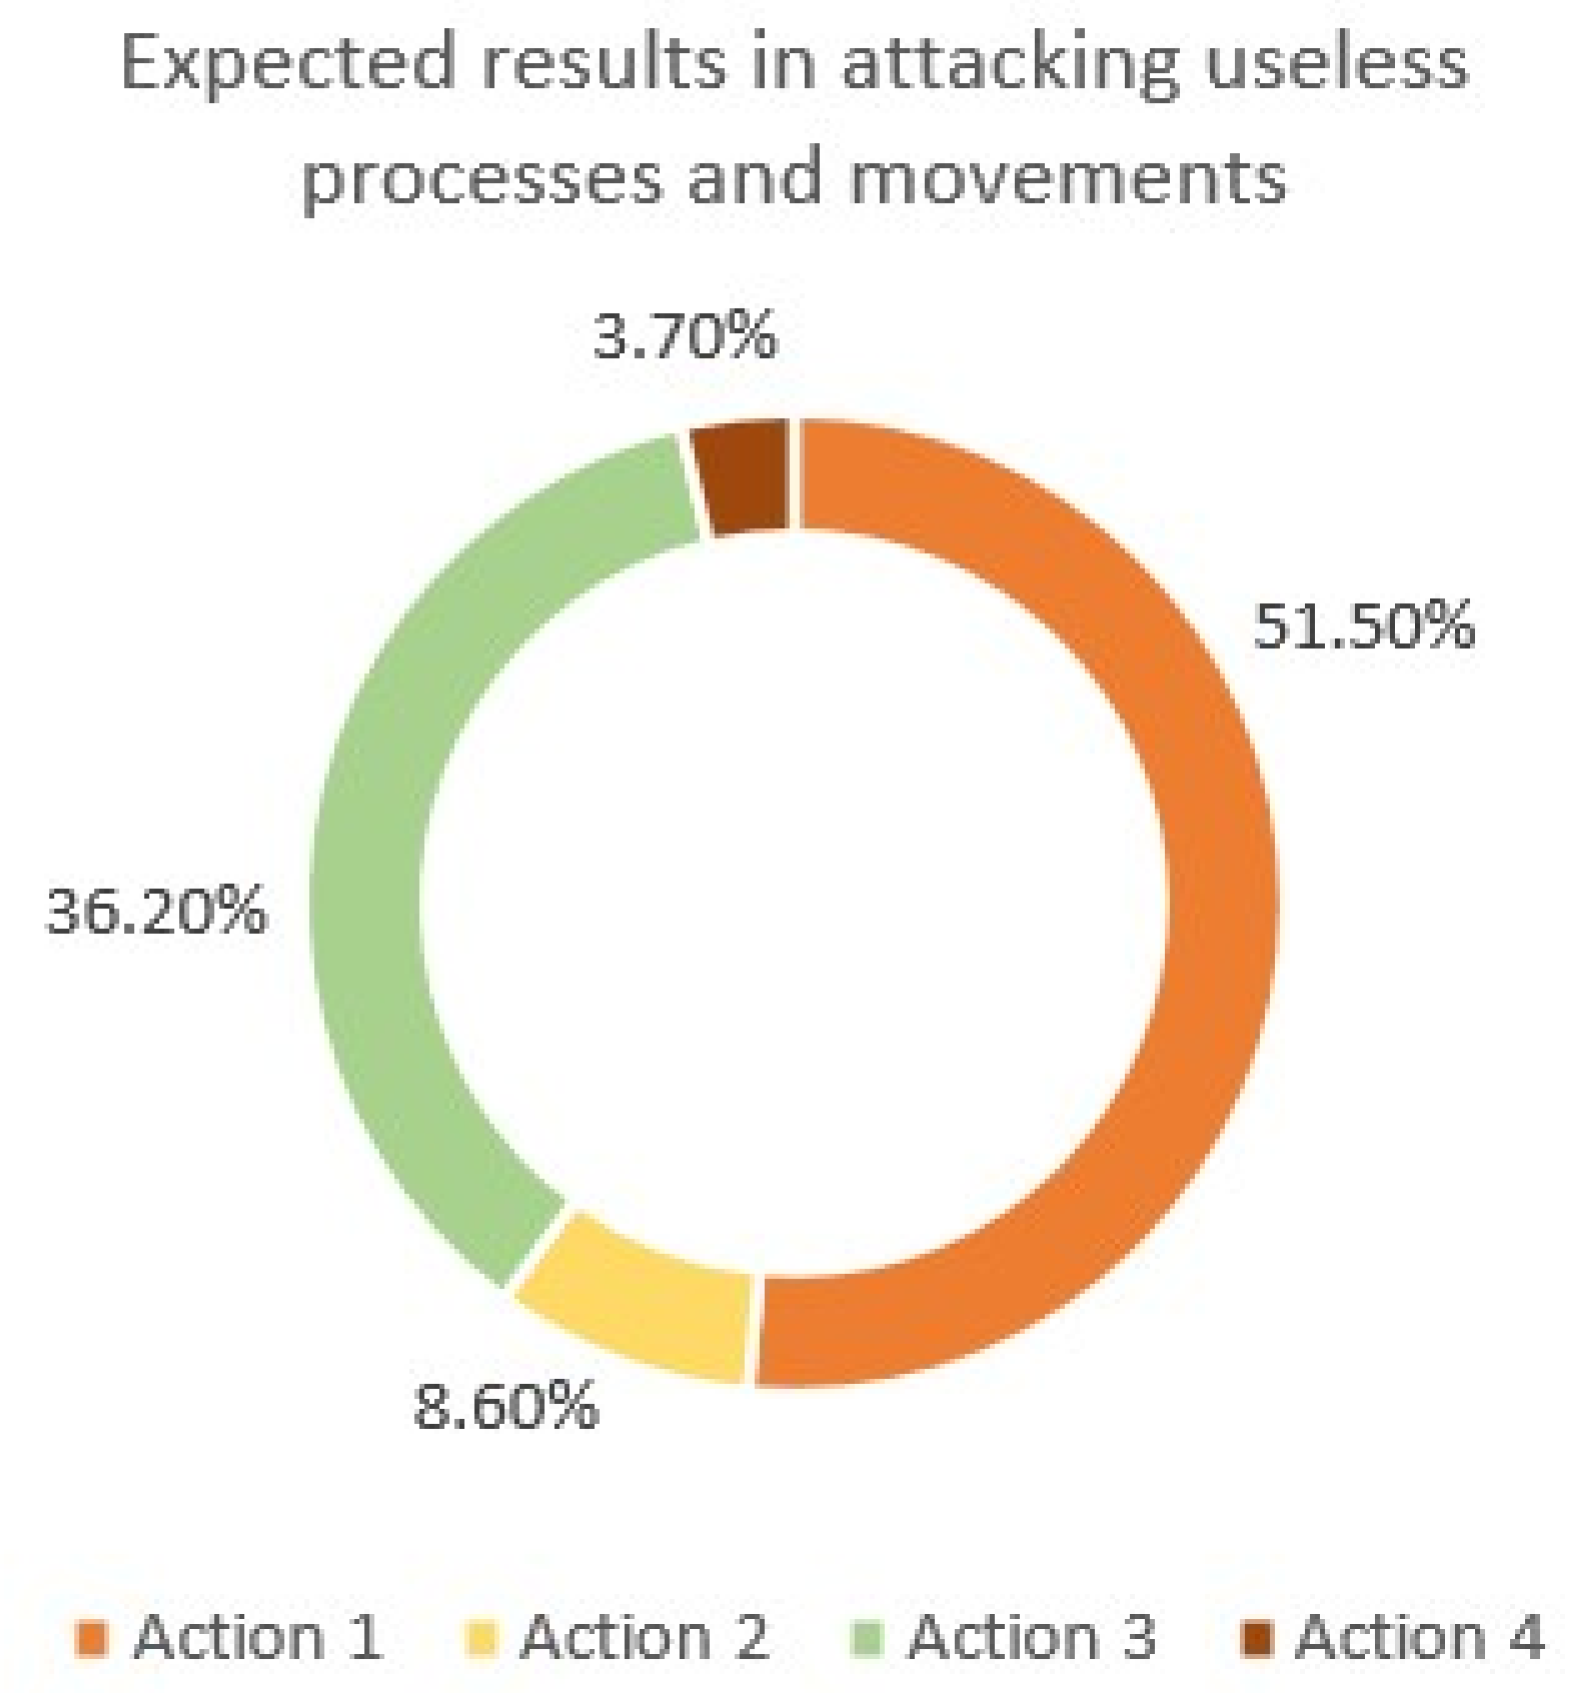
Designing Actions: Attacking Useless Movements and Useless Processes
- Action 1: The logistics workers must organise the raw material in crates. With this standardisation, operators do not have to open the packaging of raw materials, which are immediately available for assembly. Estimated time saving: 157.2 s per piece.
- Action 2: The definition of standard areas for positioning finished containers and raw materials. In this way, the operator does not have to move outside his area to prepare the finished container or recover that of the raw material. Furthermore, the definition of the areas simplifies the feeding of raw material and withdrawal of the finished product, favouring the coordination of operations between departments. Estimated time saving: 26.1 s per piece.
- Action 3: The introduction of a line feeding system based on customised roller conveyors, trolleys, and boxes. In this way, a unique interface is created between the logistics department and the assembly department: this enables the possibility to integrate a reordering kanban-based system that standardises the line supply signals with a consequent ease of coordination between departments. Finally, this action leads the island to operate in all respects with the lean method, abandoning the traditional work strategy. Estimated time saving of 110.1 s per piece.
- Action 4: Better positioning and management of assembly instructions. This action involves the adoption of reading desks (first) and computers (later), avoiding operators constantly moving from the workplace to search for the information necessary to complete the assembly activities. Estimated time savings of 11.2 s per piece.
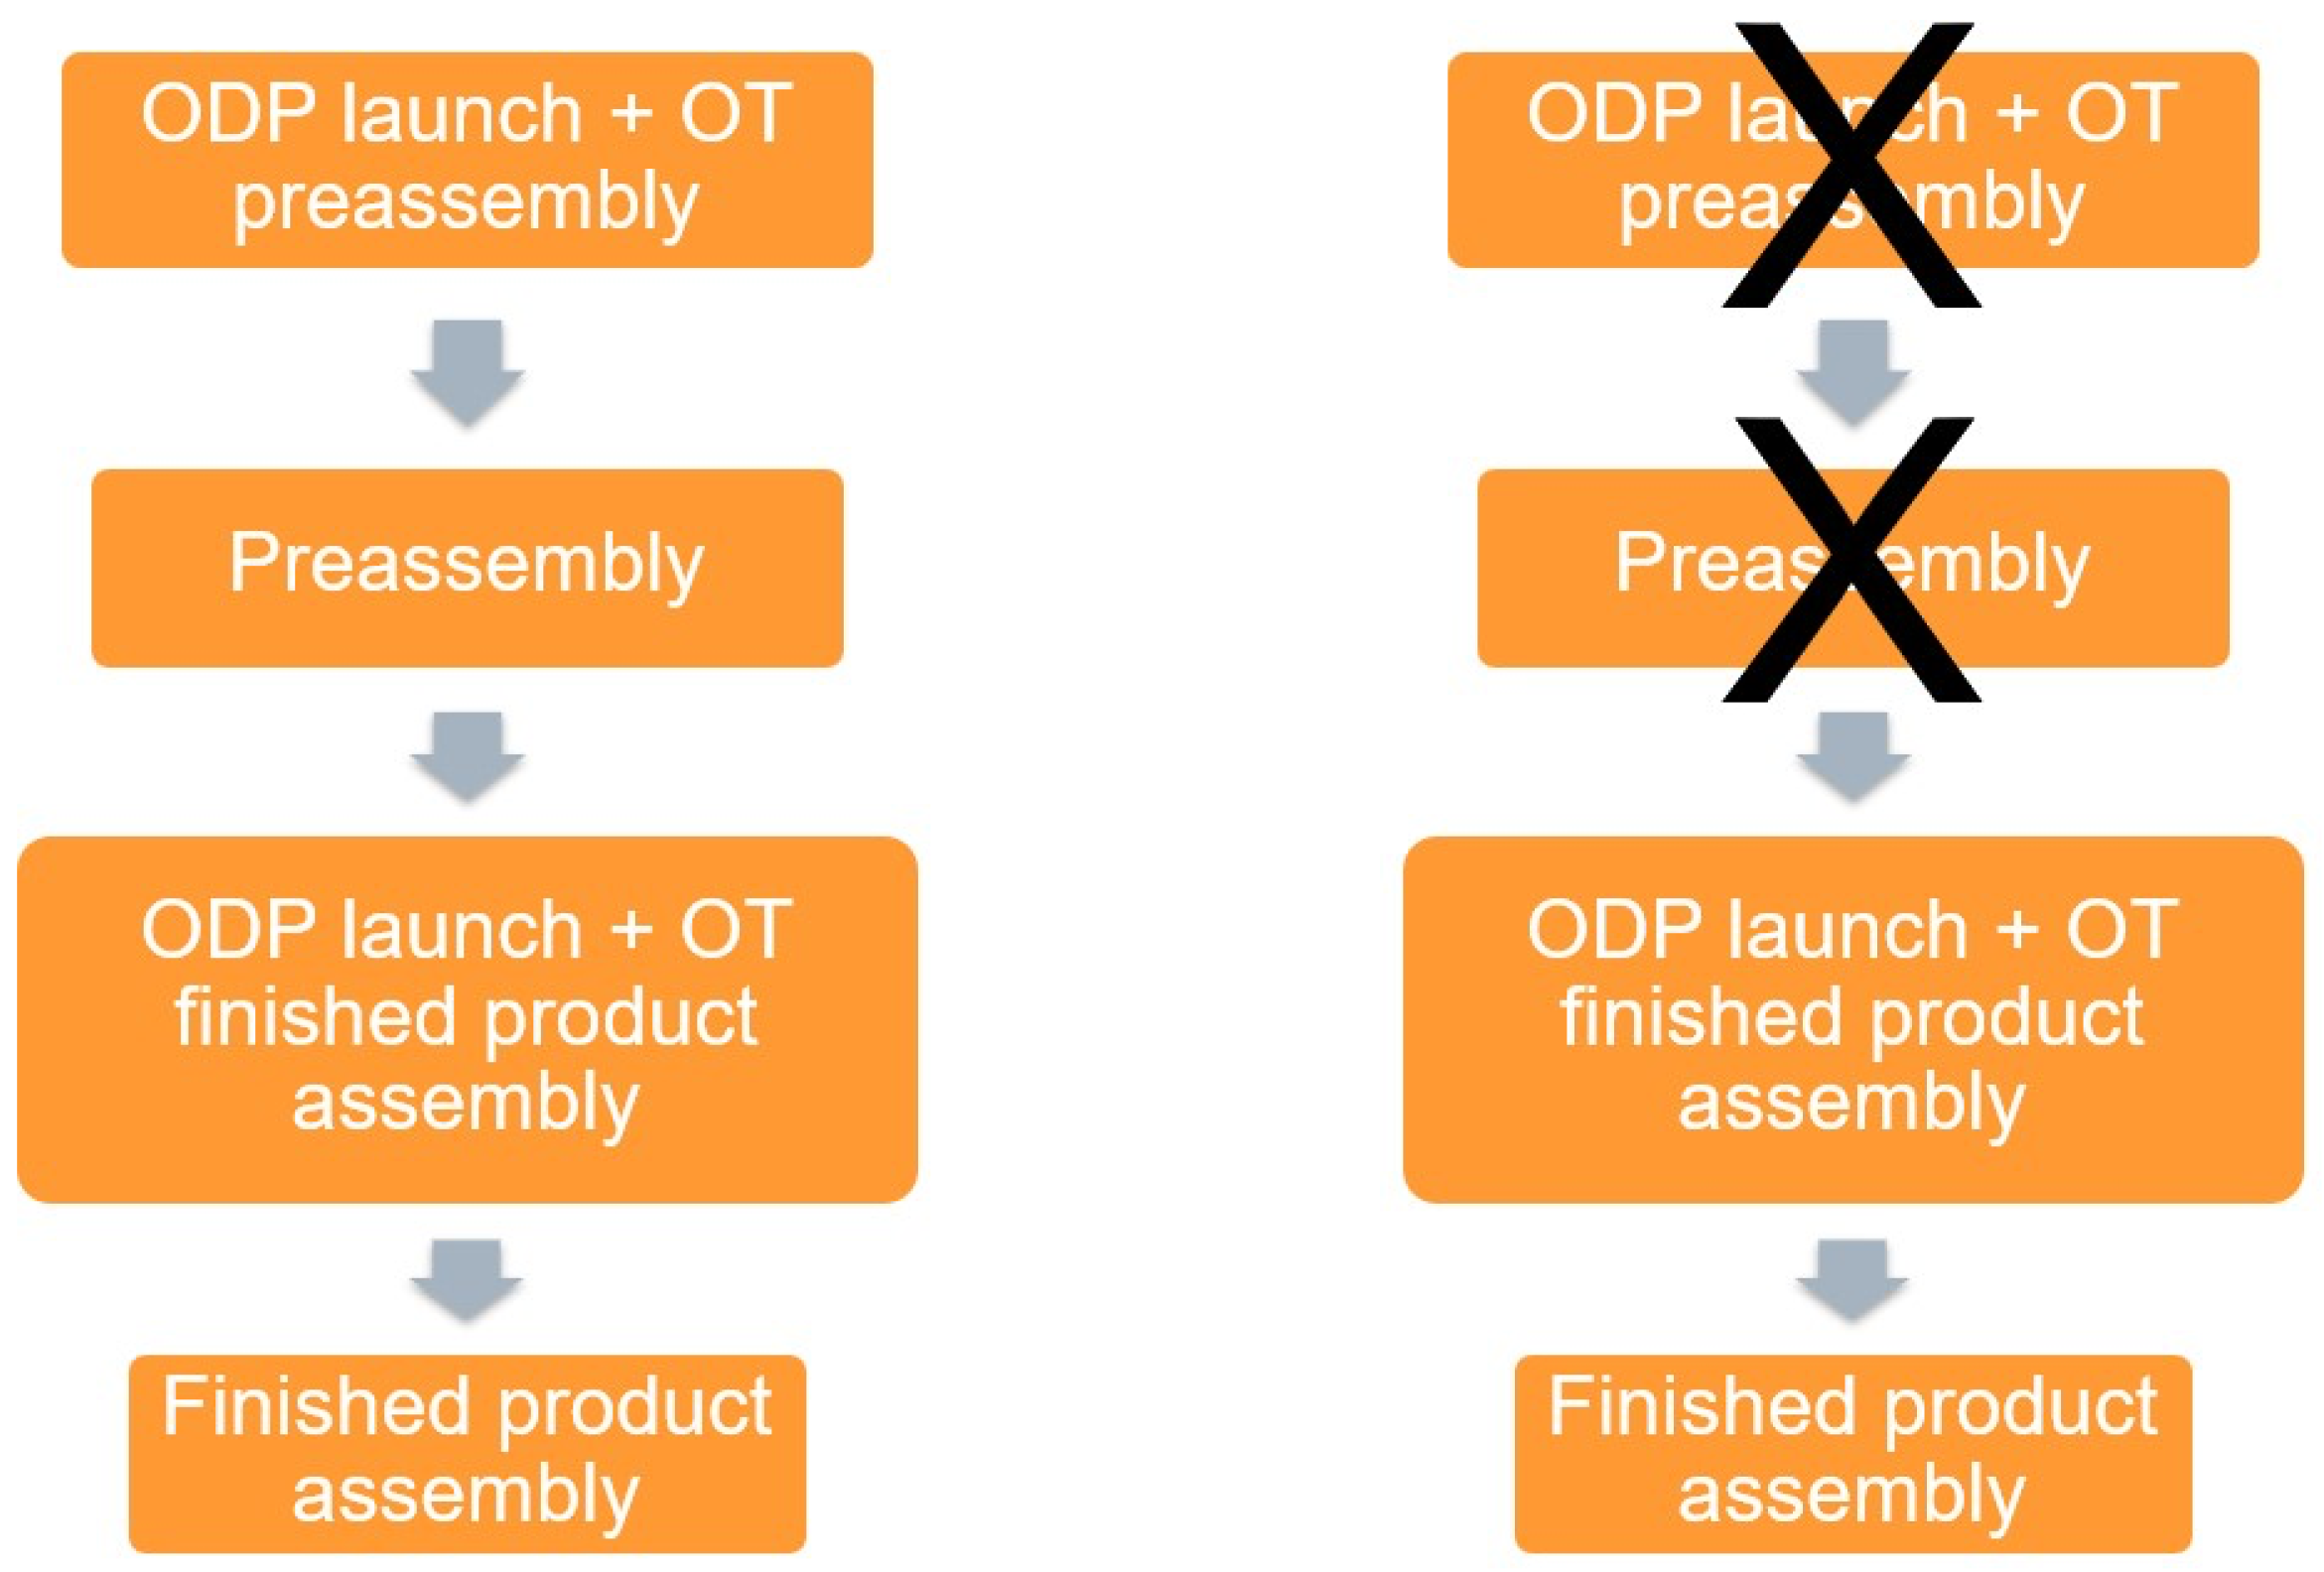
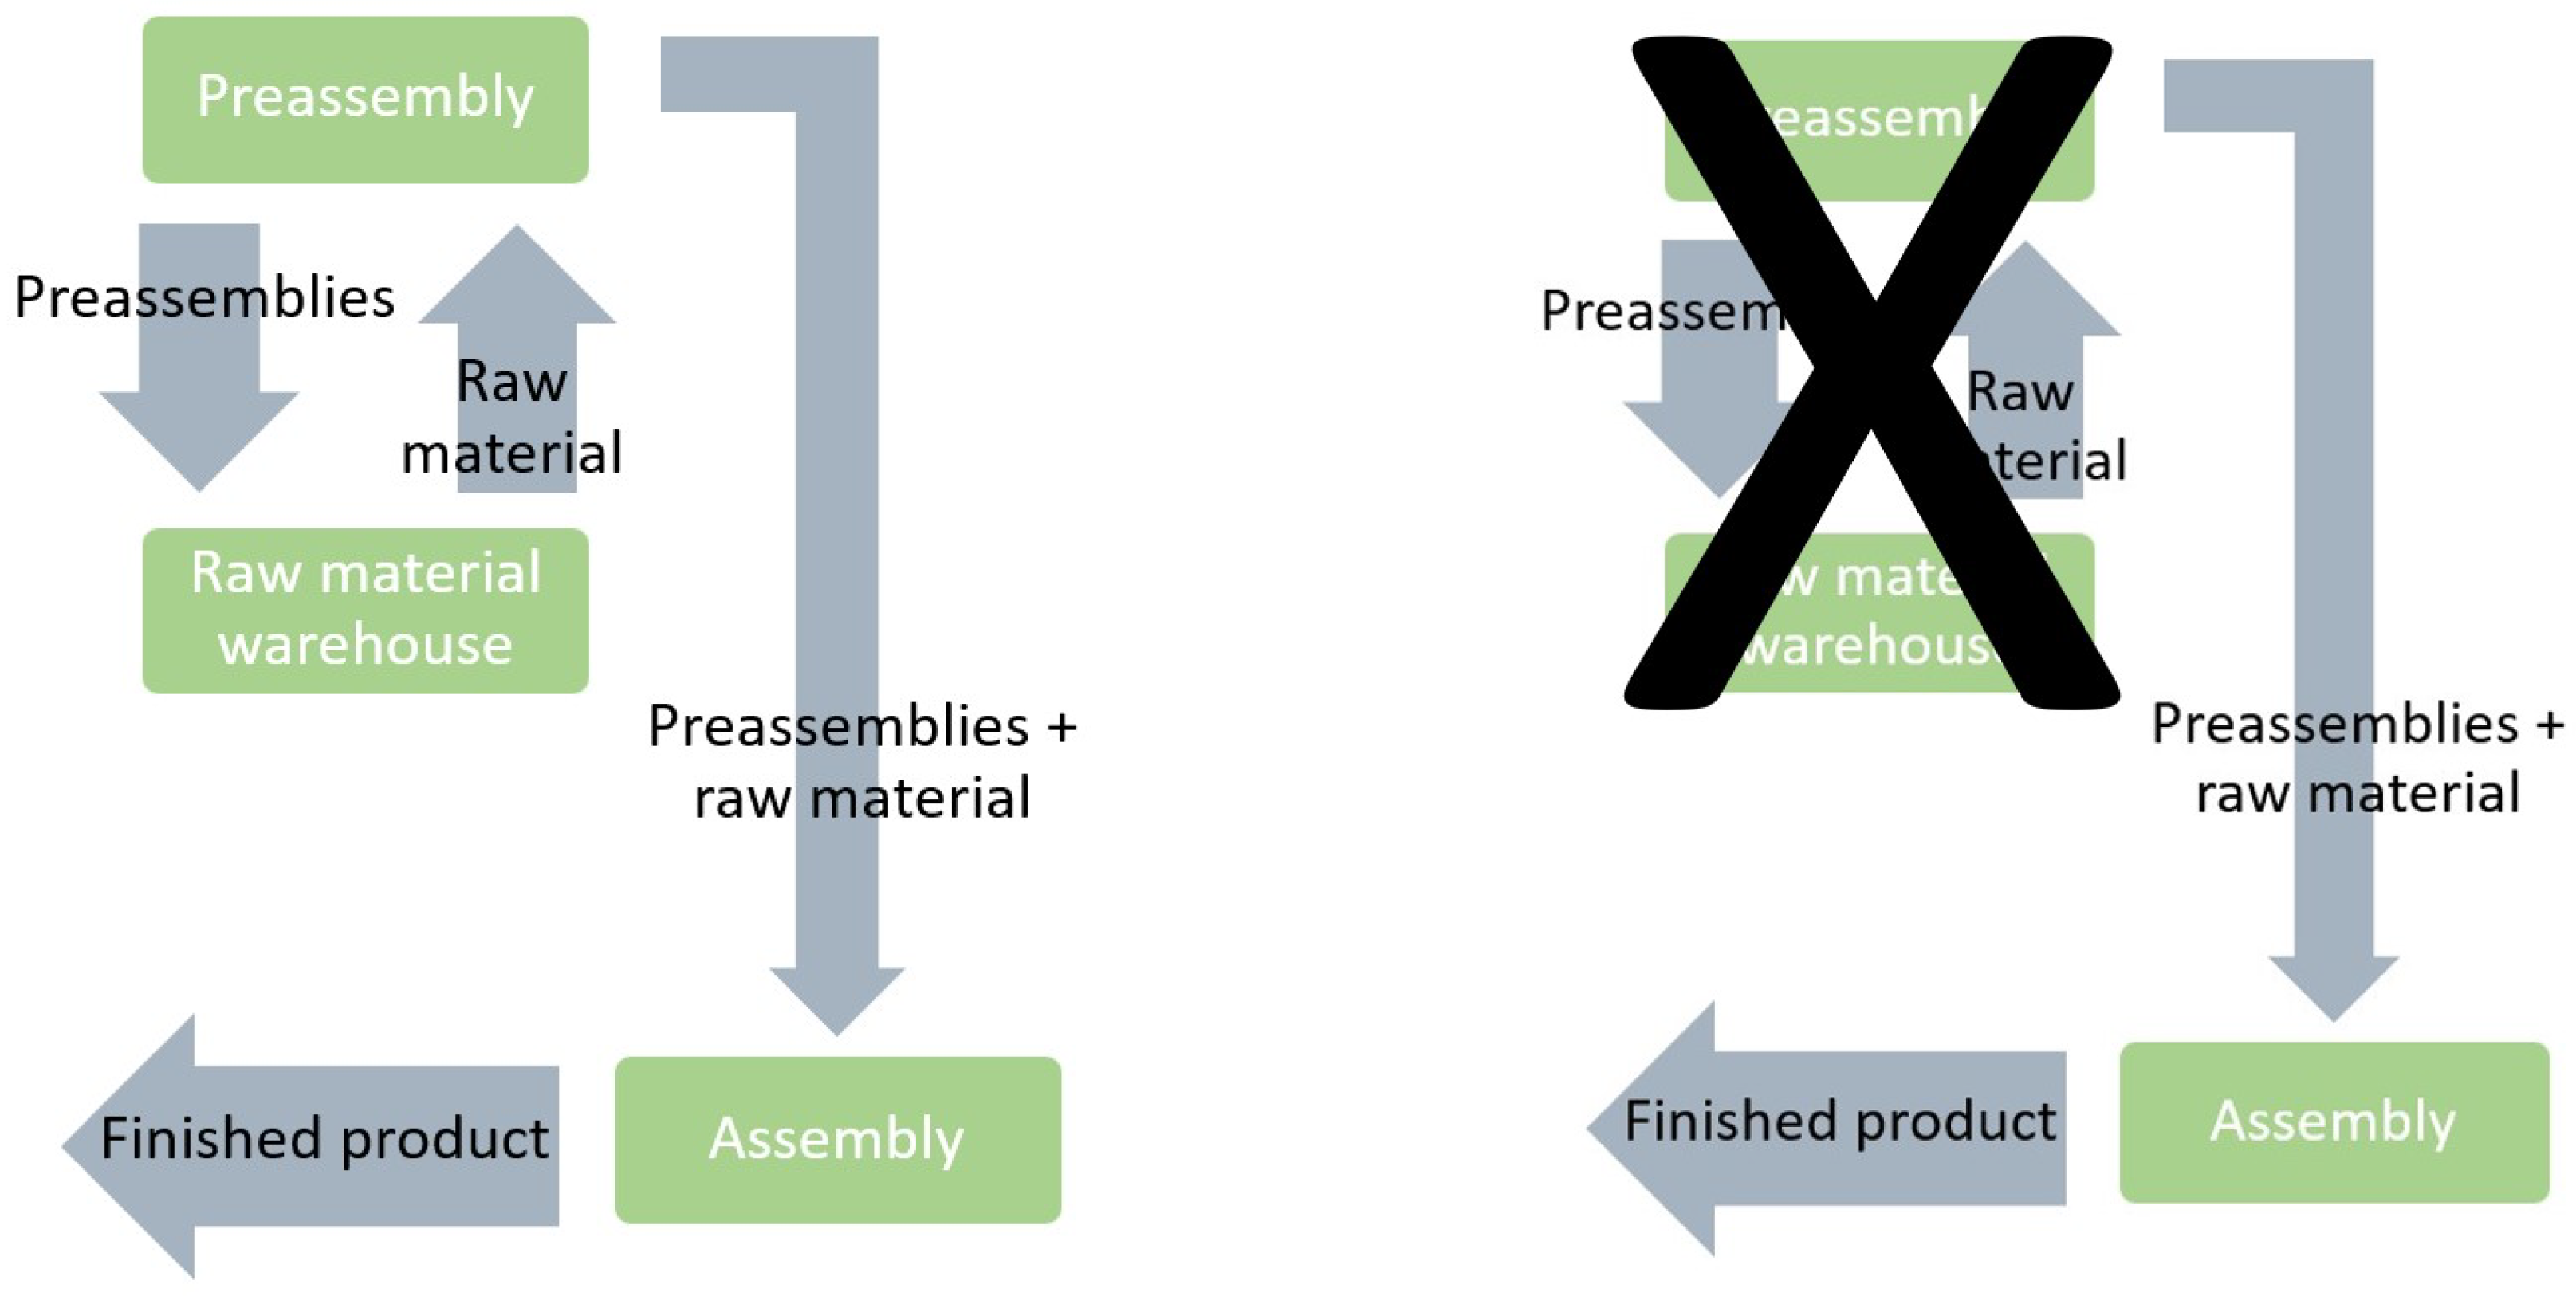
Designing Actions: Attacking Useless Warehouses and Overproduction
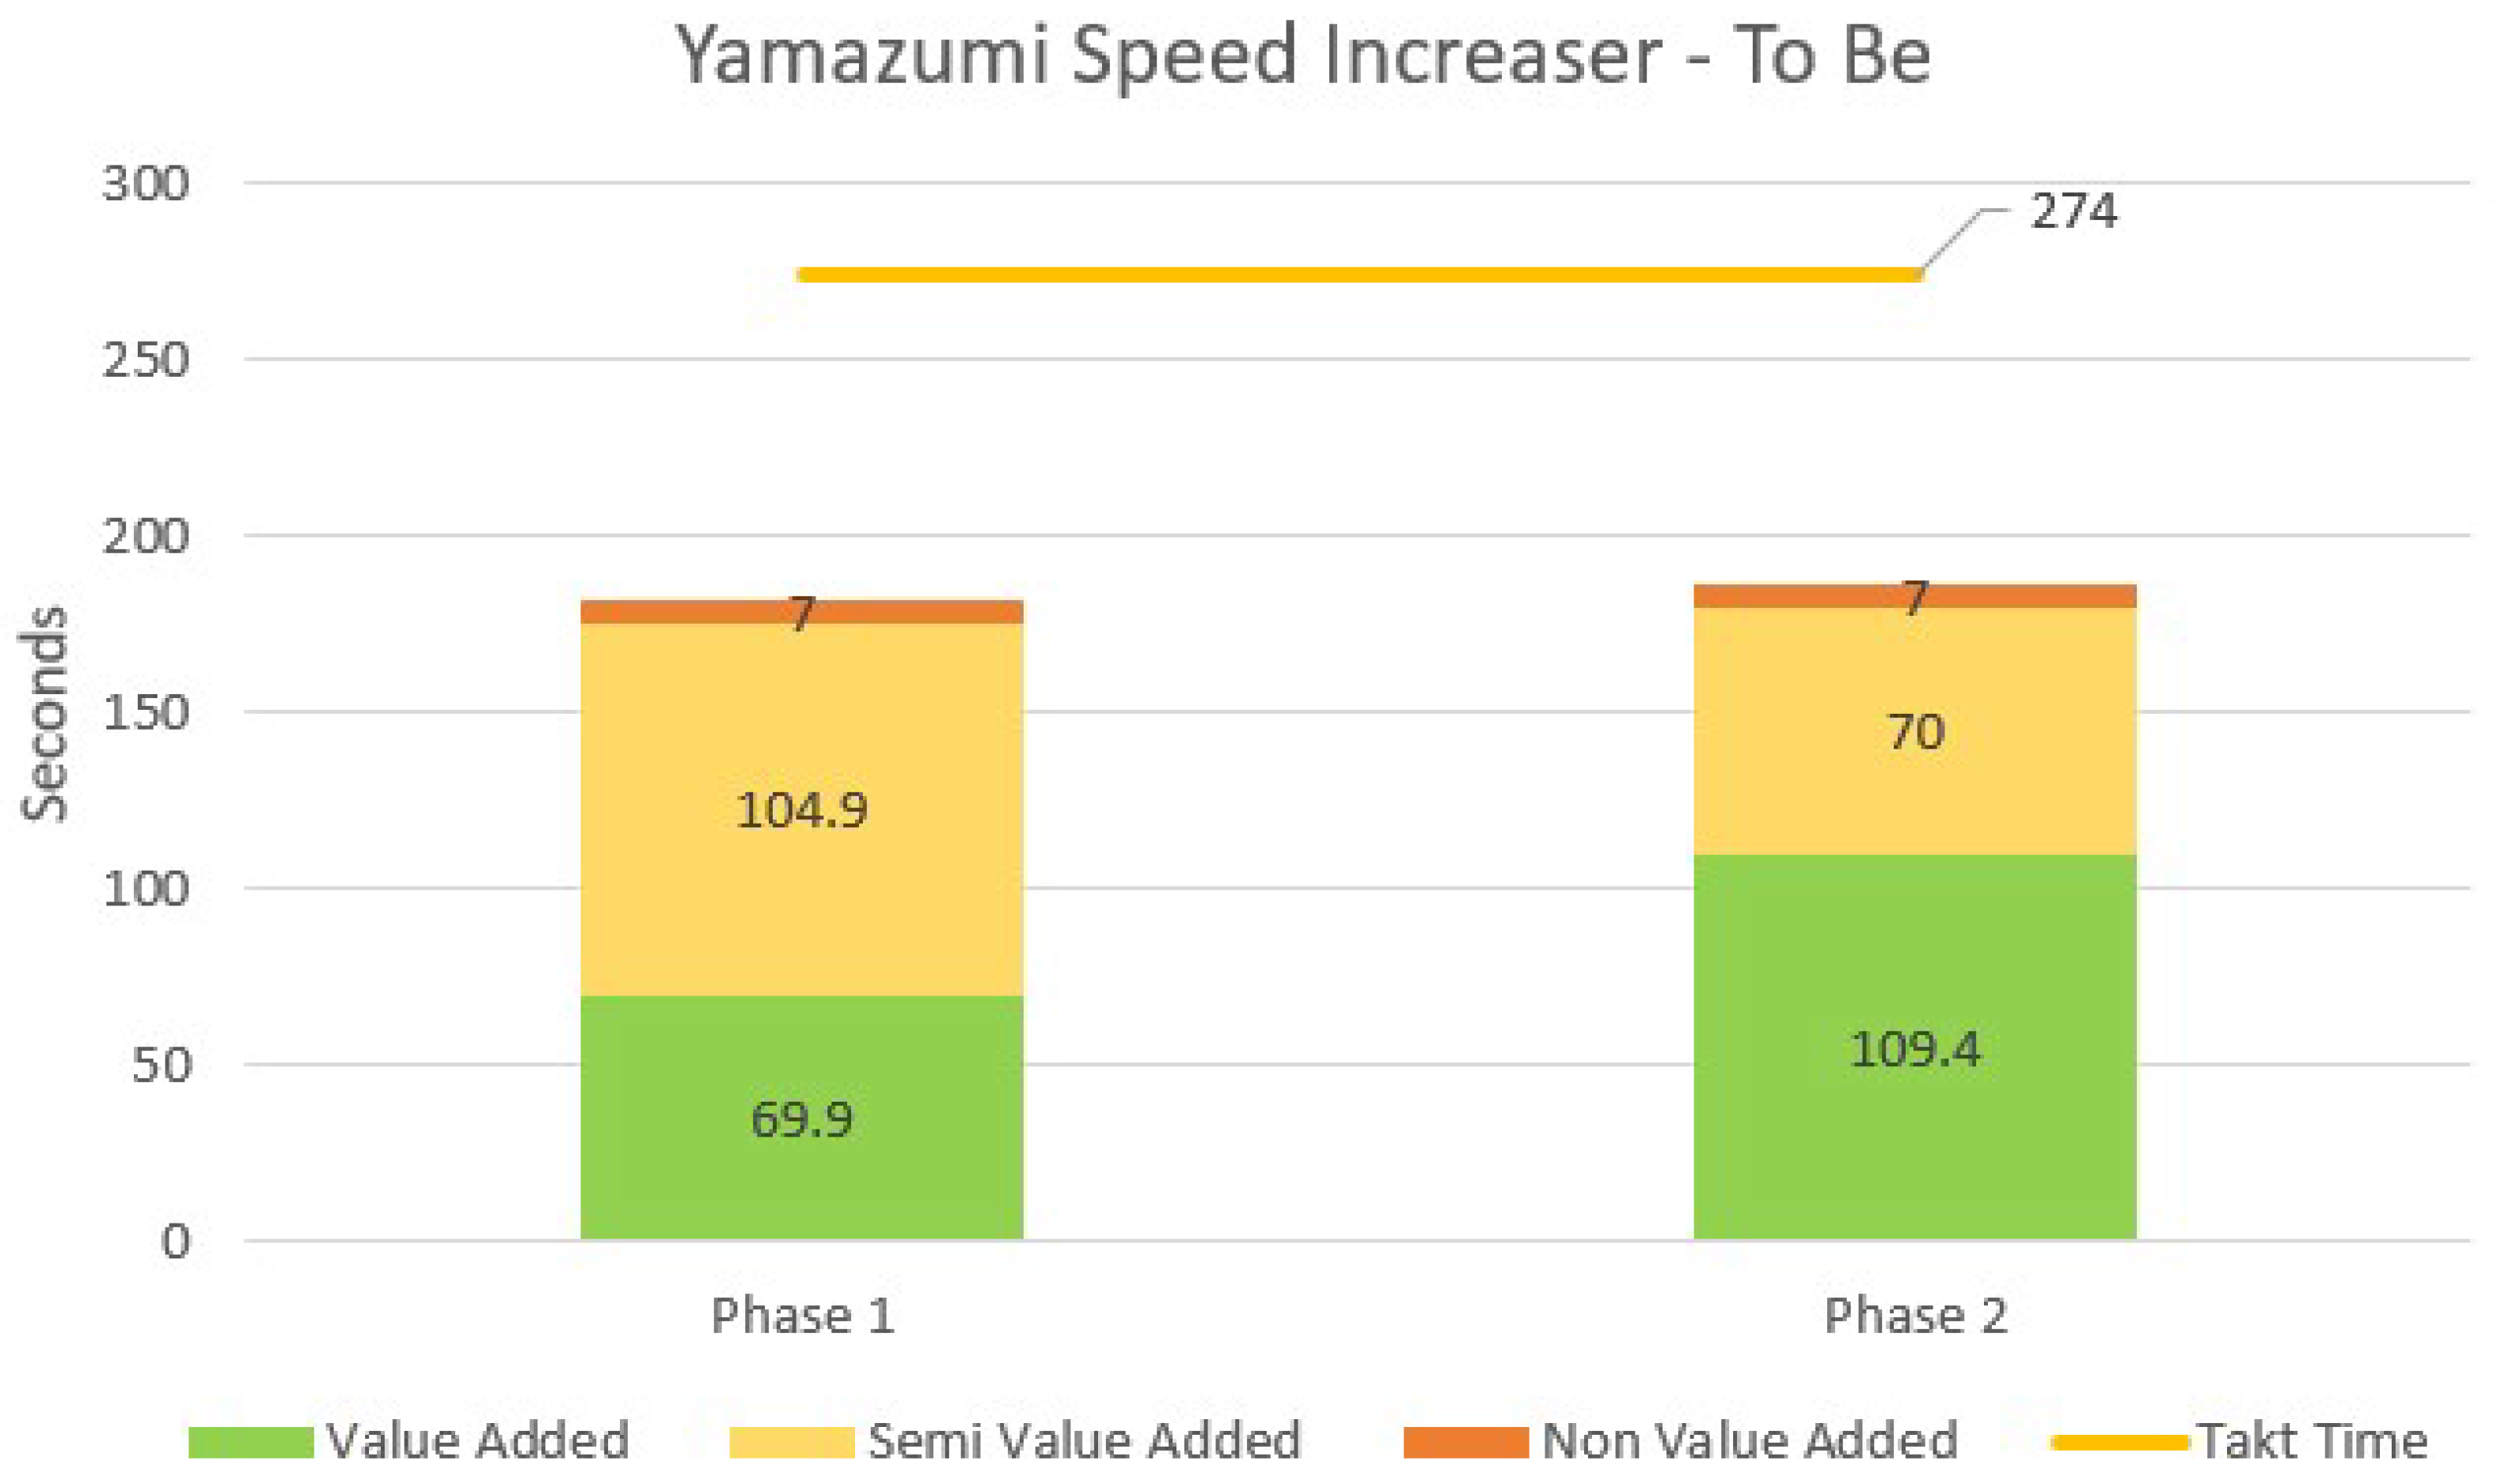
Designing Actions: Process Definition and Balancing
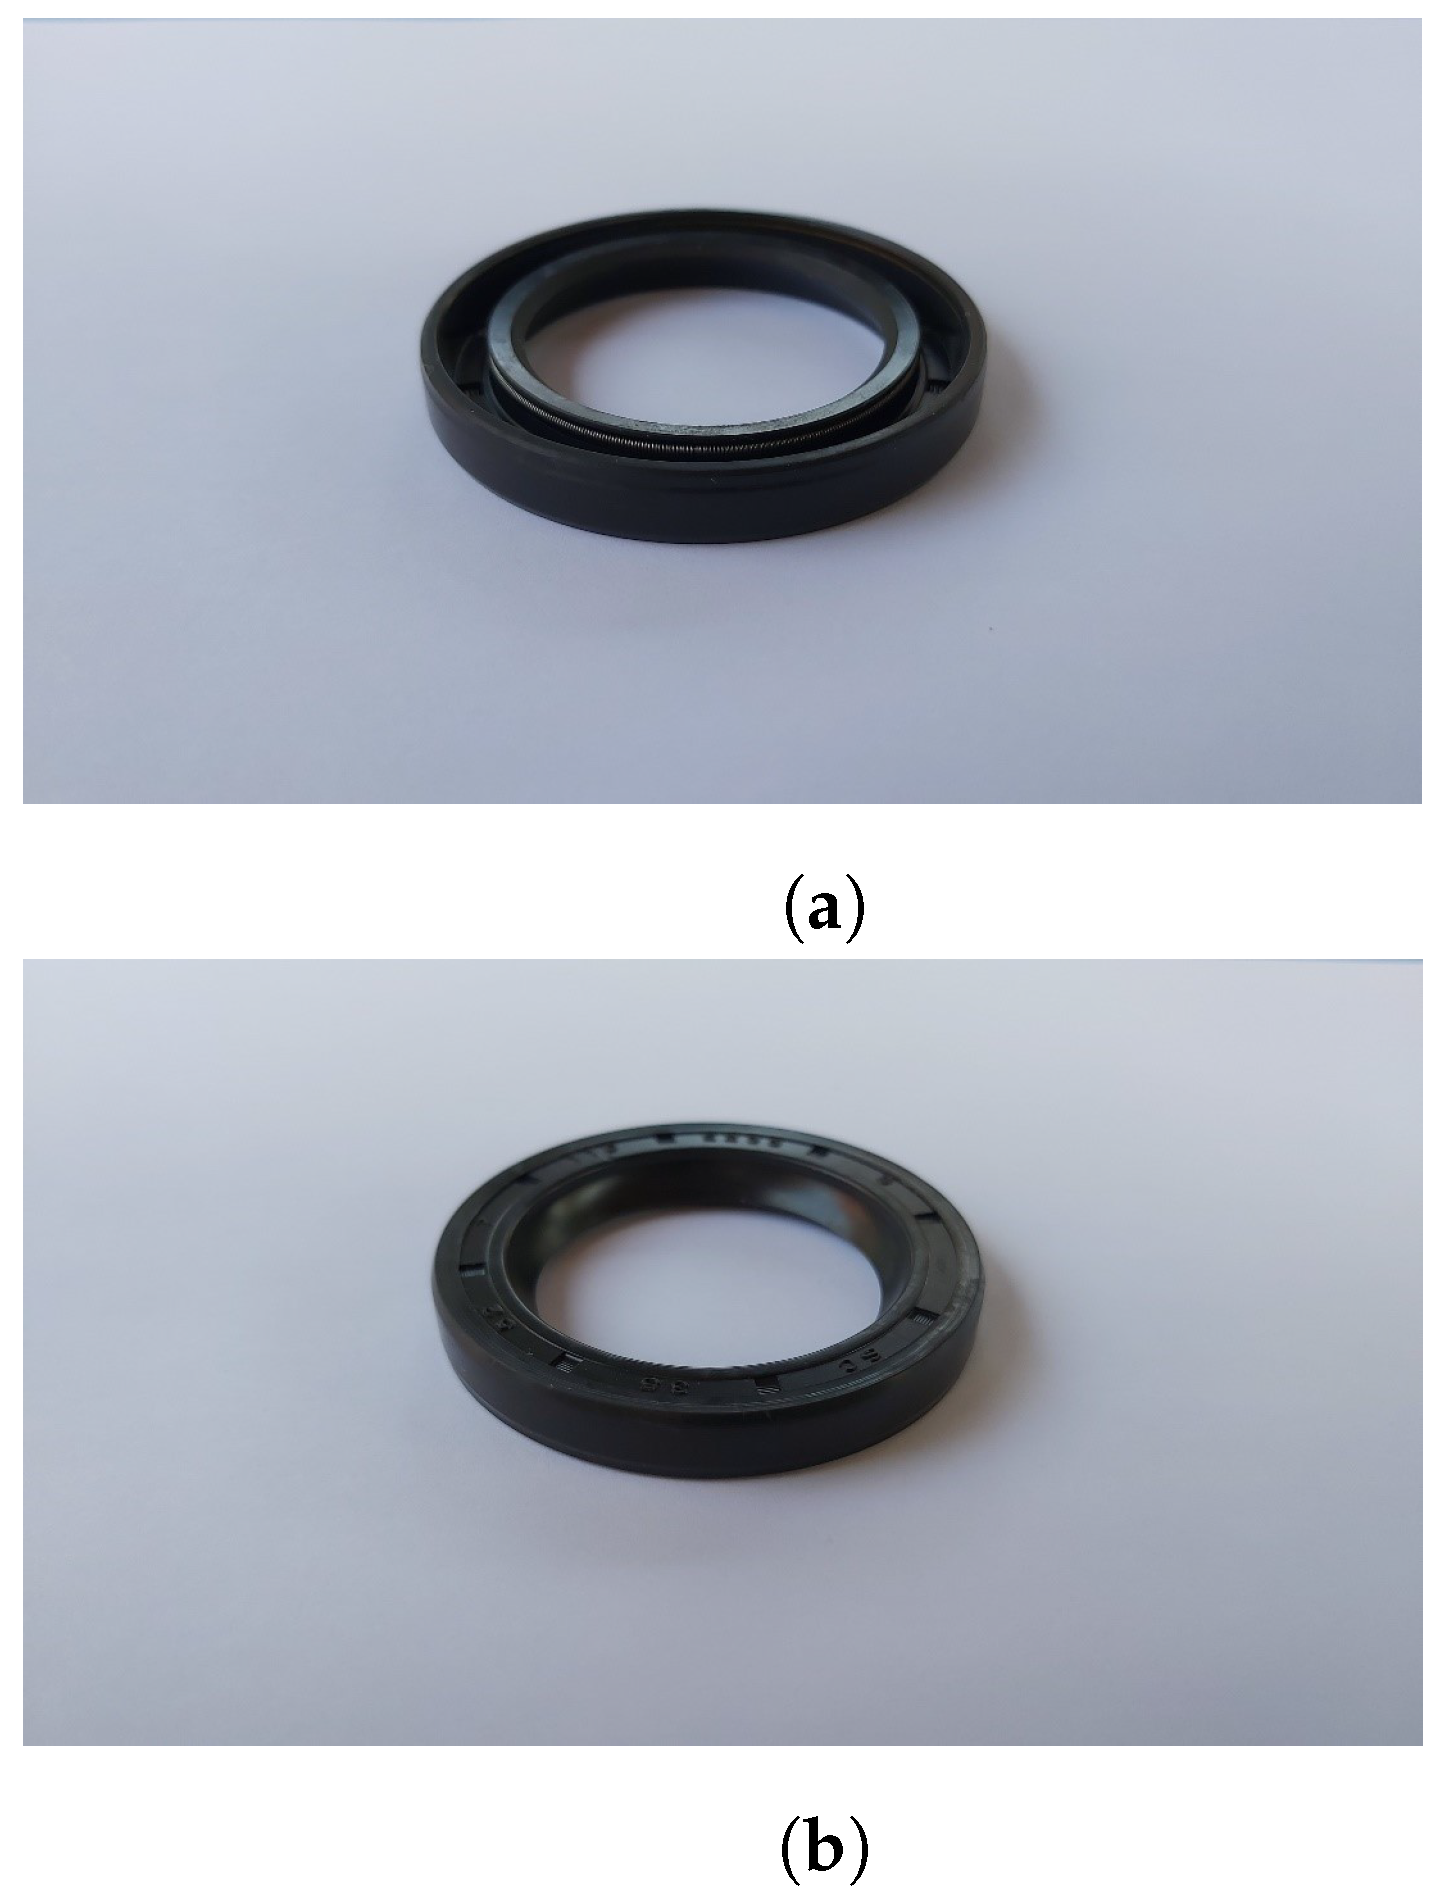
2.2. Oil Seal Control with Deep Learning
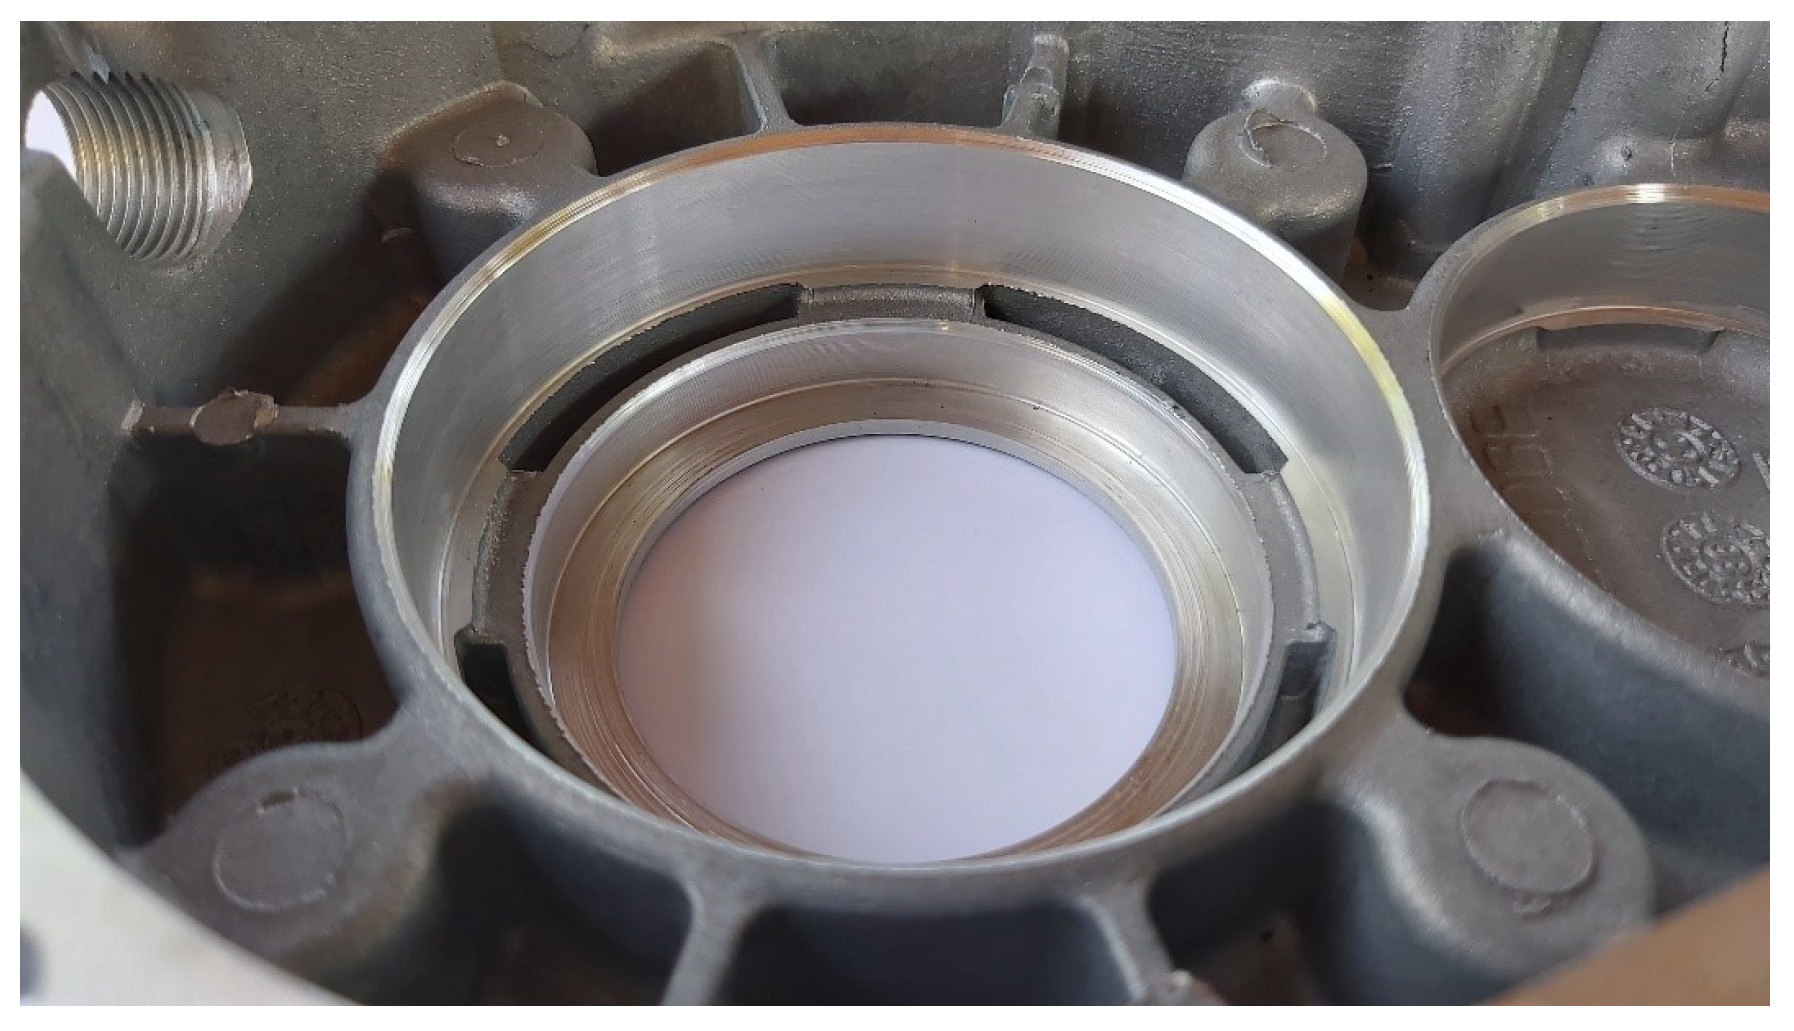
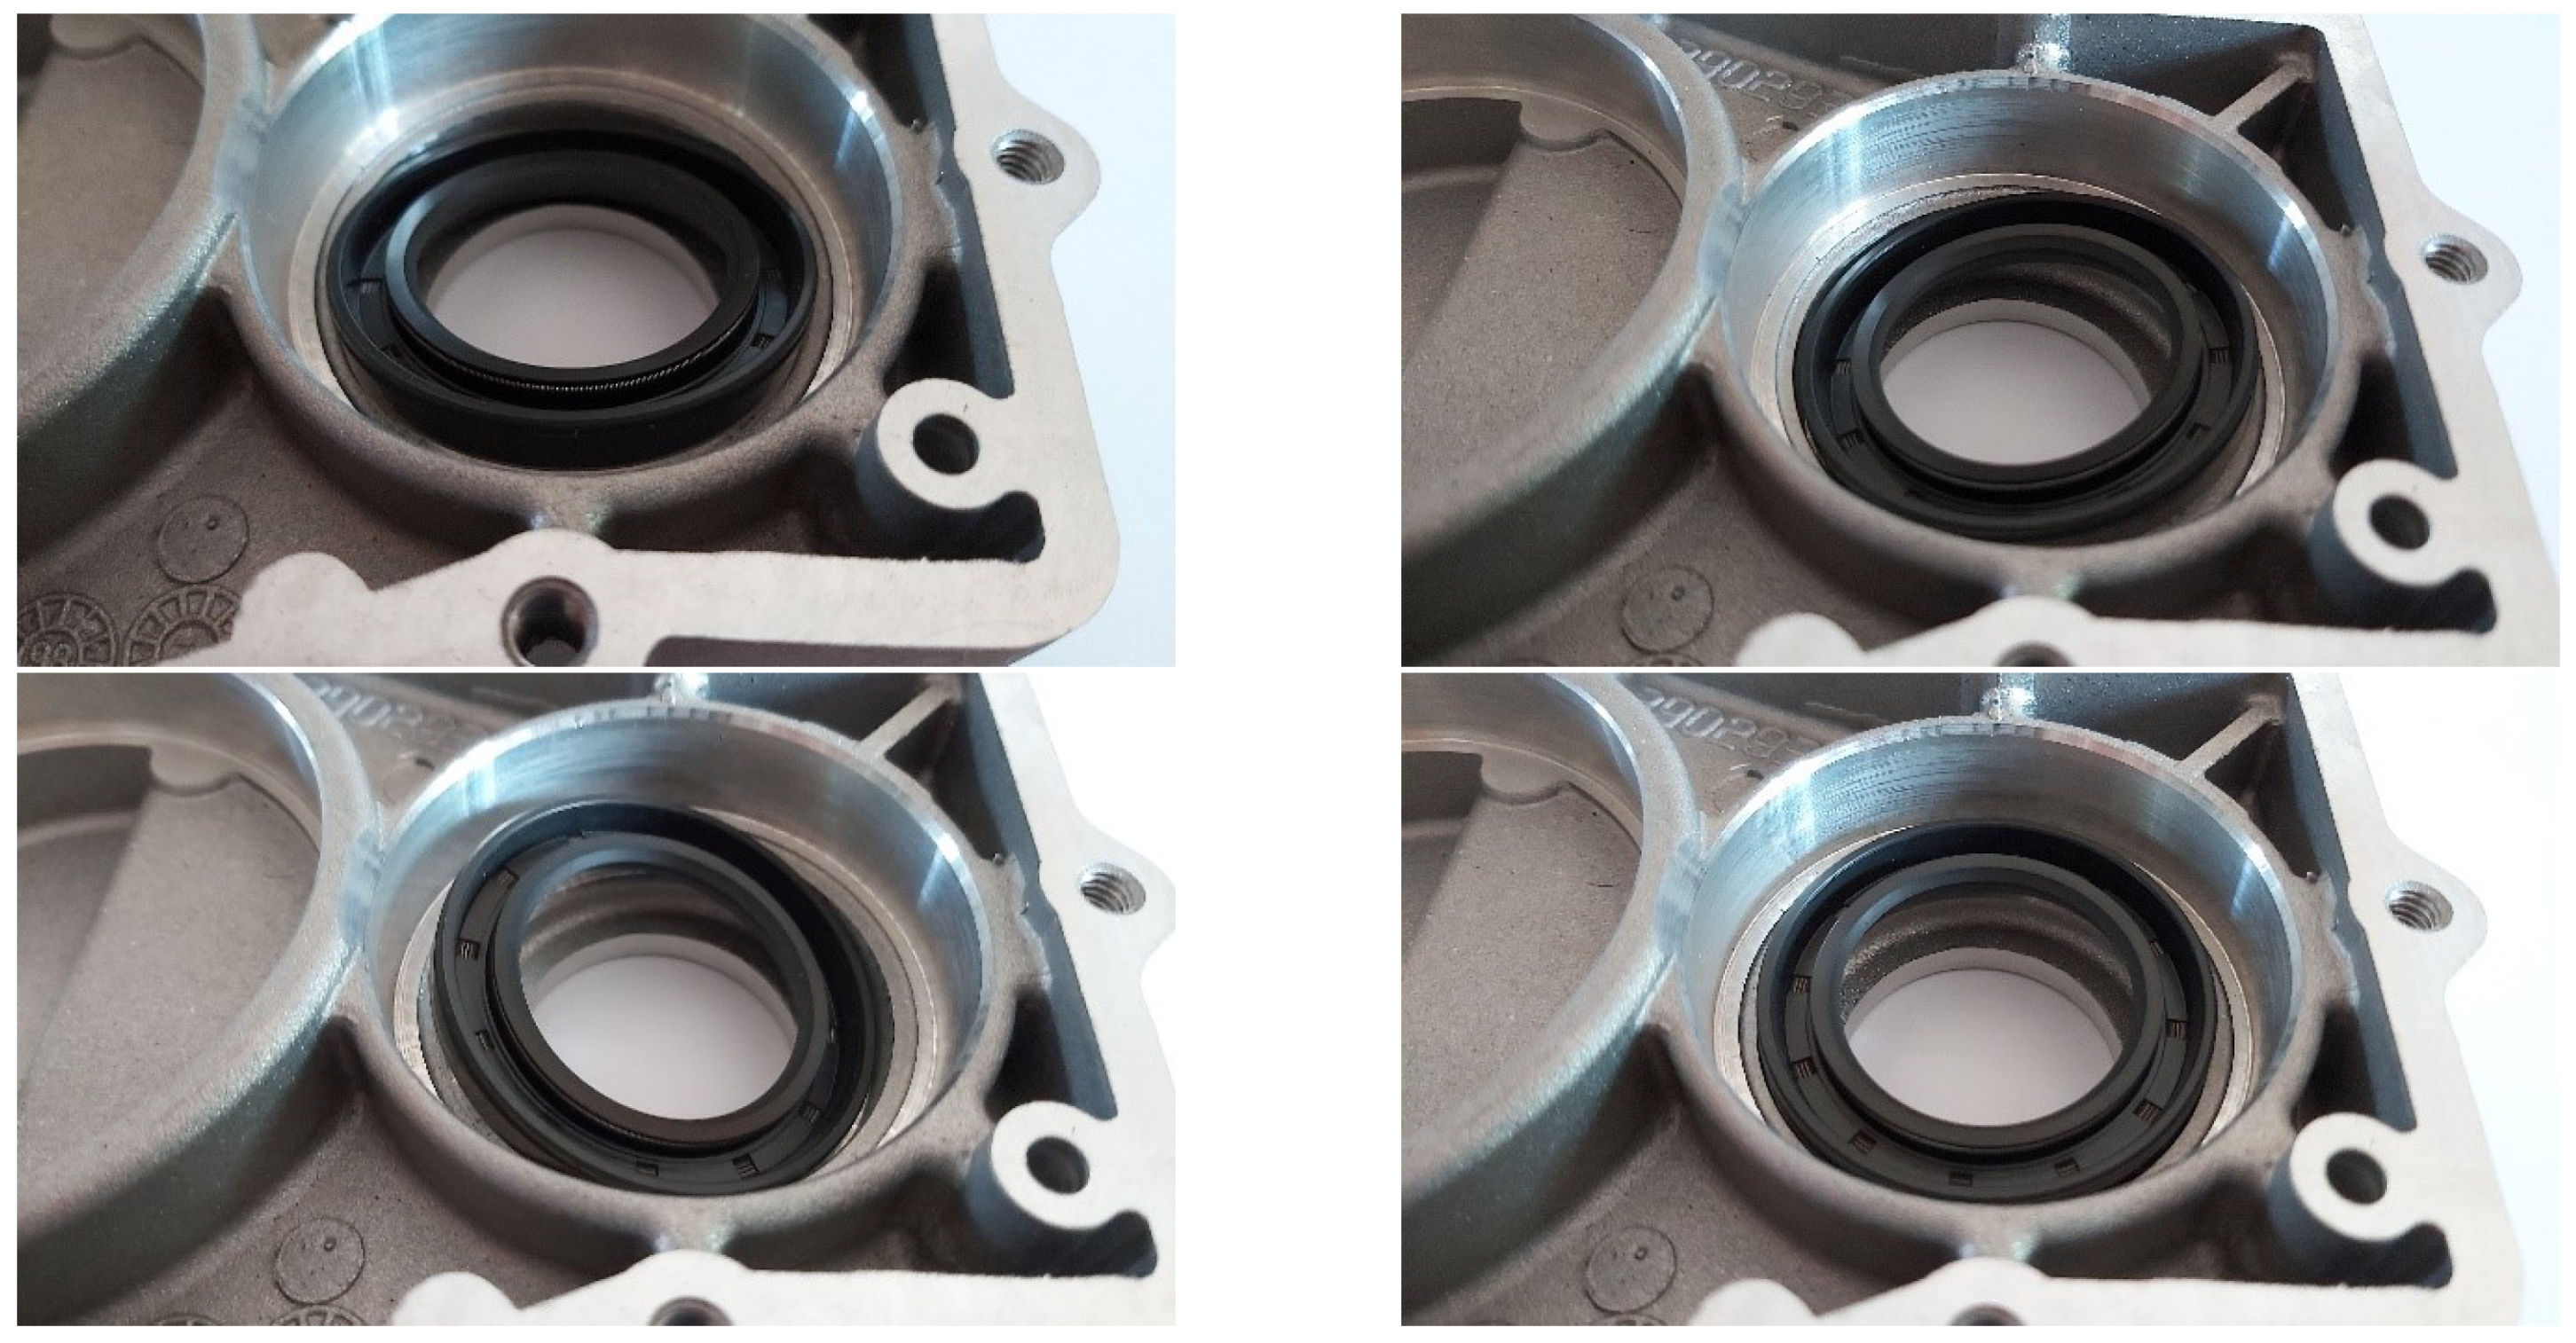
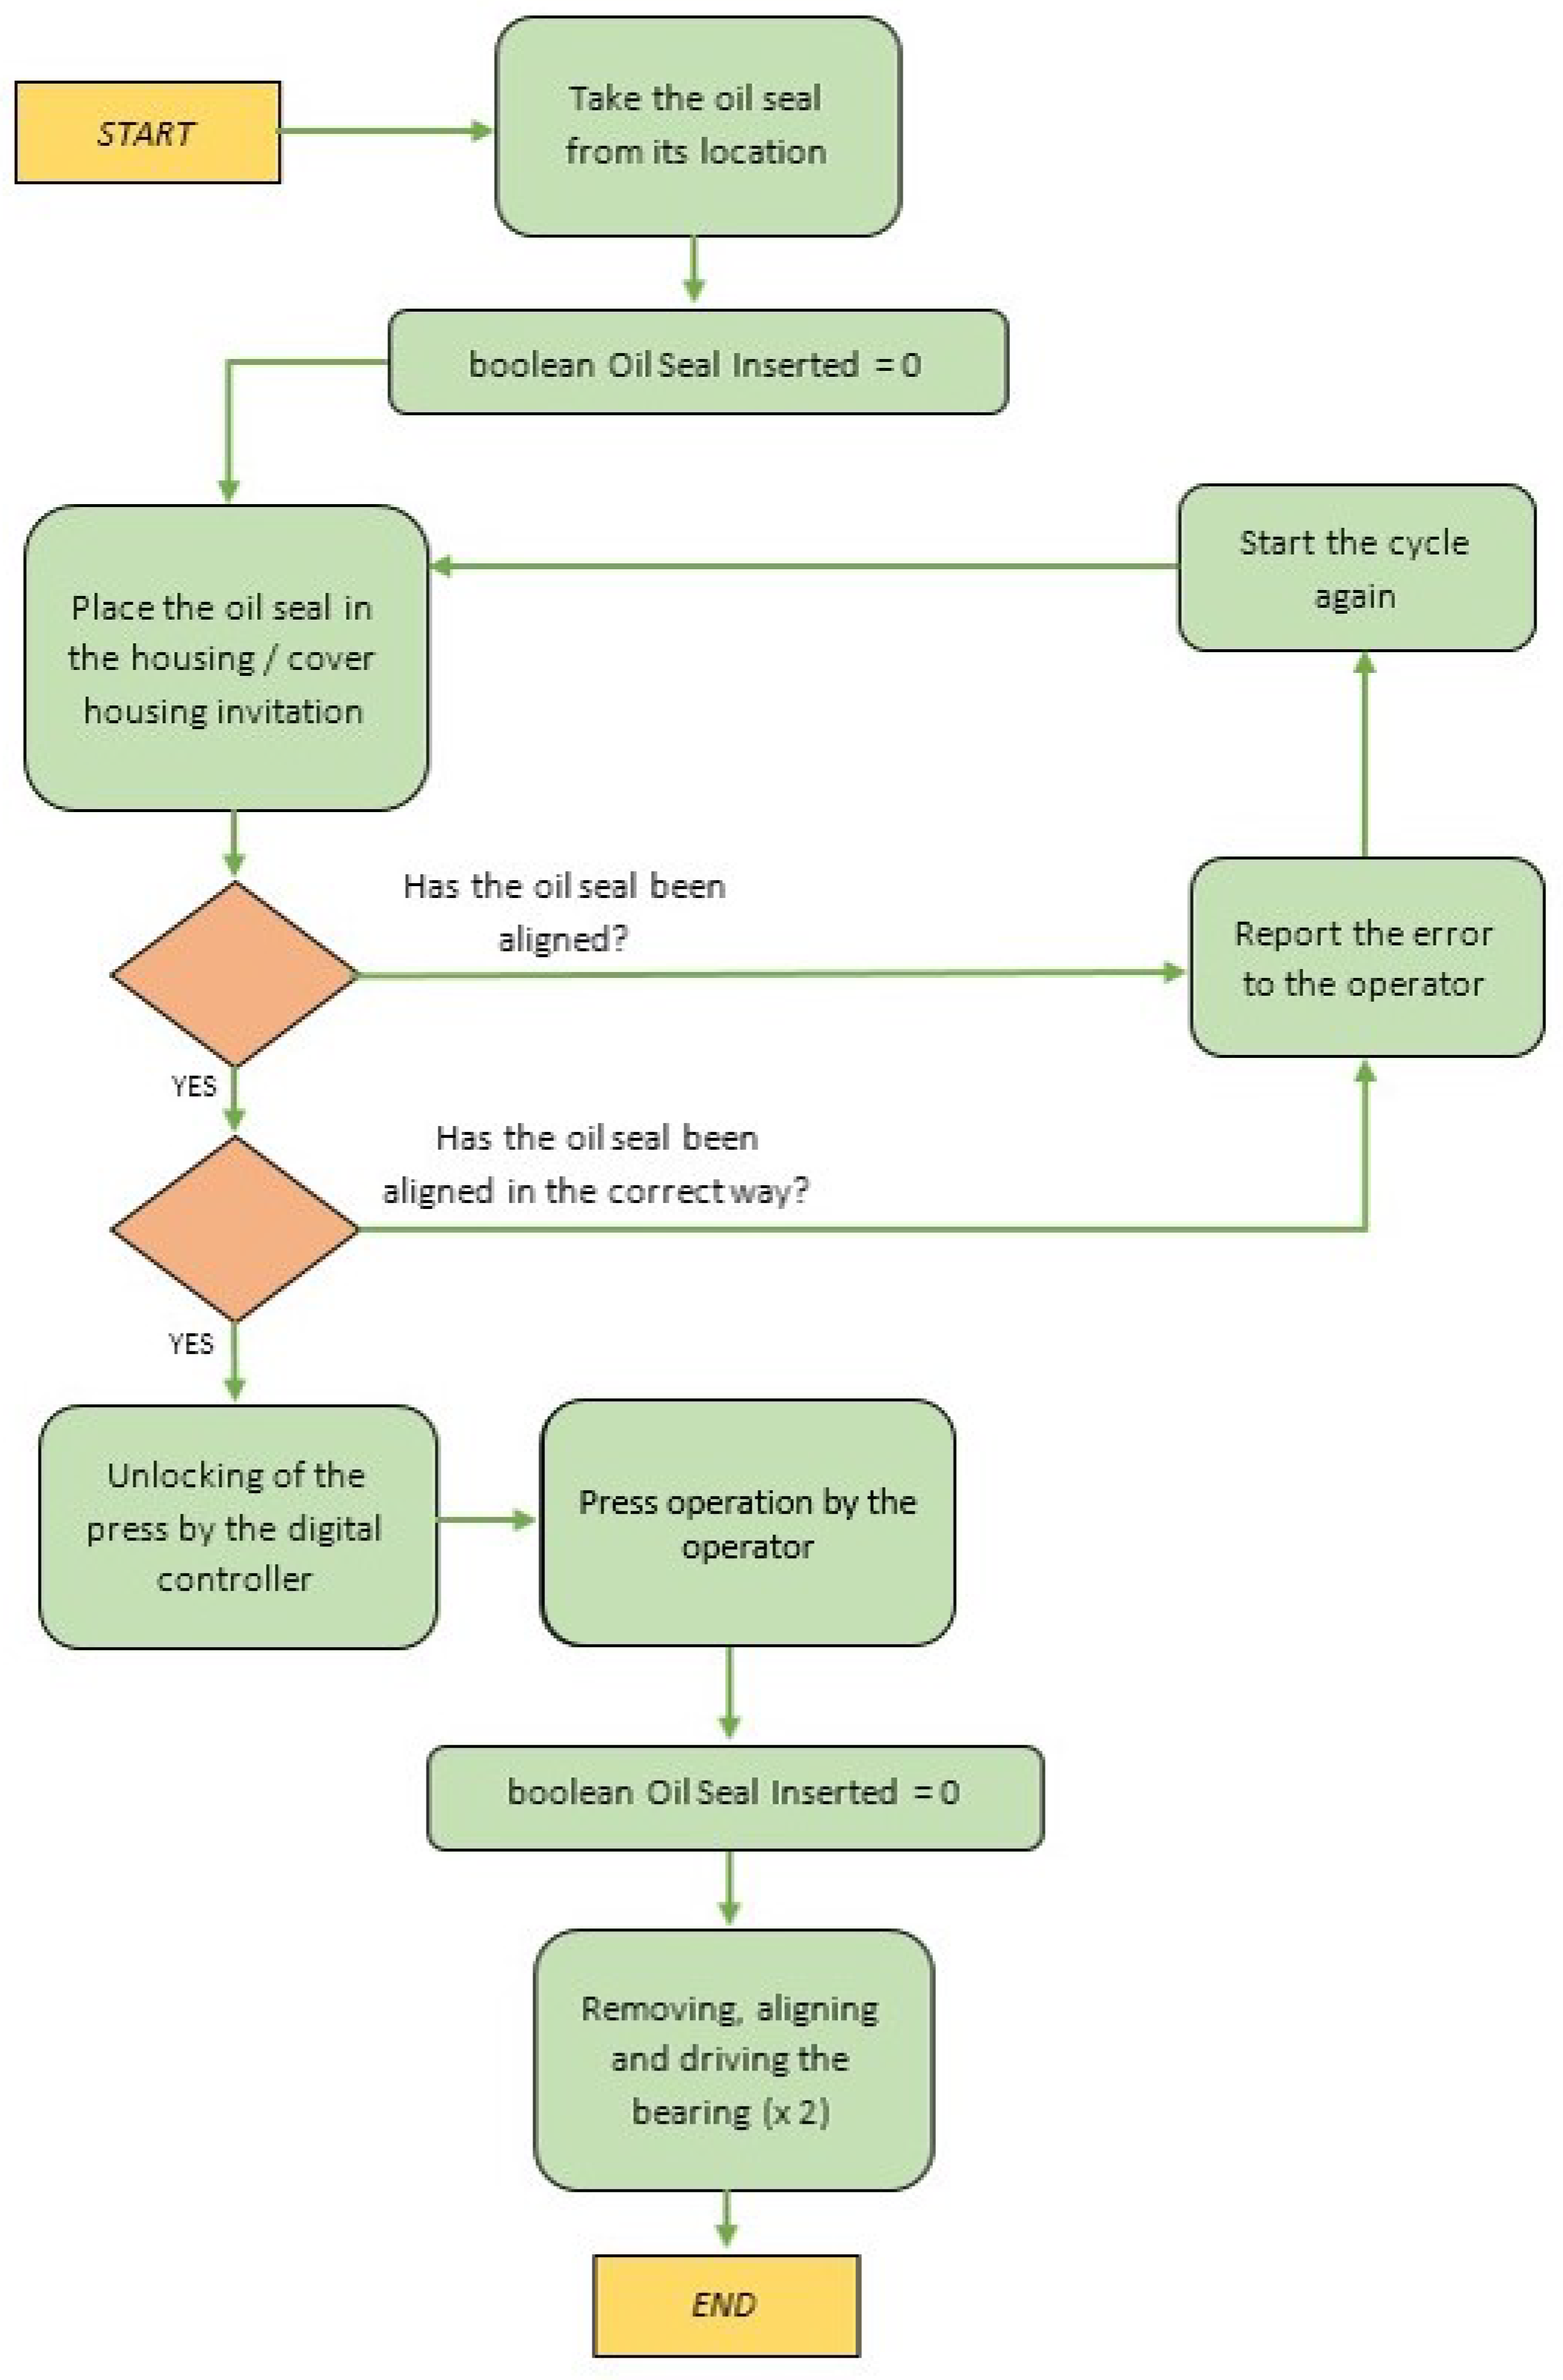
2.2.1. Problem Description
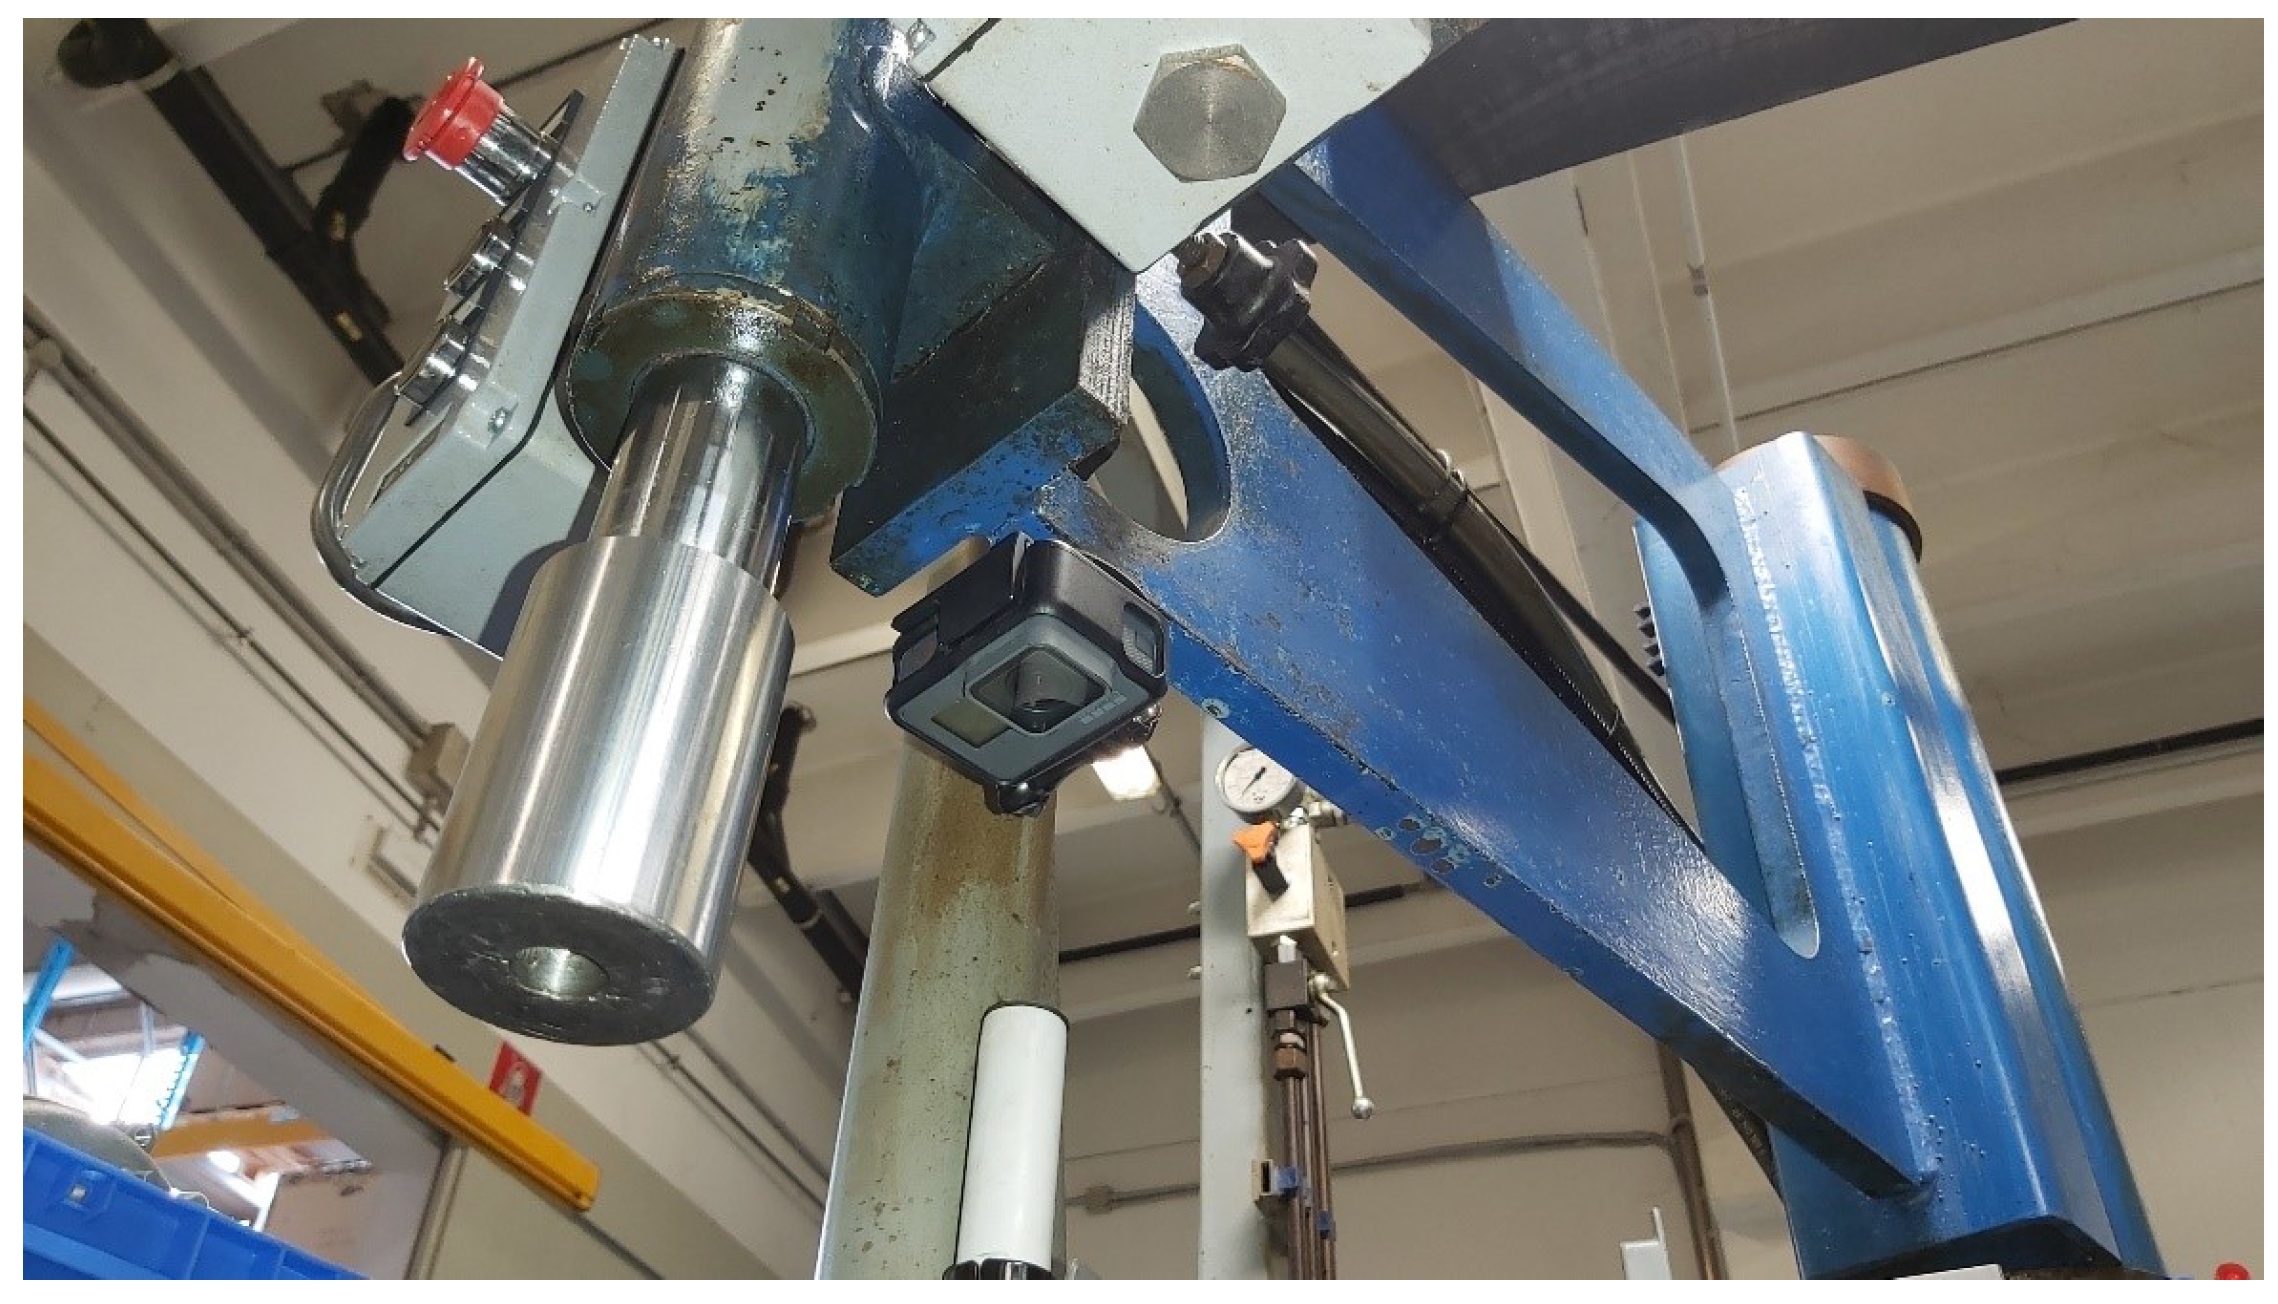
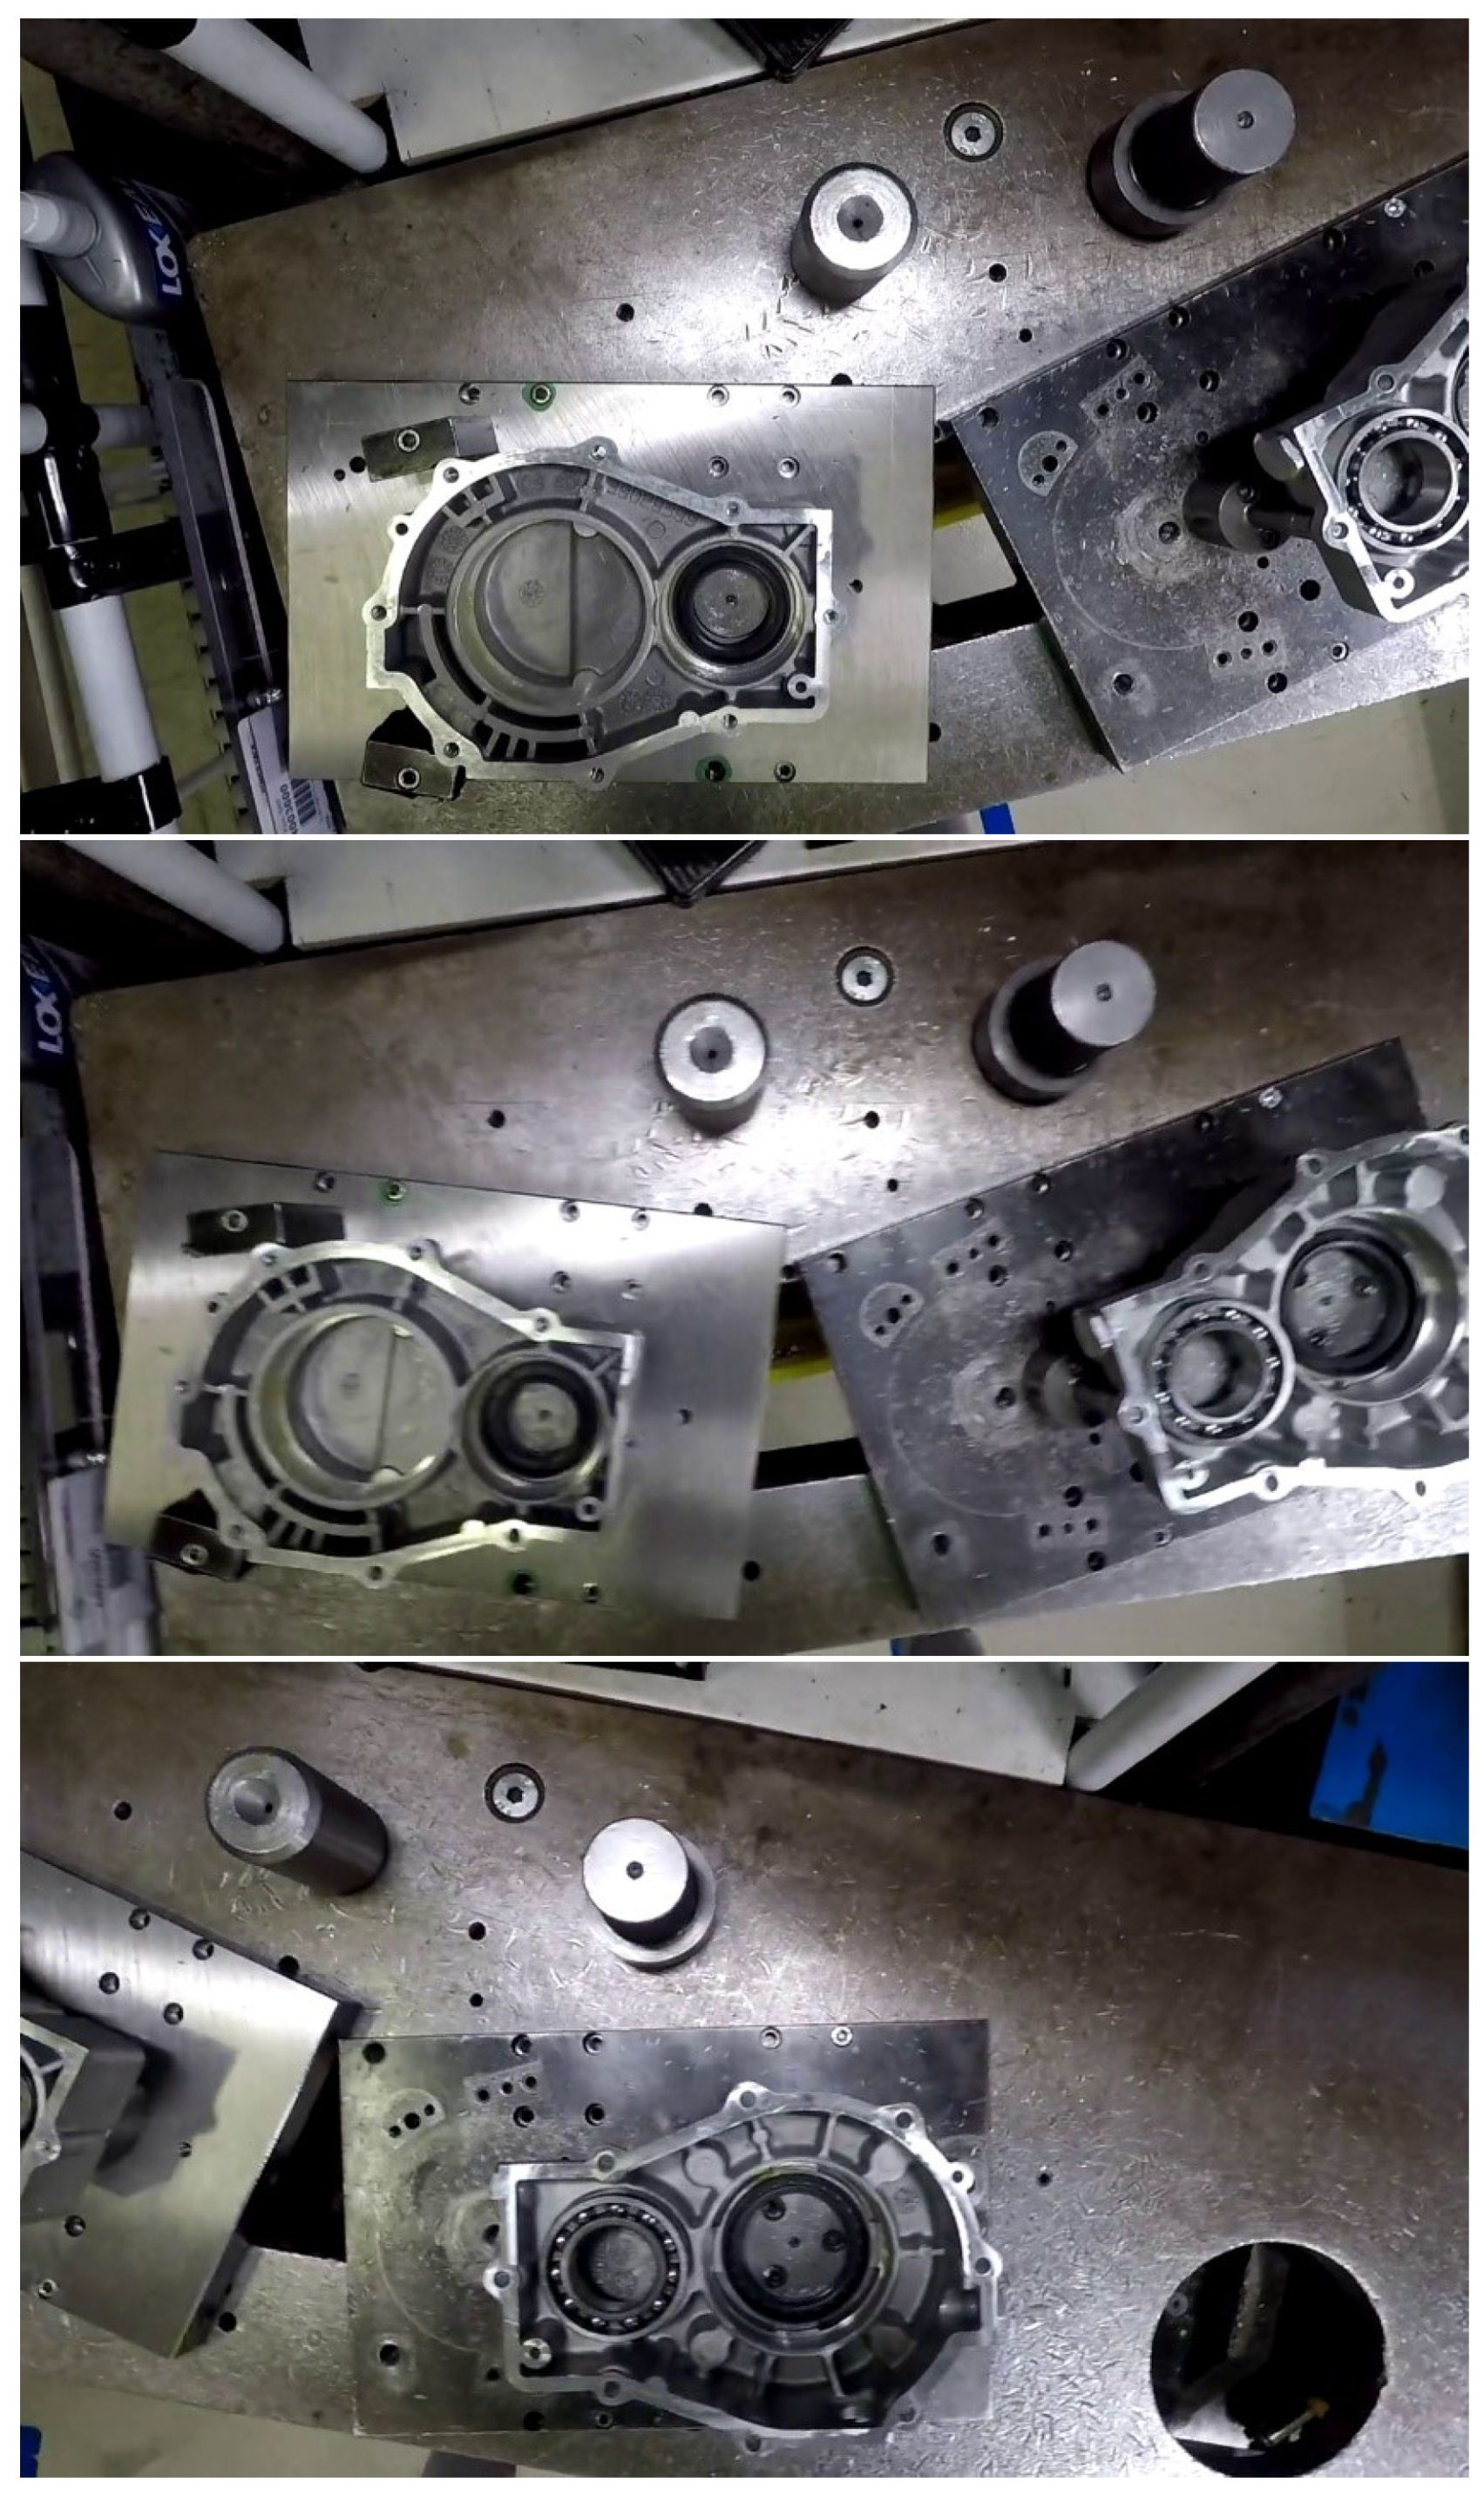
2.2.2. Proposed Framework
2.2.3. Methods
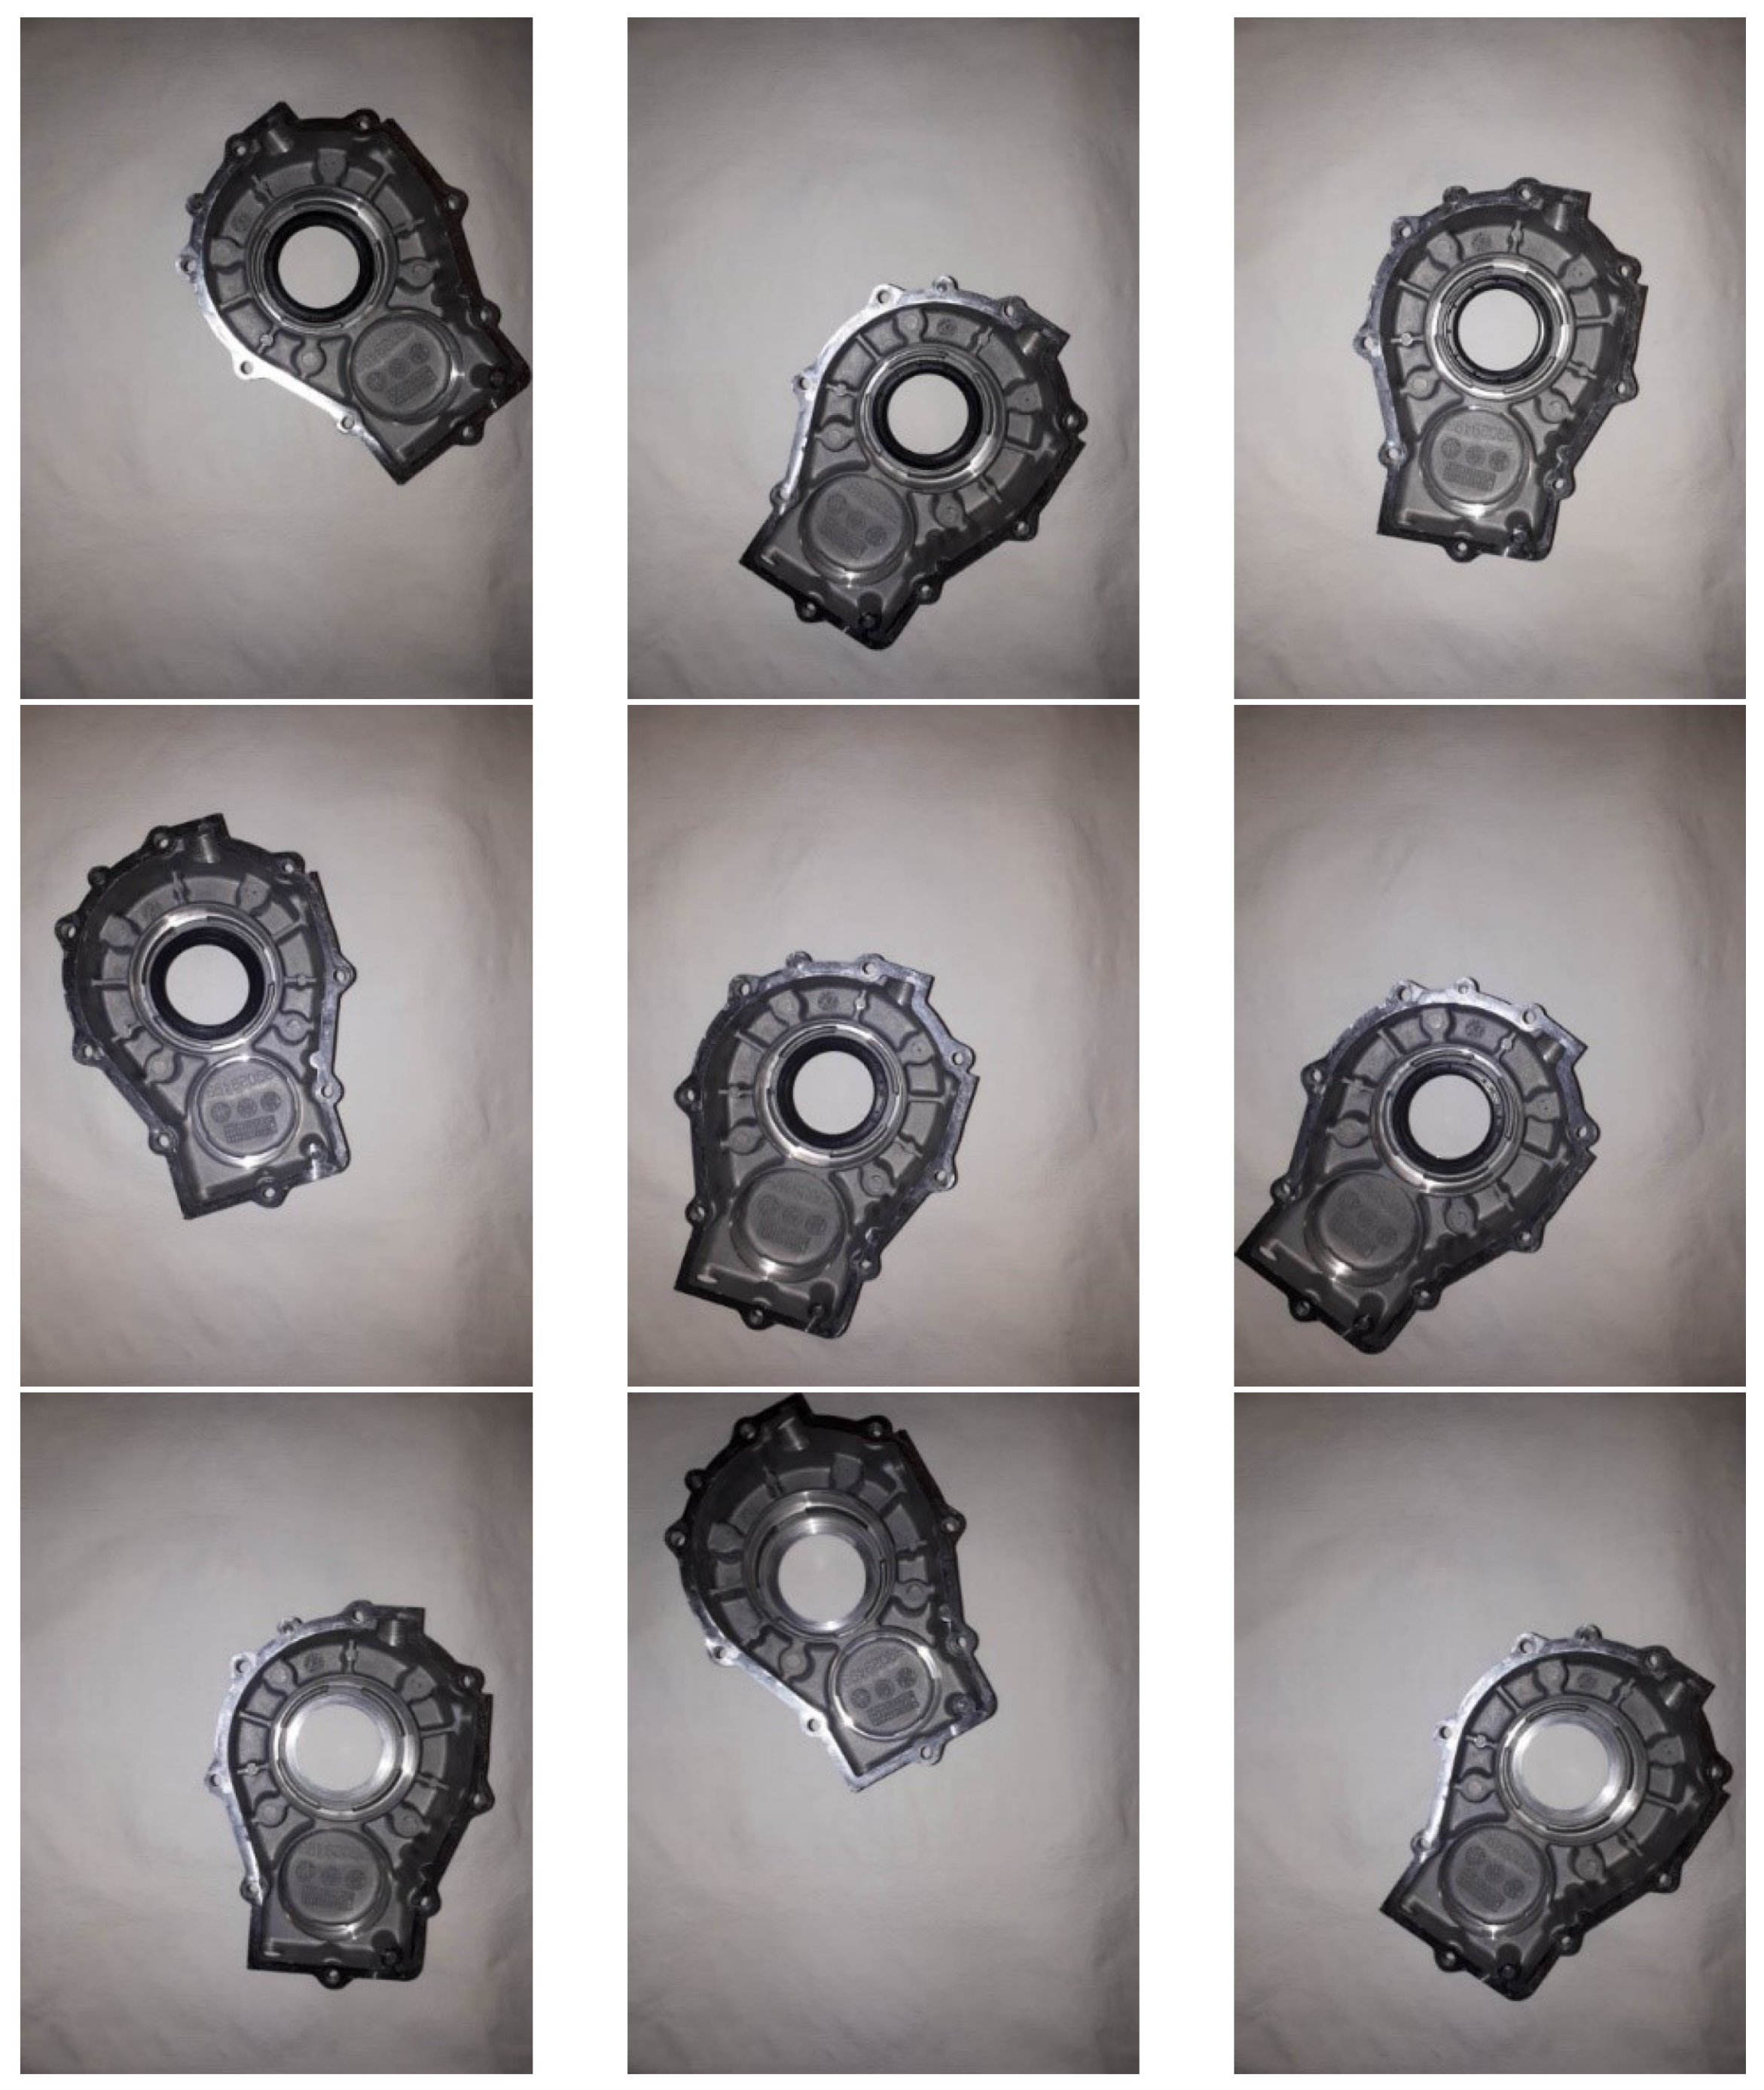
2.2.4. Dataset
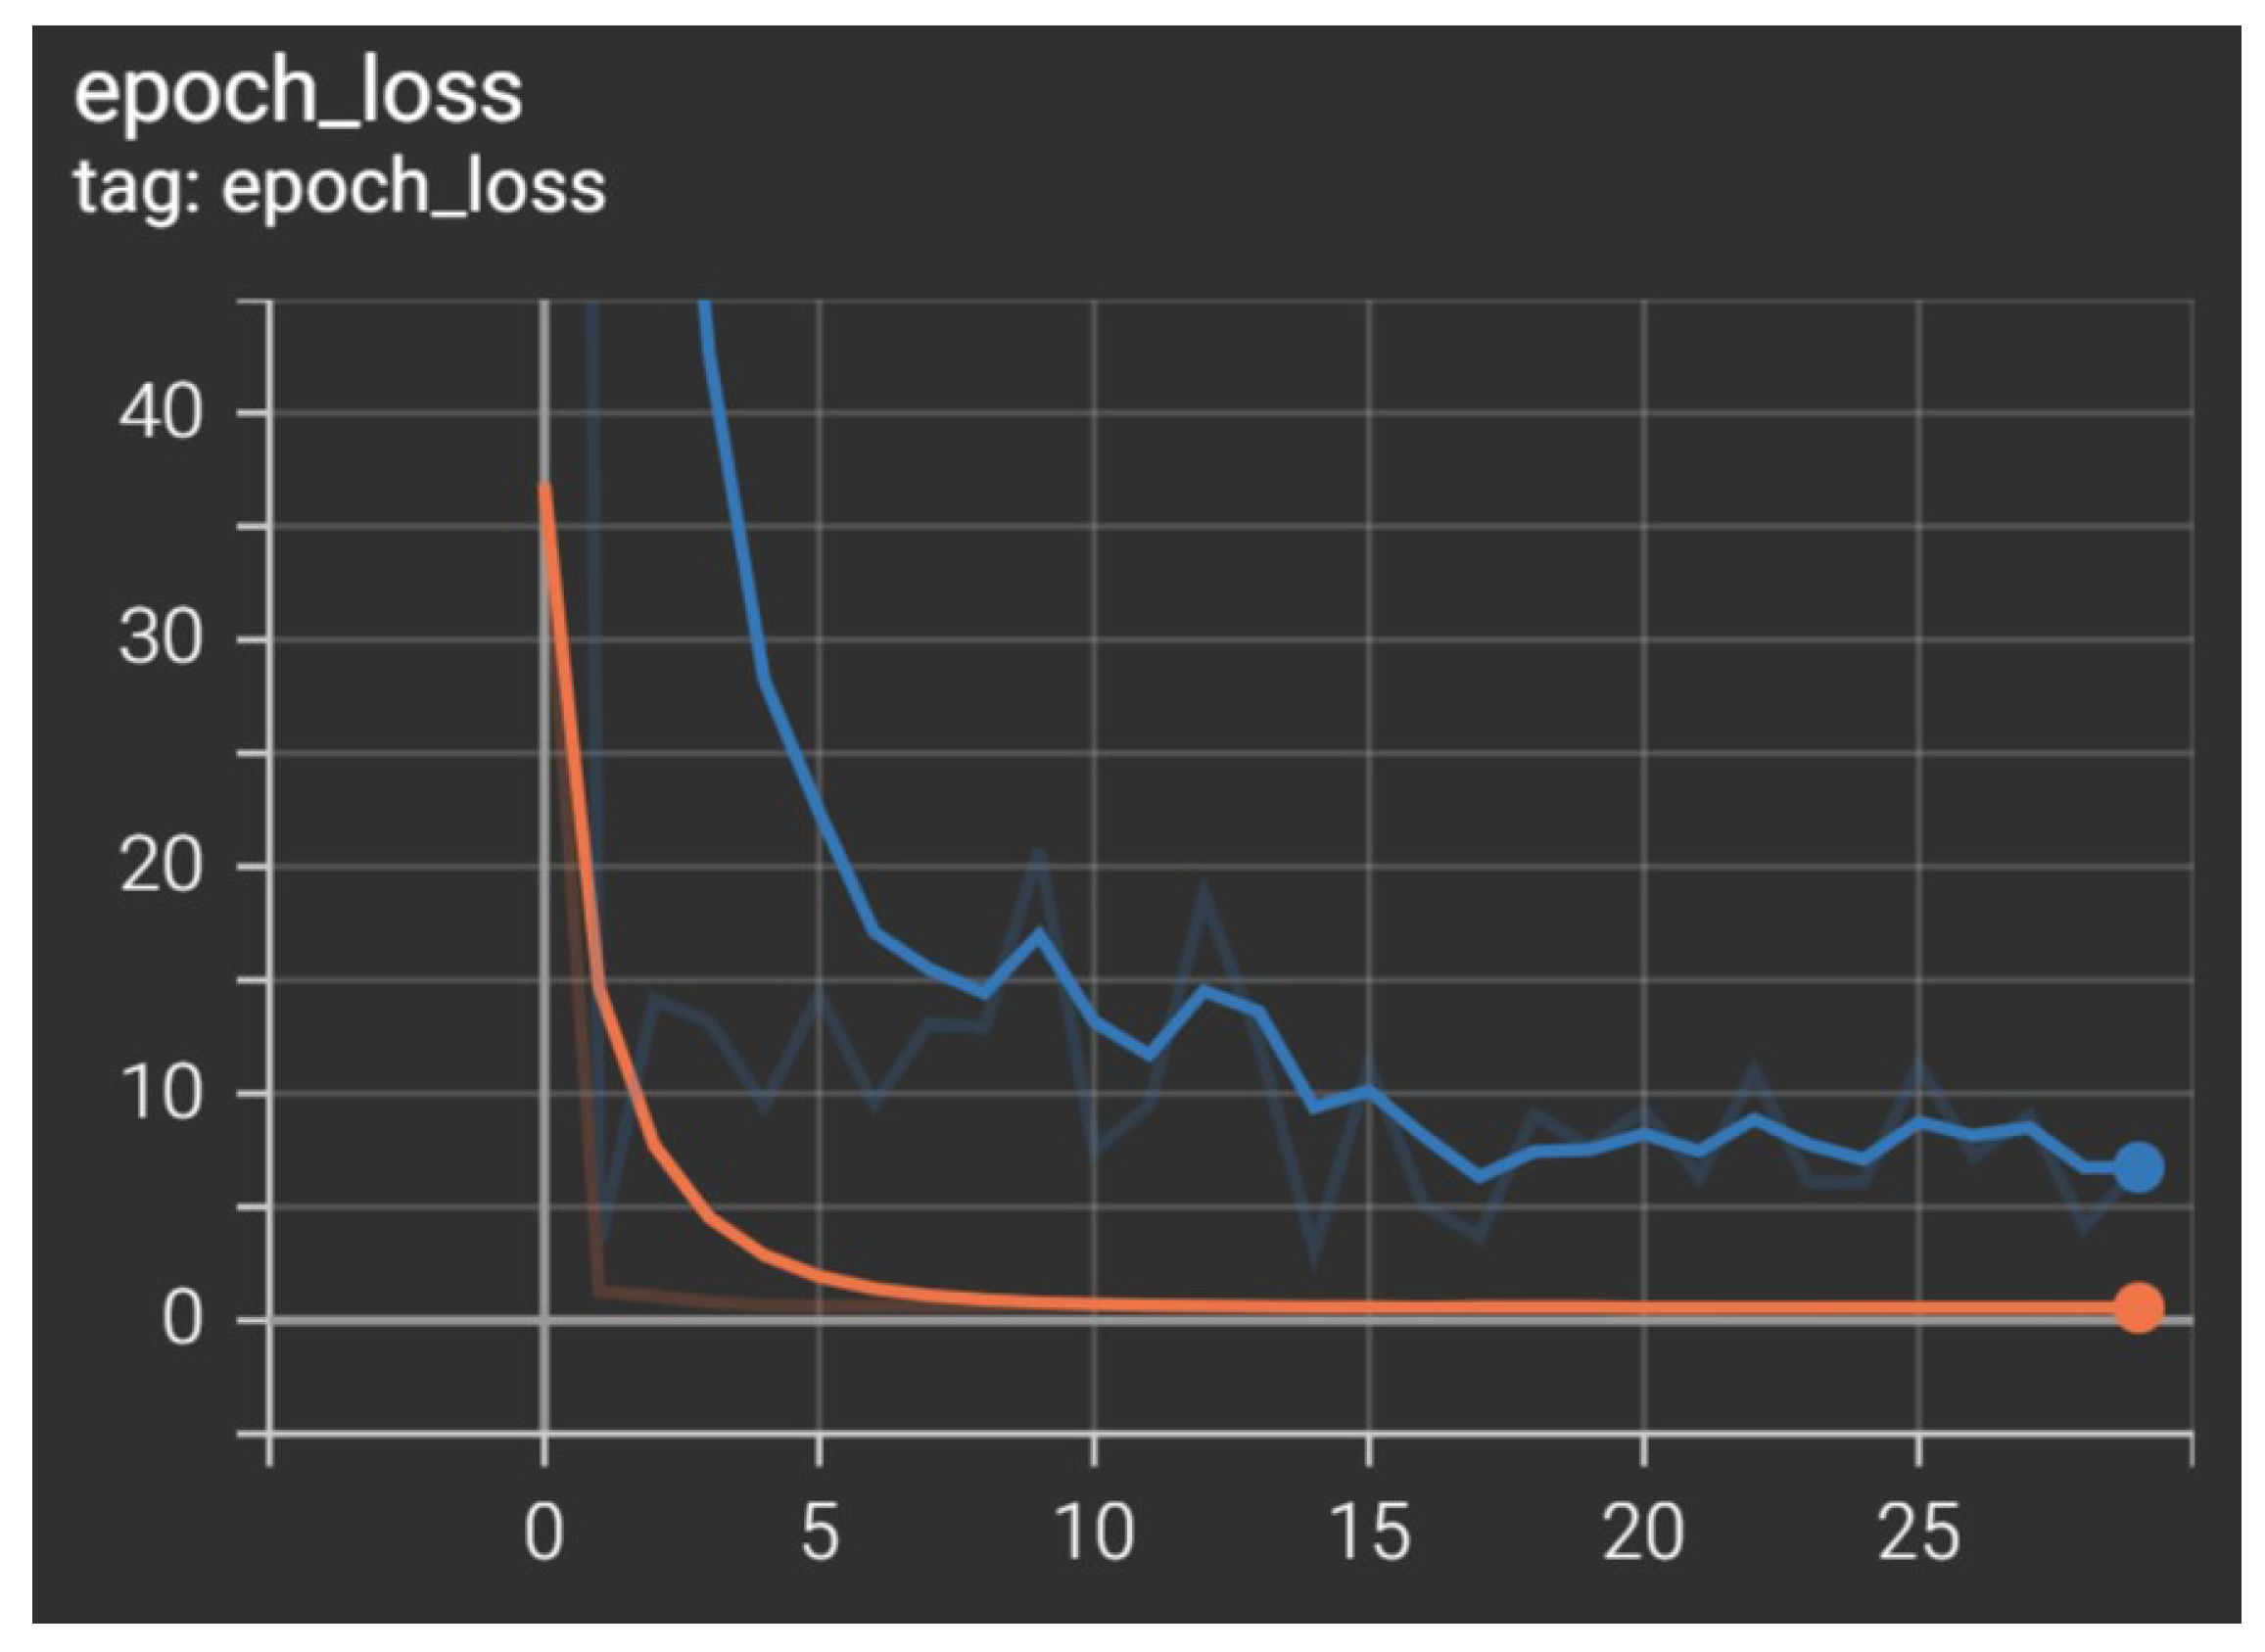
2.2.5. Experiments
3. Results
3.1. Assembly Line Improvement Project
- Cycle time: 658.8 s/pc.
- Real hours spent in the last year: 5654 h.
- Real hours spent in the last year for assembly activities only: 5019 h.
- Hours per piece allocated in non-assembly activities: (5654 − 5019) h/20,216 pc = 113.1 s/pc.
- Cycle time (assembly Takt time): 186.4 s/pc.
- Total time spent for assembling a piece: 186.4 s/pc ∗ 2 operators = 372.8 s/pc.
- Saving per piece: (658.8 − 372.8) s/pc = 286.0 s/pc.
- Total saving in current year: 286 s/pc ∗ 22,515 pc = 1789 h,
- Efficiency: 348 s/pc/372.8 s/pc = 93%.
- Productivity: 348 s/pc/(372.8 s/pc + 113.1 s/pc) = 72%
- Roller conveyors, interlocking structures complete with tool racks, structures for electronic screwdriver control units, and process support trolleys: 8000.
- Renewed piece holder boards for BF10: 5000 EUR.
- Layout modification, modifications to the electrical system and safe positioning of the manipulator: 3000 EUR.
3.2. Intelligent Poka Yoke Metrics and Expected Benefits
- Number of hours needed for new crankcases and lids designs, according to given requirements: between 960 and 1920 h.
- Average cost of the engineering department: 50 EUR/h.
- Expected redesign cost: [50 EUR/h ∗ 960 h = 48,000 EUR; 50 EUR/h ∗ 1920 h = 96,000 EUR].
- Average expected redesign cost: 72,000 EUR.
- New moulds cost: not considered.
- Tests cost: not considered.
- Expected hours needed for data acquisition, implementation and validation: 480 h;
- Average cost of the engineering department: 50 EUR/h.
- Expected redesign cost: 50 EUR/h ∗ 480 h = 24,000 EUR.
- Camera vision system: 2000 EUR.
- Industrial computer: 1000 EUR.
- Additional electrical equipment: 200 EUR.
- Expected installation hours: 4 h.
- Average cost of maintenance department: 30 EUR/h.
- Expected installation cost: 30 EUR/h ∗ 4 h = 120 €.
4. Conclusions
Author Contributions
Funding
Institutional Review Board Statement
Informed Consent Statement
Data Availability Statement
Conflicts of Interest
References
- Shingo, S. Zero Quality Control: Source Inspection and the Poka-Yoke System; Productivity Press: Portland, OR, USA, 1986. [Google Scholar]
- Shingo, S. A Study of the Toyota Production System: From an Industrial Engineering Viewpoint; Routledge: London, UK, 2019. [Google Scholar] [CrossRef]
- Mayr, A.; Weigelt, M.; Kühl, A.; Grimm, S.; Erll, A.; Potzel, M.; Franke, J. Lean 4.0—A conceptual conjunction of lean management and Industry 4.0. Procedia CIRP 2018, 72, 622–628. [Google Scholar] [CrossRef]
- Anosike, A.; Alafropatis, K.; Garza-Reyes, J.A.; Kumar, A.; Luthra, S.; Rocha-Lona, L. Lean manufacturing and internet of things—A synergetic or antagonist relationship? Comput. Ind. 2021, 129, 103464. [Google Scholar] [CrossRef]
- Akella, P. Intelligent Poka Yoke: When Lean Manufacturing Meets Deep Learning. 2018. Available online: https://www.industryweek.com/technology-and-iiot/article/22025815/ (accessed on 30 September 2022).
- Ho, P.T.; Albajez, J.A.; Yagüe, J.A.; Santolaria, J. Preliminary study of Augmented Reality based manufacturing for further integration of Quality Control 4.0 supported by metrology. IOP Conf. Ser. Mater. Sci. Eng. 2021, 1193, 012105. [Google Scholar] [CrossRef]
- Kothuru, A.; Nooka, S.P.; Liu, R. Application of deep visualization in CNN-based tool condition monitoring for end milling. Procedia Manufact. 2019, 34, 995–1004. [Google Scholar] [CrossRef]
- Zabiński, T.; Maoczka, T.; Kluska, J.; Madera, M.; Sȩp, J. Condition monitoring in Industry 4.0 production systems—The idea of computational intelligence methods application. Procedia CIRP 2019, 79, 63–67. [Google Scholar] [CrossRef]
- Muharam, M.; Latif, M. Design of poka-yoke system based on fuzzy neural network for rotary-machinery monitoring. IOP Conf. Ser. Mater. Sci. Eng. 2019, 602, 012003. [Google Scholar] [CrossRef] [Green Version]
- Romero, D.; Gaiardelli, P.; Powell, D.; Wuest, T.; Thürer, M. Rethinking jidoka systems under automation & learning perspectives in the digital lean manufacturing world. IFAC-PapersOnLine 2019, 52, 899–903. [Google Scholar] [CrossRef]
- Longo, F.; Nicoletti, L.; Padovano, A.; Bruzzone, A.; Mirabelli, G. Improving data consistency in Industry 4.0: An application of digital lean to the maintenance record process. In Proceedings of the European Modeling & Simulation Symposium, Lisbon, Portugal, 18–20 September 2019; pp. 384–389. [Google Scholar] [CrossRef]
- Schaede, C.; Seifermann, S.; Metternich, J. Automated generation of CNC programs for manufacturing of individualized products. Procedia CIRP 2018, 72, 1251–1257. [Google Scholar] [CrossRef]
- García-Garza, M.A.; Ahuett-Garza, H.; Lopez, M.G.; Orta-Castañón, P.; Kurfess, T.R.; Coronado, P.D.; Güemes-Castorena, D.; Villa, S.G.; Salinas, S. A case about the upgrade of manufacturing equipment for insertion into an industry 4.0 environment. Sensors 2019, 19, 3304. [Google Scholar] [CrossRef] [Green Version]
- Zhu, Z.; Peng, G.; Chen, Y.; Gao, H. A convolutional neural network based on a capsule network with strong generalization for bearing fault diagnosis. Neurocomputing 2019, 323, 62–75. [Google Scholar] [CrossRef]
- Wen, L.; Gao, L.; Li, X.; Wang, L.; Zhu, J. A Jointed Signal Analysis and Convolutional Neural Network Method for Fault Diagnosis. Procedia CIRP 2018, 72, 1084–1087. [Google Scholar] [CrossRef]
- Li, Y.; Wu, T.; Han, Y.; Chen, P. Recognition of incorrect assembly of internal components by X-ray CT and deep learning. Nuclear Instrum. Methods Phys. Res. Sect. A Accelerators Spectr. Detect. Assoc. Equip. 2019, 920, 88–94. [Google Scholar] [CrossRef]
- Sproch, F.; Nevima, J. Use of SMART 3D printing technology in conventional engineering production to detect and prevent the occurence of defects. MM Sci. J. 2021, 2021, 5441–5447. [Google Scholar] [CrossRef]
- Canizo, M.; Triguero, I.; Conde, A.; Onieva, E. Multi-head CNN–RNN for multi-time series anomaly detection: An industrial case study. Neurocomputing 2019, 363, 246–260. [Google Scholar] [CrossRef]
- Zhang, B.; Liu, S.; Shin, Y.C. In-Process monitoring of porosity during laser additive manufacturing process. Addit. Manufact. 2019, 28, 497–505. [Google Scholar] [CrossRef]
- Gao, X.; Wang, L.; Chen, Z.; Zhang, Y.; You, D. Process stability analysis and weld formation evaluation during disk laser–mag hybrid welding. Opt. Lasers Eng. 2020, 124, 105835. [Google Scholar] [CrossRef]
- Zhang, Z.; Wen, G.; Chen, S. Weld image deep learning-based on-line defects detection using convolutional neural networks for Al alloy in robotic arc welding. J. Manufact. Process. 2019, 45, 208–216. [Google Scholar] [CrossRef]
- Huang, B.P.; Chen, J.C.; Li, Y. Artificial-neural-networks-based surface roughness Pokayoke system for end-milling operations. Neurocomputing 2008, 71, 544–549. [Google Scholar] [CrossRef]
- Zhang, J.Z. Development of an in-process Pokayoke system utilizing accelerometer and logistic regression modeling for monitoring injection molding flash. Int. J. Adv. Manufact. Technol. 2014, 71, 1793–1800. [Google Scholar] [CrossRef]
- Mura, M.D.; Dini, G.; Failli, F. An Integrated Environment Based on Augmented Reality and Sensing Device for Manual Assembly Workstations. Procedia CIRP 2016, 41, 340–345. [Google Scholar] [CrossRef] [Green Version]
- Kucukoglu, I.; Atici-Ulusu, H.; Gunduz, T.; Tokcalar, O. Application of the artificial neural network method to detect defective assembling processes by using a wearable technology. J. Manufact. Syst. 2018, 49, 163–171. [Google Scholar] [CrossRef]
- Nithyanandam, G.K.; Kothandaraman, P.K.; Munguia, J.; Marimuthu, M. Implementing Marked-Based Augmented Reality in Discrete industry—A Case Study. In Proceedings of the 2020 IEEE-HYDCON International Conference on Engineering in the 4th Industrial Revolution, Hyderabad, India, 11–12 September 2020. [Google Scholar] [CrossRef]
- Belu, N.; Ionescu, L.M.; Misztal, A.; Mazăre, A. Poka Yoke system based on image analysis and object recognition. IOP Conf. Ser. Mater. Sci. Eng. 2015, 95, 012138. [Google Scholar] [CrossRef] [Green Version]
- Wiech, M.; Böllhoff, J.; Metternich, J. Development of an Optical Object Detection Solution for Defect Prevention in a Learning Factory. Procedia Manufact. 2017, 9, 190–197. [Google Scholar] [CrossRef]
- Fernando, H.; Surgenor, B. An unsupervised artificial neural network versus a rule-based approach for fault detection and identification in an automated assembly machine. Robot. Comput.-Integr. Manufact. 2017, 43, 79–88. [Google Scholar] [CrossRef]
- Zamora-Hernández, M.A.; Castro-Vargas, J.A.; Azorin-Lopez, J.; Garcia-Rodriguez, J. Deep learning-based visual control assistant for assembly in Industry 4.0. Comput. Ind. 2021, 131, 103485. [Google Scholar] [CrossRef]
- Dănuţ-Sorin, I.R.; Opran, C.G.; Lamanna, G. Lean 4.0 Dynamic Tools for Polymeric Products Manufacturing in Industry 4.0. Macromol. Symp. 2021, 396, 2000316. [Google Scholar] [CrossRef]
- Hollnagel, E. Barriers and Accident Prevention; Routledge: London, UK, 2016; p. 242. [Google Scholar]
- Saurin, T.A.; Ribeiro, J.L.D.; Vidor, G. A framework for assessing poka-yoke devices. J. Manufact. Syst. 2012, 31, 358–366. [Google Scholar] [CrossRef]
- Goodfellow, I.; Bengio, Y.; Courville, A. Deep Learning; MIT Press: Cambridge, MA, USA, 2015. [Google Scholar]
- Tjahjono, B.; Ball, P.; Vitanov, V.I.; Scorzafave, C.; Nogueira, J.; Calleja, J.; Minguet, M.; Narasimha, L.; Rivas, A.; Srivastava, A.; et al. Six sigma: A literature review. Int. J. Lean Six Sigma 2010, 1, 216–233. [Google Scholar] [CrossRef]
- Antony, J.; McDermott, O.; Powell, D.; Sony, M. The evolution and future of lean Six Sigma 4.0. TQM J. 2022; ahead-of-print. [Google Scholar] [CrossRef]
- Calabrese, A.; Dora, M.; Ghiron, N.L.; Tiburzi, L. Industry’s 4.0 transformation process: How to start, where to aim, what to be aware of. Produc. Plan. Control 2020, 33, 492–512. [Google Scholar] [CrossRef]
- Antony, J.; McDermott, O.; Powell, D.J.; Sony, M. Mapping the Terrain for Lean Six Sigma 4.0. IFIP Adv. Inf. Commun. Technol. 2021, 610, 193–204. [Google Scholar] [CrossRef]


| Reference | Sensors | DP | P/R | P/F/S | HIL | Cost |
|---|---|---|---|---|---|---|
| [7] | Microphone | CNN | R | S | No | Low |
| [13] | Microphone | CNN | R | S | No | Low |
| [8] | Accelerometer | CNN | R | S | No | Med |
| [14] | Vibration | RNN+CNN | R | S | N/A | Low |
| [15] | Vibration | RNN+CNN | R | S | N/A | Low |
| [18] | 20 different sensors | RNN+CNN | R | S | No | High |
| [19] | 395fps camera | CNN | R | S | No | Med |
| [20] | 2000fps camera | Gabor Filters | R | S | No | Med |
| [21] | Modified camera + ad hoc mirrors | CNN | R | S | No | High |
| [22] | Vibration | CNN | P | F | No | Low |
| [23] | Accelerometer | RegLog | P | F | No | Low |
| [24] | AR + force sensors + cameras | N/A | R | S | Yes | High |
| [25] | Wearable vibration + force sensors | ANN | R | S | Yes | High |
| [27] | Camera | Hopfield RNN | R | S | No | Med |
| [28] | RaspberryPi and camera | Similarity Index | R | S | No | Low |
| [29] | Grey scale and limit switches | ANN + Rules | R | S | No | Low |
| [16] | X-Ray Camera | CNN | R | S | No | Low |
| [30] | Camera | DNN and MDL | R | S | Yes | Med |
| [9] | Vibration | FNN | R | F | No | Med |
| [10] | Raspberry Pi and general hardware | Heterogeneous | R | N/A | Yes | Med |
| [11] | Existing + retrofitted | DB | R | S | Yes | Med |
| [12] | N/A | Decision tree | P | P | No | Med |
| [17] | N/A | CAD/CAM | R | P | Yes | Low |
| [26] | AR | N/A | P | S | Yes | High |
| [31] | IIoT | Agents | P | F | No | High |
| Our approach | Camera | CNN | P | P | Yes | Med |
| Conversion from planning to ODP | 1.30 min |
| ODP release | 1 min |
| ODP printing | 2 min |
| OT creation + OT printing | 1 min |
| Time for ODP and OT | 5.3 min/(ODP + OT) |
| Number of ODP and OT launched in the last year | 590 (ODP + OT) |
| Total time spent in the last year | 5.3 min/(ODP + OT) ∗ 590 (ODP + OT) = 3127 min |
| Average warehouse/line/warehouse crossing time for raw material handling and pre-assembly | 2.58 min/(ODP + OT) |
| Total average time for line supply and pre-assembled withdrawal in the last year | 1522.22 min |
| Average withdrawal time for each OT line | 7 min/line |
| Total number of pre-assembly picking lines in the last year | 6,742 lines |
| Average pick-up time pre-assembled | 47,194 min |
| Total time spent in the last year for logistical management of pre-assembly | 51,843.2 min = 864 h |
| Correct | Reverse | Absent | |
|---|---|---|---|
| Correct | 146 | 0 | 4 |
| Reverse | 0 | 150 | 0 |
| Absent | 2 | 0 | 199 |
Publisher’s Note: MDPI stays neutral with regard to jurisdictional claims in published maps and institutional affiliations. |
© 2022 by the authors. Licensee MDPI, Basel, Switzerland. This article is an open access article distributed under the terms and conditions of the Creative Commons Attribution (CC BY) license (https://creativecommons.org/licenses/by/4.0/).
Share and Cite
Martinelli, M.; Lippi, M.; Gamberini, R. Poka Yoke Meets Deep Learning: A Proof of Concept for an Assembly Line Application. Appl. Sci. 2022, 12, 11071. https://doi.org/10.3390/app122111071
Martinelli M, Lippi M, Gamberini R. Poka Yoke Meets Deep Learning: A Proof of Concept for an Assembly Line Application. Applied Sciences. 2022; 12(21):11071. https://doi.org/10.3390/app122111071
Chicago/Turabian StyleMartinelli, Matteo, Marco Lippi, and Rita Gamberini. 2022. "Poka Yoke Meets Deep Learning: A Proof of Concept for an Assembly Line Application" Applied Sciences 12, no. 21: 11071. https://doi.org/10.3390/app122111071