Article

High Performance IoT Cloud Computing Framework Using Pub/Sub Techniques

1
Department of Information and Communication Engineering, Chungbuk National University, Cheongju 28644, Korea
2
Division of Software, Yonsei University, Seoul 26493, Korea
*
Author to whom correspondence should be addressed.
Appl. Sci. 2022, 12(21), 11009; https://doi.org/10.3390/app122111009
Submission received: 6 September 2022 / Revised: 12 October 2022 / Accepted: 19 October 2022 / Published: 30 October 2022

Abstract

:
The Internet of Things is attracting attention as a solution to rural sustainability crises, such as slowing income, exports, and growth rates due to the aging of industries. To develop a high-performance IoT platform, we designed and implemented an IoT cloud platform using pub/sub technologies. This design reduces the difficulty of overhead for management and communication, despite the harsh IoT environment. In this study, we achieved high performance by applying the pub/sub platform with two different characteristics. As the size and frequency of data acquired from IoT nodes increase, we improved performance through MQTT and Kafka protocols and multiple server architecture. MQTT was applied for fast processing of small data, and Kafka was applied for reliable processing of large data. We also mounted various sensors and actuators to measure the data of growth for each device using the protocol. For example, DHT11, MAX30102, WK-ADB-K07-19, SG-90, and so on. As a result of performance evaluation, the MQTT Kafka platform implemented in this research was found to be effective for use in environments where network bandwidth is limited or a large amount of data is continuously transmitted and received. We realized the performance as follows: the response time for user requests was measured to be within 100 ms on average, data transmission order verification for more than 13 million requests, data processing performance per second on an average of 113,134.89 record/s, and 64,313 requests per second were performed for requests that occurred simultaneously from multiple clients.

1. Introduction

Most Internet of Things (IoT) companies incorporate various IoT framework technologies to transmit and receive real-time data from sensors and manage them. They can be used to assess and control variables such as temperature, humidity, vibrations, or shocks during product transport [1]. Therefore, the application of the IoT in various sectors, especially in the manufacturing execution system field, can impact resource efficiency and significantly improve production capacity. However, several challenges need to be addressed to adopt IoT [2]. One of the challenges is processing and analyzing vast amounts of data coming from heterogeneous devices [3]. Furthermore, processing all these collected data directly to a central server is inefficient and sometimes impractical due to limited computing, communication, and storage resources, overall energy and cost, and unreliable latency. To address these challenges, here we introduce the concept of an IoT cloud platform, where data processing tasks are pushed to the IoT Cloud. There are two major elements of the platform implemented in this research: Message Queueing Telemetry Transport (MQTT) and Apache Kafka. The MQTT broker is responsible for exchanging messages between various sensors and actuators in the IoT. Kafka reliably sends large amounts of data generated in the IoT to consumers. In this work, we used MQTT and Kafka together to take full advantage of the different characteristics of these platforms. To transmit small data with high latency, we used MQTT. The Kafka platform was used to transmit images and videos captured by cameras such as CCTV installed in IoT facilities.
The rest of the paper is structured as follows. In Section 2, we discuss background and related work in this field. In Section 3, we present the proposed methodology. In Section 4, we describe the performance evaluation of the proposed system. Finally, we present the conclusions of our research in Section 5.

2. Background and Related Works

MQTT is an Organization for the Advancement of Structured Information Standards (OASIS) standard messaging protocol for the Internet of Things (IoT) [4]. It is designed as an extremely lightweight publish/subscribe messaging transport that is ideal for connecting remote devices with a small code footprint and minimal network bandwidth. The MQTT is a protocol to publish/subscribe messaging transport protocols designed to be open, simple, and easy for clients to implement. These characteristics are used in many contexts, including limited environments such as machine-to-machine (M2M) communications and the Internet of Things (IoT) [5]. Today, MQTT is used in a wide variety of industries, such as automotives, manufacturing, telecommunications, oil, gas, etc. [6].
Apache Kafka is an open-source distributed event streaming platform for high-performance data pipelines, streaming analytics, data integration, and mission-critical applications. It provides a publish/subscribe messaging model for data production and consumption and supports the ability to access data in real-time for stream processing by allowing long-term storage of data [7,8]. Kafka was designed from the ground up to provide long-term data storage and data replay. Apache Kafka has a unique approach to data persistence, fault tolerance, and replay [9]. Therefore, this can be seen in how it handles scalability by allowing data access using cross-partition data sharing, topics/partitions, data offsets, and consumer group names for data replication persistence in clusters, increased data volume, and load. Apache Kafka is also well suited for real-time stream processing applications because it is designed to act as a communication layer for real-time log processing. This makes Apache Kafka suitable for applications running on communications infrastructure that process large amounts of data in real-time.
Reliability of message delivery is important for many IoT use cases [10]. Therefore, MQTT has three defined quality of service (QoS) levels: 0—at most once, 1—at least once, and 2—exactly once. The QoS refers to a level that guarantees the quality of service. An appropriate QoS level should be selected according to the type of service. In this study, the QoS level was set to 0 because speed is prioritized over the reliability of data generated by sensors.
Our research work is based on the IoT cloud-based framework structure. In the process of designing the system structure, we gained considerable insight from the overall concept and structure presented in the review paper [11,12,13]. The paper focuses on providing a comprehensive overview of what the IoT cloud is as well as the most relevant use cases, tradeoffs, and implementation considerations.

3. Computing Platform Using MQTT and Kafka

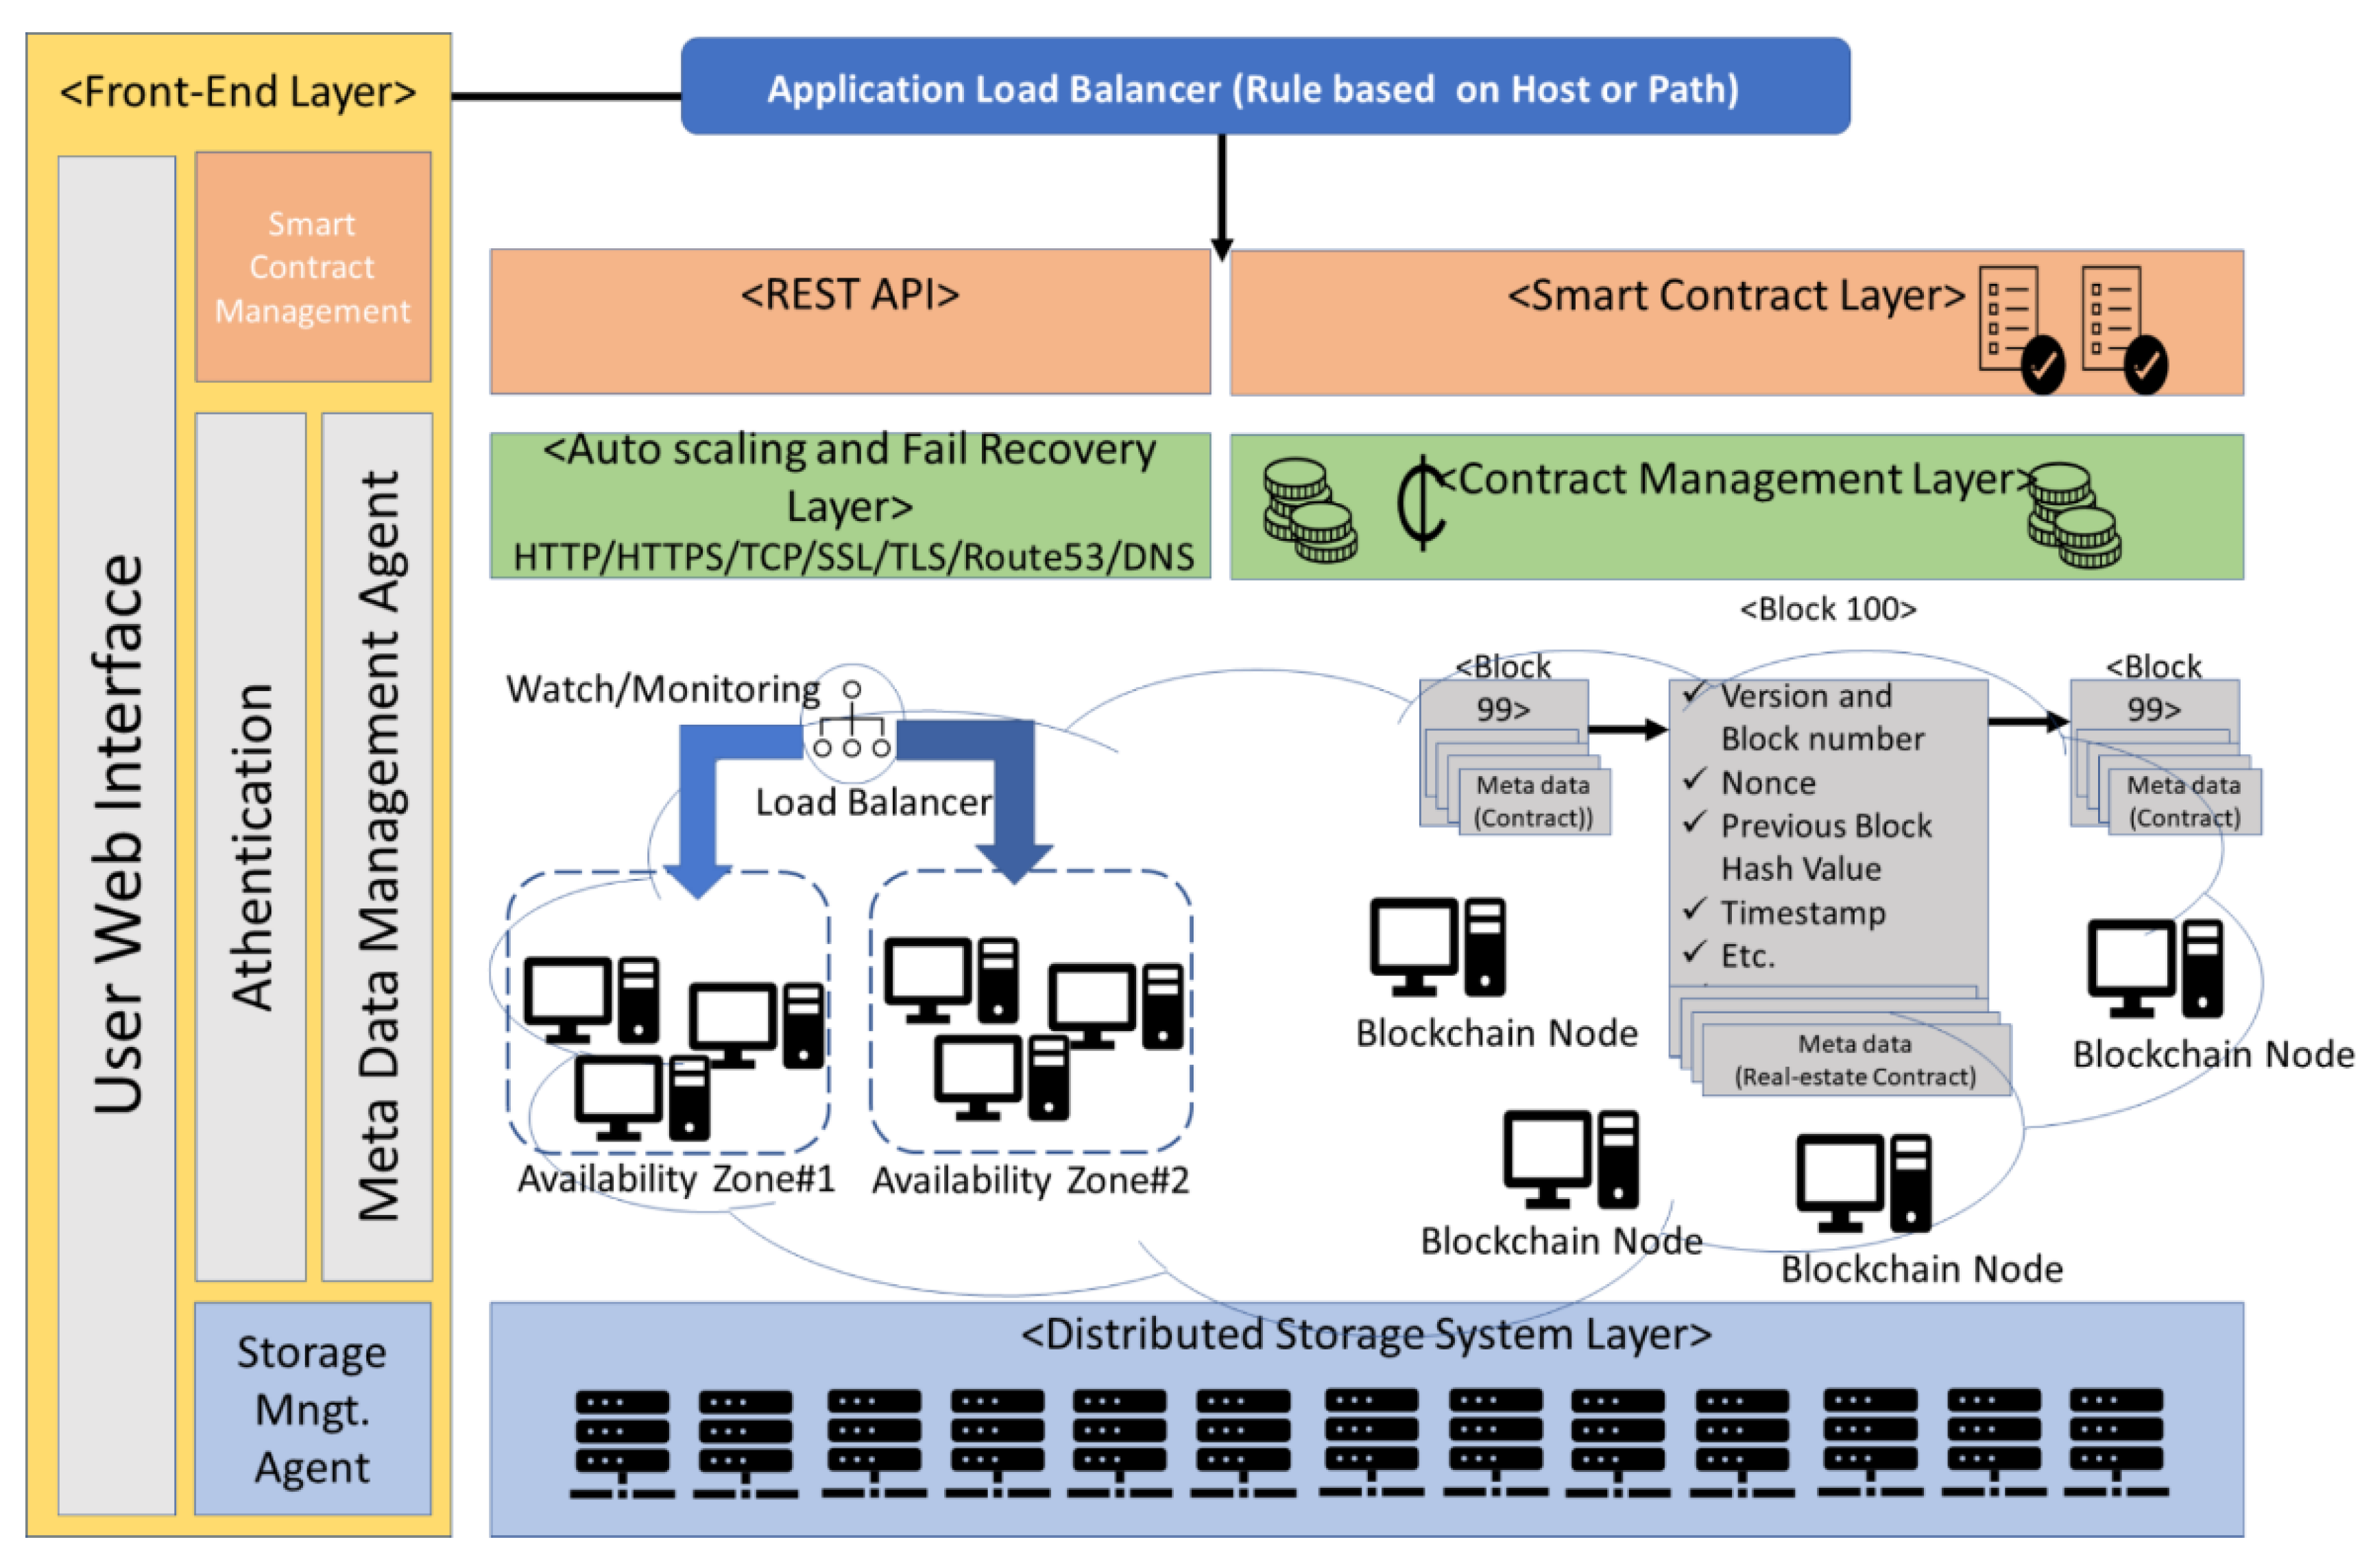
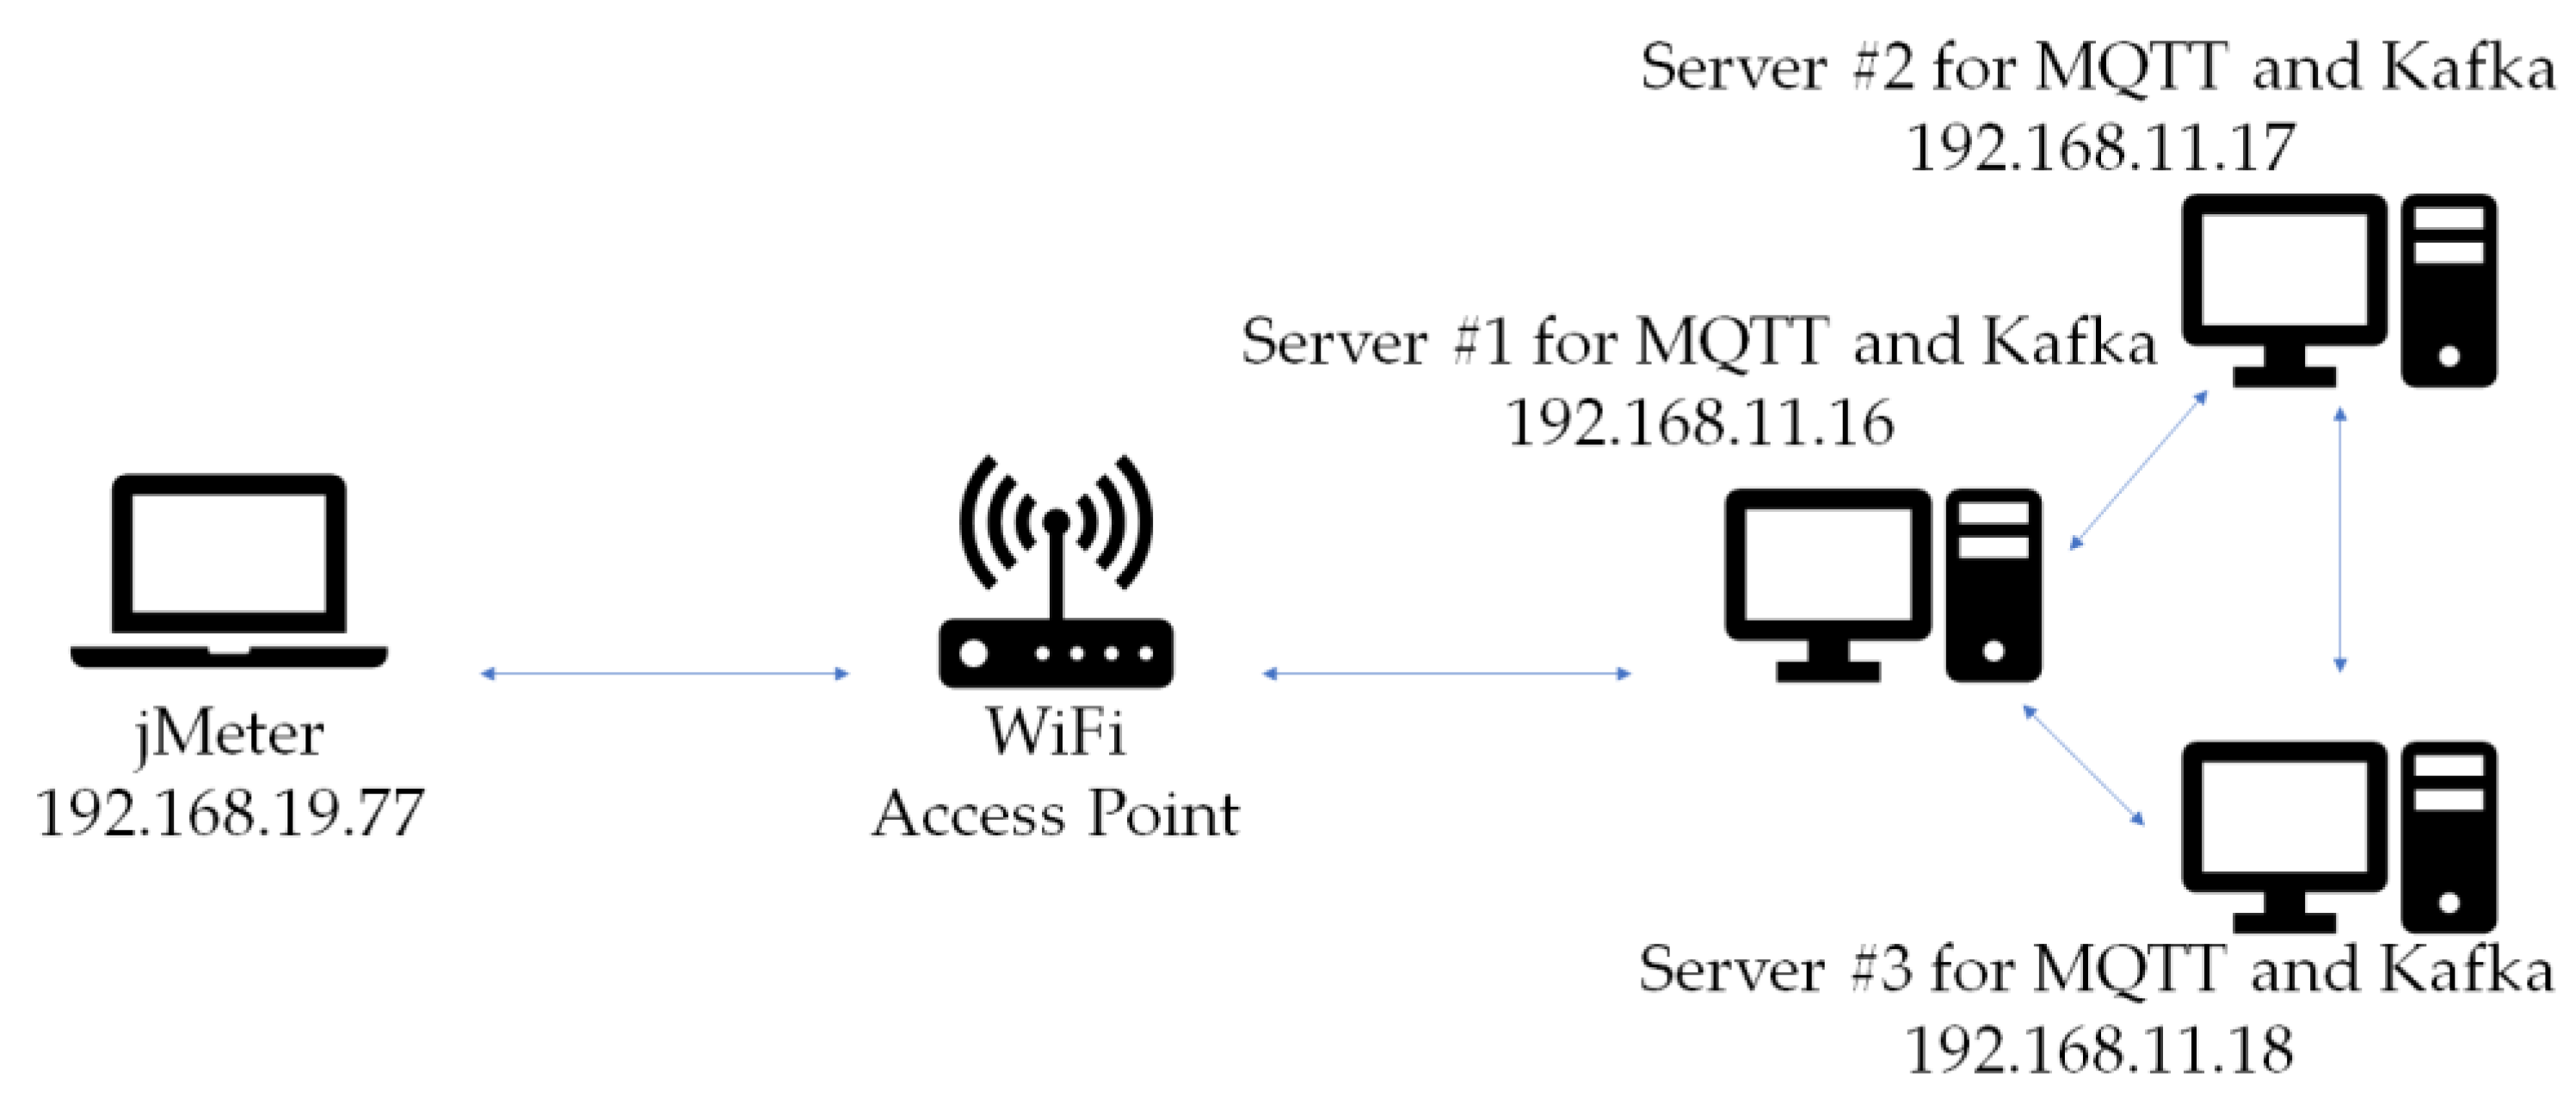
3.1. Overall System Architecture

The overall system architecture mainly consisted of several elements, as shown in Figure 1. First, the sensor installed on the IoT node and the cloud/cluster application responsible for the sensor device are required. Second, an MQTT broker collects data acquired from an IoT node and transmits it to the computing platform. Based on the publish/subscribe model, an MQTT broker maintains multiple subscribers, each of which is subscribed to a particular topic, and forwards the data as they are received. Third, the cloud platform in this research served to connect the MQTT and Kafka protocols.
It plays a key role in reducing the burden on IoT devices in charge of sensors by placing the device serving as the corresponding platform physically close to the IoT. The fourth is the Kafka cluster. Kafka clusters communicate using the Kafka protocol. Like MQTT, it uses a pub/sub model and serves to stream large amounts of continuous data from sensors based on events. Finally, a web frontend visualizing the Kafka data is implemented using ThingsBoard [12], which is basically an IoT dashboard platform but was customized in this research. During data processing, we used MongoDB to store data. MongoDB is a document-based database engine that can store and retrieve unstructured data without schema as it is in JSON format, so it is very conveniently used in web-related fields. Since we initially created the data in JSON format in this project, we applied it for convenience.
The whole system consists of an IoT cloud with multiple MQTT clients and multiple nodes, as shown in Figure 2. Each client connects to the IoT cloud platform to send and receive data. The IoT cloud node is mainly composed of two components: the MQTT component and the Kafka server. The MQTT component is a broker and subscriber to the MQTT protocol. This allows for immediate data transfer as well as other operations after receiving the data. In this research, specific data is sent to Kafka after receiving data from a component for reliable data storage and transmission. The data generated by the sensor is processed by Node-MCU and sent to the MQTT broker. The broker then sends it to an IoT cloud platform with multiple subscribers. The platform internally switches from the MQTT protocol to the Kafka protocol and sends it to the Kafka cluster. After receiving data from the Kafka cluster, it forwards the received data to multiple consumers.
Figure 3 depicts the interaction sequence among the components that make up this system. We achieved reliable and high-performance machine-independent interactions using pub/sub technology and the REST API, providing services to multiple users at the same time by managing sessions for each user.
In order to make a highly scalable structure designed to respond to numerous user requests, we applied a scalable computing architecture, including elastic computing nodes, distributed storage, and load balancing, such as ALB and ELB. All peer nodes are responsible for the storage of transactions, smart contracts, and various states, and there is a tendency to waste in terms of costs such as storage space required for continuous operation.
In terms of the data acquisition approach, we tried to simulate an IoT cloud platform implemented using some IoT elements. Most IoT applications use the Raspberry Pi series because of its cheapness and powerful performance. So, we also used a Raspberry Pi to configure the IoT cloud node in this research. It is designed to lower the barrier to entry when applied in real agriculture using the Raspberry. The MLX90614 is an infrared thermometer for non-contact temperature measurements. Both the IR-sensitive thermopile detector chip and the signal conditioning ASIC are integrated [12]. MLX90614 is a low-noise amplifier, 17-bit ADC, powerful DSP unit, and achieves a high accuracy and resolution of the thermometer. The address for accessing information about a certain device is shown in Table 1. Ta is the ambient temperature of the object. TOBJ1 and TOBJ2 are the temperatures of the objects. The result has a resolution of 0.02C and is available in RAM.
The temperature information obtained from the MLX90614 accumulates the information in a database and is communicated to multiple users of that temperature through an IoT cloud platform. Real-time temperature information is displayed to the web service user, and the actuator operates according to the temperature.
In practice, several types of actuators are used. The role of this actuator is assumed to be an SG90 servo motor. The SG90 is a tiny and lightweight server motor with high output power [13]. The servo motor can rotate approximately 180 degrees (90 in each direction) and works just like the standard kinds, but is smaller. Servo motors provide feedback on whether the data obtained from the sensor is being processed properly.
Each piece of hardware introduced above operates on an independent IoT device and communicates with IoT nodes using the MQTT protocol, which is relatively lightweight compared to HTTP. Each piece of hardware interacts with the IoT cloud platform and exchanges large amounts of data. Each sensor is not interconnected and operates through the platform. This means that data can be processed efficiently without unnecessary communication.

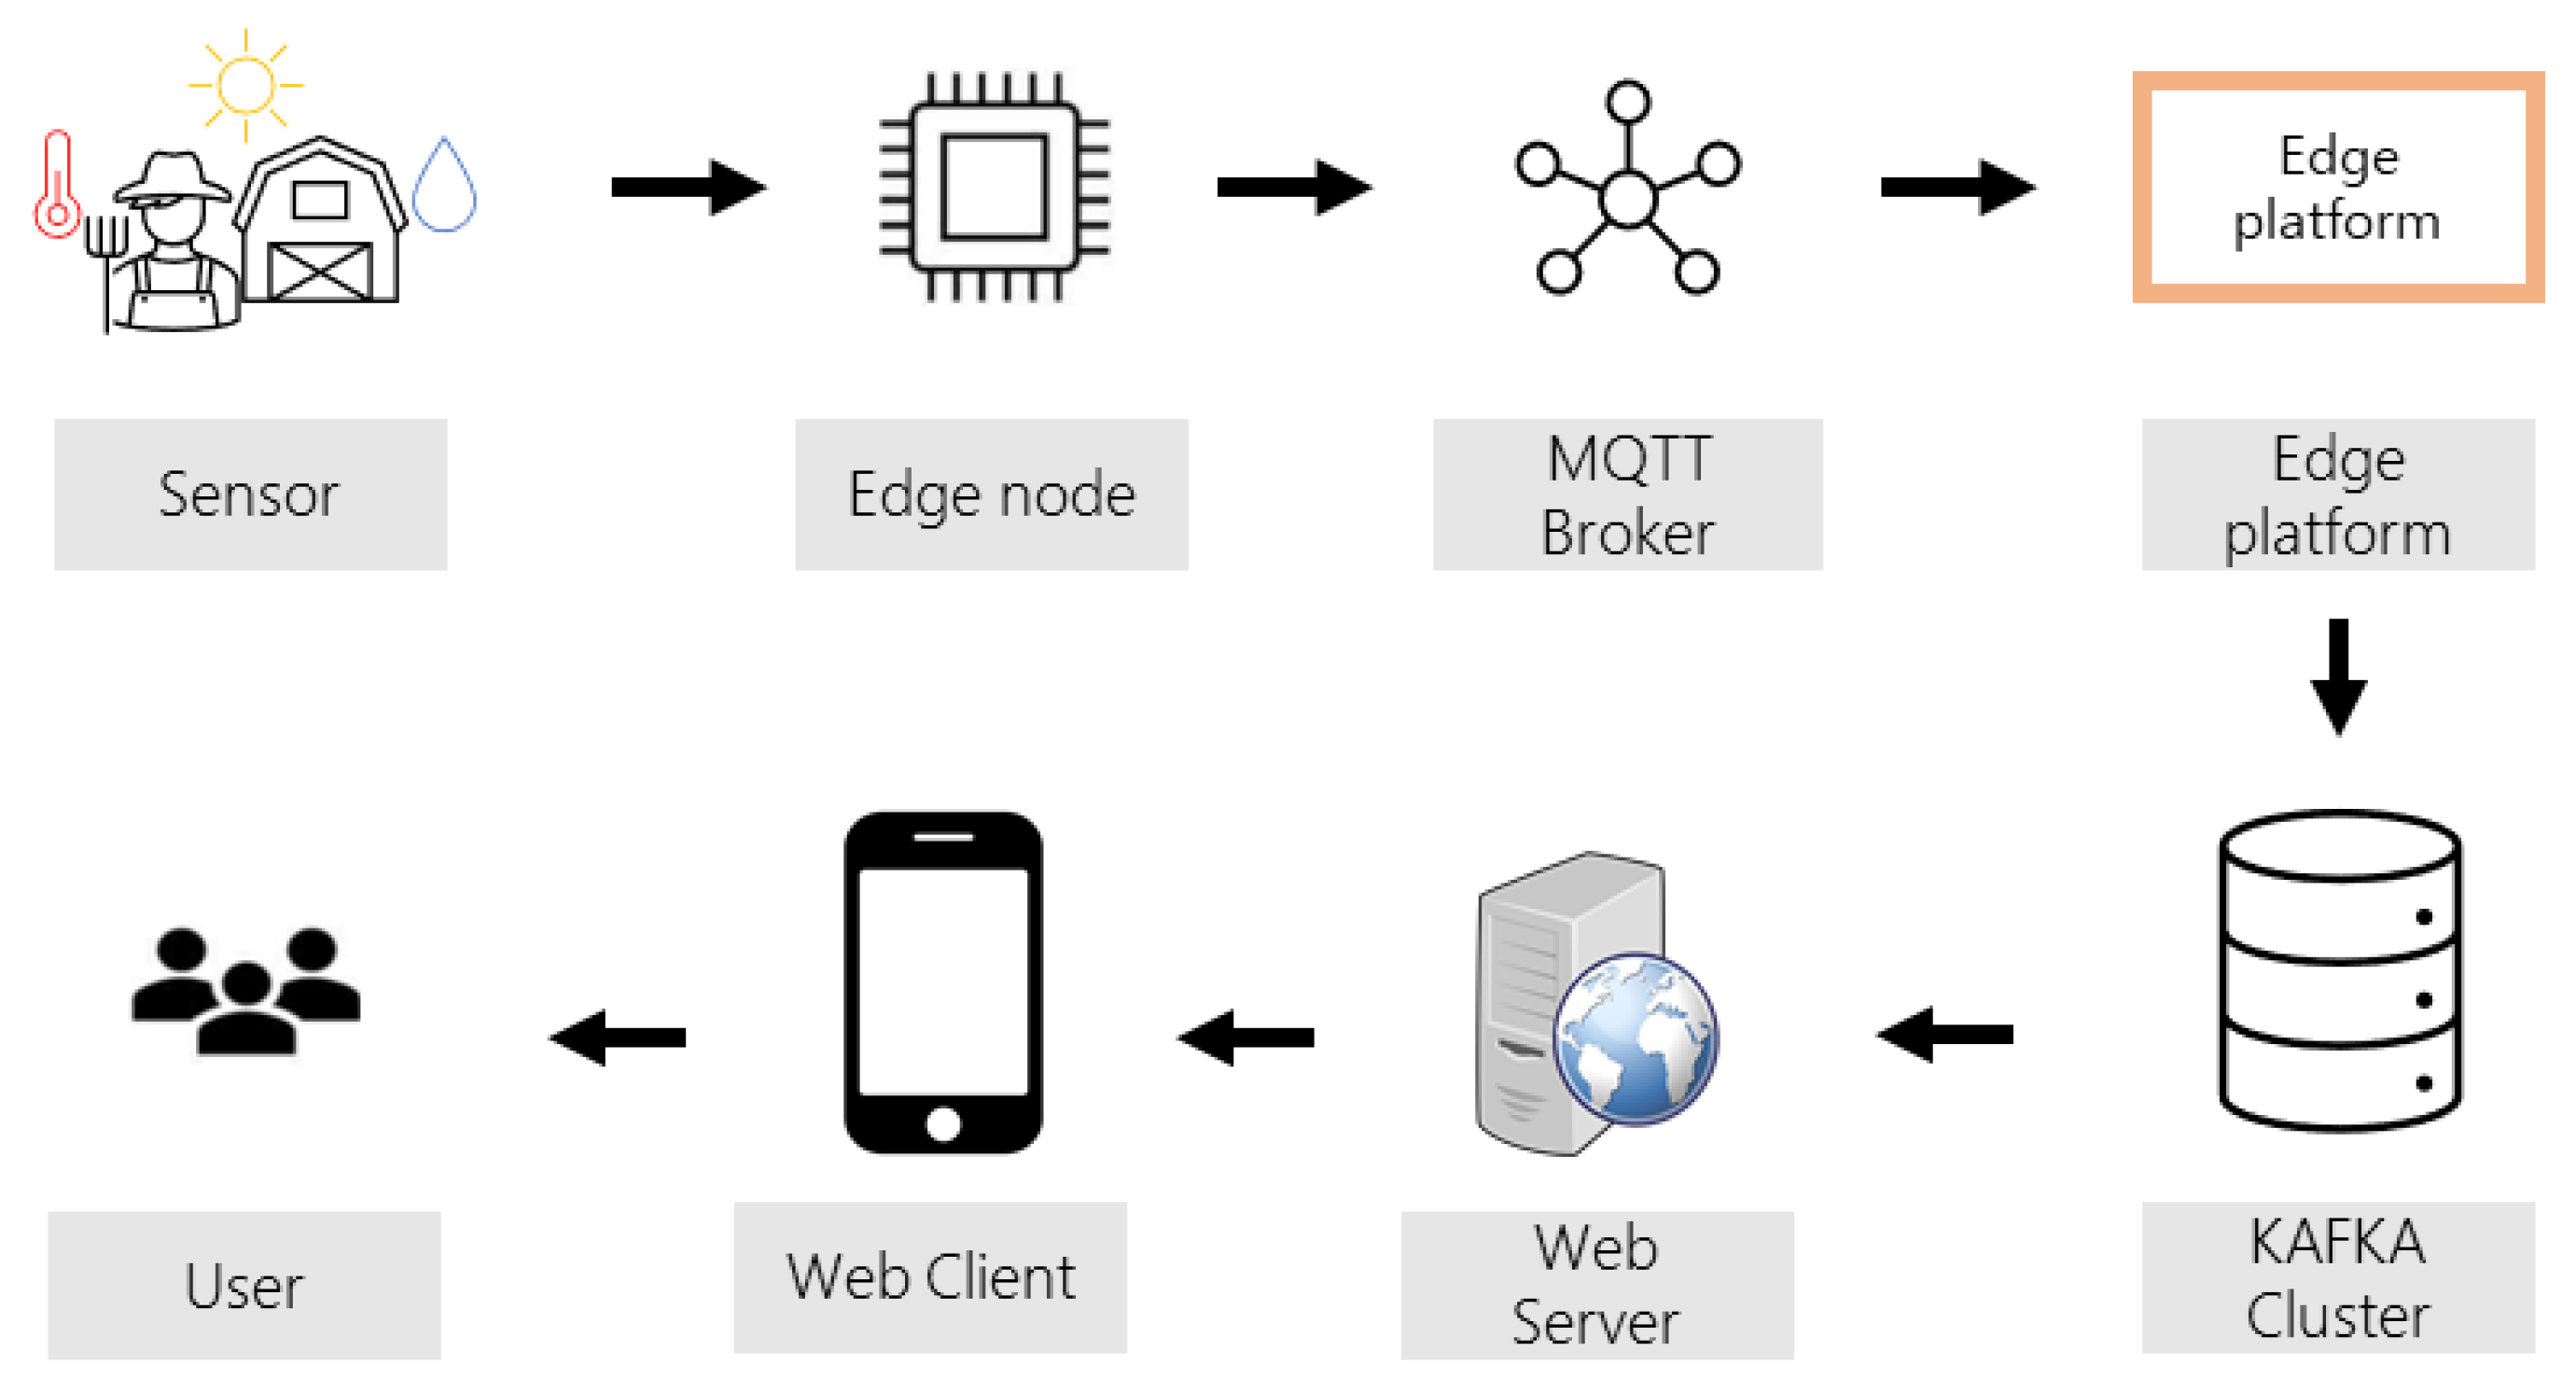
3.2. Data Processing Based on Publish and Subscribe Architecture

The MQTT protocol provides a lightweight method of carrying out messaging using a publish/subscribe model. This makes it suitable for Internet of Things messaging, such as with low-power sensors or mobile devices, such as phones, embedded computers, or microcontrollers [14]. Based on the publish/subscribe model, an MQTT broker remembers multiple components subscribed to a particular topic and forwards the data as it is received. The IoT cloud platform makes use of the MQTT and Kafka protocols. It plays a key role in reducing the burden on IoT devices. This is because the devices only serve the corresponding platform that is physically close to the IoT. Kafka clusters communicate using the Kafka protocol. Like MQTT, it uses a publish/subscribe model and serves to stream large amounts of continuous data from sensors. In this research, we provide a web-based dashboard platform for monitoring data configured using “ThingsBoard” [15,16]. The ThingsBoard is an open-source IoT dashboard [17] platform designed to store data in MongoDB [18,19].
After we collect sensor data generated from the sensor module located in AREA 1, the data are published to subscribers through the IoT cloud platform, as shown in Figure 4. The data are classified as an MQTT component by topic (classified by temperature, sunlight, rainfall, etc.).
Figure 5 shows that TOPIC-partitioned data is transmitted to the KAFKA cluster server and replicated to each broker in the cluster (each partition of the server). Every partition has one server that acts as the leader for all read/write operations within the server, and the other server acts as a follower of this leader. If a leader goes down or fails, by default, one of the followers on the other server is chosen as the new leader. Producers can generate specific messages going to selected partitions within a topic. Consumers can consume published messages based on topics. Messages are delivered to consumer instances within the subscribing consumer group.
In Figure 6, the TOPIC-partitioned data is transmitted to the server (KAFKA Cluster) and replicated to each broker in the cluster (each partition of the server). Afterward, at the request of the consumer group, each broker in the KAFKA cluster designed a system capable of distributing data and transmitting large amounts of data.
Data is increasingly produced at the level of the network. Therefore, it would be more efficient to also process the data at the level of the network. The IoT cloud platform eliminates bottlenecks and potential points of failure and enables rapid recovery from failures. The server in the IoT cloud performs functions for analysis and visualization of the collected time series data. In this way, the load on the server is reduced by dividing the roles according to the characteristics. It makes the server perform reliably in operation. For this reason, our platform aimed to reduce response time or latency by caching content [11]. The IoT cloud platform can be used wherever computing is used, such as location-based, Internet of Things (IoT), data caching, big data, and sensor monitoring activity spaces, mobile cloud, and others.

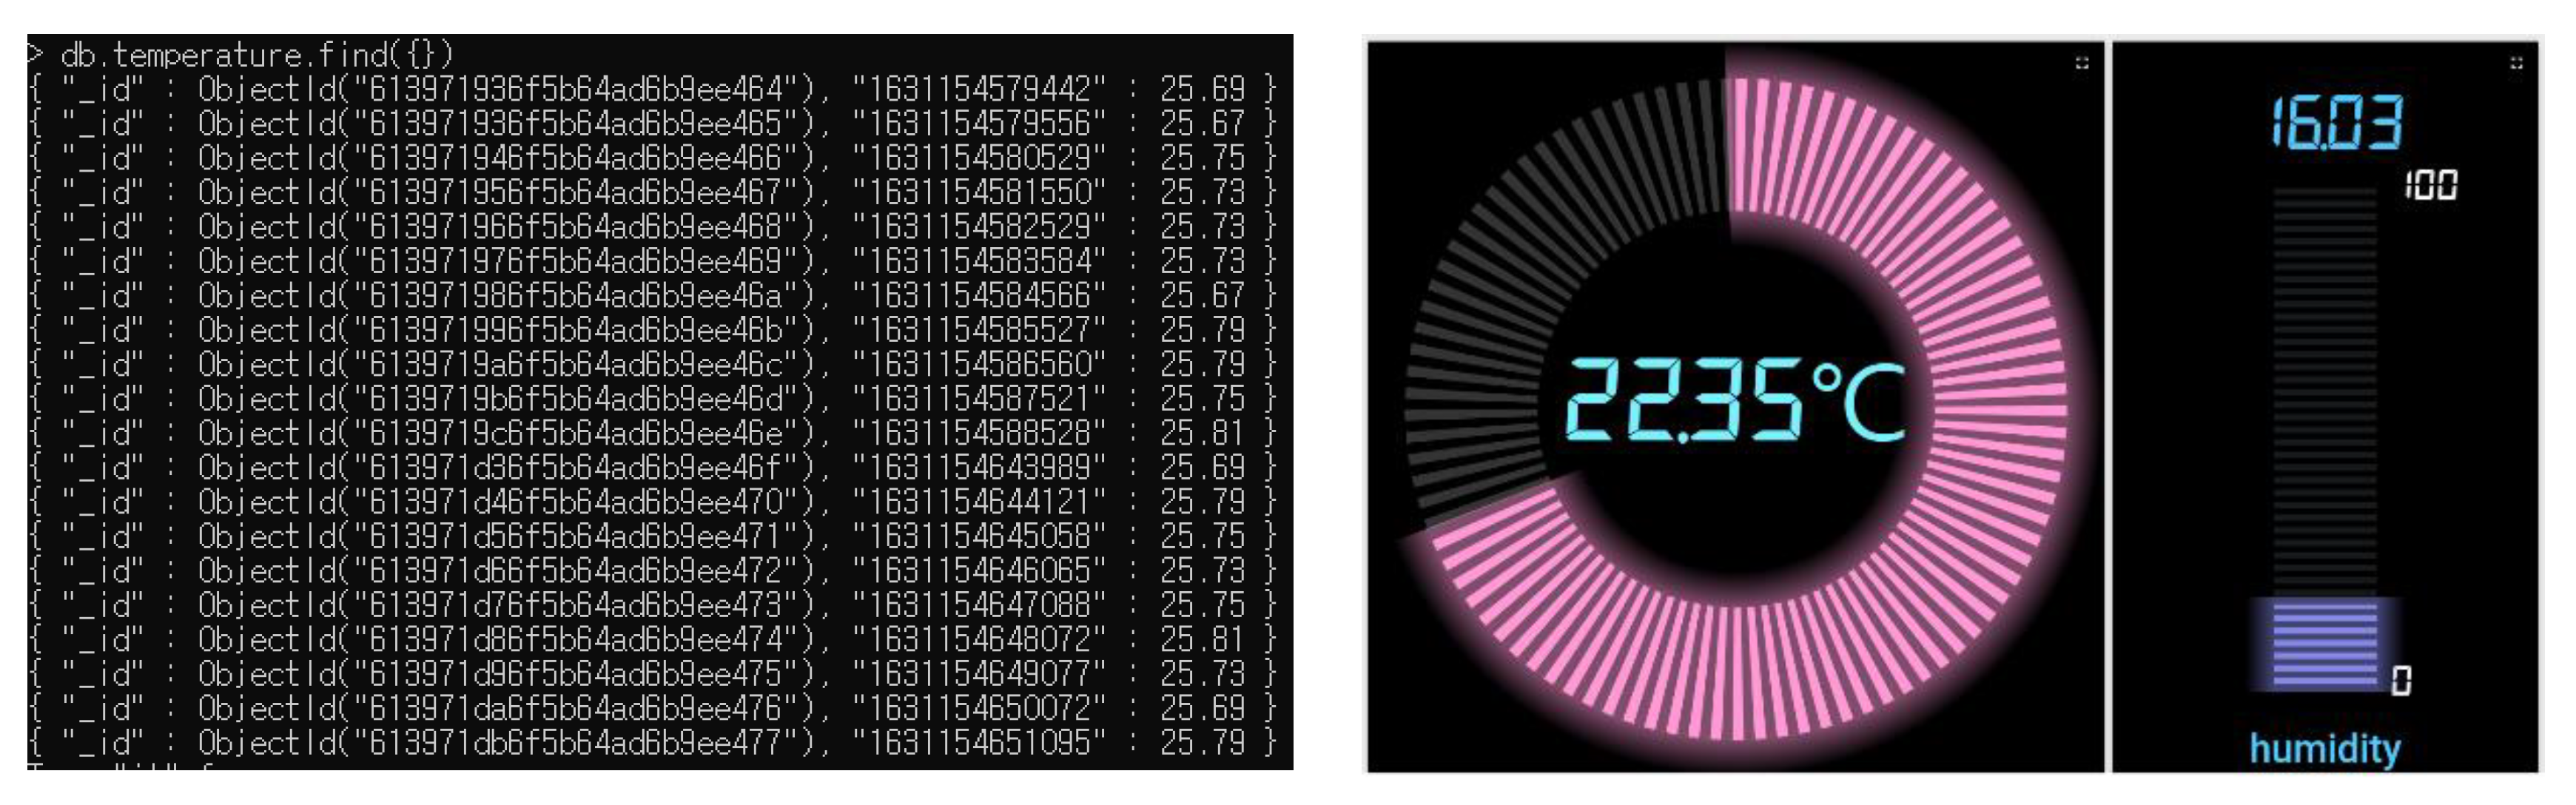
3.3. System Implementation

We created the dashboards for real-time data visualization and remote device control using the websocket-based framework [17]. Using our customized widgets, we established our IoT dashboards. These collect and store telemetry data in a scalable and fault-tolerant way and visualize data with built-in or custom widgets and flexible dashboards. They also define data processing rule chains, transforming and normalizing device data and raising alarms on incoming telemetry events, attribute updates, device inactivity, and user actions. Figure 7 represents various sensors and actuators that were used in this research, and the figure below shows how data are transmitted among many system components in this system.
Table 2 shows the versions of the used modules in this research. The runtime in which the server runs is composed of Node.js based on the JavaScript language, and a package suitable for Node.js is configured so that the server can work well.
When a sensor publishes data on a specific topic, the MQTT component receives it and classifies it into direct processing data and data processing through Kafka. After an MQTT client establishes a connection to an MQTT broker, it is set up to send sensor data connected to that IoT node every 100 ms. By maintaining the established connection between the client and the broker, the burden on the expensive part of the network connection is reduced. Figure 8 shows the actual payload data transmitted through the publish and subscribe architecture in this work.
Many sensor data take constant values, except under special circumstances where it exhibits unusual values. In this case, it is important to reliably transfer the desired data between successive sets of data. Kafka within our platform does this. In Kafka, the received data is shared on the IoT cloud platform, and the data is shared with multiple consumers who consume the data. The server processing data is sent to different services.
When data is sent through Kafka, consumers of such as databases and web servers consume the data immediately and proceed as follows: After receiving data from the Kafka cluster, data is accumulated through the MongoDB connector. The query result in MongoDB that processes the data received from the Kafka cluster is as follows. The left-side of Figure 8 shows the temperature and humidity values printed at every datapoint received, and the right-side of Figure 9 represents our user interface screen, which depicts the temperature and humidity values graphically.
We also store the value in a database management platform, especially MongoDB. MongoDB is a cross-platform document-oriented database system. Classified as a NoSQL database, MongoDB avoids the use of traditional table-based relational database structures in favor of JSON-like, dynamic schema-type documents. This makes data integration for specific kinds of applications easier and faster. Since we make use of the Node.js platform, using communication with a JSON-based DB for development is more efficient. It is easy to store data by utilizing these document-oriented JSON. Our platform visualizes the data through the graph tool on the web using ThingsBoard. The dashboard shows the status of the IoT, which is being checked instantly. Figure 10 and Figure 11 are the dashboard implementations in this research. They show a time-series graph according to the access time. Location information can also be managed as longitude and latitude values and displayed on a map based on these values. The criteria for the alarm function can be set by the user, so if the criteria are out of range, an alarm is automatically displayed on the dashboard. They can also operate connected actuators via the RPC API provided by ThingsBoard.
The upper left knob in Figure 10 is used by the administrator to adjust the temperature of the IoT facility. When you turn this knob on the dashboard, the temperature set value is transmitted to the IoT node to drive a heater or fan. The power switch is used to turn on/off the operation of this system. The upper right corner of Figure 10 is a screen showing the time series of measured values in the system as a line graph with respect to temperature and wattage. The lower left of Figure 10 is a screen that provides the user with information on major events/alarms that occur.
The upper left of Figure 11 provides the name of each sensor node registered in our system and the information collected from that node in real time. It also provides the latitude and longitude of where the node is installed. The right side of Figure 11 shows the location where the sensor node is installed on the map. Therefore, if the IoT facility that the manager wants to monitor is distributed over multiple regions, it is easy to visually check which region the data is coming from.

4. Performance Analysis

In this paper, we conducted a performance evaluation for our high-performance IoT cloud computing framework. In this section, we conducted an evaluation of the following four items: concurrent client connections per server, pub/sub data transmission order guarantee, pub/sub data processing performance, and temperature/humidity measurement information analysis performance. Figure 12 shows the overall system architecture for performance evaluation.
As in Table 3, we used Apache JMeter version 5.4.1. Apache JMeter is an open-source Java application designed to load functional behavior and measure performance. It provides extended functionality, from its original purpose of testing web applications to other testing capabilities. Plugins supporting various protocols have additionally been configured to use the IoT cloud computing platform. In the case of the Kafka client, the consumer creation function was insufficient, so it was additionally configured using the JSR223 script. In Kafka, multiple partitions can be configured in one topic to improve performance through distributed processing. Kafka can have multiple producers on a topic, and multiple consumers can subscribe to it.

4.1. Response Time

After the request is sent from the smartphone, the time until the server completes processing and returns a response was measured. To do this, we repeated the same experiment 10 times and calculated the average. The system design and experiments to check how many client requests could be processed simultaneously by the server application were as follows.
(1)
After running Postman, send a POST request to obtain a JWT token using Table 4, as shown in Figure 13.
(2)
Run JMeter as an administrator after acquiring JWT token
(3)
File -> Open and load the test data jmx file
(4)
Input variables corresponding to user defined variables using Table 5
(5)
Press Ctrl + R to run the performance evaluation
(6)
Repeat No. 5 ten times with Table 6 parameters, measure the time until a response arrives ten times, and take the average value to calculate the processing time in ms.
Table 6 shows a comparison of the average response time described above, according to the execution time. We can see that the response times for MQTT disconnects and publishes were more or less than 100 ms. Since MQTT and Kafka are both TCP-based protocols, the initial response time was a little bit higher due to the initial connection setup of socket communication. After that, a difference of about 400 ms continuously occurred during data transmission and reception. Based on this, the MQTT Kafka platform implemented in this research can be considered effective for use in environments where network bandwidth is limited or a large amount of data is continuously transmitted and received.
In Figure 14 and Figure 15, we can see the overall information of the performance evaluation performed by JMeter. The figure provides the number of responses, average value, minimum value, maximum value, standard deviation, error rate, bandwidth, received data size, transmitted data size, and average data size.

4.2. Concurrent Client Connections per Server

We carried out a performance evaluation of how many client requests a server application can handle simultaneously. In order to check whether requests generated from numerous IoT devices can be simultaneously processed, the number of requests that could be connected to one server at the same time was measured. To this end, we evaluated the number of connectable clients per second using a certified benchmark simulation tool. At that time, we checked whether 50 or more clients could process more than 10,000 requests in 1 min by making 200 requests each at the same time, thereby evaluating whether the server could handle more than 10,000 requests per minute.
(1)
Run Apache JMeter using Table 7.
(2)
Add mqtt-xmeter-2.0.2-jar-with-dependencies.jar and jmeter-plugins-graphs-basic-2.0.jar libraries to JMeter for test evaluation of the MQTT protocol.
(3)
Set the following variables in the user-defined variables of Apache JMeter.
(4)
Execute Apache JMeter evaluation.
(5)
Run (4) for 1 min and judge the result by the average. We obtained the result shown in Table 8.
Figure 16 shows the processing performance per second of the system built in this study. We assumed a scenario in which 50 clients issuing 200 messages were run concurrently. Each client operated in the following order: MQTT connection, 200 messages issued, and MQTT connection termination.
We established pub/sub clients for performance analysis in the following environment. We conducted the evaluation as in Figure 17 to assume simultaneous connection of MQTT and Kafka clients. Assuming one IoT client, 200 iteration evaluations per thread were performed. We did one client connection and termination for each thread, 50 MQTT publishes, and one consumer creation and termination. Plugins and extensions were required to handle MQTT and Kafka clients in JMeter. For MQTT, connect, terminate, and publish were provided independently. However, for Kafka, this comes with a producer and consumer pair with integrated connection and termination capabilities. In the case of the consumer, to use the necessary functions, a script had to be created using JSR223 for script support in Java. Therefore, considering this environment, in the case of MQTT, connect, publish, and terminate were recognized as one work process and compared with the Kafka consumer.

4.3. Server-Client Data Processing Performance

In our pub/sub messaging structure, we evaluated the data processing performance per second for one topic. In the pub/sub messaging structure, the data processing performance per second for one topic was evaluated to determine whether processing of more than 58,000 datapoints per second was possible. In order to evaluate the data processing performance per second for one topic in the MQTT KAFKA messaging structure, an experiment was conducted for MQTT KAFKA data processing performance verification.
We conducted the test several times by varying the number of client connection patterns and topics. As the time increased, the number of transactions processed was continuously maintained at over 100,000 messages per second. It was suitable for processing and transmitting measurement data occurring continuously in the real environment. As a result of a total of 10 repeated experiments, a minimum of 107,369.2 datapoints could be processed per second, and a maximum of 117,603.6 datapoints per second could be processed. Figure 6 shows part of the experimental result log.
(1)
Connect to the MQTT KAFKA configuration server.
(2)
Enter the following command in Table 9 to create a topic.
(3)
Input the test code in Table 10 and check the output result.
(4)
Check the data processing performance per second through the log output from the performance evaluation program.
Table 11 and Figure 18 outline the experiment to evaluate the transmission rate according to the data size. In this experiment, performance evaluation was performed with a total of 10 million records. The maximum performance was achieved at 117,693.6 record/ms. When transmitting data, it is desirable to divide data into predetermined sized data with the maximum data rate and transmit them when transmitting large data on the MQTT Kafka platform.
Since two or more partitions were configured in parallel on different brokers to distribute the load of requests, the performance can be naturally improved. The test was conducted by varying the number of messages and message size options to be transmitted to topics with one to three partitions. Table 12 shows the results of experiments to measure the message processing performance of this system. Table 12 shows information on the number of messages processed according to a change in the size of a transmitted message and the amount of message processing per unit time.

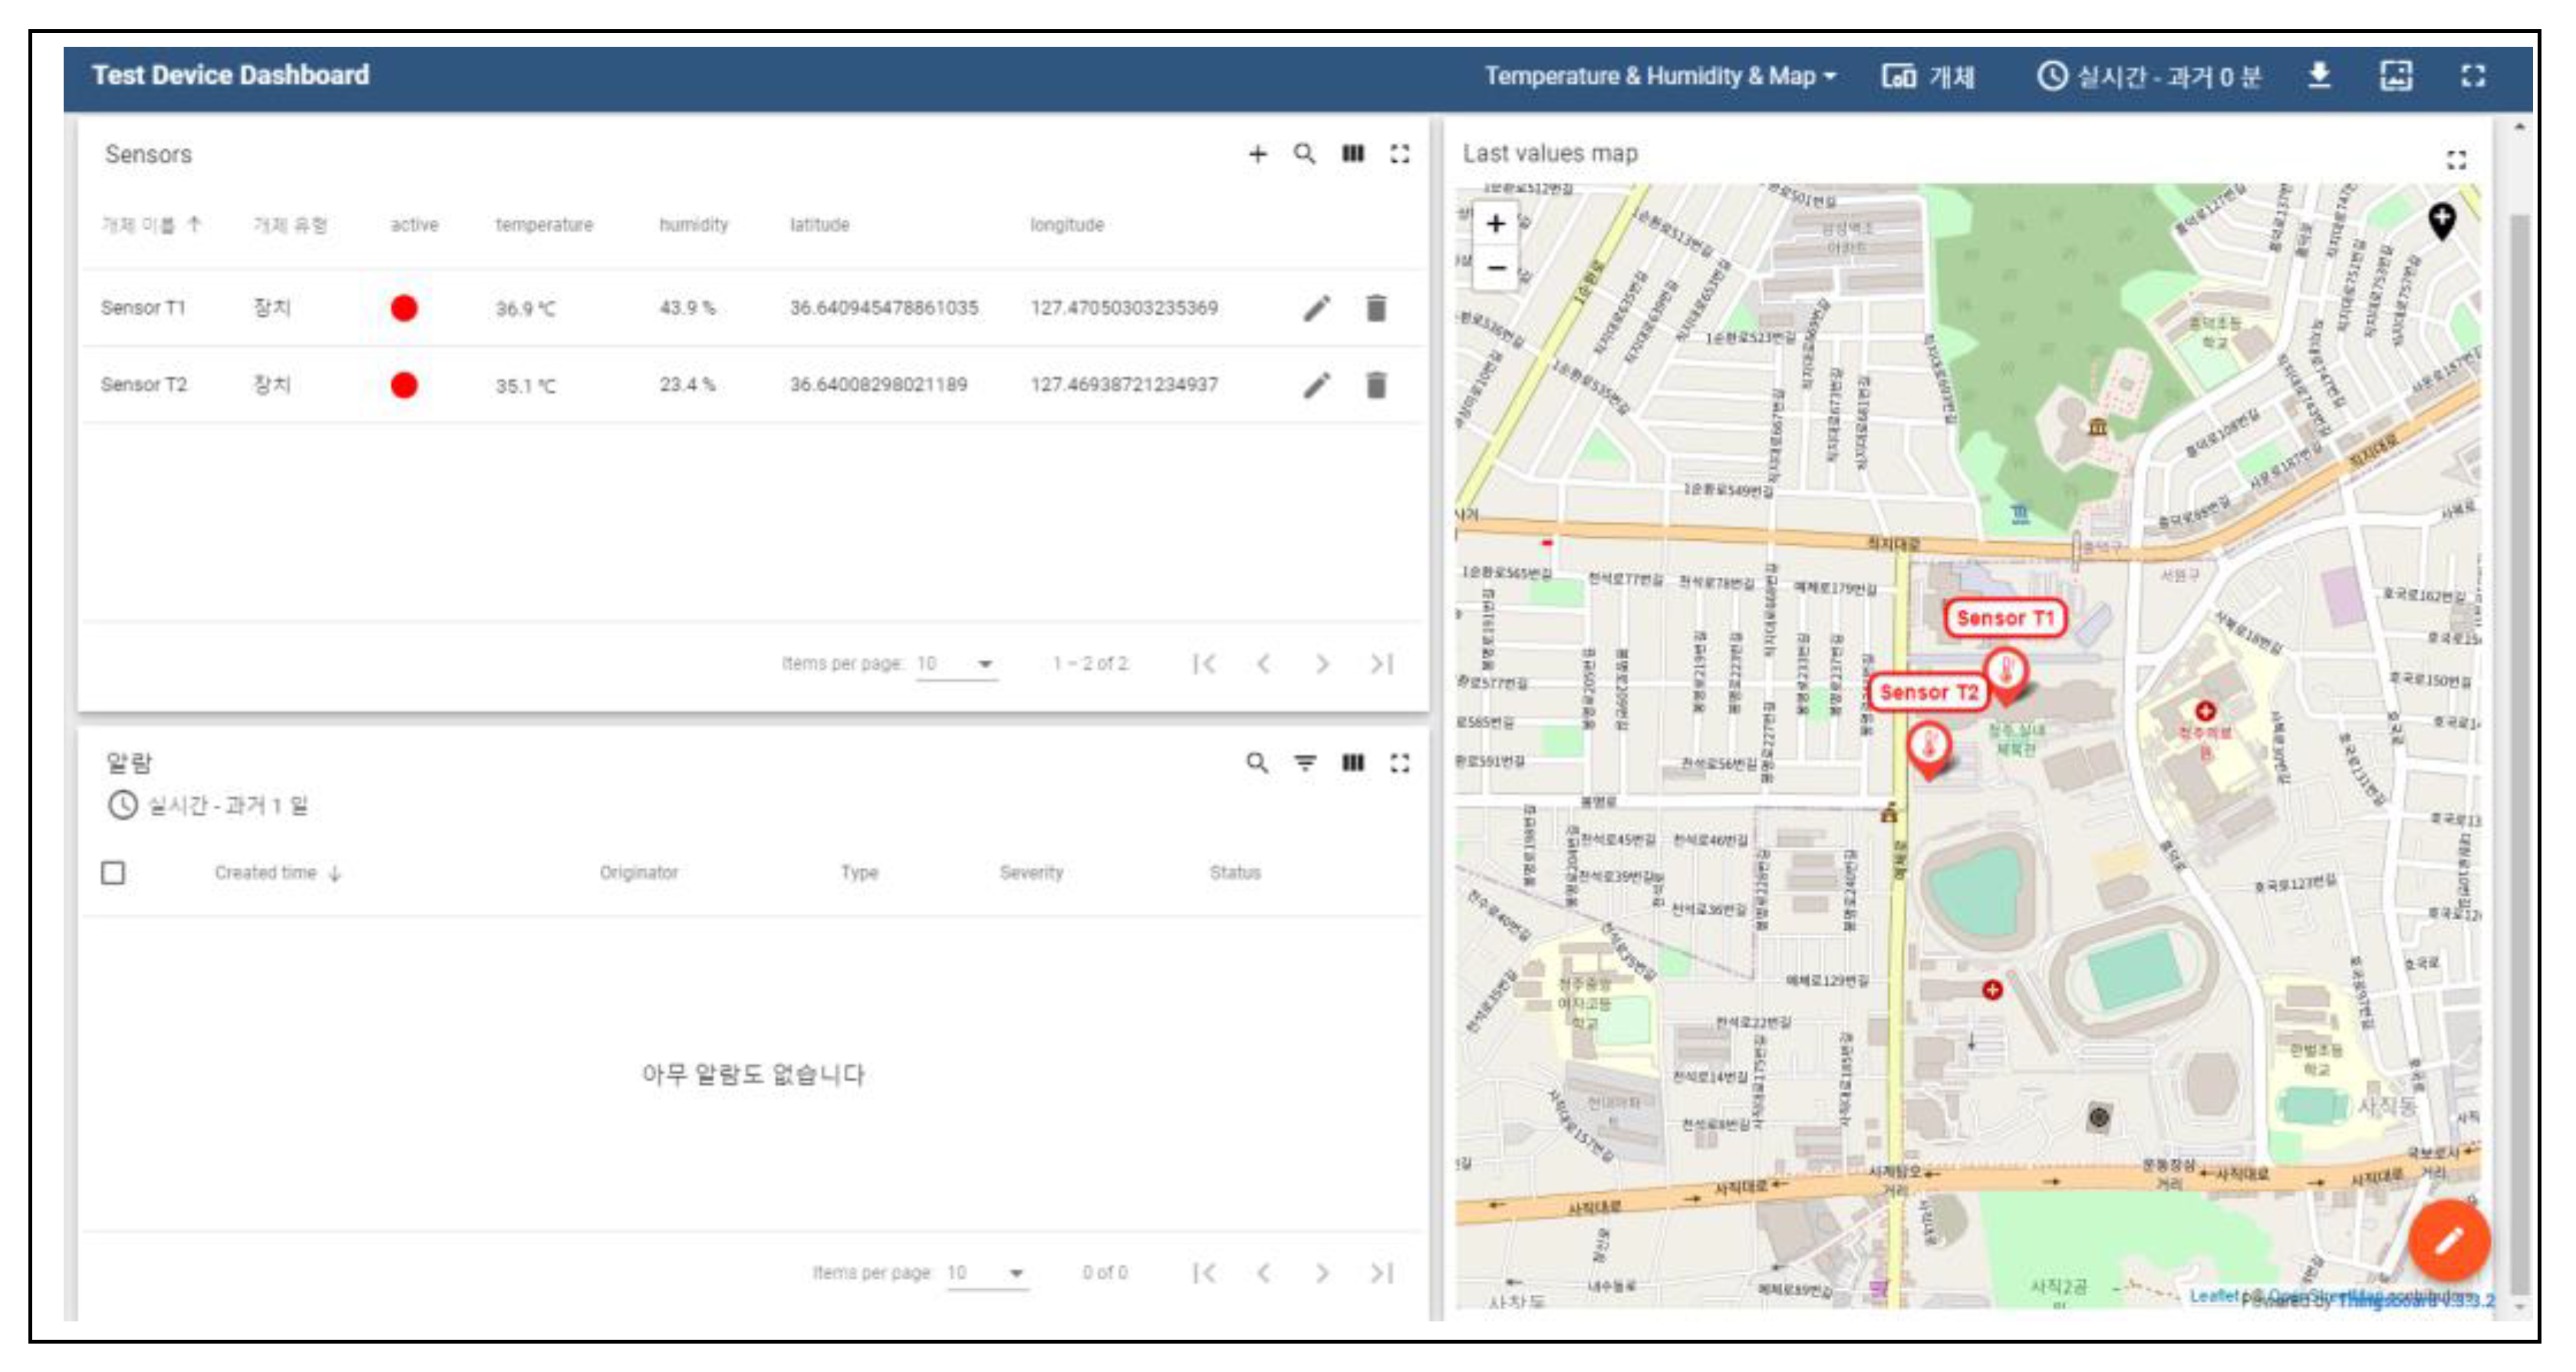
4.4. Actual Data Acquisition Performance Measurement

In order to verify that the system built through the previous experiments can operate normally even with actual sensor data, an information transfer experiment was conducted within 1500 ms to the server through the GPIO input of the temperature and humidity sensors. As a result of the experiment, a total of 10 repeated experiments were conducted, as shown in Table 12. Information transmission was completed in a minimum of 196 ms and a maximum of 299 ms. The average value of 10 experiments was 227.92 ms, as in Table 12 and Figure 19.

4.5. In-Order Data Transmission

In the data transmission order guarantee experiment to verify the stability maintenance between data transmissions, about 3000 bytes of data were transmitted using the MQTT protocol, and the loss and order guarantee of the transmitted data were observed. At this time, in order to evaluate the data transmission guaranteed performance, the following performance evaluation calculation method was applied.
(1)
Run IntelliJ IDEA Community Edition and add Spring-Kafka and Apache’s Kafka-clients library to evaluate whether the data transmission order is guaranteed when transmitting 3000 bytes of data for a specific topic or single partition.
(2)
The Kafka producer program source code is in Figure 19.
(3)
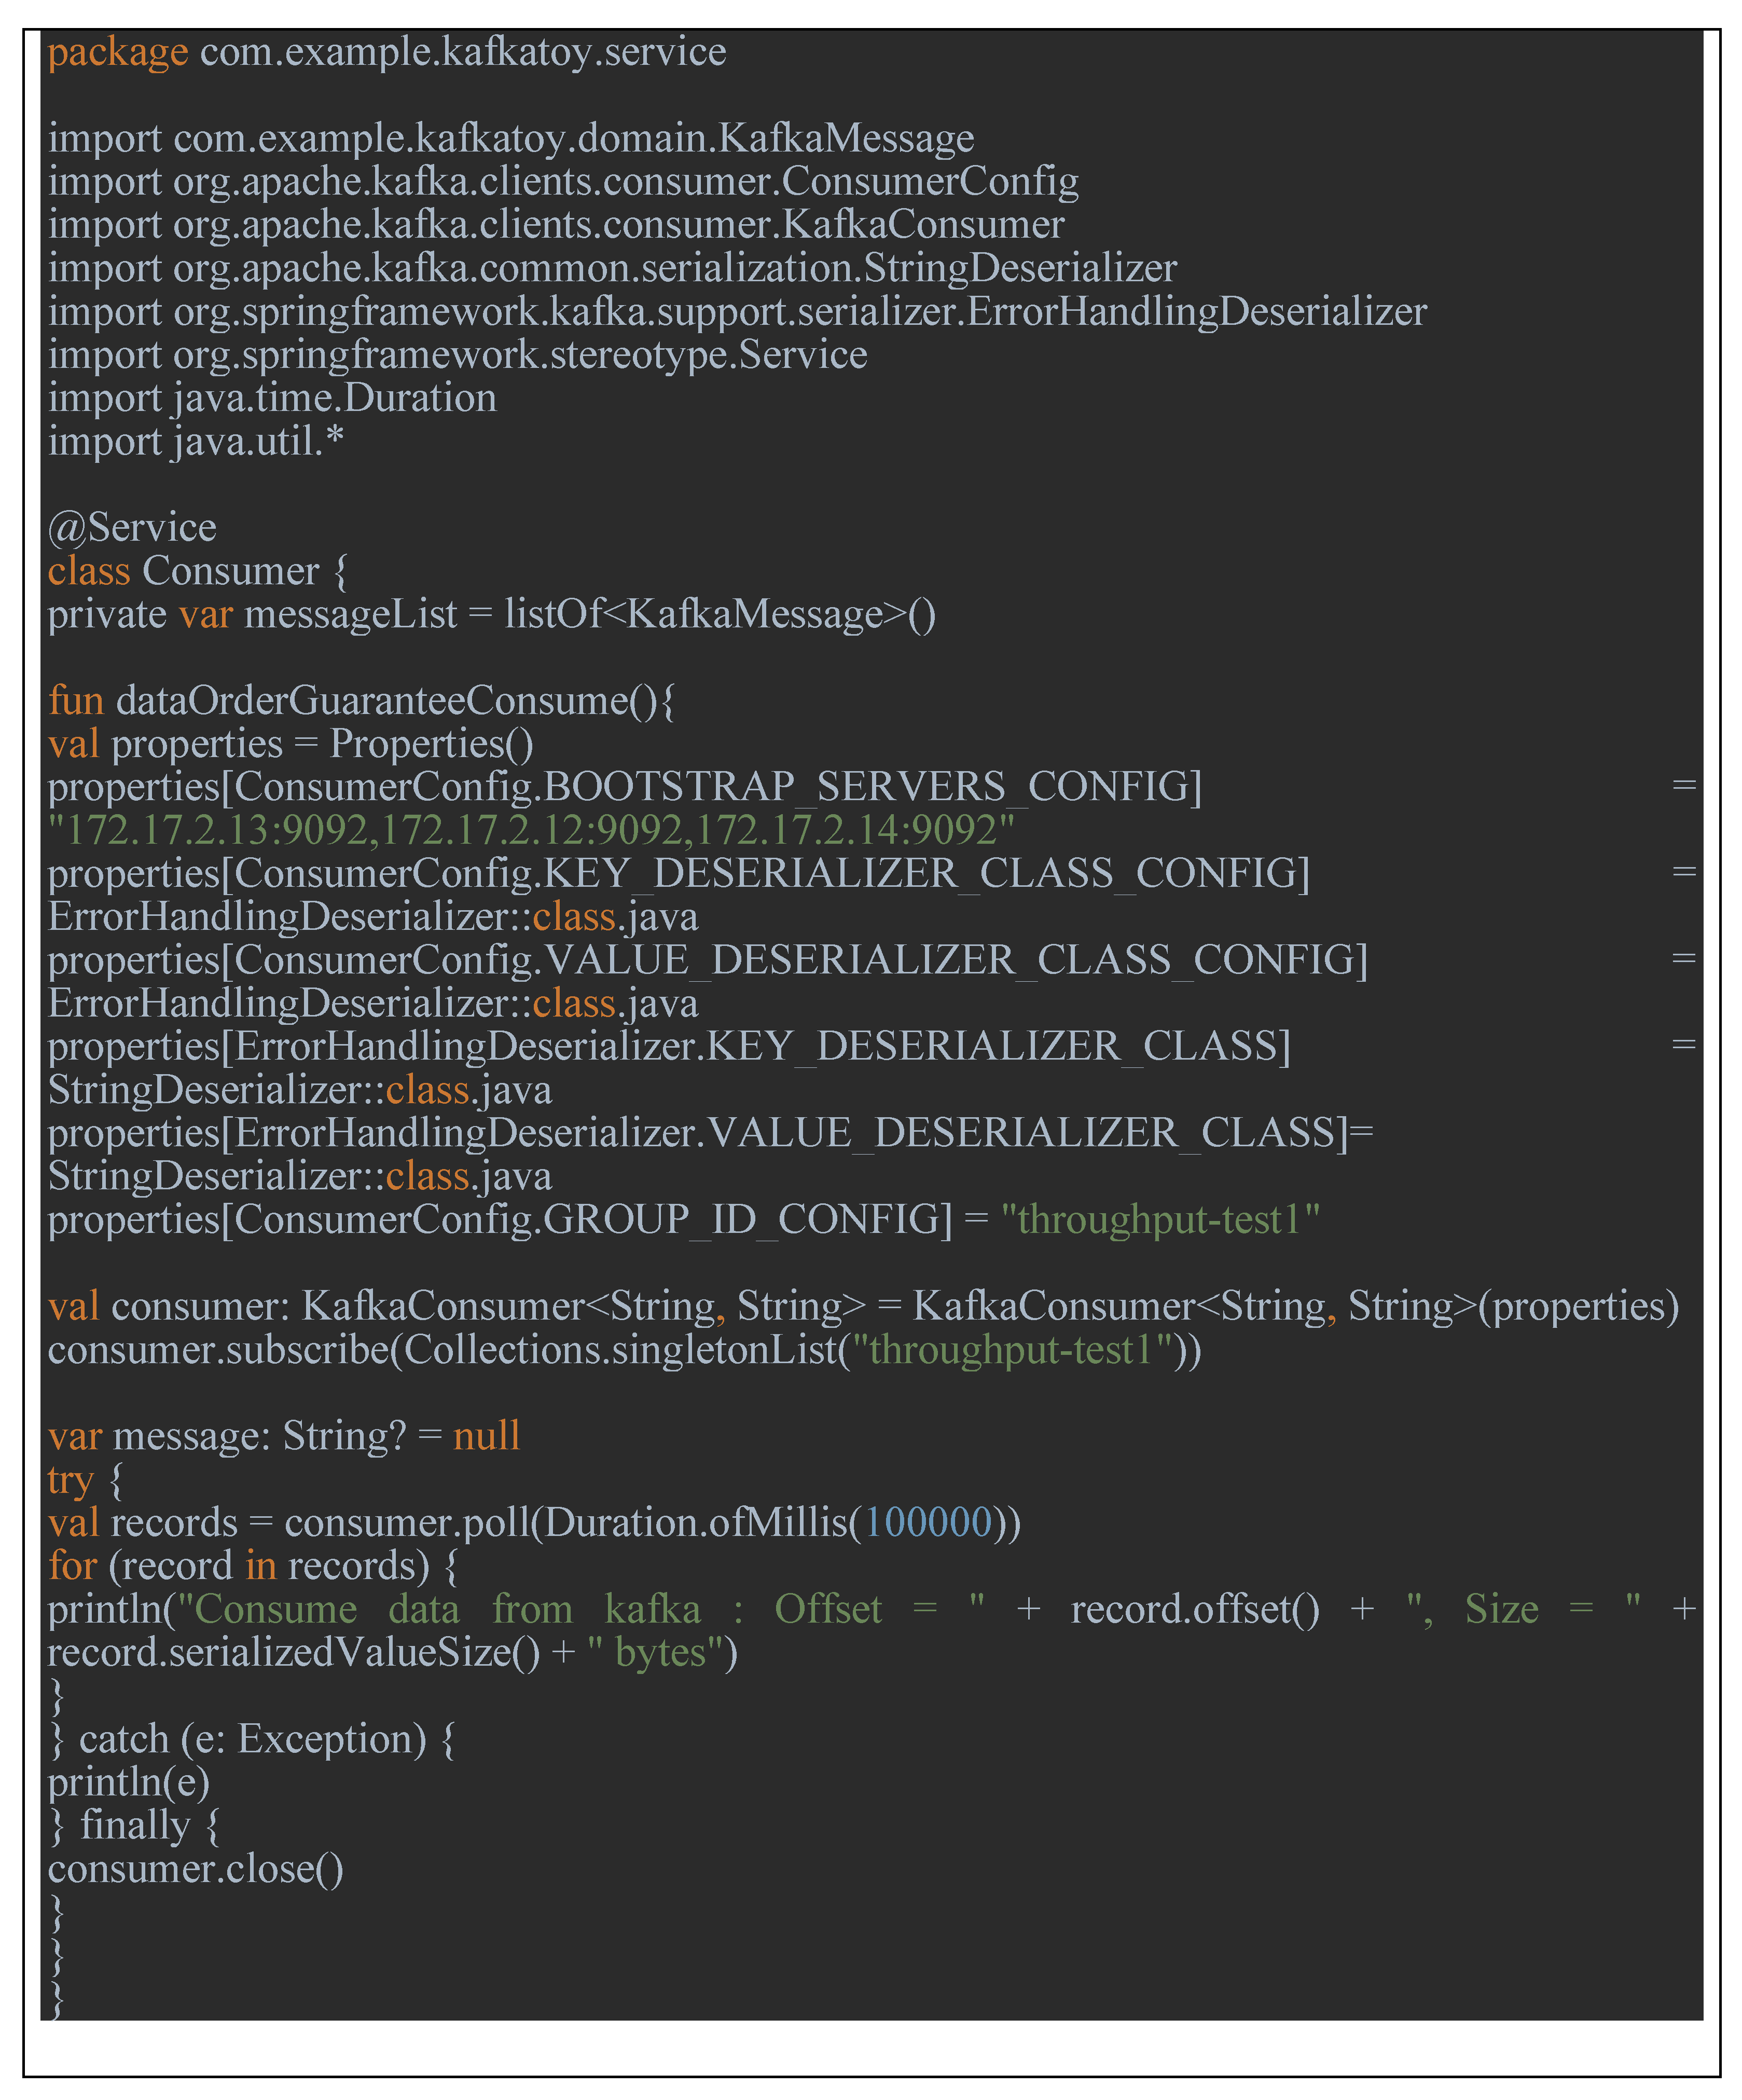
Kafka consumer program code in Figure 20.
The example program for this performance evaluation was developed using Spring Boot. Therefore, since this program should be executed through the spring server, we executed the main program in Figure 21 by creating objects for producer and consumer classes to run the server. Later, when a user request arrives at the server, the server dispatches it and executes it.
(4)
Run src -> main -> kotlin -> com.example.kafkatoy-> kafkaToyApplication.kt file.
(5)
Run Postman, enter the address to send the GET request to as Figure 22, and send.
(6)
Request GET against the Spring Framework (POSTMAN).
(7)
Check whether Offset is guaranteed in order through the log output to the IntelliJ IDEA console.
As a result of the experiment, the data transmission order according to all data transmission times was maintained correctly for more than 13 million requests. We confirmed the following as a result of the test. Our system 100% satisfied the data transfer order of 3000 bytes for a specific topic single partition. That is, for 100% of the transmitted data, we confirmed that all data transmission orders were guaranteed without any loss. Table 13 shows part of the actual data transfer log from lines 13,671,130 to 13,671,229, confirming that the data transfer order was guaranteed.

5. Conclusions

Recently, research and development on indoor smart farm facilities has become popular. To develop the IoT facility, we designed and implemented an IoT cloud platform using a publish and subscribe architecture. As a result of the experiment, the average response time for user requests was measured to be within 100 ms on average, and 64,313 requests per second were performed for requests that occurred simultaneously from multiple clients. In addition, in the data transmission order guarantee verification experiment to verify the safety maintenance between data transmissions, the order was guaranteed without loss of information, even for more than 13 million requests. Finally, using real sensor data, information transmission was completed stably within an average of 227 ms. These results showed superior performance, when compared with previous studies [12,13], of the MQTT protocol for processing large amounts of data. Of course, it is difficult to make an absolute comparison because the server environment and network environment were not the same, but it is meaningful in that we exceeded the limits of data processing speed and throughput of previous studies. Through this study, it was possible to improve the processing speed of large-capacity data and ensure the stability of transmission orders in the MQTT protocol-based system. We conducted research on whether it guarantees safety and reliability.
  • ✓ We realized a high-performance IoT cloud platform architecture which is for data interworking between each node, and this system also provides the ability to record key facts.
  • ✓ As a result of performance evaluation, our system is effective for use in environments where network bandwidth is limited or a large amount of data is continuously transmitted and received.
As a result, the pub/sub platform implemented in this research is to maintain and verify the data collected from the planting and harvesting phases in a safe and secure manner.

Author Contributions

Conceptualization, M.C.; Funding acquisition, M.C.; Investigation and methodology, J.N., Y.J. and M.C.; Project administration, M.C.; Resources, M.C.; Supervision, M.C.; Writing of the original draft, J.N., Y.J. and M.C.; Writing of the review and editing, M.C.; Software, J.N., Y.J. and M.C.; Validation, J.N., Y.J. and M.C.; Formal analysis, M.C.; Data curation, J.N., Y.J. and M.C.; Visualization, J.N. and M.C. All authors have read and agreed to the published version of the manuscript.

Funding

This research was supported by the MSIT (Ministry of Science and ICT), Korea, under the Grand Information Technology Research Center support program (IITP-2022-2020-0-01462) supervised by the IITP (Institute for Information & communications Technology Planning & Evaluation), and under the Strategic Research Program (NRF-2017R1E1A1A01075128) supervised by the National Research Foundation of Korea (NRF).

Institutional Review Board Statement

Not applicable.

Informed Consent Statement

Not applicable.

Data Availability Statement

Not applicable.

Conflicts of Interest

The authors declare no conflict of interest.

References

  1. Gokhale, P.; Bhat, O.; Bhat, S. Introduction to IOT. Int. Adv. Res. J. Sci. Eng. Technol. 2018, 5, 41–44. [Google Scholar]
  2. Naresh, M.; Munaswamy, P. Smart Agriculture System using IoT Technology. Int. J. Recent Technol. Eng. 2019, 7, 98–102. [Google Scholar]
  3. Bauer, J.; Aschenbruck, N. Design and Implementation of an Agricultural Monitoring System for Smart Farming. In Proceedings of the 2018 IoT Vertical and Topical Summit on Agriculture—Tuscany (IOT Tuscany), Tuscany, Italy, 8–9 May 2018; IEEE: New York, NY, USA, 2018; pp. 1–6. [Google Scholar] [CrossRef]
  4. Verma, M.S.; Gawade, S.D. A Machine Learning Approach for Prediction System and Analysis of Nutrients Uptake for Better Crop Growth in the Hydroponics System. In Proceedings of the 2021 International Conference on Artificial Intelligence and Smart Systems (ICAIS), Coimbatore, India, 25–27 March 2021; IEEE: New York, NY, USA, 2021; pp. 150–156. [Google Scholar]
  5. Vanipriya, C.; Maruyi; Malladi, S.; Gupta, G. Artificial intelligence enabled plant emotion xpresser in the development hydroponics system. Mater. Today Proc. 2021, 45, 5034–5040. [Google Scholar] [CrossRef]
  6. Triantafyllou, A.; Sarigiannidis, P.; Lagkas, T.D. Network Protocols, Schemes, and Mechanisms for Internet of Things (IoT): Features, Open Challenges, and Trends. Wirel. Commun. Mob. Comput. 2018, 2018, 1–24. [Google Scholar] [CrossRef] [Green Version]
  7. Gilmore, B. The Next Step in Internet Evolution: The Internet of Things. Internet Things Cmswire 2014. [Google Scholar]
  8. Hammad, M.; Iliyasu, A.M.; Elgendy, I.A.; Abd El-Latif, A.A. End-to-End Data Authentication Deep Learning Model for Securing IoT Configurations. Hum. Cent. Comput. Inf. Sci. 2022, 12, 4. [Google Scholar]
  9. Anusha, A.; Guptha, A.; Rao, G.S.; Tenali, R.K. A Model for Smart Agriculture Using IOT. Int. J. Innov. Technol. Explor. Eng. 2019, 8, 6. [Google Scholar]
  10. Guillermo, J.C.; García-Cedeño, A.; Rivas-Lalaleo, D.; Huerta, M.; Clotet, R. Iot Architecture Based on Wireless Sensor Network Applied to Agricultural Monitoring: A Case of Study of Cacao Crops in Ecuador. In International Conference of ICT for Adapting Agriculture to Climate Change; Springer: Cham, Switzerland, 2018; pp. 42–57. [Google Scholar]
  11. El Azzaoui, A.; Choi, M.Y.; Lee, C.H.; Park, J.H. Scalable Lightweight Blockchain-Based Authentication Mechanism for Secure VoIP Communication. Hum. Cent. Comput. Inf. Sci. 2022, 12, 8. [Google Scholar]
  12. Li, G.; Yang, K. Study on Data Processing of the IOT Sensor Network Based on a Hadoop Cloud Platform and a TWLGA Scheduling Algorithm. J. Inf. Processing Syst. 2021, 17, 1035–1043. [Google Scholar] [CrossRef]
  13. La, H.J.; An, K.H.; Kim, S.D. Design Patterns for Mitigating Incompatibility of Context Acquisition Schemes for IoT Devices. KIPS Trans. Softw. Data Eng. 2016, 5, 351–360. [Google Scholar] [CrossRef] [Green Version]
  14. Shin, S.; Eom, S.; Choi, M. Soft Core Firmware-Based Board Management Module for High Performance Blockchain/Fintech Servers. Hum. Cent. Comput. Inf. Sci. 2022, 12, 3. [Google Scholar]
  15. Choi, M.; Kiran, S.R.; Oh, S.-C.; Kwon, O.-Y. Blockchain-Based Badge Award with Existence Proof. Appl. Sci. 2019, 9, 2473. [Google Scholar] [CrossRef] [Green Version]
  16. Keswani, B.; Mohapatra, A.G.; Mohanty, A.; Khanna, A.; Rodrigues, J.J.P.C.; Gupta, D.; de Albuquerque, V.H.C. Adapting weather conditions based IoT enabled smart irrigation technique in precision agriculture mechanisms. Neural Comput. Appl. 2018, 31, 277–292. [Google Scholar] [CrossRef]
  17. Heble, S.; Kumar, A.; Prasad, K.V.D.; Samirana, S.; Rajalakshmi, P.; Desai, U.B. A Low Power IoT Network for Smart Agriculture. In Proceedings of the 2018 IEEE 4th World Forum on Internet of Things (WF-IoT), Singapore, 5 February 2018; IEEE: New York, NY, USA, 2018; pp. 609–614. [Google Scholar]
  18. Jawad, H.M.; Nordin, R.; Gharghan, S.K.; Jawad, A.M.; Ismail, M.; Abu-AlShaeer, M.J. Power Reduction with Sleep/Wake on Redundant Data (SWORD) in a Wireless Sensor Network for Energy-Efficient Precision Agriculture. Sensors 2018, 18, 3450. [Google Scholar] [CrossRef] [PubMed]
  19. Opensource IoT Dashboard Platform, ThingsBoard-Open-Source IoT Platform. Available online: http://thingboard.io (accessed on 29 July 2022).
Figure 1. Overall system architecture.
Applsci 12 11009 g001
Figure 2. Operation sequence.
Applsci 12 11009 g002
Figure 3. Server and network configuration.
Applsci 12 11009 g003
Figure 4. Data publication architecture.
Applsci 12 11009 g004
Figure 5. MQTT communication pattern.
Applsci 12 11009 g005
Figure 6. Method of large data streaming in KAFKA.
Applsci 12 11009 g006
Figure 7. List of sensors and actuators and system data flow among the components.
Applsci 12 11009 g007
Figure 8. Data validity check result from sensors(For your information, In this figure, the non-English term “장치” means “device” in English).
Applsci 12 11009 g008
Figure 9. Temperature Sensor data collected at every period.
Applsci 12 11009 g009
Figure 10. First dashboard screen captured. (For your information, In this figure, the non-English term “평균” means “average” in English).
Applsci 12 11009 g010
Figure 11. Second dashboard screen captured. (For your information, in this figure, the non-English term “장치” and the statement “아무 알람도 없습니다” means “device” and “there are no alarms” in English, respectively).
Applsci 12 11009 g011
Figure 12. System architecture for evaluation.
Applsci 12 11009 g012
Figure 13. POSTMAN request for JWTtoken with the configuration above.
Applsci 12 11009 g013
Figure 14. Screenshot of response time evaluation using Apache JMeter.
Applsci 12 11009 g014
Figure 15. Apache jMeter execution log example. (For your information, In this figure, the non-English term “응답시간” means “response time” in English).
Applsci 12 11009 g015
Figure 16. Screenshot of throughput evaluation using the Apache JMeter.
Applsci 12 11009 g016
Figure 17. Screenshot of throughput evaluation using the Apache JMeter.
Applsci 12 11009 g017
Figure 18. Screenshot of data processing log for performance evaluation.
Applsci 12 11009 g018
Figure 19. Source code of performance evaluation for producer.
Applsci 12 11009 g019
Figure 20. Source code of performance evaluation for producer.
Applsci 12 11009 g020
Figure 21. Source code of performance evaluation for main function.
Applsci 12 11009 g021
Figure 22. Screenshot of data request by using POSTMAN.
Applsci 12 11009 g022
Table 1. Device configurations for input and output.
NameAddressRead Access
Melexis reserved0x00Yes
Melexis reserved0x03Yes
Raw data IR channel 10x04
Raw data IR channel 20x05
TA0x06Yes
TOBJ10x07Yes
TOBJ20x08Yes
Melexis reserved0x09Yes
Melexis reserved0x1fYes
Table 2. Libraries and modules for system implementation.
ModulesVersion
Run timeNode.jsv14.17.3
WebserverThingsBoardv3.3.1
MQTT clientmqtt.jsv0.46.1
MQTT broker aedes.jsv4.2.8
DatabaseMongoDBv4.4.6
Database clientmongodb.jsv4.1.1
Kafka serverApache Kafkav2.8.0
FrameworkSpring Boot v2.3.3
Web frontendReact v1613.1
Kafka clientkafka.jsv1.15.0
Table 3. System components for evaluation.
TypePurpose
MQTT serverServer for processing sensor data
Kafka server clusterCluster server for image data processing and Kafka server stability
Apache JMeterCreate a virtual client for testing on the MQTT Kafka server
Table 4. Configuration parameters for requesting JWT token.
Address172.17.x.xx/api/auth/login
HeaderContent-Typeapplication/json
Acceptapplication/json
Body{
"username":"xxxxxx@thingsboard.org",
"password":"xxxxxx"
}
Table 5. Configuration for server request.
HTTP_HOST172.17.XX.XXX
HTTP_PORT8080
NUMBER_OF_USERS1
TOKENJWT token you get from our server through POSTMAN
entityTypeDEVICE
entityId24b14a40-7ff0-11ec-88a7-2d9d3861528f
scopeANY
Table 6. Test results during ten times of repetition.
Test Result (Processing Time, ms)
188
2100
3103
4104
5103
698
799
899
999
10101
average99.4
Table 7. Test results during 10 times of repetition.
MQTT_HOST172.xx.xx.xx
MQTT_PORT1884
TOPICTest
NUMBER_OF_USERS50
NUMBER_OF_DATA_TRANSFERS200
USER_NAMExxxx
PASSWORDxxxxxx
Table 8. Test results during 10 times of repetition.
Throughput (req./s)Unit Time (s)Throughput (req./min)
64,313.1603,858,786
Table 9. Commands to prepare the performance test.
/usr/local/kafka/bin/kafka-topics.sh \
--create \
--partitions 1 \
--replication-factor 1 \
--topic throughput-test \
--bootstrap-server 172.17.XX.XXX:9092,172.17.XX.XXX:9092,172.17.XX.XXX:9092
Table 10. Commands to start the Kafka performance test as a producer.
/usr/local/kafka/bin/kafka-producer-perf-test.sh \--topic throughput-test \--throughput –1 \--num-records 20000000 --record-size 512 --producer-propsbootstrap.servers=172.17.XX.XXX:9092,172.17.XX.XXX:9092,172.17.XX.XXX:9092
Table 11. Test results during 10 times repeat.
Test Result (record/ms)
1114,948.2
2117,603.6
3116,698.6
4107,369.2
5116,661.0
6111,039.0
7112,493.6
8113,449.4
9111,433.2
10109,653.1
Average113,134.89
Table 12. Test results during ten times of repetition.
Test Result (Transmission Time, ms)
1199.5
2196.0
3299.0
4283.0
5196.4
6213.3
7204.8
8211.0
9252.4
10223.8
227.92
Table 13. Test results for actual data log from lines 13,671,130 to 13,671,229.
Produce data from kafka: Offset = 13,671,130, Size = 3000 bytes
Produce data from kafka: Offset = 13,671,131, Size = 3000 bytes
Produce data from kafka: Offset = 13,671,132, Size = 3000 bytes
Produce data from kafka: Offset = 13,671,133, Size = 3000 bytes
Produce data from kafka: Offset = 13,671,134, Size = 3000 bytes
Produce data from kafka: Offset = 13,671,135, Size = 3000 bytes
Produce data from kafka: Offset = 13,671,136, Size = 3000 bytes
Produce data from kafka: Offset = 13,671,137, Size = 3000 bytes
Produce data from kafka: Offset = 13,671,138, Size = 3000 bytes
Produce data from kafka: Offset = 13,671,139, Size = 3001 bytes
Produce data from kafka: Offset = 13,671,140, Size = 3001 bytes
Produce data from kafka: Offset = 13,671,141, Size = 3001 bytes
Produce data from kafka: Offset = 13,671,142, Size = 3001 bytes
Produce data from kafka: Offset = 13,671,143, Size = 3001 bytes
Produce data from kafka: Offset = 13,671,144, Size = 3001 bytes
Produce data from kafka: Offset = 13,671,145, Size = 3001 bytes
Produce data from kafka: Offset = 13,671,146, Size = 3001 bytes
Produce data from kafka: Offset = 13,671,147, Size = 3001 bytes
Produce data from kafka: Offset = 13,671,148, Size = 3001 bytes
Produce data from kafka: Offset = 13,671,149, Size = 3001 bytes
Produce data from kafka: Offset = 13,671,150, Size = 3001 bytes
Produce data from kafka: Offset = 13,671,151, Size = 3001 bytes
Produce data from kafka: Offset = 13,671,152, Size = 3001 bytes
Produce data from kafka: Offset = 13,671,153, Size = 3001 bytes
Consume data from kafka: Offset = 13,671,206, Size = 3001 bytes
Consume data from kafka: Offset = 13,671,207, Size = 3001 bytes
Consume data from kafka: Offset = 13,671,208, Size = 3001 bytes
Consume data from kafka: Offset = 13,671,209, Size = 3001 bytes
Consume data from kafka: Offset = 13,671,210, Size = 3001 bytes
Consume data from kafka: Offset = 13,671,211, Size = 3001 bytes
Consume data from kafka: Offset = 13,671,212, Size = 3001 bytes
Consume data from kafka: Offset = 13,671,213, Size = 3001 bytes
Consume data from kafka: Offset = 13,671,214, Size = 3001 bytes
Consume data from kafka: Offset = 13,671,215, Size = 3001 bytes
Consume data from kafka: Offset = 13,671,216, Size = 3001 bytes
Consume data from kafka: Offset = 13,671,217, Size = 3001 bytes
Consume data from kafka: Offset = 13,671,218, Size = 3001 bytes
Consume data from kafka: Offset = 13,671,219, Size = 3001 bytes
Consume data from kafka: Offset = 13,671,220, Size = 3001 bytes
Consume data from kafka: Offset = 13,671,221, Size = 3001 bytes
Consume data from kafka: Offset = 13,671,222, Size = 3001 bytes
Consume data from kafka: Offset = 13,671,223, Size = 3001 bytes
Consume data from kafka: Offset = 13,671,224, Size = 3001 bytes
Consume data from kafka: Offset = 13,671,225, Size = 3001 bytes
Consume data from kafka: Offset = 13,671,226, Size = 3001 bytes
Consume data from kafka: Offset = 13,671,227, Size = 3001 bytes
Consume data from kafka: Offset = 13,671,228, Size = 3001 bytes
Consume data from kafka: Offset = 13,671,229, Size = 3002 bytes
Publisher’s Note: MDPI stays neutral with regard to jurisdictional claims in published maps and institutional affiliations.

