Article

Evaluation and Optimization of Biomedical Image-Based Deep Convolutional Neural Network Model for COVID-19 Status Classification

1
Department of Computer Science & Engineering, Institute of Engineering & Management, Kolkata 700091, WB, India
2
Department of Computer Science & Engineering, Meghnad Saha Institute of Technology, Kolkata 700150, WB, India
3
Department of Computer Science & Engineering, Academy of Technology, Aedconagar, Hooghly 712121, WB, India
4
Department of Computer Science & Engineering, Future Institute of Technology, Garia Boral Main Road, Kolkata 700154, WB, India
5
Department of Environmental Health, Harvard T. H. Chan School of Public Health, Boston, MA 02115, USA
6
Center for Precision Health, School of Biomedical Informatics, The University of Texas Health Science Center at Houston, Houston, TX 77030, USA
7
Department of Computer Science & Engineering, Pailan College of Management & Technology, Kolkata 700104, WB, India
*
Authors to whom correspondence should be addressed.
Appl. Sci. 2022, 12(21), 10787; https://doi.org/10.3390/app122110787
Submission received: 22 August 2022 / Revised: 17 October 2022 / Accepted: 18 October 2022 / Published: 25 October 2022

Abstract

:
Accurate detection of an individual’s coronavirus disease 2019 (COVID-19) status has become critical as the COVID-19 pandemic has led to over 615 million cases and over 6.454 million deaths since its outbreak in 2019. Our proposed research work aims to present a deep convolutional neural network-based framework for the detection of COVID-19 status from chest X-ray and CT scan imaging data acquired from three benchmark imagery datasets. VGG-19, ResNet-50 and Inception-V3 models are employed in this research study to perform image classification. A variety of evaluation metrics including kappa statistic, Root-Mean-Square Error (RMSE), accuracy, True Positive Rate (TPR), False Positive Rate (FPR), Recall, precision, and F-measure are used to ensure adequate performance of the proposed framework. Our findings indicate that the Inception-V3 model has the best performance in terms of COVID-19 status detection.

Graphical Abstract

1. Introduction

The coronavirus disease (COVID-19) [1,2,3,4] is a highly contagious viral disease. Older people and those with comorbidities such as heart and lung problems, high blood pressure, diabetes, and cancers are more susceptible to serious illness or death due to the COVID-19 infection. However, any person may become severely sick or die due to this disease. Common symptoms of the disease include fever, fatigue, and dry cough, headaches, conjunctivitis, sore throat, nasal congestion, muscle pain, skin rash, loss of taste, vomiting, diarrhea, dizziness, irritation, anxiety, nervousness, diminished consciousness, depression, sleep disorder, stroke, brain inflammation, and nerve damage. The indications of severe coronavirus disease include shortness of breath, loss of appetite, chest pain, and high temperature (above 100 °F). COVID-19 is also responsible for respiratory upheaval and weakens the immune system [5].
The majority (approximately 80%) of the patients who have COVID-19 symptoms can overcome the illness without hospitalization. However, approximately 15% of the patients become severely sick and need oxygen and 5% of the patients require intensive care. The symptoms start on average 5–6 days after infection and can last from 1 to 14 days. According to the Centers for Disease Control and Prevention (CDC), people who have contact with coronavirus virus should remain in isolation and quarantine for at least 14 days to potentially stop the spread of the virus, especially when testing is not obtainable. The COVID-19 pandemic has caused a severe setback as the medical infrastructure is not capable to adequately handle the high patient counts and effectively combat this deadly disease. Reverse Transcription-Polymerase Chain Reaction (RT-PCR) is an accurate test which can identify whether a patient is infected by SARS-CoV-2 or not. Though, the test results are only available after 1–2 days, this delay in treatment can lead to loss of life or further spread of the diseases. Moreover, in rural areas the RT-PCR test is not yet widely available. In response, medical practitioners have opted for various other tests such as the Rapid Antigen Test (RAT) [6], chest X-rays, and CT scans in hopes of timely detection of the disease.
The Convolutional Neural Network (CNN) [7,8,9,10,11] is regarded as a deep neural network [12,13] that exhibits robust power in object detection, computer vision, image classification, and segmentation. It has recently been widely applied in order to detect important features from sequencing, gene expression, functional genomics, cell type context, and single cell data in biological and biomedical research [14,15,16,17,18]. RT-PCR tests have a large window of time from administration to results and possess low sensitivity and are therefore unable to provide desired results quickly enough in a pandemic situation such as COVID-19 [19]. Due to the unavailability of special kits needed by this test in some remote areas, RT-PCR tests cannot be easily implemented in COVID-19 detection in such locations [20]. Many existing research studies for COVID-19 detection use machine learning (ML) methods [21,22], pervasive computing, and the consideration of different symptoms of COVID-19 along with non-image-based datasets [23]. Some research article [24] also focused on the forecasting of COVID-19. But the development of CNN methods integrated with image analysis of CT scan and chest X-ray images [25] has been found to be more efficient in detecting COVID-19 status. CNN-based methods [26,27] and weighted extension algorithms have also been applied to detect virus integration sites in the host genomes as well as the trajectory of disease progression in COVID-19 patients [28,29]. In image data analysis, CNN [30] is seen as a tool containing powerful learning capabilities of fetching critical features from the images and discovering important patterns from image set [31,32]. In this paper, we employ different CNN architectures for detecting COVID-19 which uses CT scan and chest X-ray images.
The paper is organized in the following way. Section 2 consists of fundamental concepts and a literature review of existing research regarding COVID-19 detection. Section 3 provides dataset descriptions and Section 4 describes the architecture of CNN. Section 5 goes over the detailed technical aspects of the methods used in this research work. Section 6 describes the results with performance analysis and Section 7 contains the concluding remarks.

2. Related Works

In general, deep learning has expanded into the field of medical science and especially in image-based medical diagnosis. Convolutional neural networks have outperformed other conventional methods of image analysis [33,34,35,36]. Recently, many of these studies are concerned with COVID-19 detection.
COVID-19 detection was implemented by statistical modeling conducted on mined relevant data [37,38,39]. The authors in [40] developed a mathematical model for forecasting coronavirus rates in the population. Such research studies are unable to provide prolific results with higher accuracy in the case of COVID-19 detection. Additionally, CNN accompanied by the CT scan images and chest X-ray images were applied in order to detect COVID-19. Areej A. Wahab Ahmed Musleh and Ashraf Yunis Maghari [34] experimented with a convolutional neural network-based algorithm named CheXNet developed by Stanford University for diagnosing and detecting pneumonia from the chest X-rays. They used 550 chest X-ray images from the Kaggle website and achieved a prediction accuracy of 89.7%. Huda Khaloofi et al. [41] investigated various machine learning approaches to predict COVID-19 using online datasets. They explained the life cycle as well as the spread of COVID-19 disease in Saudi Arabia with associated performance analysis. Brunese et al. [42] employed COVID-19 detection by dint of a deep learning algorithm which was comprised of three phases. According to the authors of this research study, the first phase dealt with the existence of pneumonia from chest X-rays whereas the second phase was applied in order to discriminate COVID-19 from pneumonia. The third phase was concerned with the detection of the body region affected by COVID-19. Their research could achieve 98% accuracy for COVID-19 detection. D. Haritha et al. [43] predicted COVID-19 disease efficiently using the VGG model based on transfer learning. They developed a system for identifying coronavirus disease which used chest X-ray photographs. Suraj Bodapati et al. [44] described a forecasting methodology for the COVID-19 outbreak. Their research study used Long Short-Term Memory (LSTM) models to determine several verified cases and the various death cases. Shah et al. in [45] proposed a model named as CTnet-10 with a view to diagnose COVID-19 using CT scan images. Their proposed CTnet had an accuracy 82.1% and required the lowest amount of time for predicting COVID-19 compared to the prediction time taken by VGG and Inception V3. A Keles et al. in [46] developed inference engines, namely COV19-ResNet, with an accuracy of 97.61% and COV19-CNN having an accuracy 94.28%, both using ResNet for COVID-19 detection. The authors of [47] adopted Artificial Intelligence (AI)-based methods for identifying and analyzing COVID-19 cases. They performed their study using pulmonary CT images. I. D. Apostolopoulos and T. A. Mpesiana [48] applied the approach of transfer learning for identifying COVID-19 disease with an accuracy of 96.78%. The authors in [49] used chest X-ray photographs to perform simulation experiments. They employed the concept of transfer learning and reported a high degree of accuracy, sensitivity, and specificity (96.78%, 98.66%, and 96.46%, respectively) to extract an important biomarker concerning COVID-19 and predict COVID-19. The authors in [50] applied the approaches of deep learning on chest X-ray images and also incorporated the principle of fine tuning to train the model for the purpose of detecting COVID-19. In this research article, they obtained a maximum of 92.6% average accuracy in the process of COVID-19 detection. Wang et al. [25] designed model COVID-Net considering chest X-ray images and this designed model achieved positive predictive value up to 98.9%. The authors of [51] proposed a model endowed with the principles of CNN to achieve an average of 96.8% in the detection of COVID-19. Jain et al. [52] achieved 97.77% accuracy in COVID-19 detection by deep learning on chest X-ray images. A hybrid deep neural network along with CT images and chest X-ray images for the prediction of COVID-19 was mentioned with an accuracy of up to 99% [53].
Existing research studies apply the principles of CNN but only focus heavily on the accuracy for providing acceptable results in the context of COVID-19 detection. However, accuracy is not the only reliable and appropriate performance measuring metric as it may yield misleading outcomes in accordance with the variation in the number of samples [54]. On the other hand, the F-measure is considered a more reliable and effective performance evaluating metric than accuracy for comparing classifiers due to its ability to provide an improved insight into the operations of classifiers [55,56,57,58,59]. RMSE and kappa statistic are powerful performance measuring metrics [60,61,62,63,64,65] and such metrics were not considered in previous papers to reveal the supremacy of their proposed models for COVID-19 detection. The proposed research work here deals with various powerful metrics such as F-measure, RMSE, and kappa statistic in order to detect COVID-19. Consideration of the aforesaid metrics is an integral aspect of this work. Achievement of good recall value indicates lower false negatives which in turn proves that our model is free from over-fitting. This indeed is the major novelty of our proposed work. Employment of the principles of hypermeter tuning, testing on an ample amount of dataset samples, and also the achievement of significant performance of our proposed framework in a lower number of epoch sizes are also important distinctive features of this work.

3. Dataset Description

This communication aims to develop and propose a generalized and robust model for the efficient detection of the disease. The benchmarking of the proposed methodology has been achieved using three different datasets.
The first dataset [66,67] used for validating this research work is comprised of 707 X-ray images and has three class labels: normal, COVID-19, and PNEUMONIA.
The second dataset [68] used in this study is Extensive COVID-19 X-ray and CT scan images and contains 5863 data values. The third dataset [69] provided by Mendeley Data consists of 16,490 images of both X-ray and CT scan images. Sample X-ray images and CT scan images acquired from such three benchmark imagery datasets [66,67,68,69] are displayed in Figure 1 and Figure 2 respectively.

4. Architecture of CNN Model

CNN models are the most used deep learning (DL) methods, specifically in computer vision-related applications. Since CNN possesses both an accurate discrimination ability and good feature generation, this study uses deep CNN-based classification models on Chest X-ray and CT scan images to identify COVID-19. The block diagram of CNN architecture for an input image (Chest X-ray or CT scan image) is presented in Figure 3 below.
A CNN model automatically learns spatial feature hierarchies (horizontal, vertical, lines, etc.) via backpropagation algorithm which uses multiple building blocks, such as convolutional layers, pooling layers, as well as fully connected layers. The different layers in the CNN model are:
A.
Convolutional Layer;
B.
Pooling Layer;
C.
Fully Connected Layer (FC layer).
The CNN architectural model usually consists of alternate layers of convolution and pooling accompanied by one or more FC layers at the end.
A. 
Convolutional Layer: The first layer in the CNN architecture is the convolutional layer. It consists of a set of convolutional kernels (i.e., filters) where each neuron performs as the kernel. Here, the mathematical operation of convolution is accomplished between the input image and a filter of a specific size M × M. Convolution operation of a feature matrix can be expressed as follows:
f d c ( s , t ) = k a , b i k   ( a , b ) .   e d c ( m , n )  
where i k   ( a , b ) denotes an element ( a , b ) of the input image tensor   I k , which is element wise multiplied by e d c ( m , n ) index of the cth convolutional kernel of the dth layer; here f d c ( s , t ) denotes the (s, t) element of the feature matrix concerning cth kernel of dth layer. Finally, the output feature-map F d   c of the cth convolutional operation on the dth neuron can be represented as:
F d   c = [ f d   c ( 1 , 1 ) , ,   f d   c ( s , t ) , ,   f d   c ( S , T ) ]  
In Equation (2), S denotes the total number of rows of the feature matrix and T denotes the total number of columns of the feature matrix.
The resulting output is called the feature map and it provides information about the image such as the corners and edges. The feature map is then fed to further layers to learn several other characteristics of the input image.
The selection of a particular activation function is critical in the decision-making process. There are many unique activation functions, such as ReLU, SWISH, MISH, tanh, sigmoid, maxout, etc., which can be utilized to attain non-linear grouping of features. Equation (3) defines the activation function of a convolved feature-map as follows:
T d   c = g a ( F d c )  
In the above equation, F d   c is the resulting output of a convolution network that is allotted to an activation function   g a ( . ) . It basically adds non-linearity and produces a transformed output T d   c for the cth layer;
B. 
Pooling Layer: Generally, a pooling layer comes after a convolutional layer. The primary goal of this layer is to reduce the size of the feature map generated by convolution to decrease the computational costs. It is executed by reducing the connections between layers and separately operating on each feature map.
Basically, pooling is a local operation that adds up identical information in the region of the receptive field and results in the dominant response within this local region. This operation is described in Equation (4):
  Z d   c = g p ( F d c )
Here, Z d   c signifies the pooled feature-map of dth layer for cth input feature-map   F d   c and g p ( . ) outlines the type of pooling operation.
Different types of pooling functions such as max, average, etc., can be used in CNNs. In case of max pooling, the biggest element is selected from the feature map. The average pooling computes the average of the components in an image portion of predefined size. This layer generally connects the convolutional layer and the FC layer. Here, we have used the max pooling function;
C. 
Fully Connected Layer (FC Layer): This layer contains weights and biases associated with the neurons and is utilized to connect the neurons between two separate layers. These layers are normally located prior to the output layer in a CNN Architecture.
Here, the input image from the preceding layers is flattened and normally fed to the FC layer. The flattened vector then goes through a few more FC layers where the mathematical functions are applied. In this stage, the classification procedure is about to take place. In spite of having some mapping functions, several regulatory units such as dropout and batch normalization are also included to enhance CNN performance. Batch normalization basically unifies the distribution of feature-map values by assigning them to mean zero and unit variance, thereby refining the generalization of the neural network. However, dropout presents regularization within the neural network, which eventually progresses generalization by avoiding several units or connections randomly with a specific probability value.

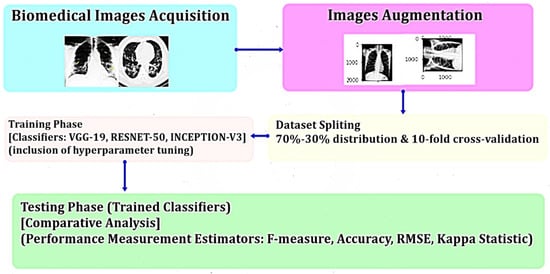
5. Materials and Methods

This section explores the detailed description of our proposed framework regarding COVID-19 detection. This research study has designed a generalized detection framework, as shown in Figure 4, describing the entire process of this experiment.
The acquirement of the data images from the aforementioned imagery datasets (Dataset 1 (formed on X-ray images), Dataset 2 (formed on X-ray images), and Dataset 3 (formed on CT scan images)) denotes the commencement of the framework proposed in this research work. Such images are passed on to the pre-processing module of the proposed framework that is standardized and allows for the integration of the data from the various datasets to carry out various pre-processing mechanisms for improving the accuracy and performance of our proposed architecture. As a part of image pre-processing, data augmentation was employed in order to improve the amount of data available during training and to incorporate diversity into the training data that helps to overcome the problem of overfitting. The data augmentation technique in this work consists of flip augmentation and rotation augmentation which increase the number of data samples. The state of images after performing augmentation and transformation is shown in the following figures (Figure 5 and Figure 6).
The other preprocessing steps used during model building are reducing the size of images, cropping the image, flipping, rotating, and rescaling which helped in creating variances which lead towards building a stable end-model. After data pre-processing, dataset splitting commences and during this phase, the datasets are divided into two different parts—training datasets and test datasets. Each dataset is divided into training and test datasets using a 70%–30% distribution and K-fold cross-validation (K = 10).
The present research performs the tuning process of three existing models, namely VGG-19, ResNet-50, and Inception-V3 during the training process thereby producing superior results with a view to detect COVID-19. The VGG-19 is a 19-layer convolutional neural network architecture (including 16 convolution layers, 3 fully connected layers, 5 MaxPool layers, and 1 SoftMax layer). The prime objective of developing this network is to increase the number of hidden layers while sinking the number of parameters. In this architecture, a fixed kernel size of 3 × 3 is perceived, and as the progress along the network is achieved, the number of kernels continues enhancing in the hopes of a better feature. ResNet-50 containing 50 layers is a deep residual network. A residual function along with traditional CNN is used by ResNet-50 to solve the problem of gradient dispersion and accuracy degradation. If the process of the addition of a number of layers in our network is continued, during backpropagation, the model will not be able to spread the weight changes due to gradient explosion or dissipation. The ResNet-50 model comprises of five stages, each with a residual block. These residual blocks are responsible for keeping parameters as low as possible. This provides better training and testing errors even if the network depth increases and provides regularization. Hence, ResNet-50 is regarded as the most popular CNN architecture in terms of image classification. Inception-V3 architecture follows the concept of factorized convolutional which reduces computational efficiency. The reduction in the filter size helps in achieving a faster training speed thereby minimizing the number of parameters. This model includes auxiliary classifiers which act as regularizers and are employed to ensure convergence of very deep neural networks. An auxiliary classifier is added in between the layers during training and the losses incurred are added back to the main network. Inception-V3 is effective for smoothing labels of image and acquiring higher accuracy in image classification. As the proposed framework is represented for detecting COVID-19 via chest X-ray images and CT scan images, the training phase deals with such aforementioned models for image classification.
The training phase of this research work includes hyperparameter tuning in the existing models such as VGG-19, Resnet-50, and Inception V3 to achieve adequate results during the testing phase. The first parameter that was tuned is the number of neurons. Three different activation functions namely ReLu, Leaky Relu for avoiding the function from becoming saturated at 0, and the activation function softmax responsible for predicting a multinomial probability distribution were employed and the input values moving from a layer to another layer is kept changing according to the activation function. The two parameters, namely rho and epsilon in adaDelta, were tuned for performance efficiency. The tuning process also involves the usage of optimizers in order to modify the attributes of the neural network such as weights and learning rate thereby enhancing the proficiency of producing minimizing losses. Adam optimizer, momentum-based SGD, and adaDelta were applied while training VGG-19, Resnet-50, Inception-V3, and adam optimizer were found to be the best optimizers.
After the successful completion of the training phase, the performance of each of the trained classifiers incorporated in this research work were evaluated according to various statistical performance metrics including accuracy, kappa statistics, recall, F-measure, etc., and the comparative analysis among these classifiers provides enhanced results with respect to COVID-19 detection.

6. Results and Discussion

The classification models, namely, VGG-19, Inception V3, and ResNet-50, are trained employing the principle of tuning and then tested on three datasets using the Google Colaboratory (Tesla T4, CUDA Version: 11.2). The imagery benchmark datasets used in this research work are divided into two parts, one for training purposes and the other one for testing purposes. A 70%–30% distribution of each of these datasets was employed in this work. A 10-fold cross-validation technique for such datasets is also taken to evaluate the performance of each of such distinct classifiers which are tuned during the training phase. A variety of evaluation metrics are employed to measure the performance in the experiments, including Root-Mean-Square Error (RMSE) [70], Kappa Statistic [71], True Positive Rate (TP-Rate), recall, False Positive Rate (FP-Rate), accuracy, precision, and F-measure. In essence, accuracy, precision, True Positive Rate (TP-Rate), False Positive Rate (FP-Rate), Recall, and F-measure are derived from the confusion matrix [72] of the individual classifier.
It is to be noted that optimal performance for each of the trained classifiers is achieved after 40 epochs though this performance comparison scheme proposed in this research work provides test results of each of these classifiers for 10, 20, and 30 epochs. The Supplementary Materials contain the test results considering 10, 20, and 30 epochs. Performance analysis is comprised of two parts. The first part describes the performance comparisons of the classifiers developed on different evaluation measures such as accuracy, weighted kappa statistic, and root-mean-square error (RMSE). Meanwhile, the second part deals with performance comparisons of each individual classifier with respect to TP-Rate/Recall, FP-Rate, precision, and F-measure. Standard deviation is also presented in the test results. The detailed descriptions of these statistical metrics which are used as tools for measuring performance are provided below.

6.1. Root-Mean-Square Error (RMSE)

The RMSE assessment metric indicates a measure of the difference between the classifier prediction value and the target output value of the classification model. The RMSE system of measurement of a model implies the square root of the mean-squared inaccuracy:
R M S E = k 1 n ( e d i s c o v e r e d ,   k e c l a s s i f i e r , k   ) 2 n .
Here, e d i s c o v e r e d is the target value and e c l a s s i f i e r is the predicted value for   k .

6.2. Kappa Statistic

The kappa statistic denoted by k is a popular evaluation metric in statistics. It indicates the relative measure of reliability within different judges or evaluators. The subsequent equation reckons the value of k as:
k = p r o b ( O ) p r o b ( C ) 1 p r o b ( C )
Here, p r o b ( O )   is the probability of perceived agreements amongst the evaluators and p r o b ( C ) is the probability of agreements expected by coincidence. If k = 1, then the evaluators have supported each other’s judgment. If k = 0, then the evaluators do not reach agreement.
Using 40 epochs, it is observed that the VGG-19 classifier is responsible for providing accuracy of 87.45%, 85.91%, and 88.76% as presented in Table 1, Table 2 and Table 3, respectively, with respect to 70%–30% distribution of employed data and 88.35%, 88.12%, and 89.34% for 10-fold cross-validation according to the results mentioned in these tables.
On the other hand, the accuracy of the ResNet-50 model lies between 93.9% and 95.64% with respect to the 70%–30% distribution and between 96.8% and 97.61% for the 10-fold cross-validation concerning 40 epochs as shown in Table 1, Table 2 and Table 3. The accuracy of Inception-V3 for such three benchmark datasets regarding 40 epochs ranges from 95.62% to 96.48% for the 70%–30% distribution and from 99.2% to 99.36% utilizing the 10-fold cross-validation in accordance with the results presented in these tables. The performance of employed classifiers in this research work in accordance with accuracy for these three datasets regarding 40 epochs is revealed by Figure 7 and it also represents that Inception-V3 possesses supremacy over VGG-19 and Resnet-50 for accuracy taking such employed datasets into consideration. RMSE and kappa statistic are also regarded as powerful metrics to compare various classifiers. To achieve decent performance of a classifier, RMSE should be lowest comparing RMSE of other classifiers taken into account. Previous research articles for COVID-19 detection did not account for RMSE and kappa statistic to prove the superiority of their proposed work. However, this work emphasized RMSE as a comparative measuring metric to differentiate the performance of employed classification models. Table 1, Table 2 and Table 3 reveal the dominance of Inception-V3 as it provides the lowest RMSE comparing the RMSEs provided by VGG-19 and ResNet-50. The lowest RMSE possessed by Inception-V3 for these employed datasets indicates its superiority, as depicted in Figure 8. Table 1, Table 2 and Table 3 denote a variation between 0.8–1.0 showing “almost perfect agreement” for kappa statistic values and exhibiting the superiority of Inception-V3 over VGG-19 and Resnet-50 with respect to these performance-evaluating metrics used in the testing phase. Figure 9 also represents the better performance of Inception-V3 than other two utilized classifiers in this proposed work. Formulated on the kappa statistic values of different classifiers utilized to classify the datasets, Inception-V3 produces a reasonably better outcome compared to ResNet-50 and VGG-19.
The second part of this section explores the performance comparisons of the aforementioned classifiers developed on various statistical performance estimators including TP-Rate/Recall, FP-Rate, precision, and F-measure. TP-Rate/Recall, Precision, FP-Rate, and F-Measure values are evaluated from the confusion matrix of individual classifiers.

6.3. Confusion Matrix

In machine learning, the confusion matrix is a certain tabular representation that shows a classification algorithm’s performance. This offers a more comprehensive analysis compared to accuracy. Each column of the matrix signifies the patterns in the expected data class whereas every row specifies the patterns in the obvious class. Table 4 below shows a confusion matrix using a two-class classifier with the subsequent cells as:
True-Positive (TP) indicates the number of ‘positive’ examples classified as ‘positive.’
False-Positive (FP) implies the number of ‘negative’ examples classified as ‘positive.’
False-Negative (FN) denotes the number of ‘positive’ examples classified as ‘negative.’
True-Negative (TN) means the number of ‘negative’ examples classified as ‘negative.’
A two-class confusion matrix identifies several standard terms. The accuracy (i.e., classification accuracy) is the sum of the correctly classified samples divided by the total number of samples present. The following equation calculates this as:
A c c u r a c y = T P + T N T P + T + N + F P + F N
The precision denotes the ratio of the predicted positive samples discovered to be correct, as calculated using the following equation:
P r e c i s i o n = T P T P + F P
The FP-Rate (i.e., False-Positive Rate) indicates the ratio of negative examples incorrectly classified as positive, as given by the equation:
F P R a t e = F P F P + T N  
The TP-Rate (i.e., True-Positive Rate) or recall is the ratio of positive samples discovered correctly, as assessed using the equation:
T P R a t e = R e c a l l = T P T P + F N
A large precision value is occasionally more applicable while sometimes a large recall value is more obvious. However, in the most presentations, the objective is to increase both values.
The cohesive arrangement of these values is the f-measure and usually formulated as a harmonic mean of both the values:
F m e a s u r e = 2 P r e c i s i o n R e c a l l P r e c i s i o n + R e c a l l
Table 5, Table 6 and Table 7 display performances with respect to the aforementioned diverse metrics for datasets 1, 2, and 3, respectively. For evaluating the performance of a classifier, it is desirable to obtain greater precision, recall, TP-rate, and F-measure values but a smaller FP-rate value. The F-measure is generally considered a balanced metric and is often used as the most important single metric. Inception-V3 classifier finds the F-measure values of 95.25%, 96.47%, and 96.11% utilizing 70%–30% distribution for dataset 1, dataset 2, and dataset 3, respectively, and 98.86%, 98.84%, and 99.19% employing 10-fold cross-validation as shown in Table 5, Table 6 and Table 7, respectively. In contrast to this, the F-measure value of ResNet-50 model ranges from 93.55% to 95.27% applying 70%–30% distribution and from 96.61% to 97.52% applying a 10-fold cross-validation, as VGG-19 possesses F-measure values varying between 85.54% and 88.39% for the 70%–30% distribution and from 87.98% to 88.97% for the 10-fold cross-validation as exposed in Table 5, Table 6 and Table 7.
Figure 10 establishes that the Inception-V3 classifier produces a superior performance compared to the other classifiers with respect to the F-measure. The Inception-V3 model has the largest values for accuracy, precision, kappa statistic, TP-Rate/Recall, and F-measure and the smallest values for FP-rate and RMSE. In fact, Inception-V3 overtakes ResNet-50 and VGG-19 classifiers concerning all these performance estimators being applied.
This section explores comparison between the state-of-the-art methods and the proposed framework in accordance with F-measure for the three imagery benchmark datasets employed in this work. Several previous research works have emphasized accuracy as the most accurate paradigm for comparative study and the accuracy level is not only a sufficient and reliable performance measurement tool. Though such current research articles provide enhanced results, as depicted in Figure 11, proposed research work has acquired improvements to their results for the same datasets. Instead of accuracy measurement, the research work proposed in this paper highlights the F-measure as a strong and appropriate performance comparing tool. Figure 11 reveals the superior performance of the proposed framework which possesses better F-measure values 98.86%, 98.84%, and 99.19% for dataset 1 and dataset 2 to some current research techniques employing the aforesaid three imagery benchmark datasets.

7. Conclusions

The research study presents an application of Convolutional Neural Network models in the field of human health, specifically the detection of patients’ COVID-19 status using chest X-ray and CT scan imagery datasets. This work proposes to set and tune parameters, and also implement three models, VGG-19, ResNet-50, and Inception-V3 because these models seem to be efficient at feature extraction as well as image classification. We then validate our results using various performance estimators such as accuracy, RMSE, kappa statistic, F-measure, recall, precision, etc., for various epoch sizes. This research article emphasizes the F-measure as the best evaluating metric obtained from a confusion matrix for comparing the performances of these trained models with some of the current, related research articles and reveals the superiority of the proposed framework. It also accounts for RMSE and kappa statistic to prove its improved and efficient performance for predicting COVID-19 compared to existing research articles in this regard. The Inception-V3 model has an F-measure value of 98.86% using the dataset 1, 98.84% using the dataset 2, and 99.19% using the dataset 3, considering 40 epochs. These resulting outcomes are significantly better (F-measure > 98% (approximately), all three datasets) compared to other models. Considering the three standard datasets, the Inception-V3 model also has the smallest FP-Rate values and the greatest recall values compared to other classifiers. This research work aims to diminish the number of false negatives thereby obtaining a higher recall and builds a classification model which is free from overfitting and a stable model for COVID-19 prediction. The performance analysis based on various diverse metrics including RMSE and kappa statistic of this work also suggests a robust and generic framework for detecting this kind of disease. Though some previous works employed the concept of hyper tuning, they focused heavily on accuracy to detect the status of COVID-19. Consideration of various strong metrics along with classification accuracy in our proposed work show the novelty of this work. Development of an integrated model endowed with the capability of providing an optimal outcome considering the best combination of parameter tuning, concerning both a deep learning model and biological model (from multi-omics data), is the possible future directive.

Supplementary Materials

The following supporting information can be downloaded at: https://www.mdpi.com/article/10.3390/app122110787/s1, File S1: Performance of classifiers for dataset 1; File S2: Performance of classifiers for dataset 2; File S3: Performance of classifiers for dataset 3.

Author Contributions

Conceived and designed the experiments: S.G., S.B. and S.D. Execution of the experiments: S.G. and S.B. Data analysis: S.G., S.D. and A.H. Manuscript writing: S.D., A.H., S.M., Z.Z. and A.M. All authors have read and agreed to the published version of the manuscript.

Funding

Z.Z. was partially supported by the Precision Health Chair Professorship fund. The funder had no role in the study design, data collection and analysis, decision to publish, or preparation of the entire manuscript.

Institutional Review Board Statement

Not applicable.

Informed Consent Statement

Not applicable.

Acknowledgments

We thank Rastko Stojsin for proofreading the manuscript. All authors have read and approved the manuscript.

Conflicts of Interest

The authors declare no conflict of interest.

References

  1. Fan, Y.; Zhao, K.; Shi, Z.L.; Zhou, P. Bat Coronaviruses in China. Viruses 2019, 11, 210. [Google Scholar] [CrossRef] [PubMed] [Green Version]
  2. Woo, P.C.; Huang, Y.; Lau, S.K.; Yuen, K.Y. Coronavirus Genomics and Bioinformatics Analysis. Viruses 2010, 2, 1804–1820. [Google Scholar] [CrossRef] [PubMed] [Green Version]
  3. World Health Organization. Coronavirus Disease (COVID-19) Pandemic. Available online: https://www.who.int/emergencies/diseases/novel-coronavirus-2019 (accessed on 24 January 2021).
  4. Definition of Coronavirus by Merriam-Webster. Merriam-Webster Dictionary. Available online: https://www.merriam-webster.com/dictionary/coronavirus (accessed on 24 January 2021).
  5. Yazdanpanah, F.; Hamblin, M.R.; Rezaei, N. The immune system and COVID-19: Friend or foe? Life Sci. 2020, 256, 117900. [Google Scholar] [CrossRef]
  6. Yoon, S.J.; Seo, K.W.; Song, K.H. Clinical evaluation of a rapid diagnostic test kit for detection of canine coronavirus. Korean J. Vet. Res. 2018, 58, 27–31. [Google Scholar] [CrossRef]
  7. Krizhevsky, A.; Sutskever, I.; Hinton, G.E. ImageNet classification with deep convolutional neural networks. Adv. Neural Inf. Process. Syst. 2012, 60, 1106–1114. [Google Scholar] [CrossRef] [Green Version]
  8. Ciregan, D.; Meier, U.; Schmidhuber, J. Multi-column deep neural networks for image classification. In Proceedings of the 2012 IEEE Conference on Computer Vision and Pattern Recognition, Providence, RI, USA, 16–21 June 2012; pp. 3642–3649. [Google Scholar]
  9. Zeiler, M.D.; Fergus, R. Visualizing and understanding convolutional networks. In European Conference on Computer Vision; Springer: Cham, Denmark, 2014; pp. 818–833. [Google Scholar]
  10. Sermanet, P.; Eigen, D.; Zhang, X.; Mathieu, M.; Fergus, R.; LeCun, Y. OverFeat: Integrated Recognition. Localization Detection using Convolutional Networks. arXiv 2013, arXiv:1312.6229. [Google Scholar] [CrossRef]
  11. Li, K.; Lin, J.; Liu, J.; Zhao, Y. Using Deep Learning for Image-Based Different Degrees of Ginkgo Leaf Disease Classification. Information 2020, 11, 95. [Google Scholar] [CrossRef] [Green Version]
  12. Mallik, S.; Seth, S.; Bhadra, T.; Zhao, Z. A linear regression and deep learning approach for detecting reliable genetic alterations in cancer using dna methylation and gene expression data. Genes 2020, 11, 931. [Google Scholar] [CrossRef]
  13. Sharma, P.; Balabantaray, B.K.; Bora, K.; Mallik, S.; Kasugai, K.; Zhao, Z. An ensemble-based deep convolutional neural network for computer-aided polyps identification from colonoscopy. Front. Genet. 2022, 13. [Google Scholar] [CrossRef]
  14. Pei, G.; Yan, F.; Simon, L.M.; Dai, Y.; Jia, P.; Zhao, Z. deCS: A tool for systematic cell type annotations of single-cell RNA sequencing data among human tissues. Genom. Proteom. Bioinform. 2022. [Google Scholar] [CrossRef]
  15. Pei, G.; Hu, R.; Dai, Y.; Manuel, A.M.; Zhao, Z.; Jia, P. Predicting regulatory variants using a dense epigenomic mapped CNN model elucidated the molecular basis of trait-tissue associations. Nucleic Acids Res. 2021, 49, 53–66. [Google Scholar] [CrossRef] [PubMed]
  16. Jia, P.; Hu, R.; Pei, G.; Dai, Y.; Wang, Y.; Zhao, Z. Deep generative neural network for accurate drug response imputation. Nat. Commun. 2021, 12, 1740. [Google Scholar] [CrossRef]
  17. Simon, L.M.; Wang, Y.; Zhao, Z. Integration of millions of transcriptomes using batch-aware triplet neural networks. Nat. Mach. Intell. 2021, 3, 705–715. [Google Scholar] [CrossRef]
  18. Ghosh, S.; Mondal, S.; Ghosh, B. A comparative study of breast cancer detection based on SVM and MLP BPN classifier. In Proceedings of the 2014 First International Conference on Automation, Control, Energy and Systems (ACES), Adisaptagram, India, 1–2 February 2014; pp. 1–4. [Google Scholar]
  19. Fang, Y.; Zhang, H.; Xie, J.; Lin, M.; Ying, L.; Pang, P.; Ji, W. Sensitivity of chest CT for COVID-19: Comparison to RT-PCR. Radiology 2020, 296, E115–E117. [Google Scholar] [CrossRef] [PubMed]
  20. Madaan, V.; Roy, A.; Gupta, C.; Agrawal, P.; Sharma, A.; Bologa, C.; Prodan, R. XCOVNet: Chest X-ray image classification for COVID-19 early detection using convolutional neural networks. New Gener. Comput. 2021, 39, 583–5971. [Google Scholar] [CrossRef]
  21. Bhadra, T.; Mallik, S.; Sohel, A.; Zhao, Z. Unsupervised Feature Selection Using an Integrated Strategy of Hierarchical Clustering with Singular Value Decomposition: An Integrative Biomarker Discovery Method with Application to Acute Myeloid Leukemia. IEEE/ACM Trans. Comput. Biol. Bioinform. 2022, 19, 1354–1364. [Google Scholar] [CrossRef] [PubMed]
  22. Ghosh, S.; Biswas, D.; Biswas, S.; Sarkar, D.C.; Sarkar, P.P. Soil classification from large imagery databases using a neuro-fuzzy classifier. Can. J. Electr. Comput. Eng. 2016, 39, 333–343. [Google Scholar] [CrossRef]
  23. Akinnuwesi, B.A.; Fashoto, S.G.; Mbunge, E.; Odumabo, A.; Metfula, A.S.; Mashwama, P.; Uzoka, F.M.; Owolabi, O.; AutOkpeku, M.; Amusa, O.O. Application of intelligence-based computational techniques for classification and early differential diagnosis of COVID-19 disease. Data Sci. Manag. 2021, 4, 10–18. [Google Scholar] [CrossRef]
  24. Petropoulos, F.; Makridakis, S. Forecasting the novel coronavirus COVID-19. PLoS ONE 2020, 15, e0231236. [Google Scholar] [CrossRef]
  25. Wang, L.; Lin, Z.Q.; Wong, A. COVID-net: A tailored deep convolutional neural network design for detection of COVID-19 cases from chest X-ray images. Sci. Rep. 2020, 10, 19549. [Google Scholar] [CrossRef]
  26. Simonyan, K.; Zissermanm, A. Two-stream convolutional networks for action recognition in videos. Adv. Neural Inf. Process. Syst. 2014, 27. [Google Scholar]
  27. Lundervold, A.S.; Lundervold, A. An overview of deep learning in medical imaging focusing on MRI. Z. Für Med. Phys. 2019, 29, 102–127. [Google Scholar] [CrossRef]
  28. Xu, H.; Jia, P.; Zhao, Z. DeepVISP: Deep learning for virus site integration prediction and motif discovery. Adv. Sci. 2021, 8, 2004958. [Google Scholar] [CrossRef] [PubMed]
  29. Jeong, H.H.; Jia, J.; Dai, Y.; Simons, L.M.; Zhao, Z. Investigating cellular trajectories in the severity of COVID-19 and their transcriptional programs using machine learning approaches. Genes 2021, 12, 635. [Google Scholar] [CrossRef] [PubMed]
  30. Das, S.; Ghosh, S.; Mallik, S.; Qin, G. Feature Selection, Machine Learning and Deep Learning Algorithms on Multi-Modal Omics Data. In Artificial Intelligence Technologies for Computational Biology; CRC Press: Boca Raton, FL, USA, 2021; pp. 305–322. [Google Scholar] [CrossRef]
  31. Kang, Y.; Cho, N.; Yoon, J.; Park, S.; Kim, J. Transfer Learning of a Deep Learning Model for Exploring Tourists’ Urban Image Using Geotagged Photos. ISPRS Int. J. Geo-Inf. 2021, 10, 137. [Google Scholar] [CrossRef]
  32. Liu, X.; Liang, J.; Wang, Z.-Y.; Tsai, Y.-T.; Lin, C.-C.; Chen, C.-C. Content-Based Image Copy Detection Using Convolutional Neural Network. Electronics 2020, 9, 2029. [Google Scholar] [CrossRef]
  33. Ahmad, M. Ground truth labeling and samples selection for hyperspectral image classification. Optik 2021, 230, 166267. [Google Scholar] [CrossRef]
  34. Musleh, A.A.W.A.; Maghari, A.Y. COVID-19 detection in X-ray images using CNN algorithm. In Proceedings of the 2020 International Conference on Promising Electronic Technologies (ICPET), Jerusalem, Palestine, 16–17 December 2020; pp. 5–9. [Google Scholar]
  35. Yang, E.-H.; Amer, H.; Jiang, Y. Compression Helps Deep Learning in Image Classification. Entropy 2021, 23, 881. [Google Scholar] [CrossRef]
  36. Yang, X.; Zhang, X.; Ye, Y.; Lau, R.Y.K.; Lu, S.; Li, X.; Huang, X. Synergistic 2D/3D Convolutional Neural Network for Hyperspectral Image Classification. Remote Sens. 2020, 12, 2033. [Google Scholar] [CrossRef]
  37. Mengistie, T.T. COVID-19 outbreak data analysis and prediction modeling using data mining technique. Int. J. Comput. (IJC) 2020, 38, 37–60. [Google Scholar]
  38. Cortés-Martínez, K.V.; Estrada-Esquivel, H.; Martínez-Rebollar, A.; Hernández-Pérez, Y.; Ortiz-Hernández, J. The State of the Art of Data Mining Algorithms for Predicting the COVID-19 Pandemic. Axioms 2022, 11, 242. [Google Scholar] [CrossRef]
  39. Ahouz, F.; Golabpour, A. Predicting the incidence of COVID-19 using data mining. BMC Public Health 2021, 21, 1087. [Google Scholar] [CrossRef] [PubMed]
  40. Padmapriya, V.; Kaliyappan, M. Fuzzy fractional mathematical model of COVID-19 epidemic. J. Intell. Fuzzy Syst. 2022, Preprint, 1–23. [Google Scholar] [CrossRef]
  41. Khaloofi, H.; Hussain, J.; Azhar, Z.; Ahmad, H.F. Performance evaluation of machine learning approaches for COVID-19 forecasting by infectious disease modeling. In Proceedings of the 2021 International Conference of Women in Data Science at Taif University (WiDSTaif). Taif, Saudi Arabia, 30–31 March 2021; pp. 1–6. [Google Scholar]
  42. Brunese, L.; Mercaldo, F.; Reginelli, A.; Santone, A. Explainable deep learning for pulmonary disease and coronavirus COVID-19 detection from X-rays. Comput. Methods Programs Biomed. 2020, 196, 105608. [Google Scholar] [CrossRef] [PubMed]
  43. Haritha, D.; Praneeth, C.; Krishna, M. COVID Prediction from X-ray images. In Proceedings of the 2020 5th International Conference on Computing, Communication and Security (ICCCS), Patna, India, 14–16 October 2020; pp. 1–5. [Google Scholar]
  44. Bodapati, S.; Bandarupally, H.; Trupthi, M. COVID-19 time series forecasting of daily cases, deaths caused and recovered cases using long short term memory networks. In Proceedings of the IEEE 5th International Conference on Computing Communication and Automation (ICCCA), Greater Noida, India, 30–31 October 2020; pp. 525–530. [Google Scholar]
  45. Shah, V.; Keniya, R.; Shridharani, A.; Punjabi, M.; Shah, J.; Mehendale, N. Diagnosis of COVID-19 using CT scan images and deep learning techniques. Emerg. Radiol. 2021, 28, 497–505. [Google Scholar] [CrossRef]
  46. Keles, A.; Keles, M.B.; Keles, A. COV19-CNNet and COV19-ResNet: Diagnostic inference Engines for early detection of COVID-19. Cogn. Comput. 2021, 1–11. [Google Scholar] [CrossRef]
  47. Dong, D.; Tang, Z.; Wang, S.; Hui, H.; Gong, L.; Lu, Y.; Xue, Z.; Liao, H.; Chen, F.; Yang, F.; et al. The role of imaging in the detection and management of COVID-19: A review. IEEE Rev. Biomed. Eng. 2020, 14, 16–19. [Google Scholar]
  48. Apostolopoulos, I.D.; Mpesiana, T.A. COVID-19: Automatic detection from x-ray images utilizing transfer learning with convolutional neural networks. Phys. Eng. Sci. Med. 2020, 43, 635–640. [Google Scholar] [CrossRef] [Green Version]
  49. Abbas, A.; Abdelsamea, M.M.; Gaber, M.M. Classification of COVID-19 in chest X-ray images using DeTraC deep convolutional neural network. Appl. Intell. 2021, 51, 854–864. [Google Scholar] [CrossRef]
  50. Ismael, A.M.; Şengür, A. Deep learning approaches for COVID-19 detection based on chest X-ray images. Expert Syst. Appl. 2021, 164, 114054. [Google Scholar] [CrossRef]
  51. Ghaleb, M.S.; Ebied, H.M.; Shedeed, H.A.; Tolba, M.F. COVID-19 X-rays model detection using convolution neural network. In The International Conference on Artificial Intelligence and Computer Vision; Springer: Cham, Denmark, 2021; pp. 3–11. [Google Scholar]
  52. Jain, G.; Mittal, D.; Thakur, D.; Mittal, M.K. A deep learning approach to detect COVID-19 coronavirus with X-ray images. Biocybern. Biomed. Eng. 2020, 40, 1391–1405. [Google Scholar] [CrossRef] [PubMed]
  53. Irfan, M.; Iftikhar, M.A.; Yasin, S.; Draz, U.; Ali, T.; Hussain, S.; Bukhari, S.; Alwadie, A.S.; Rahman, S.; Glowacz, A.; et al. Role of hybrid deep neural networks (HDNNs), computed tomography, and chest X-rays for the detection of COVID-19. Int. J. Environ. Res. Public Health 2021, 18, 3056. [Google Scholar] [CrossRef] [PubMed]
  54. Ghosh, S.; Biswas, S.; Sarkar, D.; Sarkar, P.P. A novel Neuro-fuzzy classification technique for data mining. Egypt. Inform. J. 2014, 15, 129–147. [Google Scholar] [CrossRef] [Green Version]
  55. Mouawad, P.; Dubnov, T.; Dubnov, S. Robust detection of COVID-19 in cough sounds. SN Comput. Sci. 2021, 2, 34. [Google Scholar] [CrossRef] [PubMed]
  56. Mehbodniya, A.; Lazar, A.J.P.; Webber, J.; Sharma, D.K.; Jayagopalan, S.; Singh, P.; Rajan, R.; Pandya, S.; Sengan, S. Fetal health classification from cardiotocographic data using machine learning. Expert Syst. 2022, 39, e12899. [Google Scholar] [CrossRef]
  57. Powers, D.M. What the F-measure doesn’t measure: Features, Flaws, Fallacies and Fixes. arXiv 2015, arXiv:1503.06410. [Google Scholar]
  58. Hripcsak, G.; Rothschild, A.S. Agreement, the f-measure, and reliability in information retrieval. J. Am. Med. Inform. Assoc. 2005, 12, 296–298. [Google Scholar] [CrossRef]
  59. Liu, M.; Xu, C.; Luo, Y.; Xu, C.; Wen, Y.; Tao, D. Cost-sensitive feature selection by optimizing F-measures. IEEE Trans. Image Process. 2017, 27, 1323–1335. [Google Scholar] [CrossRef] [Green Version]
  60. Nadakinamani, R.G.; Reyana, A.; Kautish, S.; Vibith, A.S.; Gupta, Y.; Abdelwahab, S.F.; Mohamed, A.W. Clinical Data Analysis for Prediction of Cardiovascular Disease Using Machine Learning Techniques. Comput. Intell. Neurosci. 2022, 2973324. [Google Scholar] [CrossRef]
  61. Amin, M.N.; Ahmad, W.; Khan, K.; Ahmad, A.; Nazar, S.; Alabdullah, A.A. Use of Artificial Intelligence for Predicting Parameters of Sustainable Concrete and Raw Ingredient Effects and Interactions. Materials 2022, 15, 5207. [Google Scholar] [CrossRef]
  62. Toisoul, A.; Kossaifi, J.; Bulat, A.; Tzimiropoulos, G.; Pantic, M. Estimation of continuous valence and arousal levels from faces in naturalistic conditions. Nat. Mach. Intell. 2021, 3, 42–50. [Google Scholar] [CrossRef]
  63. Foody, G.M. Explaining the unsuitability of the kappa coefficient in the assessment and comparison of the accuracy of thematic maps obtained by image classification. Remote Sens. Environ. 2020, 239, 111630. [Google Scholar] [CrossRef]
  64. Afolayan, A.H.; Ojokoh, B.A.; Adetunmbi, A.O. Performance analysis of fuzzy analytic hierarchy process multi-criteria decision support models for contractor selection. Sci. Afr. 2020, 9, e00471. [Google Scholar] [CrossRef]
  65. Kranjčić, N.; Medak, D.; Župan, R.; Rezo, M. Support vector machine accuracy assessment for extracting green urban areas in towns. Remote Sens. 2019, 11, 655. [Google Scholar] [CrossRef] [Green Version]
  66. COVID Chest X-ray Dataset. Available online: https://github.com/ieee8023/COVID-chestxray-dataset (accessed on 22 September 2021).
  67. COVID Chest X-ray Dataset. Available online: https://github.com/agchung (accessed on 22 September 2021).
  68. COVID Chest X-ray Dataset. Available online: https://www.kaggle.com/paultimothymooney/chest-xray-pneumonia (accessed on 19 September 2021).
  69. El-Shafai, W.; El-Samie, F.A. Extensive COVID-19 X-ray and CT chest images dataset. Mendeley Data 2020, 3. [Google Scholar] [CrossRef]
  70. Armstrong, J.S.; Collopy, F. Error measures for generalizing about forecasting methods: Empirical comparisons. Int. J. Forecast. 1992, 8, 69–80. [Google Scholar] [CrossRef] [Green Version]
  71. Carletta, J. Assessing agreement on classification tasks: The kappa statistic. arXiv 1996, arXiv:cmp-lg/9602004. [Google Scholar] [CrossRef]
  72. Stehman, S.V. Selecting and interpreting measures of thematic classification accuracy. Remote Sens. Environ. 1997, 62, 77–89. [Google Scholar] [CrossRef]
  73. Ozturk, T.; Talo, M.; Yildirim, E.A.; Baloglu, U.B.; Yildirim, O.; Acharya, U.R. Automated detection of COVID-19 cases using deep neural networks with X-ray images. Comput. Biol. Med. 2020, 121, 103792. [Google Scholar] [CrossRef]
  74. Panwar, H.; Gupta, P.K.; Siddiqui, M.K.; Morales-Menendez, R.; Bhardwaj, P.; Singh, V. A deep learning and grad-CAM based color visualization approach for fast detection of COVID-19 cases using chest X-ray and CT-Scan images. Chaos. Solitons Fractals 2020, 140, 110190. [Google Scholar] [CrossRef]
  75. Khan, A.I.; Shah, J.L.; Bhat, M.M. CoroNet: A deep neural network for detection and diagnosis of COVID-19 from chest x-ray images. Comput. Methods Programs Biomed. 2020, 196, 105581. [Google Scholar] [CrossRef] [PubMed]
  76. Waheed, A.; Goyal, M.; Gupta, D.; Khanna, A.; Al-Turjman, F.; Pinheiro, P.R. Covidgan: Data augmentation using auxiliary classifier gan for improved COVID-19 detection. IEEE Access 2020, 8, 91916–91923. [Google Scholar] [CrossRef] [PubMed]
  77. Narin, A.; Kaya, C.; Pamuk, Z. Automatic detection of coronavirus disease (COVID-19) using X-ray images and deep convolutional neural networks. Pattern Anal. Appl. 2021, 24, 1207–1220. [Google Scholar] [CrossRef] [PubMed]
  78. Ravi, V.; Narasimhan, H.; Chakraborty, C.; Pham, T.D. Deep learning-based meta-classifier approach for COVID-19 classification using CT scan and chest X-ray images. Multimed. Syst. 2022, 28, 1401–1415. [Google Scholar] [CrossRef]
Figure 1. Sample X-ray images of chests of 12 patients: (a) normal chests, (b) chests with pneumonia, and (c) chests infected by COVID-19.
Applsci 12 10787 g001
Figure 2. Sample CT scan images of 2 COVID-19 patients (a) COVID-19 infected (b) normal CT scan.
Applsci 12 10787 g002
Figure 3. The block diagram of CNN architecture.
Applsci 12 10787 g003
Figure 4. Proposed framework for COVID-19 detection using imagery data.
Applsci 12 10787 g004
Figure 5. State of images after flip augmentation.
Applsci 12 10787 g005
Figure 6. State of images after rotation augmentation.
Applsci 12 10787 g006
Figure 7. Comparison among VGG-19, ResNet-50, and Inception V3 in terms of accuracy for (a) dataset 1, (b) dataset 2, and (c) dataset 3.
Applsci 12 10787 g007
Figure 8. Comparison among VGG-19, ResNet-50, and Inception V3 in terms of RMSE for (a) dataset 1, (b) dataset 2, and (c) dataset 3.
Applsci 12 10787 g008
Figure 9. Comparison among VGG-19, ResNet-50, and Inception-V3 based on kappa statistic values for (a) dataset 1, (b) dataset 2, and (c) dataset 3.
Applsci 12 10787 g009
Figure 10. Comparison among VGG-19, ResNet-50, and Inception V3 in terms of F-measure for (a) dataset 1, (b) dataset 2, and (c) dataset 3.
Applsci 12 10787 g010
Figure 11. Comparison among some existing techniques [20,50,73,74,75,76,77,78] and our proposed framework with respect to F-measure for (a) dataset 1 [66], (b) dataset 2 [68], and (c) dataset 3 [69].
Applsci 12 10787 g011
Table 1. Comparison of CNN models using dataset 1 for 40 epochs.
CNN
Model
70%–30% Distribution10-Fold Cross-Validation
Accuracy (%) (sd)RMSE
(sd)
Weighted Kappa
(sd)
Accuracy (%)
(sd)
RMSE
(sd)
Weighted Kappa
(sd)
VGG-1987.45
( ± 0.03 )
0.2285 ( ± 0.03 ) 0.8610
( ± 0.03 )
88.35
( ± 0.03 )
0.2195 ( ± 0.03 ) 0.8700 ( ± 0.03 )
ResNet-5094.38
( ± 0.04 )
0.1592 ( ± 0.03 ) 0.9303
( ± 0.04 )
97.61
( ± 0.03 )
0.1169 ( ± 0.03 ) 0.9726 ( ± 0.03 )
Inception-V395.62
( ± 0.04 )
0.1468 ( ± 0.03 ) 0.9427
( ± 0.03 )
99.23
( ± 0.03 )
0.1107 ( ± 0.03 ) 0.9788 ( ± 0.04 )
sd: standard deviation.
Table 2. Comparison of CNN models using dataset 2 for 40 epochs.
CNN
Model
70%–30% Distribution10-Fold Cross-Validation
Accuracy (%) (sd)RMSE
(sd)
Weighted Kappa
(sd)
Accuracy (%) (sd)RMSE
(sd)
Weighted Kappa
(sd)
VGG-1985.91
( ± 0.04 )
0.2439
( ± 0.04 )
0.8456
( ± 0.04 )
88.12
( ± 0.04 )
0.2218
( ± 0.03 )
0.8677
( ± 0.04 )
ResNet-5093.92
( ± 0.04 )
0.1638
( ± 0.04 )
0.9257
( ± 0.04 )
97.89
( ± 0.05 )
0.1141
( ± 0.06 )
0.9754
( ± 0.04 )
Inception-V396.84
( ± 0.05 )
0.1346
( ± 0.05 )
0.9549
( ± 0.04 )
99.21
( ± 0.05 )
0.1109
( ± 0.05 )
0.9786
( ± 0.05 )
sd: standard deviation.
Table 3. Comparison of CNN models using dataset 3 for 40 epochs.
CNN
Model
70%–30% Distribution10-Fold Cross-Validation
Accuracy (%)
(sd)
RMSE
(sd)
Weighted Kappa
(sd)
Accuracy (%)
(sd)
RMSE
(sd)
Weighted
Kappa
(sd)
VGG-1988.76
( ± 0.04 )
0.2154
( ± 0.04 )
0.8741
( ± 0.04 )
89.34
( ± 0.03 )
0.2096
( ± 0.04 )
0.8799
( ± 0.04 )
ResNet-5095.64
( ± 0.05 )
0.1466
( ± 0.05 )
0.9429
( ± 0.05 )
96.98
( ± 0.04 )
0.1232
( ± 0.04 )
0.9663
( ± 0.05 )
Inception-V396.48
( ± 0.03 )
0.1382
( ± 0.04 )
0.9513
( ± 0.04 )
99.36
( ± 0.04 )
0.1094
( ± 0.05 )
0.9801
( ± 0.05 )
sd: standard deviation.
Table 4. A confusion matrix for two-class classifier.
Confusion MatrixPredicted Class
PositiveNegative
Actual ClasspositiveTPFP
negativeFNTN
Table 5. Performance of CNN models with respect to diverse metrics using dataset 1.
CNN Model70%–30% Distribution10-Fold Cross-Validation
TP-Rate/Recall
(%) (sd)
FP-Rate (%)
(sd)
Precision (%) (sd)F-Measure
(%) (sd)
TP-Rate/Recall
(%) (sd)
FP-Rate (%) (sd)Precision (%) (sd)F-Measure (%)
(sd)
VGG-1987.10
( ± 0.03 )
12.55 ( ± 0.03 ) 87.06
( ± 0.03 )
87.08
( ± 0.03 )
88.00
( ± 0.03 )
11.65
( ± 0.03 )
87.96
( ± 0.04 )
87.98
( ± 0.03 )
ResNet-5094.03
( ± 0.05 )
5.62 ( ± 0.05 ) 93.99
( ± 0.05 )
94.01
( ± 0.05 )
97.26
( ± 0.05 )
1.39
( ± 0.05 )
97.22
( ± 0.05 )
97.24
( ± 0.05 )
Inception-V395.27
( ± 0.05 )
4.38 ( ± 0.05 ) 95.23
( ± 0.05 )
95.25
( ± 0.05 )
98.88
( ± 0.04 )
0.77
( ± 0.04 )
98.84
( ± 0.04 )
98.86
( ± 0.04 )
sd: standard deviation. Value in bold denotes the respective measure is shown for classification in figure.
Table 6. Performance of CNN models with respect to diverse metrics using dataset 2.
CNN Model70%–30% Distribution10-Fold Cross-Validation
TP-Rate/Recall (%) (sd)FP-Rate (%) (sd)Precision (%) (sd)F-Measure (%) (sd)TP-Rate/Recall (%) (sd)FP-Rate (%) (sd)Precision (%) (sd)F-Measure (%) (sd)
VGG-1985.56
( ± 0.05 )
14.09
( ± 0.05 )
85.52
( ± 0.05 )
85.54
( ± 0.05 )
87.77
( ± 0.04 )
11.88 ( ± 0.05 ) 87.73
( ± 0.04 )
87.75
( ± 0.05 )
ResNet-5093.57
( ± 0.06 )
6.08
( ± 0.05 )
93.53
( ± 0.07 )
93.55
( ± 0.05 )
97.54
( ± 0.05 )
1.11 ( ± 0.05 ) 97.50
( ± 0.04 )
97.52
( ± 0.04 )
Inceptn-V396.49
( ± 0.05 )
3.16
( ± 0.06 )
96.45
( ± 0.05 )
96.47
( ± 0.05 )
98.86
( ± 0.05 )
0.79 ( ± 0.04 ) 98.82
( ± 0.05 )
98.84
( ± 0.03 )
sd: standard deviation. Value in bold denotes the respective measure is shown for classification in figure.
Table 7. Performance of CNN models with respect to diverse metrics using dataset 3.
CNN Model70%–30% Distribution10-Fold Cross-Validation
TP-Rate/Recall (%) (sd)FP-Rate (%) (sd)Precision (%) (sd)F-Measure (%)
(sd)
TP-Rate/Recall (%) (sd)FP-Rate (%) (sd)Precision (%) (sd)F-Measure (%) (sd)
VGG-1988.41
( ± 0.05 )
11.24
( ± 0.05 )
88.37
( ± 0.05 )
88.39
( ± 0.05 )
88.99
( ± 0.05 )
10.66
( ± 0.05 )
88.95
( ± 0.05 )
88.97
( ± 0.05 )
ResNet-5095.29
( ± 0.07 )
4.36 ( ± 0.05 ) 95.25
( ± 0.05 )
95.27
( ± 0.06 )
96.63
( ± 0.05 )
2.02
( ± 0.05 )
96.59
( ± 0.07 )
96.61
( ± 0.05 )
Inception-V396.13
( ± 0.04 )
3.52 ( ± 0.05 ) 96.09
( ± 0.06 )
96.11
( ± 0.05 )
99.21
( ± 0.04 )
0.64
( ± 0.05 )
99.17
( ± 0.05 )
99.19
( ± 0.04 )
sd: standard deviation. Value in bold denotes the respective measure is shown for classification in figure.
Publisher’s Note: MDPI stays neutral with regard to jurisdictional claims in published maps and institutional affiliations.

