Article

A Numerical Approach for the Efficient Concept Design of Laser-Based Hybrid Joints

Institute for Machine Elements and Systems Engineering, RWTH Aachen University, Eilfschornsteinstr. 18, 52062 Aachen, Germany
*
Author to whom correspondence should be addressed.
Appl. Sci. 2022, 12(20), 10649; https://doi.org/10.3390/app122010649
Submission received: 22 September 2022 / Revised: 5 October 2022 / Accepted: 18 October 2022 / Published: 21 October 2022
(This article belongs to the Special Issue New Trends in Design Engineering II)

Abstract

:
Laser-based plastic–metal joints have high potential to enable cost-efficient lightweight structures in multi-material design. By an appropriate load-optimized positioning of the microstructure on the joining zone, cost- and strength-optimized joints can be realized. However, there are no design methods and models to efficiently develop these tailored microstructures. Currently, time-consuming experiments are necessary to find the optimum microstructure concepts. These experiments must be repeated when requirements change, e.g., dimensions of the components. To provide a simple and efficient design tool, this paper presents an automated numerical method for the development of cost- and strength-optimized microstructure concepts for laser-based joining zones. The basis for the approach is a new numerical model which generates concepts for microstructures automatically based only on the stress tensor in the joining zone. A new finite element cohesive zone model (CZM) was developed to estimate the joint strength. The CZM parameters were efficiently derived from a finite element model of a single cavity. To determine the costs, a new model is presented that calculates the production time and the cost for any given microstructure. The models were interconnected in a combined optimization procedure and a genetic algorithm was used to determine cost- and strength-optimized microstructure concepts. The approach was applied to a demonstration example where the laser costs were reduced by up to 67% compared with benchmarks with surface-covering parallel linear cavities. The approach shows high potential for the efficient design of cost- and strength-optimal laser-based hybrid joints since it is fully based on simulation models and iterative experiments in the design stage are eliminated.

1. Introduction

The application of multi-material design with plastics and metals is increasing, especially in the transportation sector [1,2]. Plastic–metal hybrids enable requirement-optimized, cost-effective, resource-saving, and weight-optimized structures by using the right material in the right place [3,4]. Particularly the joining technology of plastics and metals is a challenge due to the different physical properties [5,6]. A promising new joining process for plastics and metal is the so-called laser-based joining. The most important benefits of laser-based joining are that it does not require any additional elements, such as screws or rivets, or a complex process chain, as is the case with adhesive bonding [7,8,9,10]. In addition, the technology has low cycle times and is therefore ideally suited for large-scale production. Laser manufacturing is also suitable for manufacturing processes other than joining and is especially used where conventional manufacturing processes encounter limitations. LPBF (laser powder bed fusion), for example, is widely used [11,12]. Due to the flexibility of the laser beam, a high degree of geometrical freedom can be achieved. This enables the production of components that cannot be manufactured using conventional production methods (e.g., with milling). Laser manufacturing is also highly suitable for the realization of lightweight-, load-optimized, and multi-material components [13,14].
Laser-based joining of plastics and metals is carried out in a two-step process:
In the first step, the metal surface is processed with a highly focused single-mode fiber laser beam. The laser beam is deflected at high speed (~10 m/s) over the metal surface using a galvoscanning system (see Figure 1a) and creates linear cavities. When the laser passes over the same area several times, small undercuts are created on the metal surface. A part of the material evaporates and a part is pushed upwards in the cavity by the melt pressure and partially solidifies at the edges. Depending on the metal, approx. four runs are required to form clear undercuts. The laser system can be configured to generate a variety of patterns for microstructures on the metal surface, such as linear parallel line structures, crossed structures, structures under an angle, or pointwise structures. This work focused on linear parallel structures because these are the easiest to apply in terms of laser process technology and the most robust in terms of process control.
After processing the metal, both plastic and metal are joined in a second step under pressure and temperature (see Figure 1b). Various joining methods, such as injection molding, can be used for this process step. During the joining process, the liquefied plastic flows into the cavities and solidifies after cooling. The plastic and metal are connected by mechanical interlocking and, depending on the plastic, also by specific adhesion. The filling of the cavity with the plastic depends on the temperature and solidification behavior of the plastic. The cavities can be usually completely filled if a sufficiently high metal temperature can be ensured to prevent early solidification of the plastic.
The properties of the joining zone, such as strength, production time, and costs significantly depend on the microstructure. Currently, only the same microstructure with the same pattern is applied on the whole metal surface. Local variations (e.g., stress peaks or low-stress areas) on the joining zone are not addressed with tailored microstructures.
The microstructure, i.e., the shape of the cavities and the pattern on the joining zone, can be easily adjusted via the laser software [15]. As a result, there is the potential to develop cost and strength-optimized microstructure concepts [16]. However, this potential has not yet been exploited. In the design, it is not considered where on the joining zone which microstructure would be optimal in terms of cost and strength. The effort to adapt and experimentally test tailored microstructures for each component with different strength and cost requirements is too high [17,18].
Today’s research activities with regard to the optimized design of laser-based hybrid joints are focused on experimentally adjusting the production properties. The main focus is on the analysis of thermal properties during laser-based joining [19,20]. The first approaches to model the mechanical properties of laser-based joining with FE simulations exist [21,22,23]. However, these approaches do not consider the specific influences of the microstructure on the mechanical properties.
Experimentally determining the influence of the microstructure on the joining properties is challenging for laser-based joining. Due to the complex mechanical behavior of the microstructure and the interactions, the experimental effort to generate data-driven models for each specific application (geometry, load case, microstructure) would be too high. Therefore, reliable higher-fidelity numerical models are required to describe the characteristics.
Using higher-fidelity numerical models in optimization algorithms is a widely used approach to solve engineering problems. For example, a variety of approaches exist for the multi-objective optimization of the fiber orientation and layup of fiber-reinforced plastics [24,25,26,27]. Furthermore, optimization approaches are increasingly used in the optimization of structural components, e.g., topology optimization or generative design, with respect to multiple domains [28,29].
The first investigations using a fully simulation-based optimization approach for laser-based hybrids demonstrate the potential for cost- and strength-optimized joining zones by optimally positioning the cavities on the joining zone. In ref. [16], a reduction in laser costs of 82% was achieved by optimally positioning the microstructure on the joining zone using a model-based optimization approach. However, these studies and their models were limited to the 2D case and therefore the cavities always covered the entire length of the surface and only the distance between the cavities could be considered as a design variable. The extension of the approach by adding a further degree of freedom in the 3D case allows exploiting the full potential for tailored microstructures and further enabling the industrial application of the technology.
However, systematic design methods and efficient models for developing tailored microstructure concepts as well as determining costs and predicting the joint strength are currently missing for the 3D case.
A major obstacle is that laser manufacturing constraints need to be considered in an automated way. Furthermore, strength models do exist for other joining technologies (e.g., adhesives). However, these are mostly reverse-engineered and calibrated from experimental data and are not adapted and tested for the laser-based hybrid joint.
Therefore, the research questions that were addressed in this study are as follows:
  • How can tailored microstructure concepts for laser joining zones be automatically generated while considering the laser manufacturing constraints?
  • How can the laser costs and joint strength be efficiently determined for the tailored microstructure concepts?
  • How can the methods and models be used to develop cost- and strength-optimized microstructure concepts?
The main novelty of the presented approach is that tailored (strength, costs) microstructures can be fully generated based on simulation models. Iterative experiments throughout the design process are not required.
The approach to answer these questions within this paper is structured as follows: In Section 2.1, a new model for automated efficient development of microstructure concepts while considering the laser manufacturing constraints is presented. For these concepts, a new model for the efficient strength estimation (cohesive zone model) of laser-based joints is presented in Section 2.2 and a model for the cost calculation is presented in Section 2.3. In Section 3, a combined optimization approach is presented that links all models to develop tailored requirements-optimized concepts regarding cost and strength. The approach and the models are validated using a demonstration example in Section 3. Finally, a conclusion and outlook are given in Section 4.

2. Method and Models

The approach is shown schematically in Figure 2. The detailed information on the individual steps is given in the following sections. The basis for the procedure is an FE model of the joining parts with an interlayer with a small thickness between the plastic and metal part. In dependence on the external forces applied to the joint, the values and orientations of the local stress tensors in the interlayer were determined. Based only on these stress tensors, load-optimized concepts for laser structuring were automatically developed with a numerical model (Section 2.1).
The approach works by first eliminating low-stressed regions using a stress limit value. All the remaining regions were then grouped by a cluster algorithm while considering the specific manufacturing constraints of the joining technology. To each of these areas, different microstructures could then be assigned according to the specific stress states.
For strength calculation, cohesive zone models (CZM) were set up, which locally consider the mechanical characteristics of the chosen microstructure for each area (Section 2.2). The required material parameters for the CZM were derived from FE representative-volume-element (RVE) models; so, in this case, it was a single cavity. Then, production costs were determined for the microstructure concepts by calculating a machine hour rate and laser production time (Section 2.3) based on the number, length, and distance of the cavities. Finally, the design, strength, and cost models were coupled in an optimization workflow to identify values for the design variables (e.g., stress limit, microstructure) that satisfy the cost and strength requirements.

2.1. Automated Generation of Microstructure Concepts

The automated generation of microstructure concepts while considering the manufacturing constraints is an important factor to enable the efficient design of laser-based joints. Otherwise, the designer would have to manually define the microstructure for each new component with new requirements and materials and, in the end, perform iterative experiments to ensure that the strength and cost requirements are satisfied. Therefore, a method is needed that can be automated without requiring special domain knowledge of the laser manufacturing constraints.
The state of the art provides numerous design methods for classical joints, such as riveting or bolting, which are well documented in standards such as the VDI 2230 for the systematic design and calculation for bolted joints [30]. Typically, step-by-step analytical tests are carried out for highly simplified geometries and load cases while for more complex cases the use of numerical models is required. Existing methodological approaches are only valid for the manufacturing constraints of the corresponding joining technologies. Since the manufacturing constraints of the laser technology are different, the existing approaches cannot be applied. The key challenge for laser-based joints is that manufacturing constraints, the local stress, the characteristic anisotropy, and the manufacturing costs must be considered simultaneously and automatically in order to design joining zones for this technology holistically.
The manufacturing constraints are discussed as follows. Based on the current state of technology, the primary manufacturing constraint is that the structures must be continuous lines with a constant distance between them. Curves are not possible due to the complex process control of the laser system at high speeds. Furthermore, the application is currently limited to two-dimensional surfaces. It is also important to note that the laser process always introduces thermal energy into the metal, which can result in deformation of the metal. The deformation might then lead to fluctuations in the mechanical properties, although this effect on the joint strength currently cannot be precisely quantified.
The mechanical behavior of the cavities is anisotropic. This means that it depends on the load direction.
The strength as a function of the load-direction (out-of-plane angle theta) for different distances (300 µm, 600 µm, and 900 µm) is shown in Figure 3. The results shown were generated by FE simulation (Polymer: PP-GF40; Metal: 1.4301) of a single cavity. The load angle (out-of-plane angle theta) was varied in 1 degree increments from 0 to 90 degrees and the fracture strength was determined.
In the tensile direction (out-of-plane angle theta = 90°), the strength is substantially lower than in the shear direction (out-of-plane angle theta = 0°). In addition, the strength depends on the geometry of the cavities. Especially in the tensile direction cavities with a distinct undercut show a higher strength [22]. However, for undercuts multiple laser runs are required, which increases the production time (see Section 2.3). Another important factor is the distance between the cavities. Specifically, the greater the distance, the lower the joint strength is, and vice versa. However, with larger distances, the number of cavities also decreases and thus so do the production time and costs (see also Section 2.3).
With the presented approach in step 1, a FE model of the component was created.
For this FE model, boundary conditions, materials, and the load case need to be defined and included (see Figure 2 step 1). Between the plastic and the metal where the components shall be joined, a thin interlayer (tinterlayer/tplastic << 1) was implemented and tied to both components. The microstructure was defined in later steps and thus generic material properties were used. Therefore, isotropic properties with a low Youngs modulus were applied. Using an isotropic material behavior for the interlayer is important to ensure that the directions of the stress vectors are not pre-affected by anisotropic material behavior [31]. Preliminary investigations showed good results for a Young’s modulus of 100 MPa.
This interlayer obtained the real mechanical properties of the microstructure in later steps, after the microstructure is defined.
After the application of the load case in the FE-model, the stress tensor was extracted from the mesh elements of the interlayer. From the stress tensor, the magnitude of the stress (von Mises) and the orientation of the stress vector could be calculated for each individual mesh element. Typically, the stress varies across the surface of the components. Some areas are highly stressed and some are low stressed or even not stressed at all [32]. For cost reasons, very low-stressed areas can be excluded from further analysis in order to save production costs and reduce thermal effects during laser production. Thus, the elements were filtered based on von Mises stresses using the parameter stressThreshold. Elements with a stress σ element   <   stressThreshold · σ max were filtered and are not further considered. The idea of using a stressThreshold to filter low-stressed areas was successfully demonstrated in ref. [32]. Figure 4 shows the application of the stressThreshold for values of 0, 0.5, and 0.75. Figure 4 shows a generic stress distribution. The stress was the highest at the corners and decreases towards the center. It is apparent that the high stresses covered only a small fraction of the area. The application of the stress limit value of 0.5 (elements with stress above 50% of the maximum stress) resulted in filtering out a large area (gray areas). Using a stress threshold of 0.75 resulted in even more elements being filtered out. The specific stressThreshold value cannot be predicted upfront and needs to be iteratively determined. How to optimally select the stressThreshold value is determined later in the optimization approach (see Section 3).
The stress vector is decomposed into an in-plane angle (phi) and an out-of-plane angle (theta) since these are the relevant directions of anisotropy (see Figure 5). Besides the von Mises stress, the theta and phi angles also vary across the joining zone. Each element would have to be structured individually to realize the best cost- and load-optimized concepts. However, as mentioned above, the cavities must always be continuous lines and punctual structuring is not possible nor economically feasible. Thus, the main challenge is to identify connected regions that have similar properties in terms of von Mises stress and phi and theta angles.
To solve this task, a cluster algorithm was used which groups the elements into a finite number of contiguous areas with similar properties (von Mises, phi, and theta). For each of these areas an appropriate microstructure can be assigned. The actual assignment of the optimal microstructure for given cost and strength requirements was solved using an optimization algorithm (see Section 3). As input for the cluster algorithm, the element-wise von Mises stresses and theta and phi angles as well as the corresponding coordinates are needed, which are normalized beforehand to the range of 0 < X < 1. Without normalizing, the different value ranges would result in overweighting one factor and thus to a strong distortion and scattered clusters.
There are numerous options for cluster algorithms which differ in their functionality, computation time, and results. An overview can be found in ref. [33]. Various clustering algorithms such as k-means, agglomerative clustering, and DBSCAN were tested in terms of computational time, robustness, and ability to generate laser manufacturable microstructure concepts. The k-means algorithm showed the best and most robust results since large contiguous areas which can be well manufactured are usually identified. For k-means the number of clusters must be specified manually. The optimum number of clusters depends on the size of the joining zone, the possible microstructures, and the laser production parameters and is difficult to predict in advance. Preliminary investigations show that a cluster number of 2–5 delivers useful results for small components (~200–500 mm2). For each cluster mean values of theta, phi, and von Mises were calculated. To each cluster, a microstructure (distance, number of runs, etc.) was then assigned. The optimum choice, however, was realized via the optimization algorithm (see Section 3.2). Finally, the microstructures were drawn as lines in the clusters, with each line representing a cavity. The cavities were aligned perpendicular to the mean phi angle of each cluster and the areas were filled with line structures at the specified distance.
The final result of the design method is comprehensive information about each element (phi, theta, and von Mises, coordinates), each cluster (mean values, microstructure), and the positioning of microstructures over the joining zone (position and length of lines on the joining zone). The cohesive zone model for the strength estimation was developed based on the cluster information. Based on the cavity lines, the production time and costs can be determined (see subsequent sections).

2.2. Cohesive Zone Model for Strength Calculation

The strength of the joint is a crucial criterion for the decision for or against a joining technology and therefore needs to be considered in the product development of laser-based joints. Current research mainly focuses on the experimental determination of the joint strength, which investigates different material combinations, microstructures (e.g., patterns, number of runs), and laser production settings [20,22,34,35,36,37].
Few approaches exist for the estimation of the joint strength using simulation models [16,18,21,23].
However, only approach [16] is capable of considering the direct influence of the microstructure parameters on the strength. As mentioned above, both cost and strength can be adjusted via the microstructure parameters, which is why these parameters must be taken into account in the design process. In the approach, the cavities are modeled in a 2D shell finite-element model with full geometric detail with all its curves to represent the drop-shaped geometry (see Figure 6a). The artificial thickness (length of the cavity) of the shell elements was chosen to cover the whole metal surface width.
The plastic had a plastic material behavior with fracture criterion. A hard contact condition was implemented between the plastic and the metal and friction was implemented as a tangential behavior. Thereby, the separation and the crack propagation could be modeled for one or multiple cavities. Using this approach, the strength could be predicted with an accuracy of <5%. So far, this approach could only be demonstrated for the two-dimensional case since the calculation time is high. This model was not able to determine the strength of the three-dimensional concepts generated with the method from Section 2.1.
Therefore, this paper presents a new approach that enables the efficient estimation of the strength for the 3D-case by so-called cohesive zone models (CZM). The idea of the CZM approach is the homogenization of the effective mechanical properties of the bonding behavior between plastic and metal as shown in Figure 6b.
CZM are well-known models to represent the mechanical behavior of boundary layers in joining zones. CZM have been successfully applied to many joints, such as adhesive bonds [38,39]. CZM work as follows: CZM are modeled as bulk material. They do not represent a direct material, but describe the relation between traction (stress) and separation (displacement) of the surfaces [40,41]. The relationship between traction and separation is described by the so-called traction-separation law. In the simplest case, a bilinear relationship is defined (see Figure 7a). Here σmax denotes the point of maximum stress and damage initiation, respectively. The damage evolution describes the mechanical behavior after reaching σmax, which is just linear in the bilinear case. In order to describe the anisotropic material behavior of the technology also with CZM, different traction-separation behaviors can be defined in different directions (see Figure 7b). Mode-I marks the mechanical behavior for the normal load (theta = 90°) and Mode-II the pure shear load case (theta = 0°).
Typically, the CZM parameters are identified phenomenologically, which means in a reverse-engineering approach where numerous experiments are required [40]. For this new approach, however, the parameters of the CZM interlayer shall be determined in a direct model-based approach. The relevant parameters for the traction separation law are therefore derived from a micromodel RVE, which represents exactly one cavity of the microstructure of interest (see e.g., Figure 6b). Using the RVE approach, the mechanical behavior of any microstructure can be quickly determined. The approach is demonstrated in Section 3.

2.3. Cost Model

The total costs of a product are typically made up of various components such as manufacturing costs, material costs, and overhead, etc. In this paper, only the influence of the microstructure on the strength was considered. Plastic manufacturing costs do not change for different microstructures if the dimensions of the joining zone remain the same. Therefore, only the costs of laser manufacturing were considered, which have a direct effect on joint strength. Other costs such as overhead costs vary from company to company and must therefore always be calculated separately for each case. For the calculation of laser costs, the calculation of a machine hourly rate CM and the laser production time TL are the most important factors (see Equation (1)). The only approach to calculate laser production time and costs so far can be found in ref. [16]. In this approach, the laser production time is calculated using the length li, distance di, and number of runs for each cavity together with the scanning speed vs. of the laser head (see Equation (2) and Figure 8).
The structures themselves are processed at the desired scanning speed. However, the high speed of ~10 m/s results in substantial influences due to the mass inertia of the galvo scanner system [42]. In order to avoid burn-in and to manufacture clean and reproducible cavities, the laser-head performs a compensation movement (so-called skywriting) between two structures, which leads to an additional delay. This effect is considered in the factor TD and can be estimated as described in ref. [43]. Due to the skywriting effect, many short cavities take longer for production than few long cavities.
C L = T L · C M
T L = i = 1   n w · N i + d v s + T D
C M = C c t w · ( 1 + C m ) + F · C F t r + C E
The machine hourly rate CM was calculated using the capital costs, write-off time, and relative maintenance costs Cm. Furthermore, the building costs were considered by the footprint F and the building rent costs CF (see Equation (3)). These values were divided by the maximum running time of the machine tr. In addition, the energy costs CE were taken into account. Personnel costs were not included as they cannot be estimated yet for an individual component. The specific values for the parameters are given in Table 1. Since laser machines are still usually prototype systems, these values are based on empirical knowledge. By multiplying the machine hourly rate by the laser production time, the laser costs could then be calculated for any given microstructure concept (see Equation (1)).

3. Demonstration of the Approach

In this section, the application of the previously presented models for concept development, strength calculation, and cost calculation to a demonstration example is shown. To develop cost-optimized microstructure concepts for a given load requirement, the models were fully automated and interconnected in an optimization procedure. The optimization approach is demonstrated using the example of a single-lap-joint specimen. The single-lap-joint is ideally suited as a demonstration example because both tensile and shear forces are induced and the stress varies across the joining zone. In Section 3.1, general information about the demonstration example, such as the geometry is presented and the application of the design method is demonstrated. The optimization setup (design parameter, optimization settings, etc.) is presented in Section 3.2. In Section 3.3 the parameters for the cohesive zone model are determined for a chosen microstructure. The optimization results are presented and discussed in Section 3.4.

3.1. Concept Development

The geometry of the single-lap-joint (SLJ) specimen is shown in Figure 9. The overlapped length (joining zone) is 12.5 × 25.0 mm. The dimensions of the specimen and the dimensions of the joining zone were not changed during optimization. Only the micro-structure on the metal surface was modified. The metal component was fully clamped at its end. A displacement constraint with U1 = 0.15 mm was applied to the plastic surface. For the polymer part, glass-fiber-reinforced polypropylene was used, (PP-GF40) and for the metal part, regular stainless steel was used (1.4301).
In Figure 10, the results from applying the design method to the demonstration example are shown. The von Mises stress (e), in-plane angle phi (b), and out-of-plane angle theta (a) distributions that are derived from the interlayer between the polymer and metal are shown. It can be observed that the stress distribution on the joining zone varied significantly. Low-stressed areas can be excluded for further consideration. The result for an example of stressThreshold = 0.1 is shown in Figure 10f.
From the stress tensor, the angles theta and phi were calculated. Especially for theta, highly varying angles between shear (~0°), tensile (~20°), and compressive (~−30°) load emerged.
The clusters were derived using the von Mises stress and the theta angles.
Pre-tests with phi angles of 0°, 45°, and 90° showed no difference in the strength for parallel linear cavities. Thus, the orientation of the microstructure within the plane does not affect the strength. Cross-section images show that the cavities are irregular in the direction of the grooves due to variations in the manufacturing process. This means that the cross-sections change in the direction of the grooves, causing additional undercuts. Thus, the phi angle was not considered for the optimization.
The resulting clusters are shown for two, three, and four clusters for a value of stressThreshold = 0.1 in Figure 10. For two clusters, a large inner cluster and an outer cluster were formed, which, however, were not connected. A similar behavior resulted for three clusters, whereby the third cluster was strongly oriented according to the highly stressed area on the left edge of the surface. Pre-investigations showed that the cluster number of three for the given example had a good trade-off between manufacturability and granularity. For two clusters, the standard deviation of theta and von Mises was high, while for more than three clusters the areas became small and scattered so that no cavities could be placed and the concepts could not be manufactured. Thus, the cluster number of three was set for the following investigations. However, for new components the number of clusters shall be determined again.

3.2. Optimization Setup

The previously introduced models for concept development, strength calculation, and cost calculation were combined in an optimization procedure as shown in Figure 11. The execution of all models is fully automated and the parameters are interconnected. Typically, there are several possible solutions for a given problem. The task of the optimization algorithm is to identify one satisfying solution for the design variables which fulfills the requirements. The strength and costs were defined as objectives. For the strength, the following requirement was defined: the strength must be at least equal to the benchmark and the costs shall be simultaneously minimized.
Multiple classical state-of-the-art concepts (linear, parallel cavities) were used with the distances of 300 µm, 400 µm, 500 µm, and 600 µm as benchmarks. The strength and cost values of the benchmarks (production of one component) are shown in Table 2. As expected, costs and strength decreased as the distance between structures increased. Additionally, the number of cavities and the mark distance are given. This information is useful for the evaluation of the laser production effort and the induced thermal stress.
With the given strength constraint, the costs shall then be minimized. The parameters stressThreshold and the distance for each cluster were used as design variables. Theoretically, the microstructure of each cluster (i.e., the geometry of the cavities) could also be varied through the number of laser runs. However, only the microstructure with six laser runs was used to limit the number of design variables and the initial optimization effort. This microstructure has distinctive undercuts and high strength as shown in ref. [18].
Choosing an appropriate optimization algorithm is a challenge. Typically, a compromise must be found between fast convergence and the wide coverage of the solution space. If convergence is too fast, there is a risk of becoming stuck in local minima too quickly. With algorithms that are too free, the solution space can be covered widely and the chances increase to identify a global optimum. However, convergence can sometimes not be achieved and the optimization process requires numerous iterations.
Various optimization algorithms were tested in pre-investigations (e.g., PSO, NSGA-II, gradient-based algorithms, etc.). The other algorithms tested required too much time for convergence, so efficiency of the whole approach was reduced. However, the final results did not differ from those obtained with NSGA-II. Especially the gradient-based algorithms converged very quickly. As a result, the outcomes were not satisfactory.
Genetic optimization with NSGA-II was chosen as the best optimization algorithm for the given problem because it is a commonly applied robust algorithm and can handle multiple objectives [44,45]. The multi-objective optimization gives multiple Pareto-optimal solutions as a result. From these different solutions, the engineer can finally choose their preferred solution. For future extensions of the approach, multi-objective optimization can also be easily extended with additional criteria.
Furthermore, for the given optimization problem, NSGA-II allows a high variety of designs, which turns out to be required to obtain good results.
The procedure of genetic algorithms is inspired by nature’s genetic selection process. First, an initial population with random attributes was generated. For this population, the objectives were calculated. Then the “fitness” was calculated and the fittest individuals were selected for the next generation. To maintain diversity and avoid local optima, the operators crossover and mutation were performed before the next generation. The procedure was repeated until a termination criterion was reached, e.g., convergence criterion or the maximum number of generations. For this optimization problem, the maximum number of generations was set to 20. Table 3 shows the objectives, the design variables with their value ranges and the parameters used for the NSGA-II algorithm.

3.3. Determination of CZM Parameters

To determine the strength of the microstructure concepts, a cohesive zone model (CZM) for a specific microstructure was developed as presented in Section 2.2. The microstructure used is a cavity geometry resulting from six laser runs because these cavities show high strength and a distinctive undercut. Details regarding the corresponding dimensions of the cavities (depth, undercut, etc.), laser setup (machine type, etc.), and laser settings (laser power, etc.) can be found in ref. [18].
The principle for determining the CZM parameters is to determine the force–displacement curves of a single cavity using an FE model on the micro level (“RVE micromodel”) and then calculate the CZM parameters from this data. After calibration of the CZM based on the RVE micromodel, the CZM can then be used in larger assemblies and can be applied to larger joining zones.
In Table 4 the material parameters for polymer (PP-GF40) metal (1.4301) are shown, which were used to build the RVE micromodel. It has a width of 300 µm, which is equivalent to a distance of 300 µm between the cavities. The thickness of the RVE model is equal to the width. The plastic is given a plastic material behavior with fracture criterion. For the metal, a linear elastic material behavior was chosen since the stress in the metal is relatively low. A hard contact was used between the plastic and the metal, which completely prevents the metal and polymer surfaces from intersecting [46].
The micromodel was used to perform a tensile test (theta = 90°) and a shear test (theta = 0°) and to generate the force–displacement curve. The objective of the CZM is to represent the mechanical properties of the micromodel. To confirm the validity of the CZM beforehand on a simple small-scale example, a reference model (Figure 6b) with the same dimensions and boundary conditions as the micromodel was developed with a CZM and the force–displacement curves were compared. The maximum strength σmax, Young’s modulus E in tensile and shear directions, as well as the energy G (see also Figure 7) need to be defined for creating a CZM in an FE software. To model the trapezoidal CZM curve, the trapezoidal ratio h of the horizontal lines needs to be specified. The values (σmax, E, G, and h) were optimized so that the force–displacement curves from micromodel and CZM matched.
The comparison of the curves after optimization is shown in Figure 12. In the curves of tensile and shear, the anisotropy can be clearly recognized. While the plastic in the neck broke off abruptly in the shear direction, it was pulled out gradually in the tensile direction, leading to the trapezoidal shape. The stiffness and strength in the shear direction were higher compared with the tensile direction. These investigations agree with the relevant literature. The curves of the micromodel and CZM matched well, so the CZM can represent the mechanical behavior of the micromodel. The CZM does not require complex contact calculations, plastic material behavior, or friction and thus has a significantly lower cost of simulation. Furthermore, the implementation of the CZM can be performed easily on any arbitrary components.
The critical time step for explicit finite element analysis is proportional to the smallest element mesh size [47]. The CZM does not require extremely small mesh sizes as the micromodel does, and is therefore significantly faster. The final parameters of the CZM for tensile and shear directions are shown in Table 5.
To demonstrate the accuracy of the CZM approach for larger joining zones with multiple cavities, the CZM was applied to the single-lap-joint specimen (see Figure 9). A microstructure with parallel cavities of 300 µm distance was chosen for comparison and the force at failure for this configuration was compared to experiments and the micromodel. For these settings, there were multiple cavities on the joining zone as shown in Figure 13a. Figure 13b shows the force at failure. The error between the experiment, micromodel, and CZM was small (~3%) and within the standard deviation of the experiment. The validity and applicability of the CZM approach for laser-based plastic–metal joints can therefore be confirmed.
The parameters shown in Table 5 were determined for a reference distance of 300 µm. However, for the optimization, the distance in each cluster is a continuous design variable and can take any decimal numbers between 300 µm and 1000 µm. Therefore, the parameters of the CZM are always calculated for each specific distance by scaling the values in relation to the parameters for a distance of 300 µm. In Figure 14 CZMs are shown, in the three-dimensional space, as examples for distances of 300 µm, 600 µm, and 900 µm. As expected, the highest strength could be achieved in the shear direction and the lowest strength in the tensile direction. At the same time, the strength decreased with increasing distance. However, the separations in the tensile direction were lower those in the shear direction.
It should be noted that the results in Figure 14 only represent the mechanical behavior of one single, small CZM element. The mechanical properties of the entire joining zone in an assembly cannot directly be derived or extrapolated from these CZM properties.

3.4. Optimization Results

In the following section, the results of the optimization and application models and methods are presented. Figure 15 shows the results for the selected optimized concepts. The relative values are given in comparison to the respective benchmarks (see Table 2) with classical microstructures. A value of 1 indicates the same values as those of the benchmark. For each benchmark concept, at least one concept was found through the optimization that demanded less structuring effort and had lower costs for the same strength. The costs can be significantly reduced by between 38% and 67% compared with the benchmarks. In addition, fewer cavities were required and the structuring length was reduced. Consequently, less heat was introduced and less thermal distortion can be expected.
Figure 16 shows the microstructure concepts of the winning scenarios with corresponding distances and stress thresholds. The distances were the smallest at the edges where the stress was the highest. For all concepts, the middle area showed either the greatest distance (Figure 16a,c) or even no structuring (Figure 16b,d) resulting from the stressThreshold. Most of the cavities cover the entire width of the joining zone. All cavities were oriented perpendicular to the phi angle. In particular, concept (b) showed many short cavities which, however, had a substantial impact on the laser production time and thus the costs due to the sky-writing effect.
The optimization history is shown as an example for benchmark (b) in Figure 17 with the number of individuals on the x-axis. A similar behavior was observed for the other benchmarks. Initially, the design variables and the objectives fluctuated intensely. After about 50 individuals, convergence began for all values. From about 180 individuals, there were hardly any differences between the individuals. Thus, the number of 20 generations and 12 individuals per generation can be confirmed as appropriate settings for the NSGA-II algorithm.

4. Summary and Outlook

In this paper, a computer-aided approach for the automated development of optimized microstructure concepts for laser-based hybrid joints was presented. To achieve this, a new numerical model for the automated positioning of cavities and new models for strength calculation and cost calculation were presented. The models were linked in an optimization approach to automatically generate cost- and strength-optimized concepts that optimally met the requirements. The approach was validated on a demonstration example and optimized microstructure concepts were identified for various benchmarks with classical structuring. The outcomes can be summarized as follows:
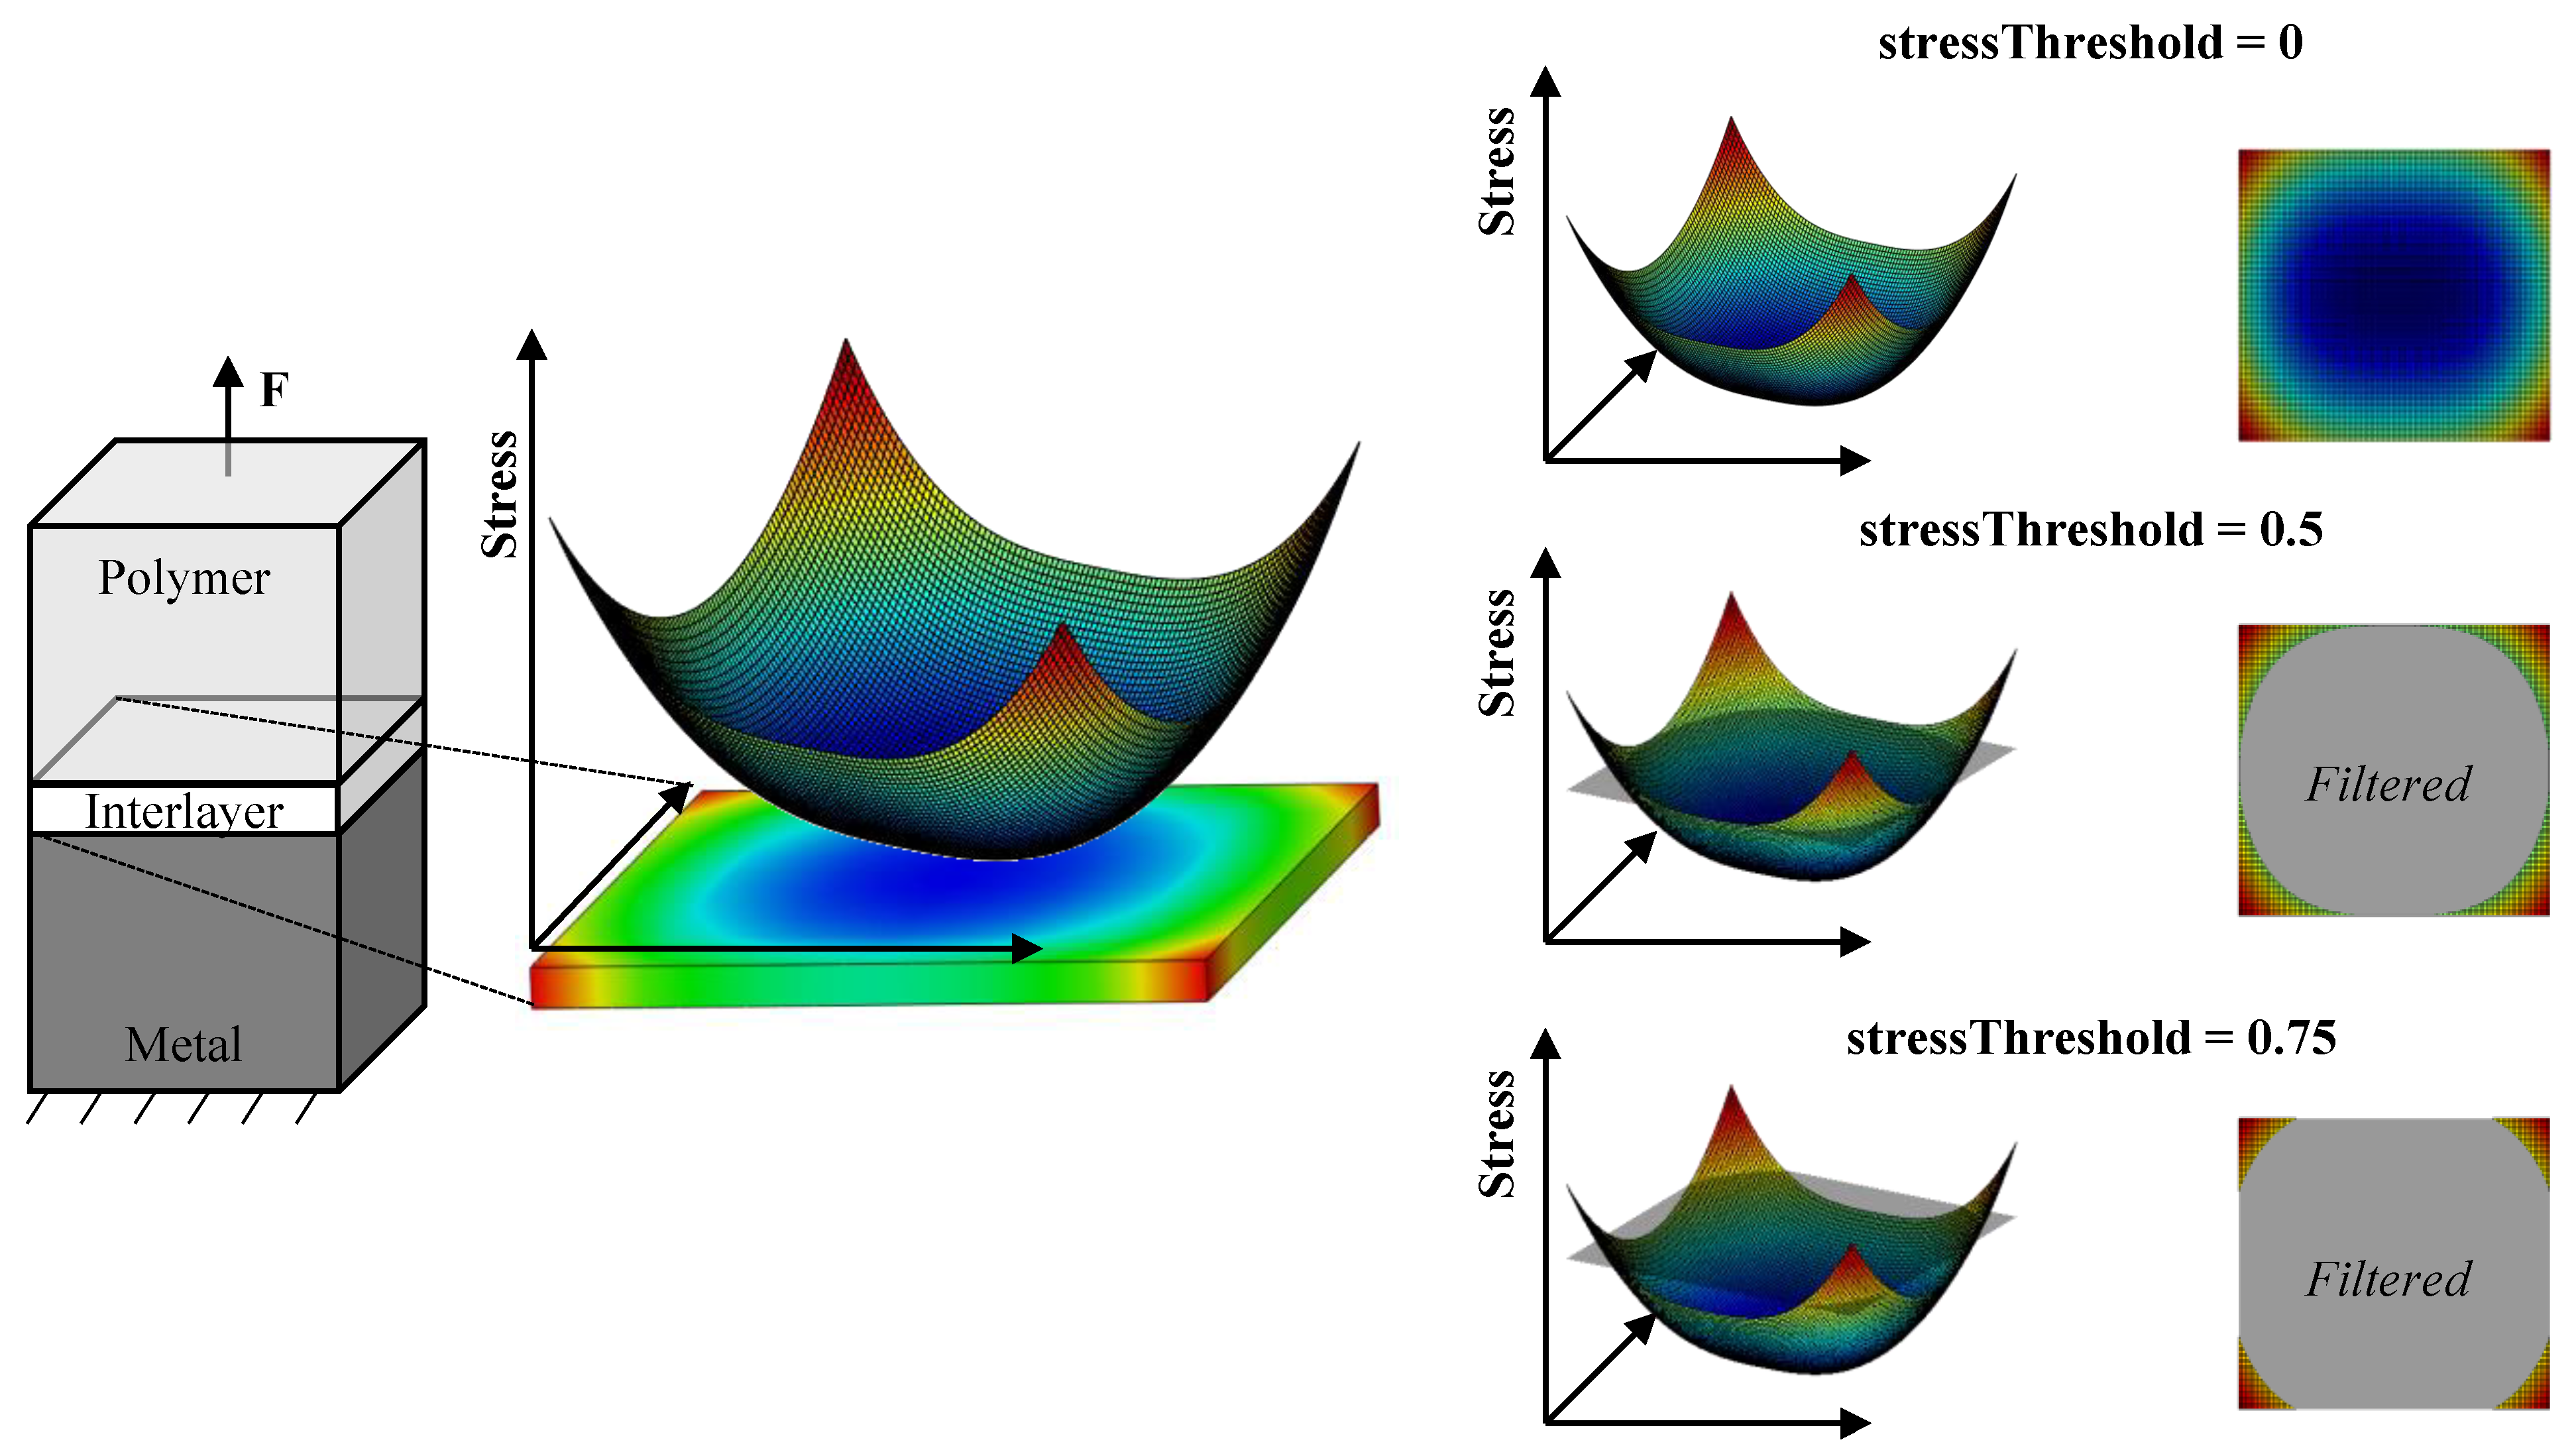
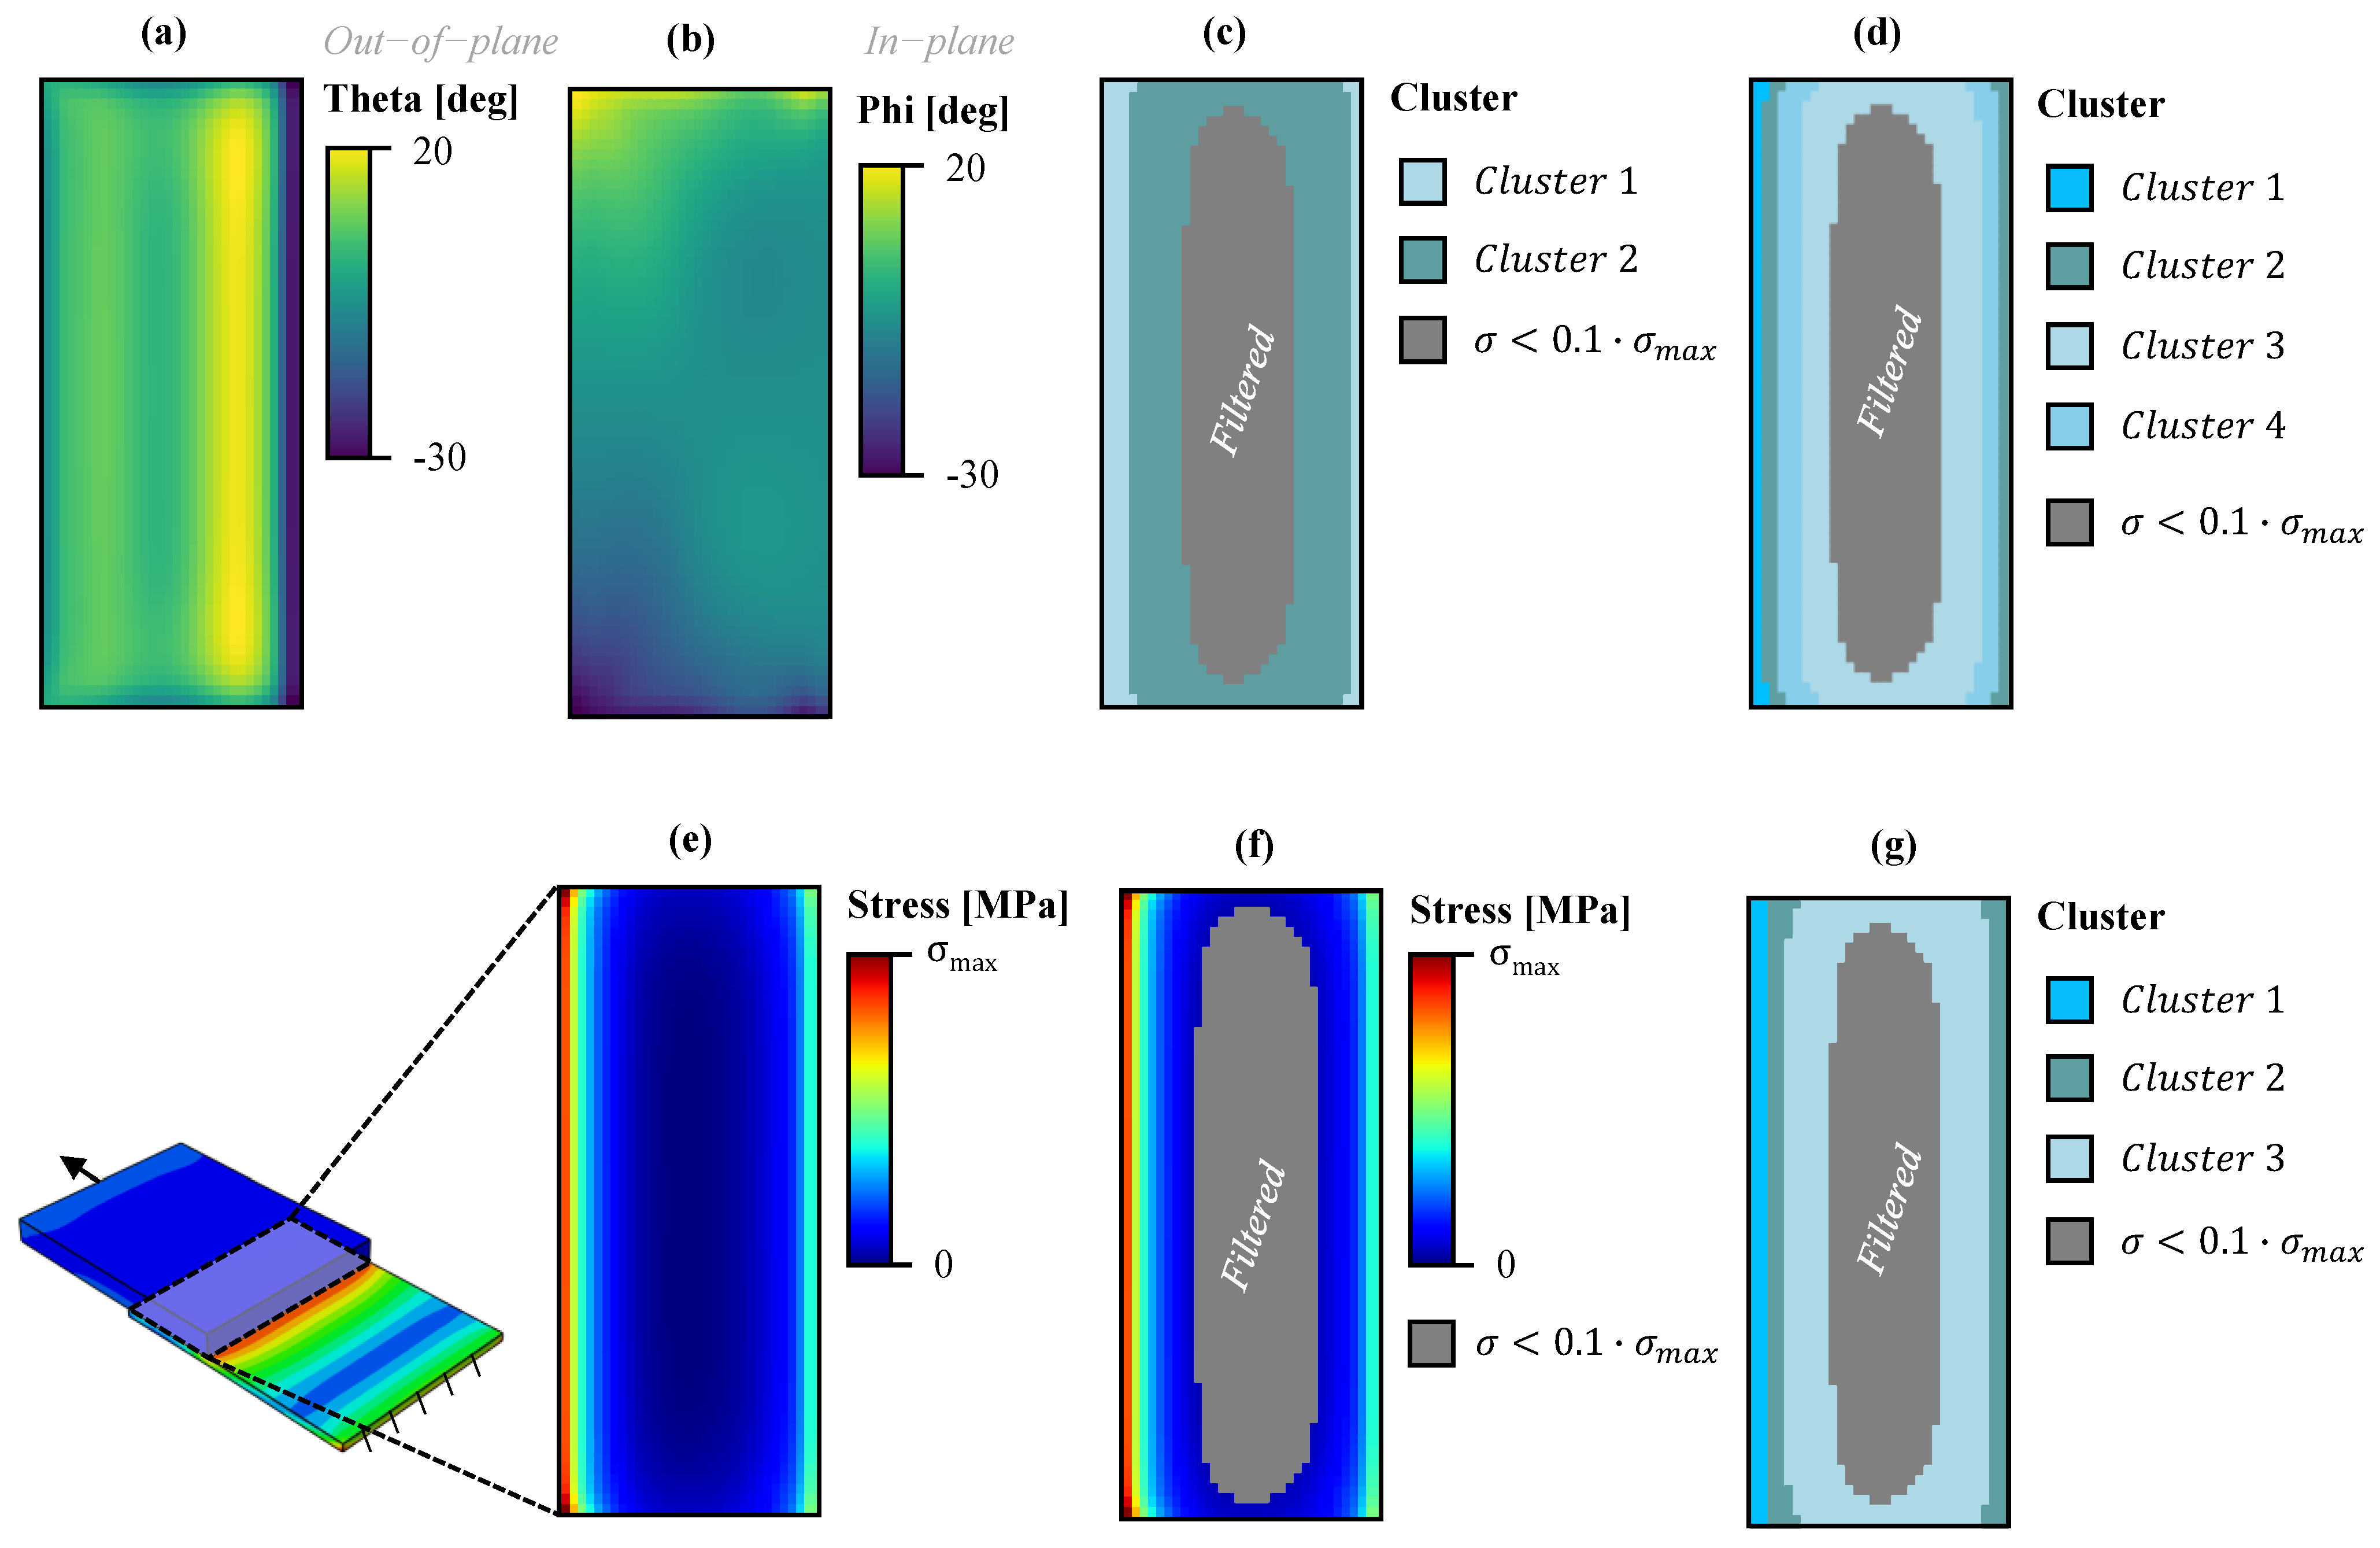
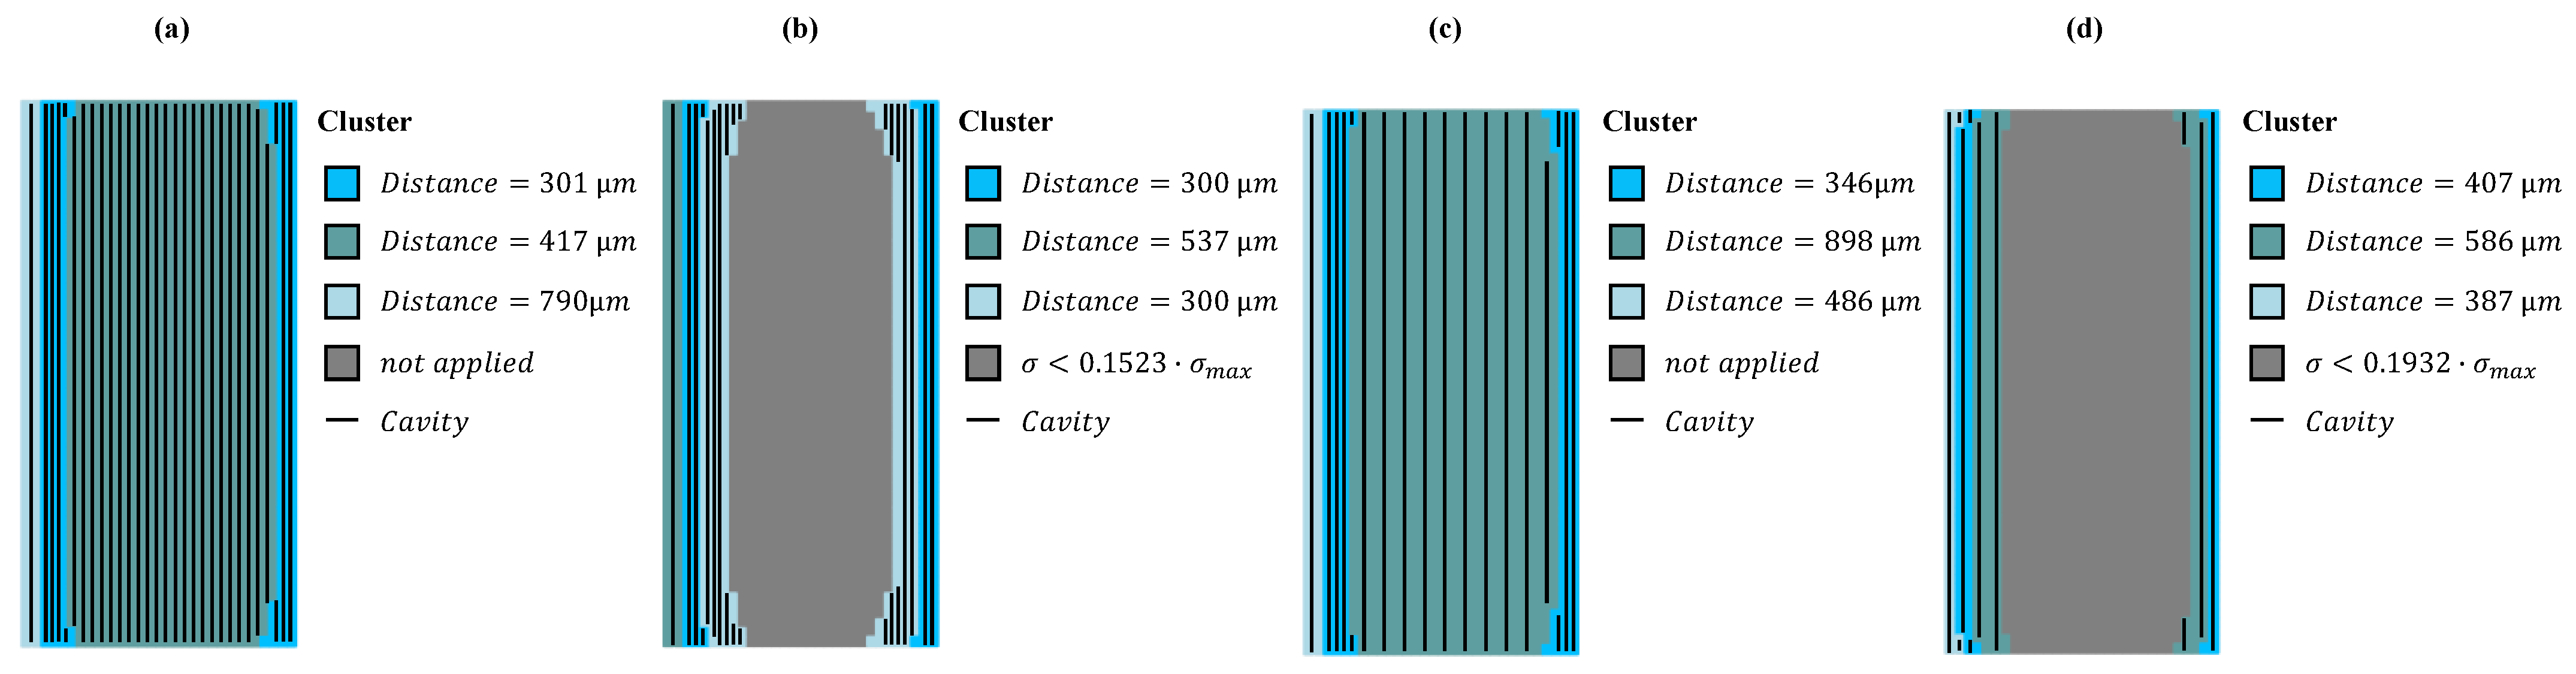
  • The stress-based numerical cluster approach was able to automatically identify regions with the same stress and load angles while still ensuring laser manufacturability. For each region, the cavities could be placed automatically, and thus microstructure concepts could be efficiently generated.
  • To efficiently determine the quasi-static strength of the laser-based joint, the cohesive-zone-modeling (CZM) approach is suitable. The comparison of the predicted strength with an experiment showed an error of ~3%.
  • Supplying the CZM with only the FE-RVE data is possible and leads to sufficient prediction quality of the joint strength. The effort for simulation and implementation of the CZM was significantly lower than for the micromodel.
  • The laser cost model is extended to calculate the laser production time and costs for arbitrary microstructure concepts.
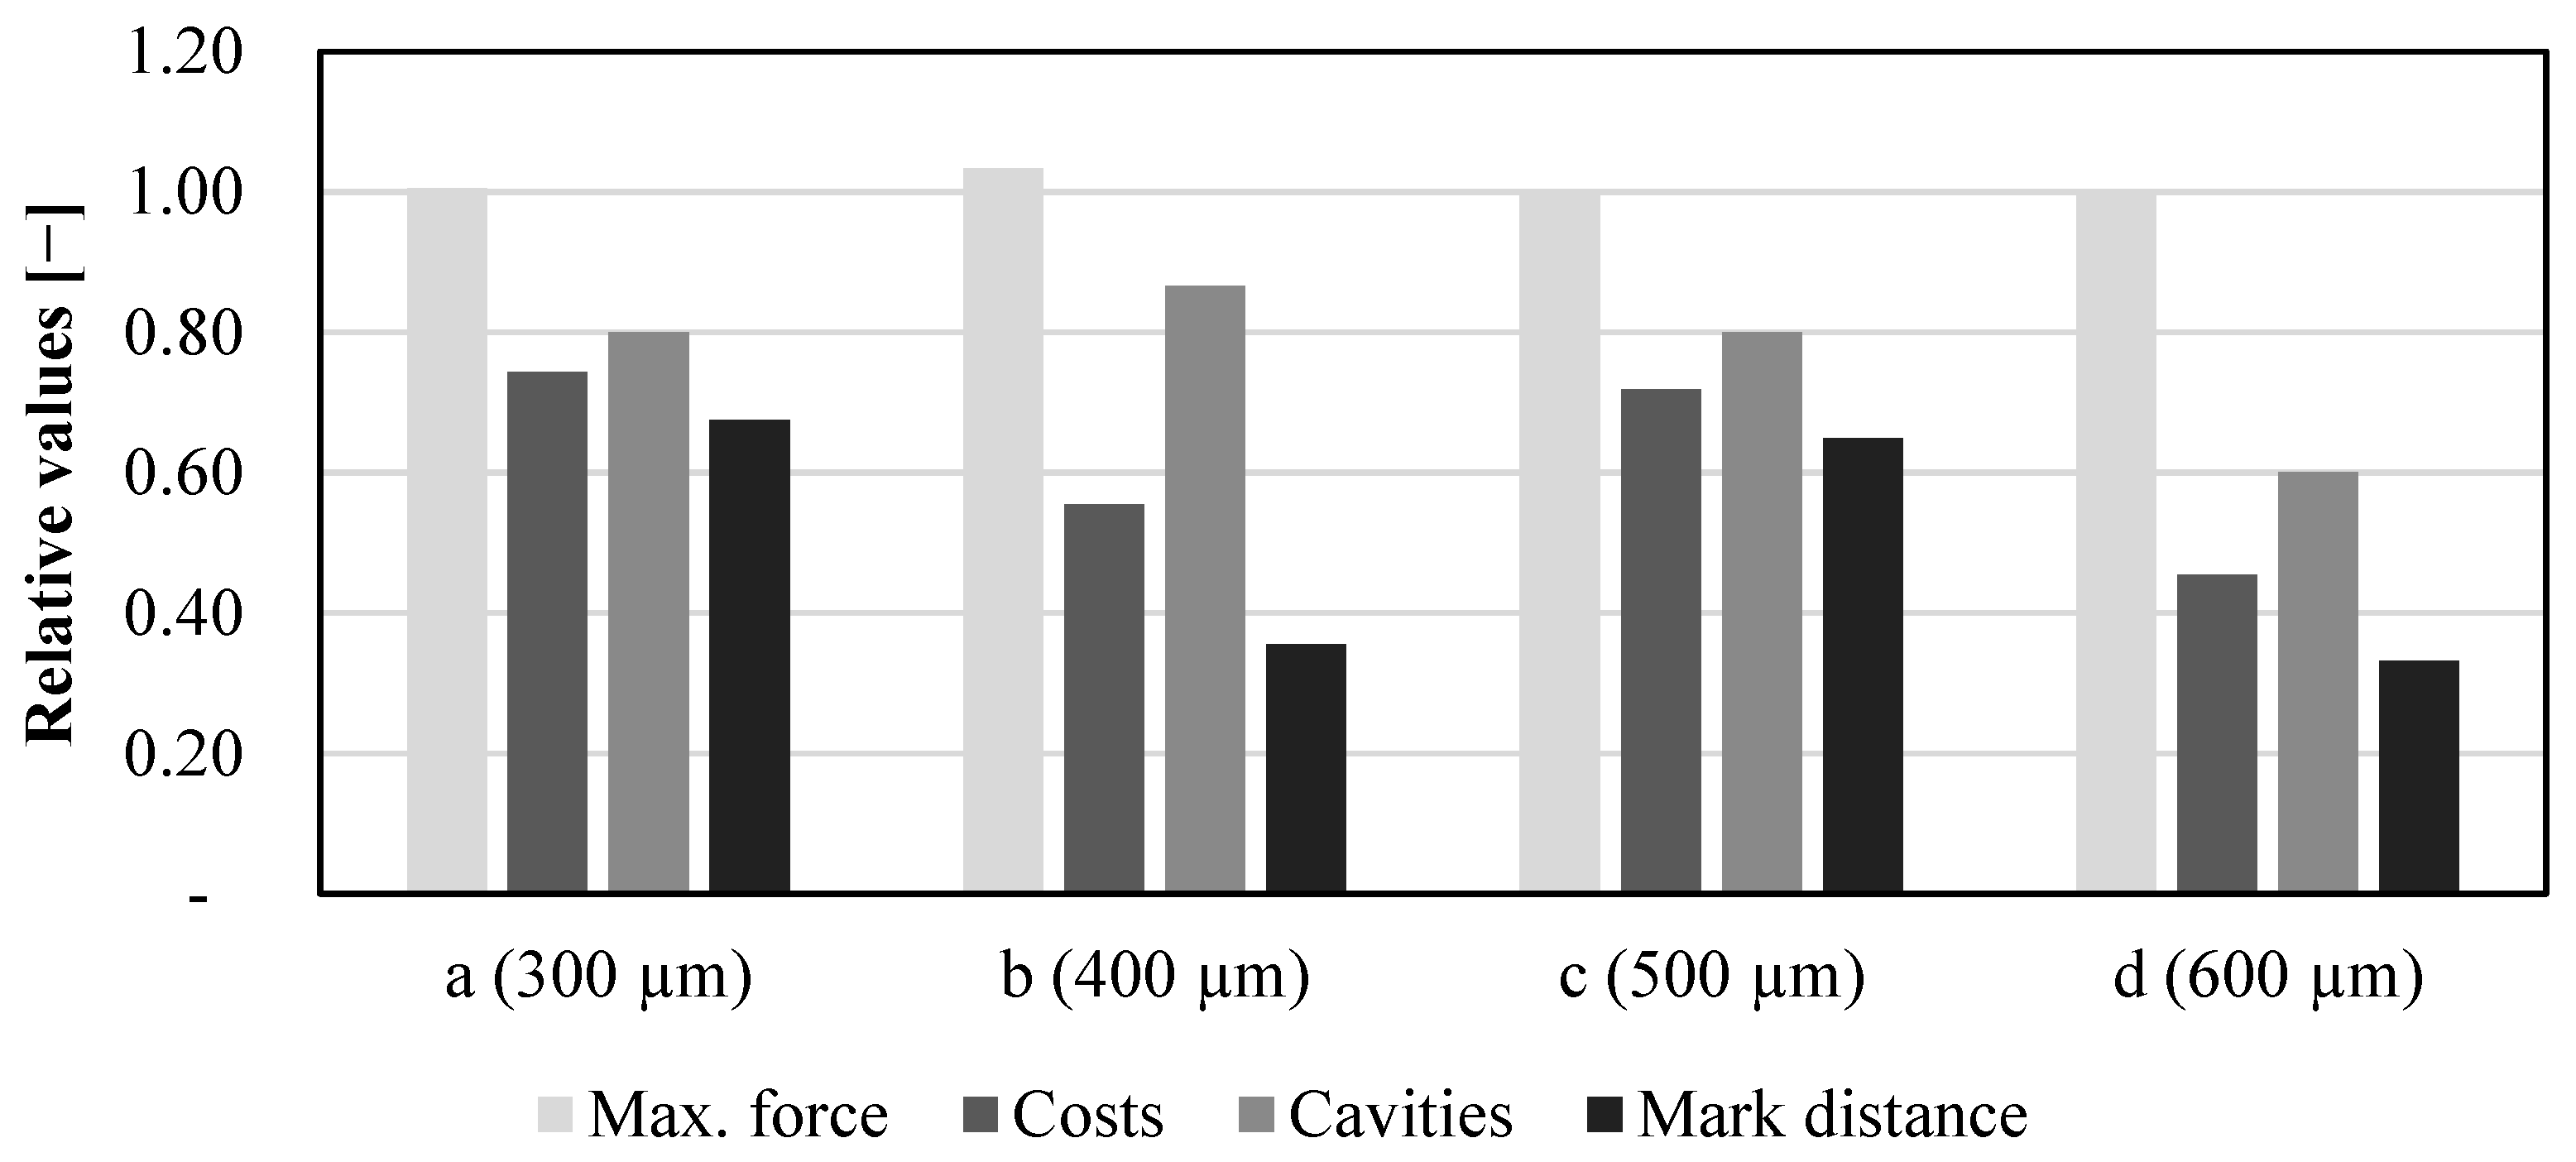
  • Linking the models in a genetic optimization procedure enabled the automated identification of optimized microstructure concepts, which had up to 67% lower costs than benchmarks with the classical microstructure but the same strength.
In conclusion, a fully model-based design approach for laser-based hybrids was developed, which showed high potential for reducing the development time of laser-based plastic–metal hybrid joints. Furthermore, it is possible to efficiently develop tailored and load-optimized microstructure concepts without requiring iterative experiments, thus saving production time and costs as well as experimental effort. Thus, the full potential of the joining technology can be exploited and the industrial application is enhanced.
The number of clusters was selected manually for the given parts. To improve the approach in future work, a method to automate this step is still required. Currently, the cavities of all clusters are independent of each other. The connection of some cavities over the clusters in post-processing holds further potential to reduce the total number of cavities and thus the laser production time and laser costs. The applicability and validity of the CZM approach were demonstrated in this paper for the quasi-static load case on a small example. Additional experimental validation of the CZM approach on different components, materials, and microstructures (e.g., crossed, under angle) will be carried out. Furthermore, the approach will be extended to dynamic load cases and also be able to consider temperature-dependent material behavior. In future work, further investigations will be carried out to also consider the influence of possibly uncertain parameters in the optimization approach.

Author Contributions

Conceptualization, J.B., G.J. and J.M.B.; methodology, J.B.; software, J.B.; writing—original draft preparation, J.B.; writing—review and editing, G.J. and J.M.B.; visualization, J.B.; supervision, G.J. and J.M.B.; All authors have read and agreed to the published version of the manuscript.

Funding

This research has been carried out as part of the project “TailoredJoints”, funding code 03XP0277F which is funded by the German Federal Ministry of Education and Research (BMBF).

Institutional Review Board Statement

Not applicable.

Informed Consent Statement

Not applicable.

Data Availability Statement

Not applicable.

Conflicts of Interest

The authors declare no conflict of interest.

References

  1. Taub, A.; De Moor, E.; Luo, A.; Matlock, D.K.; Speer, J.G.; Vaidya, U. Materials for Automotive Lightweighting. Annu. Rev. Mater. Res. 2019, 49, 327–359. [Google Scholar] [CrossRef]
  2. Smith, B.; Spulber, A.; Modi, S.; Fiorelli, T. Technology Roadmaps: Intelligent Mobility Technology; Materials and Manufacturing Processes, and Light Duty Vehicle Propulsion; Center for Automotive Research: Ann Arbor, MI, USA, 2018. [Google Scholar]
  3. Friedrich, H.E. Leichtbau in der Fahrzeugtechnik; Springer: Wiesbaden, Germany, 2017. [Google Scholar]
  4. Henning, F.; Moeller, E. (Eds.) Handbuch Leichtbau: Methoden, Werkstoffe, Fertigung; Hanser: Munich, Germany, 2011. [Google Scholar]
  5. Amancio Filho, S.T.; Blaga, L.-A. (Eds.) Joining of Polymer-Metal Hybrid Structures: Principles and Applications; John Wiley & Sons Inc.: Hoboken, NJ, USA, 2018. [Google Scholar]
  6. Martinsen, K.; Hu, S.; Carlson, B. Joining of dissimilar materials. CIRP Ann. 2015, 64, 679–699. [Google Scholar] [CrossRef] [Green Version]
  7. Habenicht, G. Kleben: Grundlagen, Technologien, Anwendungen, 6th ed.; Springer: Berlin/Heidelberg, Germany, 2009. [Google Scholar]
  8. Spancken, D.; van der Straeten, K.; Beck, J.; Stötzner, N. Laserstrukturierung von Metalloberflächen für Hybridverbindungen. Lightweight Des. 2018, 11, 16–23. [Google Scholar] [CrossRef]
  9. Klotzbach, A.; Langer, M.; Pautzsch, R.; Standfuß, J.; Beyer, E. Thermal direct joining of metal to fiber reinforced thermoplastic components. J. Laser Appl. 2017, 29, 22421. [Google Scholar] [CrossRef]
  10. Dröder, K. Prozesstechnologie zur Herstellung von FVK-Metall-Hybriden; Springer: Berlin/Heidelberg, Germany, 2020. [Google Scholar]
  11. Chmielewska, A.; Wysocki, B.A.; Gadalińska, E.; MacDonald, E.; Adamczyk-Cieślak, B.; Dean, D.; Świeszkowski, W. Laser powder bed fusion (LPBF) of NiTi alloy using elemental powders: The influence of remelting on printability and microstructure. Rapid Prototyp. J. 2022, 28, 1845–1868. [Google Scholar] [CrossRef]
  12. Ettaieb, K.; Godineau, K.; Lavernhe, S.; Tournier, C. Offline laser power modulation in LPBF additive manufacturing including kinematic and technological constraints. Rapid Prototyp. J. 2022. [Google Scholar] [CrossRef]
  13. Wang, D.; Wei, X.; Liu, J.; Xiao, Y.; Yang, Y.; Liu, L.; Tan, C.; Yang, X.; Han, C. Lightweight design of an AlSi10Mg aviation control stick additively manufactured by laser powder bed fusion. Rapid Prototyp. J. 2022, 28, 1869–1881. [Google Scholar] [CrossRef]
  14. Farzaneh, A.; Khorasani, M.; Farabi, E.; Gibson, I.; Leary, M.; Ghasemi, A.; Rolfe, B. Sandwich structure printing of Ti-Ni-Ti by directed energy deposition. Virtual Phys. Prototyp. 2022, 17, 1006–1030. [Google Scholar] [CrossRef]
  15. Lambiase, F.; Liu, F. Recent advances in metal-polymer joining processes. In Joining Processes for Dissimilar and Advanced Materials; Elsevier: Amsterdam, The Netherlands, 2022; pp. 123–151. [Google Scholar]
  16. Berges, J.M.; van der Straeten, K.; Jacobs, G.; Berroth, J. Towards a Model-Based Approach for the Optimization of the Mechanical and Economical Properties of Laser-Based Plastic-Metal Joints. Key Eng. Mater. 2022; in press. [Google Scholar]
  17. Spütz, K.; Berges, J.; Jacobs, G.; Berroth, J.; Konrad, C. Classification of Simulation Models for the Model-based Design of Plastic-Metal Hybrid Joints. Procedia CIRP 2022, 109, 37–42. [Google Scholar] [CrossRef]
  18. Berges, J.M.; van der Straeten, K.; Jacobs, G.; Berroth, J.; Gillner, A. Model-Based Estimation of the Strength of Laser-Based Plastic-Metal Joints Using Finite Element Microstructure Models and Regression Models. Materials 2021, 14, 5004. [Google Scholar] [CrossRef]
  19. Lambiase, F.; Genna, S.; Kant, R. Optimization of laser-assisted joining through an integrated experimental-simulation approach. Int. J. Adv. Manuf. Technol. 2018, 97, 2655–2666. [Google Scholar] [CrossRef]
  20. Rodríguez-Vidal, E.; Lambarri, J.; Soriano, C.; Sanz, C.; Verhaeghe, G. A Combined Experimental and Numerical Approach to the Laser Joining of Hybrid Polymer—Metal Parts. Phys. Procedia 2014, 56, 835–844. [Google Scholar] [CrossRef] [Green Version]
  21. Müller, S.; de Luca, P.; Tramecon, A. Multi-Scale Analysis of Joints in Hybrid Metal/Composite Structures in ESI Virtual Performance Solution (VPS). In Proceedings of the 21st International Conference on Composite Materials, Xi’an, China, 20–25 August 2017. [Google Scholar] [CrossRef]
  22. Engelmann, C.; Eckstaedt, J.; Olowinsky, A.; Aden, M.; Mamuschkin, V. Experimental and Simulative Investigations of Laser Assisted Plastic-metal-joints Considering Different Load Directions. Phys. Procedia 2016, 83, 1118–1129. [Google Scholar] [CrossRef]
  23. Ma, F.; Chen, S.; Han, L.; Wang, Z.; Pu, Y. Experimental and numerical investigation on the strength of polymer-metal hybrid with laser assisted metal surface treatment. J. Adhes. Sci. Technol. 2019, 33, 1112–1129. [Google Scholar] [CrossRef]
  24. Hao, P.; Yang, H.; Wang, Y.; Liu, X.; Wang, B.; Li, G. Efficient reliability-based design optimization of composite structures via isogeometric analysis. Reliab. Eng. Syst. Saf. 2021, 209, 107465. [Google Scholar] [CrossRef]
  25. Hu, W.; Park, D.; Choi, D. Structural optimization procedure of a composite wind turbine blade for reducing both material cost and blade weight. Eng. Optim. 2013, 45, 1469–1487. [Google Scholar] [CrossRef]
  26. Wang, Z.; Sobey, A. A comparative review between Genetic Algorithm use in composite optimisation and the state-of-the-art in evolutionary computation. Compos. Struct. 2020, 233, 111739. [Google Scholar] [CrossRef]
  27. Nikbakt, S.; Kamarian, S.; Shakeri, M. A review on optimization of composite structures Part I: Laminated composites. Compos. Struct. 2018, 195, 158–185. [Google Scholar] [CrossRef]
  28. Shrestha, P.R.; Timalsina, D.; Bista, S.; Shresta, B.; Shakya, T.M. Generative design approach for product development. In Proceedings of the 7th International Conference on Engineering, Applied Sciences and Technology (ICEAST2021), Pattaya, Thailand, 1–3 April 2021; p. 20008. [Google Scholar]
  29. Gao, T.; Zhang, W.; Zhu, J. Topology Optimization in Engineering Structure Design; Elsevier Science: Amsterdam, The Netherlands, 2017. [Google Scholar]
  30. Systematic Calculation of Highly Stressed Bolted Joints, 2230, VDI—The Association of German Engineers. Available online: https://www.beuth.de/en/technical-rule/vdi-2230-blatt-1/242566299 (accessed on 5 May 2022).
  31. Zang, A.; Stephansson, O. Stress Field of the Earth’s Crust; Springer: Dordrecht, The Netherland, 2010. [Google Scholar]
  32. Berges, J.; Jacobs, G.; Stein, S.; Sprehe, J. Methodology for the Concept Design of Locally Reinforced Composites. Appl. Sci. 2021, 11, 7246. [Google Scholar] [CrossRef]
  33. Scitovski, R.; Sabo, K.; Martínez-Álvarez, F.; Ungar, Š. Cluster Analysis and Applications; Springer International Publishing: Cham, Switzerland, 2021. [Google Scholar]
  34. Rodríguez-Vidal, E.; Sanz, C.; Lambarri, J.; Quintana, I. Experimental investigation into metal micro-patterning by laser on polymer-metal hybrid joining. Opt. Laser Technol. 2018, 104, 73–82. [Google Scholar] [CrossRef]
  35. Hopmann, C.; Kreimeier, S.; Keseberg, J.; Wenzlau, C. Joining of Metal-Plastics-Hybrid Structures Using Laser Radiation by Considering the Surface Structure of the Metal. J. Polym. 2016, 2016, 4734913. [Google Scholar] [CrossRef] [Green Version]
  36. Zhao, S.; Kimura, F.; Kadoya, S.; Kajihara, Y. Experimental analysis on mechanical interlocking of metal–polymer direct joining. Precis. Eng. 2020, 61, 120–125. [Google Scholar] [CrossRef]
  37. Gebauer, J.; Fischer, M.; Lasagni, A.F.; Kühnert, I.; Klotzbach, A. Laser structured surfaces for metal-plastic hybrid joined by injection molding. J. Laser Appl. 2018, 30, 32021. [Google Scholar] [CrossRef]
  38. Park, K.; Paulino, G.H. Cohesive Zone Models: A Critical Review of Traction-Separation Relationships Across Fracture Surfaces. Appl. Mech. Rev. 2011, 64, 060802. [Google Scholar] [CrossRef]
  39. Da Silva, L.F.M. Modeling of Adhesively Bonded Joints; Springer: Berlin/Heidelberg, Germany, 2008. [Google Scholar]
  40. Sun, C.T.; Jin, Z.-H. Cohesive Zone Model. In Fracture Mechanics; Elsevier: Amsterdam, The Netherlands, 2012; pp. 227–246. [Google Scholar]
  41. Khoramishad, H.; Crocombe, A.; Katnam, K.; Ashcroft, I. A generalised damage model for constant amplitude fatigue loading of adhesively bonded joints. Int. J. Adhes. Adhes. 2010, 30, 513–521. [Google Scholar] [CrossRef]
  42. Pothen, M.; Winands, K.; Klocke, F. Compensation of scanner based inertia for laser structuring processes. J. Laser Appl. 2017, 29, 12017. [Google Scholar] [CrossRef] [Green Version]
  43. ScanlabScanlab. Product Brochure: RTC5 Control Board. Available online: www.scanlab.de (accessed on 9 May 2022).
  44. Venter, G. Review of Optimization Techniques. In Encyclopedia of Aerospace Engineering; Blockley, R., Shyy, W., Eds.; John Wiley & Sons, Ltd.: Chichester, UK, 2010. [Google Scholar]
  45. Deb, K.; Pratap, A.; Agarwal, S.; Meyarivan, T. A fast and elitist multiobjective genetic algorithm: NSGA-II. IEEE Trans. Evol. Comput. 2002, 6, 182–197. [Google Scholar] [CrossRef] [Green Version]
  46. Haus, L.C.; Saunders, B.E.; Acosta, J.E.; Allard, T.E.; Brindley, K.A.; Morello, A.J. Assessing Predictive Capabilities for Nonlinear Dynamic Structural Responses. In Special Topics in Structural Dynamics & Experimental Techniques; Epp, D.S., Ed.; Springer International Publishing: Cham, Switzerland, 2021; Volume 5, pp. 233–254. [Google Scholar]
  47. Askes, H.; Rodríguez-Ferran, A.; Hetherington, J. The effects of element shape on the critical time step in explicit time integrators for elasto-dynamics. Int. J. Numer. Meth. Eng. 2015, 101, 809–824. [Google Scholar] [CrossRef]
Figure 1. Laser-based joining process of plastics and metals.
Applsci 12 10649 g001
Figure 2. Approach for the automated design of laser-based plastic–metal joints.
Applsci 12 10649 g002
Figure 3. Mechanical characteristics of laser-based plastic–metal joints based on a FE-Model of a single cavity (RVE).
Applsci 12 10649 g003
Figure 4. The stress threshold is used to reduce the microstructured area by filtering low-stressed elements.
Applsci 12 10649 g004
Figure 5. Decomposition of the stress vector S into an in-plane angle (phi) and out-of-plane angle (theta).
Applsci 12 10649 g005
Figure 6. (a) RVE model and (b) cohesive zone model approach for laser-based hybrid joints.
Applsci 12 10649 g006
Figure 7. (a) Bilinear traction-separation law; (b) multidimensional traction-separation law with trapezoidal damage evolution.
Applsci 12 10649 g007
Figure 8. Arbitrarily shaped surface with dimensions of the individual cavities.
Applsci 12 10649 g008
Figure 9. Dimensions and boundary conditions of the single-lap-joint specimen.
Applsci 12 10649 g009
Figure 10. Resulting concepts for the demonstration example. In (a) and (b) the theta and phi angles are shown. In (e) the von Mises distribution is shown. (f) shows the application of the stressThreshold for a value of 0.1. In (c,d,g) the use of two, three and four clusters are shown.
Applsci 12 10649 g010
Figure 11. Optimization approach for the concept design of laser-based plastic–metal joints.
Applsci 12 10649 g011
Figure 12. Comparison of force–displacement curves for the micromodel and the cohesive-zone model.
Applsci 12 10649 g012
Figure 13. Comparison of the estimated force at failure for the experiment, micromodel, and CZM (b) for a single-lap joint with distance = 300 µm (a).
Applsci 12 10649 g013
Figure 14. 3D illustration of the cohesive-zone models for different distances.
Applsci 12 10649 g014
Figure 15. Results of the optimization approach. The relative values are given in comparison to the respective benchmarks (see Table 2).
Applsci 12 10649 g015
Figure 16. Winning scenarios of the optimization approach for the benchmarks with a distance of 300 µm (a), 400 µm (b), 500 µm (c) and 600 µm (d) (see Table 2).
Applsci 12 10649 g016
Figure 17. Optimization history of the benchmark (b).
Applsci 12 10649 g017
Table 1. Values for the laser cost calculation (reproduced from ref. [16] with kind permission of Trans Tech Publications).
ParameterValue
Capital costs CC100,000 €
Write-off time tw8 years
Relative maintenance costs Cm20% p.a.
Footprint F 5 m2
Building costs CF3.5 €/m2 p.M.
Running hours tr2000 h p.a.
Energy costs CE0.405 €/h
Table 2. Benchmark values for the classical design with linear and parallel structures.
TypeDistance (µm)Costs (€)Max. Load (N)CavitiesMark Distance (mm)
a (classical)3000.002372831405904
b (classical)4000.001782475304428
c (classical)5000.001482363253690
d (classical)6000.001192021202952
Table 3. Optimization settings for NSGA-II, design variables, and objectives.
ParameterValues
Algorithm settingsPopulation Size12
Number of Generations20
Crossover Probability0.9
Crossover Distribution Index10
Mutation Distribution Index20
Initialization ModeRandom
Design VariablesstressThreshold[0; 35]
Distances d1–dn[300 µm; 1000 µm]
Number of clusters3
ObjectivesStrength≥Benchmark
Costsminimize
Table 4. Material properties of the metal and plastic component.
Steel (1.4301)Plastic (PP/GF40)
Modulus (MPa) 200,0009200
Density (g/cm3) 7.91.2
Poisson ratio 0.30.35
Tensile strength (MPa) -185
Strain at break (%) -2.3
Table 5. Parameters for the cohesive-zone model (distance = 300 µm).
ParameterValueUnit
σmax,shear38.55MPa
σmax,tensile18.88MPa
Eshear9200MPa
Etensile1750MPa
Rshear0.1-
Rtensile0.6-
Gshear0.6J
Gtensile0.4J
Publisher’s Note: MDPI stays neutral with regard to jurisdictional claims in published maps and institutional affiliations.

