Article

Intelligent Real-Time Modelling of Rider Personal Attributes for Safe Last-Mile Delivery to Provide Mobility as a Service

1
Northumbria Future Aerospace, Control and Transportation Research Group (n-FACT), Northumbria University, Newcastle upon Tyne NE1 8ST, UK
2
Department of Civil, Structural and Environmental Engineering, Trinity College Dublin, The University of Dublin, Dublin 2 D02 PN40, Ireland
3
School of Computer Science, University of Hull, Kingston upon Hull HU6 7RX, UK
4
Faculty of Sustainable Development and Engineering, Rose-Hill Campus, University of Mascareignes, Beau Bassin-Rose Hill 71203, Mauritius
*
Authors to whom correspondence should be addressed.
Appl. Sci. 2022, 12(20), 10643; https://doi.org/10.3390/app122010643
Submission received: 7 August 2022 / Revised: 14 October 2022 / Accepted: 18 October 2022 / Published: 21 October 2022
(This article belongs to the Special Issue Future Transportation)

Abstract

:
This paper develops an intelligent real-time learning framework for the last-mile delivery of mobility as a service in city planning, based upon safe infrastructure use. Through a hybrid approach integrating statistics and supervised machine learning techniques, knowledge-driven solutions based on the specific user rather than generalized safe mobility practices are suggested. One of the most important aspects influencing transport mode and route selection, and safe infrastructure usage, i.e., the age of the user, is simulated. This is because this variable has been described in the literature as a significant variable. Nonetheless, few works deal with such modelling or the learning system. The learning system was applied in the Northumbria region of England’s northeast as a case study. It comprised four building toolkits: (a) Input toolkit, (b) Safety Predictive toolkit, (c) Variable causation toolkit, and (d) Route choice toolkit. An accurate dynamic road safety model and understanding of the critical parameters influencing bicycle rider safety is created. The developed deep learning model’s average distinguishing power to reliably predict the riskiest age group was 95%, with a standard deviation of 0.02, suggesting a good prediction accuracy across all age groups. According to the study’s findings, different infrastructural networks represent varying risks to bicycle riders of different ages. The rider’s age impacts how other road users engage with them. The regional diversity in trip intent and traffic flow conditions were significant elements influencing the safe use of infrastructure for a specific age group. The study’s findings have the potential to considerably influence infrastructure route selection, modelling, and planning. The constructed model, which integrates the rider’s fragility, sensitivity to externalities, and the varied safety impact dependent on its features, may even be used for the infrastructure still in the planning/design phase. It is envisaged that this research would aid in adopting sustainable (green) transportation options and the last-mile delivery of mobility as a service. Future work should aim to uncover the sensitivities of a rider from different countries and make a baseline comparison scenario.

1. Introduction

The current transportation system has many shortcomings. These include a higher carbon footprint, socioeconomic inequity, longer travel times, and a detrimental impact on air quality. Transportation is critical for a civilization to thrive and prosper. It offers access to healthcare, education, jobs, and other services critical to human well-being and consumption. As a result, many approaches are being investigated to make transportation more sustainable, greener, and future-ready. This has led to exploring various mobility concepts, such as mega urban micro-transit and mobility as a service (MaaS), to reduce the harmful elements associated with transportation [1].
Integrating many modes of transportation into a single mobility service that is available on-demand from origin to destination is known as Mobility as a Service (MaaS). The many modalities of transportation can be combined while concentrating on the needs of an individual. Such a system can result in many complications for users and greater impedances for the mode interchanges in the mode and route choice modelling. This new mobility form was initially proposed based on the findings of the Swedish GO:SMART project and research at Alto University [2], and UbiGo. This is an alternative to typical user mobility based on automobile ownership. Mobility is just a commodity the user purchases to complete his intended travel and accomplish the planned activity. It is effectively a chain of steps. Each chain starts at the trip origin, with handover occurring between different modes at each stage [3].
The last handover occurs for the last travel section leading users directly to their destination. This last handover is called the Last Mile delivery Service (LMS). It is the most critical part of the mobility-as-a-service concept and is one of the critical touchpoints of this futurist mobility concept. To date, it is proving to be a significant challenge to design and model MaaS for the present and future urban living spaces, especially at the end of the journey. Global urbanization is the driving force behind the LMS. Urbanization is the tendency of more people to move towards urban regions and megacities. By 2050, big cities will house 70% of the world’s population, or nearly 6.3 billion people [4]. This is expected to change the landscape of the cities. The way people live and move around is expected to change drastically. Hence, it is essential to embark on a pathway of taking better ownership of the roadways for all stakeholders, including vulnerable road users.
A better understanding, modelling, and design of the LMS can significantly help decongest urban areas, as more expansive areas will be accessible for residents and shoppers. New shopping districts/centres have sprung up in the past decade, which has led to a change in shopping habits from the traditional high street to more systemized globalized shopping patterns in the form of mega shopping centres. Some of these entities have excellent transportation connectivity, which is critical for successful business development. These may have their own bus station, parking or even a train station. Such a centre can be spread over miles, with multiple car parks. The proximity to the transportation system drives the market potential of a particular commercial space. The same can be valid for a residential area. This has sometimes resulted in social inequity within the general population, as areas with better connectivity can access the services better while paying the price equally for the bad air quality and traffic congestion. Therefore, a proper last-mile delivery system must be explored. As the present problems cannot be solved through the thinking that created them, an out-of-the-box solution must be explored. Such a system should not pollute the environment, provide accessibility, and be based on technological advancements. This system can be a critical steppingstone for a smart, sustainable, and green transportation system.
In smart cities, the shared economy is expected to emerge as a sustainable consumption model, promoting servicing rather than traditional car ownership [5]. Modelling for future-ready smart cities is further complicated by the concepts of shared living/living streets, which are being promulgated to improve urban living and social interactions, both with the built environment and the associated geographies. Bicycles are being explored in the LMS literature with the broader MaaS. These include studies on bicycles in Belgium (Antwerp) [6], Austria (Vienna) [7], and the UK (Cambridge) [8]. The fundamental advantage of such bike networks is that they may reach users even in places with restricted access, such as pedestrian zones and regions with limited parking [7]. Another advantage is that, compared to other modes, these tend to improve the required degree of physical fitness. Therefore, such a system can lead to a sustainable transportation system, and an improved healthy lifestyle for the user.
In the current literature, the last mile delivery is primarily focused on providing e-commerce logistic support. The COVID-19 pandemic has enhanced this need. However, this should not let us lose sight of the potential benefits of the LMS in providing intelligent, sustainable, and greener mobility. Such mobility form can ensure that our cities are future-ready, and those future generations can continue to reap the benefits of globalization while minimizing its associated harmful impact. Consequently, given how swiftly and unpredictably last-mile logistics are evolving to meet customer demand for on-demand logistic systems, transportation planners must develop quantifiable network indicators. The age of the bicycle rider is a crucial criterion influencing a rider’s safe infrastructure use. A trip maker’s route selection is influenced by both personal attributes and the behaviour of other road users [9]. Personal characteristics include age, gender, and experience [10]. Pucher and Buehler (2008) promoted cycling for the future by urging that cycling be made safe, convenient, and feasible for people of all ages and genders, while building a case for American municipalities to learn from European countries and embrace cycling [11]. The naturalistic investigation of cyclists discovered that the rider’s age group directly impacts the safe use of the infrastructure. The naturalistic investigation conducted on British roadways [12] revealed that motorists exhibit behavioural sensitivity to the appearance of bicyclists. As a result, age is commonly documented in the literature as a crucial road safety variable for cyclists, which functions in conjunction with cyclist flow and other road users’ behavioural sensitivity to affect safety in terms of crash frequency and perceived safety. Therefore, the research aims to develop a green intelligent real-time learning framework for the last-mile delivery of mobility as a service, based on a user’s safe infrastructure usage. This aim will be achieved through the following set of objectives:
(a)
Develop an intelligent real-time learning system for the delivery of the last-mile delivery
(b)
Develop a hybrid methodology that can model the safety of a particular bicyclist.
(c)
Create a predictive dynamic safety model that includes age as an output variable.
(d)
Develop a statistical variable interaction model for a rider’s age and safety.
Through a hybrid approach integrating statistics and supervised machine learning techniques, a knowledge-driven solution based on the specific user rather than generalized safe mobility practices is suggested. One of the most important aspects influencing travel mode and route selection, and safe infrastructure use, is the age of the user (see [13,14,15]). Still, relatively few studies deal with such modelling or the learning system.
The envisioned learning system will include both hardware and software components. Consequently, a hybrid system will be developed that can continually gather data and model it to provide policymakers/city planners with the final needed output that is ready to use. A proactive strategy like this is necessary to achieve the 2030 goal of zero road traffic deaths and to chart a route toward a future-ready, sustainable, integrated transportation system. Intelligent embedded systems must be integrated into transportation research and practice. The suggested intelligent real-time modelling system is explained in the following section, followed by findings and discussion in Section 3, and conclusions in Section 4.

2. Proposed Intelligent Real-Time Modelling System

This section details in great depth the proposed real-time intelligent learning system. It primarily consists of four units: (a) Input Learning Unit (ILU): which continuously collects data in real-time from a variety of sources; (b) Safety Predictive Toolkit (SPT): which develops predictive models that can predict safety in real time; (c) Variable causation Processing Unit (VPU); and (d) Last-Mile service Delivery Unit (LMDU): consists of a Route Choice Unit (RCU), and a Mode Choice Unit (MCU).

2.1. Input Learning Unit

The input learning units consist of automatic data collection units that continuously take data from a series of platforms: (a) Police database to access the crash database, (b) TRAffic flow Database System (TRADS) to access the data from traffic cameras and counters, (c) UK Department for Environment, Food and Rural Affairs (DEFRA), for lighting data, and (d) Urban observatory Newcastle for meteorological data. All the data are combined in a single base file used as input by the further consecutive units.

2.2. Safety Predictive Toolkit (SPT)

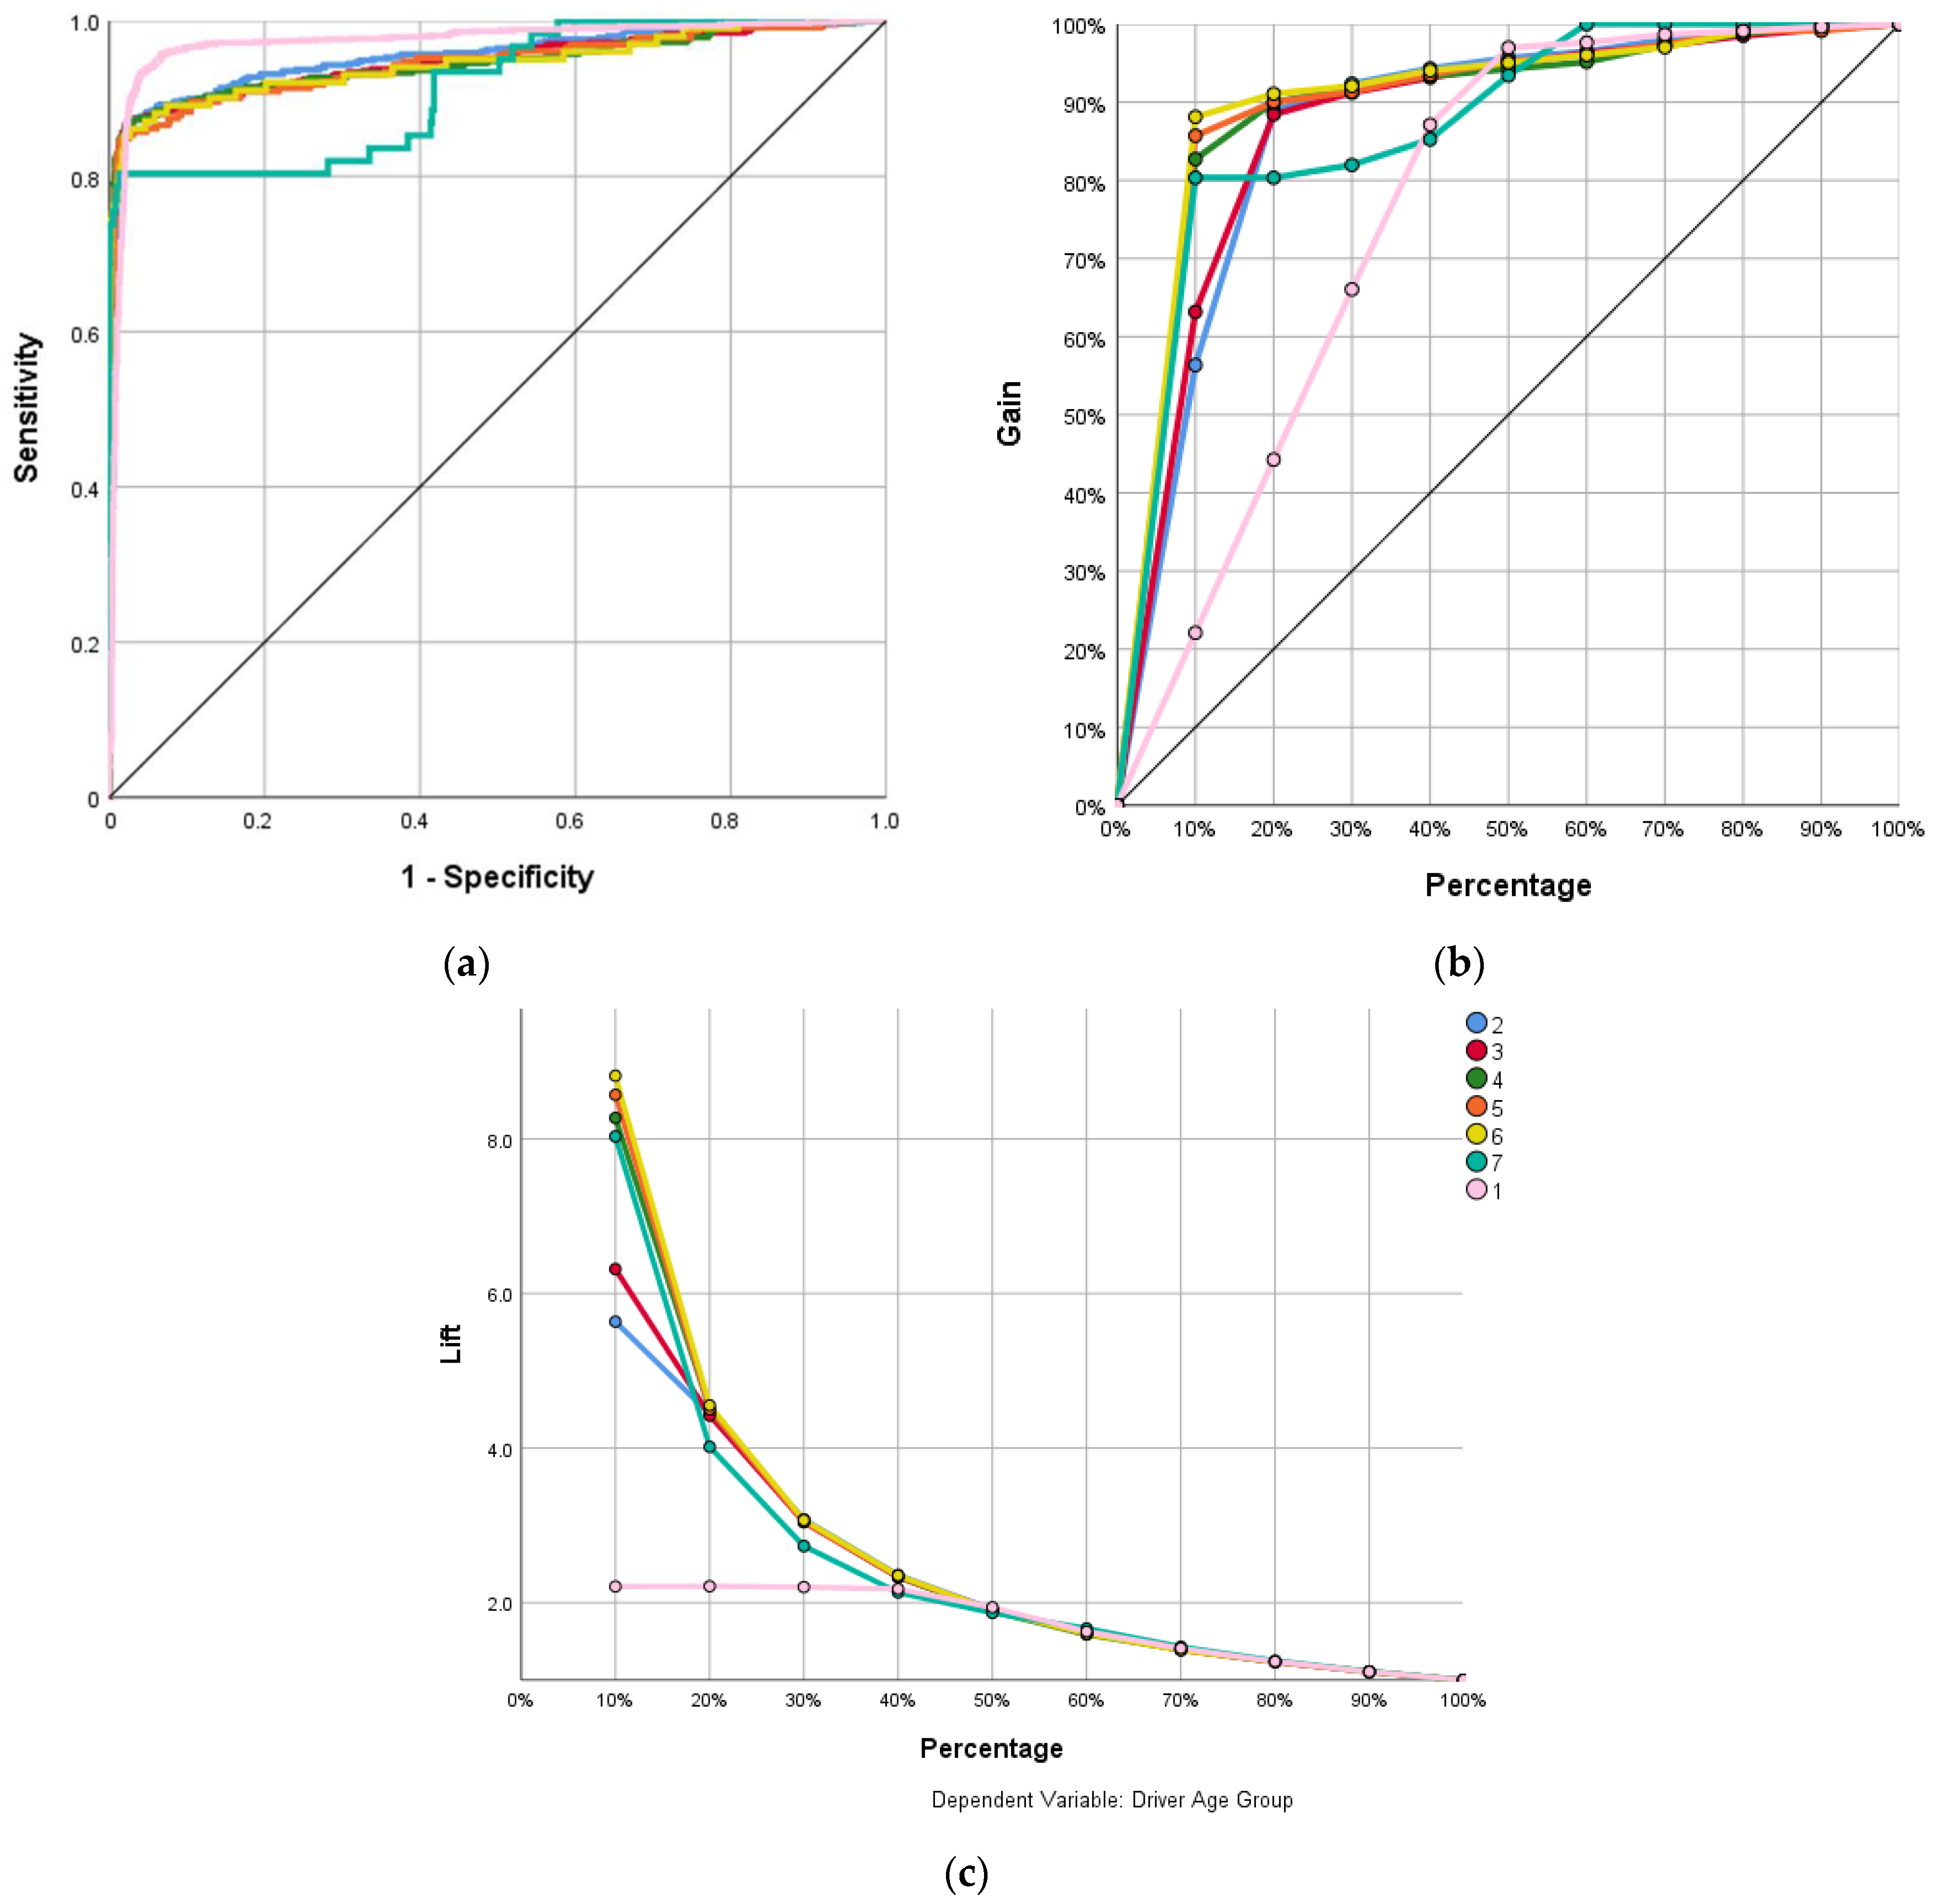
After a base input file was constructed, the associated dataset noise was first removed before proceeding toward data analysis. Safety Predictive models were constructed in this toolkit by modelling the selected input variables from the literature and mapping them with the desired output variables (Table 1). Such grouping of the output variables is the recommended division by the Department for Transport (DfT). The modelling was performed through the neural network classifier and deep learning. The input base file was randomly divided in the ratio of 6.5:3.0:0.5 for Training: Validation: and Testing. This division is advised for the network to develop accurate prediction characteristics. This division guarantees that the network has enough data to learn correctly, evaluate the trained model, and apply the models developed to untrained scenarios. The Bernoulli distribution assures that the data are randomly distributed. Four types of input variables were used for constructing the predictive model: (a) Infrastructure, (b) Spatial, (c) Personal attributes, and (d) Environmental variables.
Twelve infrastructure variables were used for modelling: (a) road type, (b) type of intersection, (c) type of junction control, (d) vehicle manoeuvre—the manoeuvre that the rider was executing or purposefully conducting at the moment of the crash, (e) speed limit, (f) carriageway hazard, (g) vehicle junction location, (h) road location of the vehicle, (i) skidding and overturning, and (j) special site conditions (any infrastructure defects at crash location). At junctions, the rider may be compelled to transfer from one hierarchical level of road classification to another. Hence, two further variables were used for modelling: (k) first road class, and (l) second road class. There were four spatial variables used as input variables. These were (a) hour of the crash, (b) day of the crash, (c) month of the crash, and (d) total number of vehicles involved in the crash. The hour, day, and month of the crash were used as lurking variables to represent the traffic flow conditions. Three personal attributes were used: (a) rider gender, (b) breath test, to check whether the rider was intoxicated during the crash, and (c) purpose of the journey undertaken when the crash occurred. Three environmental variables were used for modelling: (a) prevalent lighting conditions, (b) prevalent meteorological conditions, and (c) meteorological road surface conditions.
The proposed learning system tried to mimic the working of the human brain. A multilayer learning system was developed, with two hidden layers between the input and output layers. The backpropagation algorithm-based four-step iterative learning process was used to map the selected input with the output variables.
Step 1: To begin, random weights were assigned to each layer neuron, and activation functions were employed to transmit signals between different layers.
Step 2: The second phase was error modelling. The cross-entropy error function simulated the difference between the output of random weights and the desired output.
Step 3: The first randomly modified synaptic weights were adjusted in the third step: Based on the error computed in step 2, the initially randomly assigned synaptic weights were adjusted. The backpropagation algorithm was used to achieve this modification.
Step 4: The preceding stages were iterated indefinitely until the maximum number of iterations (epochs), or minimal training error change was reached.
The network structure is explicitly described in Table 2, with the set-out parameters used in the deep learning and neural network classifier. The model was trained by repeatedly exposing the model to input and output samples and modifying the weights to reduce the model’s output error compared to the predicted output. The stochastic gradient descent optimization algorithm was used for this.

2.3. Variable Causation Processing Unit (VPU)

The critical variables in the data learning model were determined through variable importance and normalized importance of each variable concerning the most crucial variable. This was achieved through sensitivity analysis and deep learning. The Boolean logic then followed, presenting the outcome in the form of the single most critical variable impacting the safety of a specific group.

2.4. Last-Mile Delivery Unit (LMDU)

For the last-mile delivery, the results were inputted into diggimap software to select the safest infrastructure and google maps (developed API) for the final correlation. Then, the final route for the last-mile delivery was selected. This was based on the safest route determined by a combination of input variables of variable environmental conditions, infrastructure variables, traffic flow conditions, and rider personal attributes.
A unique hardware system was used for modelling. The hardware included a wireless connection and 128 gigabytes of internal memory. Future studies should look at using the specific processor for the learning system.

2.5. Applied Area

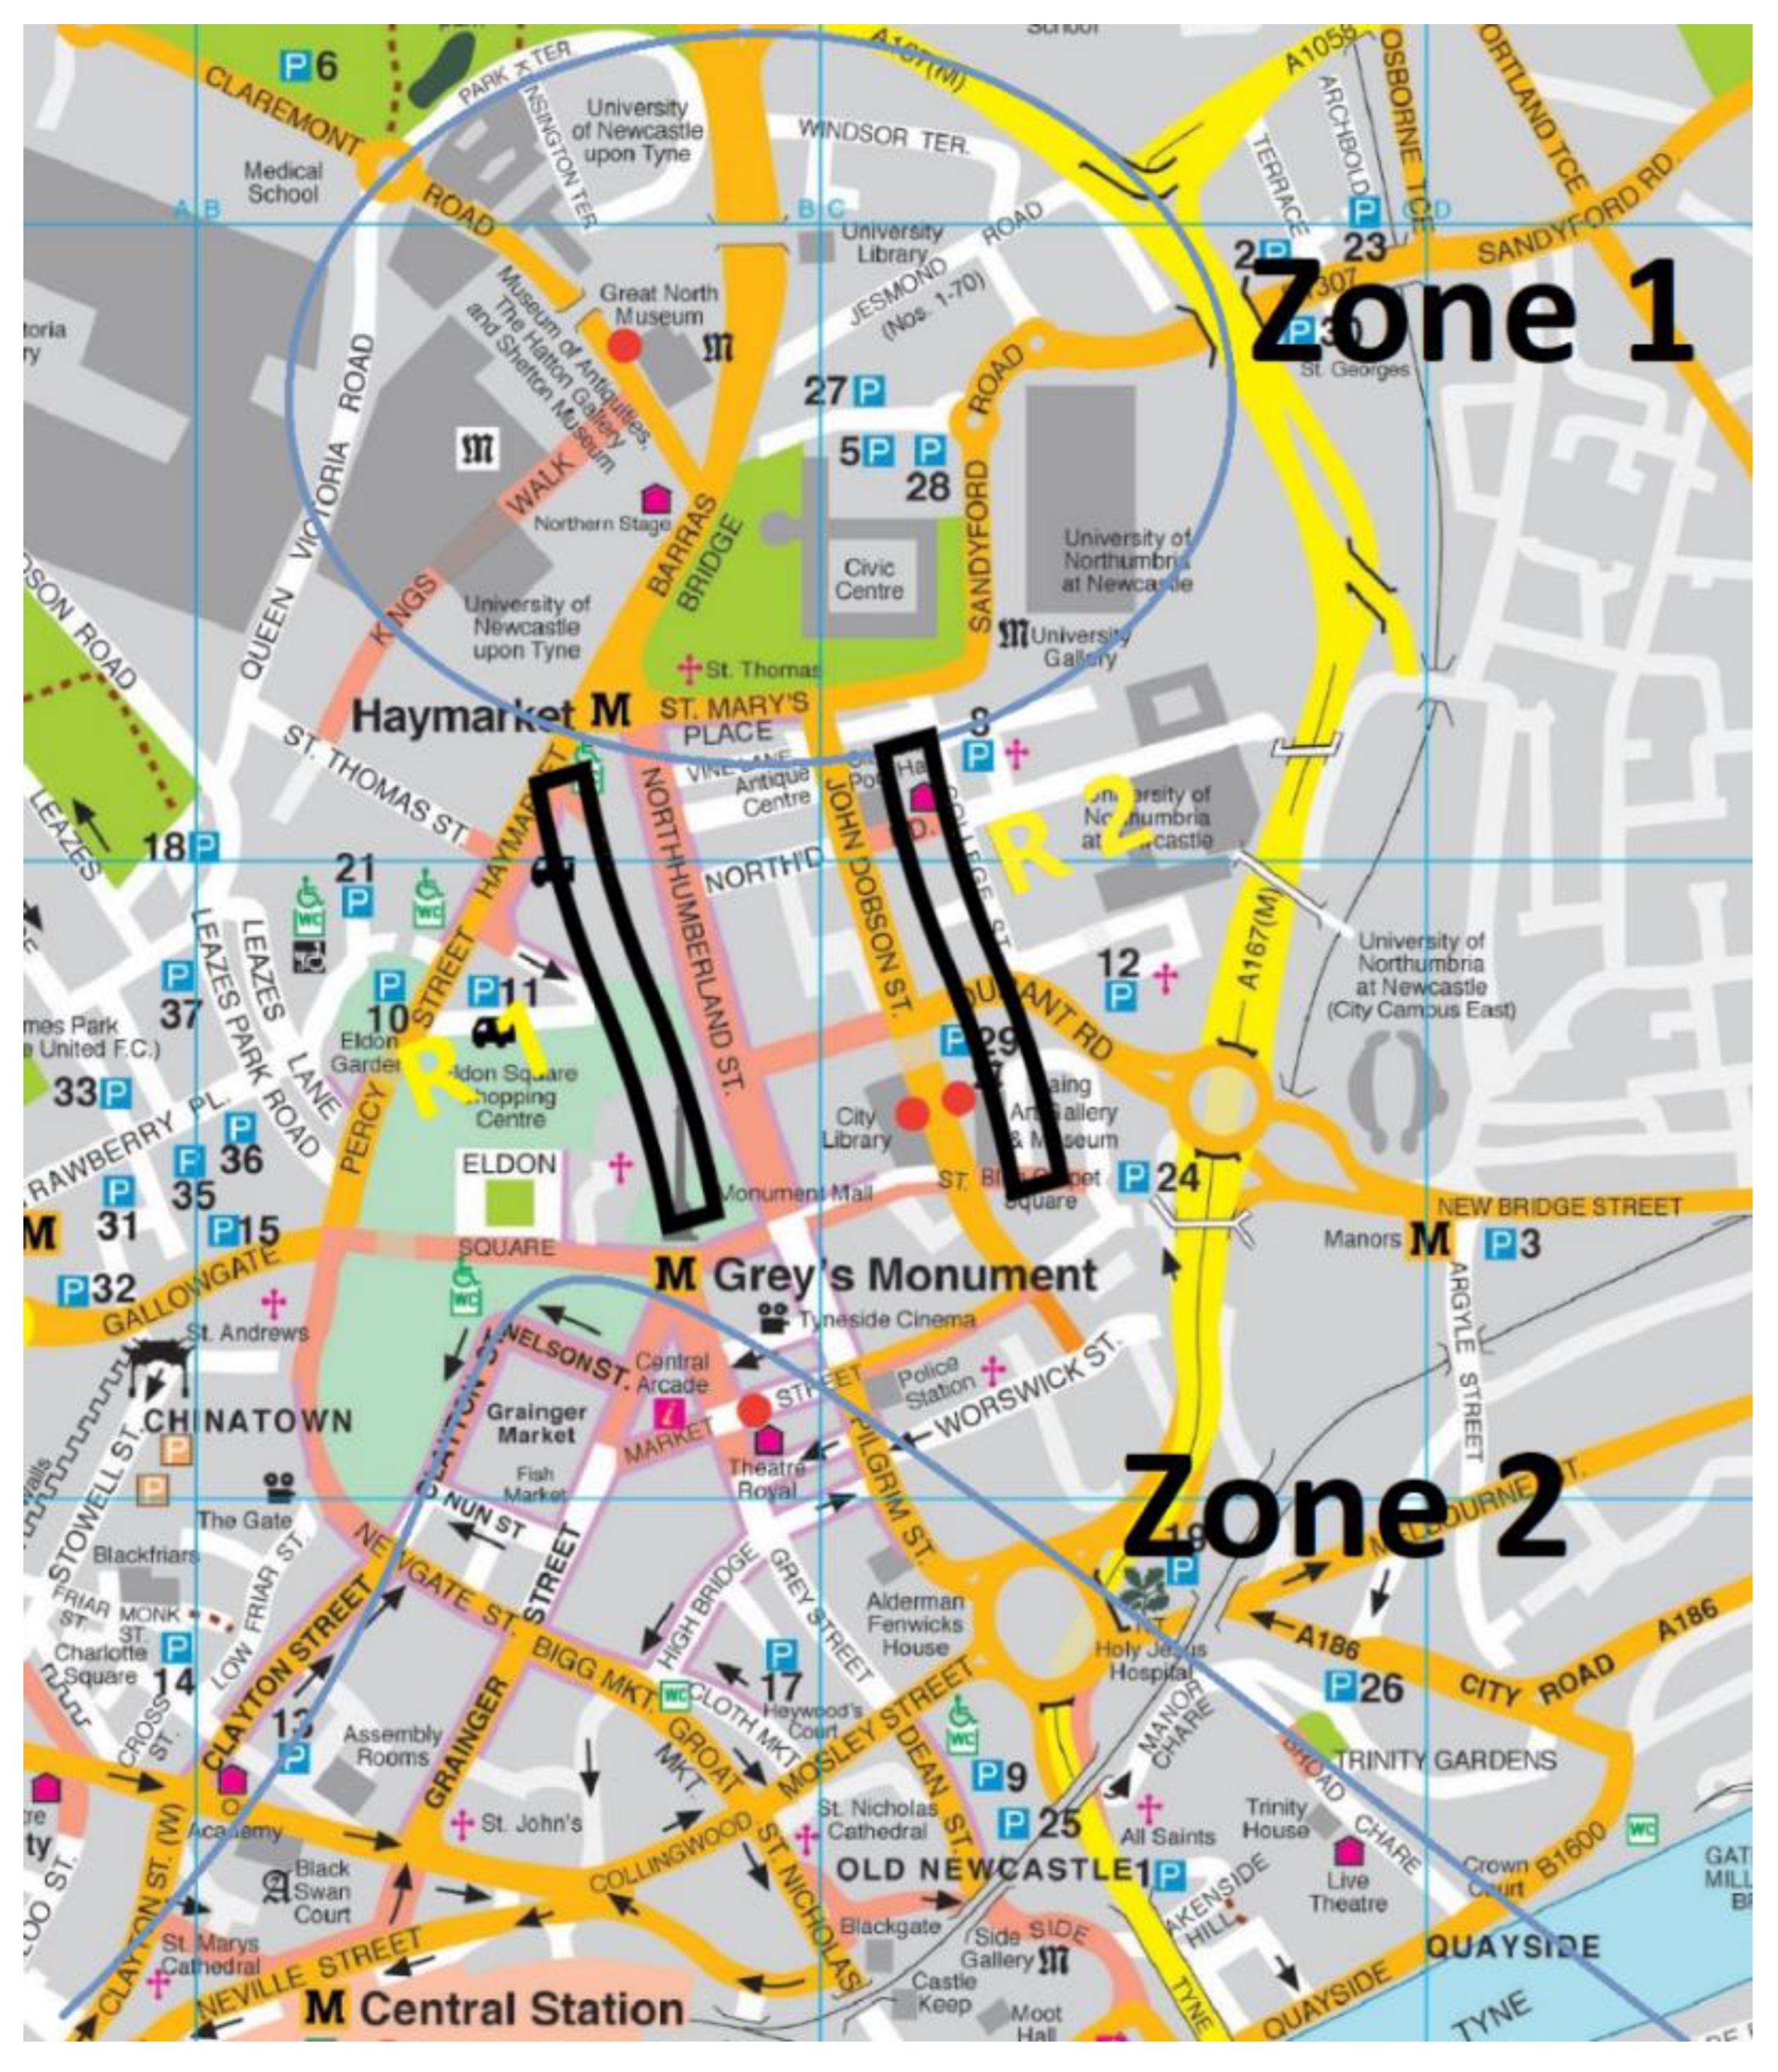
The learning system must be applied in a real-life scenario, as the aim was to develop a system that was applicable and can be used simultaneously by both practitioners and theorists. Hence, the system was applied to the Northeast of England after the theoretical development and evaluation were performed. In the first step, partnerships were formed with the city council, the Department for Transport (DfT), the Department for Environment, Food, and Rural Affairs (DEFRA), and the local observatory. Lighting, collision information, traffic cameras, and counters were accessible and modelled due to such collaborations. The research area’s flow characteristics were gathered via the TRAffic flow Database System (TRADS) by accessing traffic cameras and counters (Figure 1). For each crash, the precise coordinates were collected and used as input to acquire the relevant infrastructure characteristics. Digimaps is a research group-accessible online map and data delivery service run by EDINA at the University of Edinburgh. This platform was used to collect information on infrastructure based on specified coordinates. It provides realistic infrastructure maps that show current and historical situations. This approach assured that correct infrastructure characteristic were used for modelling based on the temporal conditions of the accident rather than the current conditions. The DEFRA data were utilized to input precise meteorological and illumination conditions. These sensors continuously send data into the learning system, transmitting it as a consolidated base input file.

3. Results and Discussion

The following results are obtained from the application of the learning system on the Northumbria region:

3.1. Safety Predictive Toolkit Model

The toolkit constructs a predictive model to predict the safety of each identified age group. The features are detailed in Table 3. Model characteristics (Figure 2) depict the ROC curve, Gain and Lift Charts as output. The obtained lift and gain values are explicitly defined in Table 4. Table 5 displays the AUROC scores to verify the model’s believability by measuring its distinguishable capability to forecast safety correctly. There were 3225 crashes reported in the study area, divided into 1420, 312, 481, 422, 307, 167, 76, and 40 for the 0–16, 17–20, 21–29, 30–39, 40–49, 50–59, 60–69, and >70 age groups, respectively.
The AUROCC values obtained for the over 65 (91 per cent), 55–64 (95 per cent), 45–54 (95 per cent), 35–44 (95 per cent), 25–34 (95 per cent), 17–24 (95 per cent), and under 17 (97 per cent) age groups indicate a high distinguishable capability between the safest and non-safe scenarios, for each of the output variables. The overall model accuracy was 95%, with the same median accuracy and standard deviation of 2%. The results show that the predictive safety toolkit can be used to forecast and model safety in real time with high accuracy. Only a few models in the current literature can distinguish between safe and unsafe scenarios with such reasonable accuracy and efficiency. Most collision prediction models have a forecast success rate of less than 50%, which is well documented in the literature [16]. The model comparison with the accuracy available in the literature is shown in Figure 3. According to Lawson et al. (2013), traditional models are designed for the assignment of motorized modes of transportation and are insufficient for the needs of cyclists because they are unable to quantify the influence of the bicycle safety performance function [17]. According to a survey on safety models [15], for these reasons, more than 70% of European road authorities seldom or never use the collision prediction model in their decision making. The developed model outperforms the current standard road safety models in the literature. This is due to two primary elements: (a) the deep learning neural network’s capacity to simulate the non-linear and complicated interaction between input and output variables, and (b) the selection of suitable compounding components that represent an actual danger to the cyclist rather than perceived or motorist bias variables. Hence, the model created by the safety toolkit is a significant contribution to the literature. The results show that it is possible to predict safety in real-time, contrary to the established convention. Therefore, based on the results, it is recommended that such models are used to model safety for the effective and efficient design of transportation networks and bespoke infrastructure. It has an extra impetus for a vulnerable road user that is subjected to a many-fold higher risk than a motorist (see [18,19,20]).
In the current literature, models are primarily probability-based, with very few works exploring the scope outside the traditional statistical framework (see [21]). The gain and lift charts evaluate the created model’s ability to distinguish itself from a non-model, i.e., a probabilistic approach (baseline scenario). Such analysis helps promote and justify using a complex modelling framework, as proposed in this work. Through the gain, lift charts (Figure 2), and the corresponding values (Table 5), it can be concluded that the field of safety modelling can be improved significantly by shifting to the proposed hybrid methodology. This can result in toolkits promoting cycling as a means of transportation. All the expected outcomes in the gain table are greater than the baseline scenario of 45 degrees, showing the adequacy of the proposed model. The lift chart reflects this; for example, at a 10% data interval, the lift for the <17, 17–24, 25–34, 35–44, 55–64, and over 65 age groups are 2.2, 5.8, 6.3, 8.2, 8.8, and 8, respectively. This leads to the conclusion that the constructed safety performance functions are tailored to the specific demands of cyclists. For modelling, the present framework does not require past crash data. Once the model is built, the numerous input variables of infrastructural, geographical, human, and environmental factors may be used directly to model safety. It can be used for the infrastructure still in the planning and design stages.

3.2. Variable Causation Toolkit

The rider’s journey purpose was the Boolean logic result for the most significant variable determining risk for an age group. Table 6 tabulates the importance of each variable concerning the most critical variable. The journey’s hour, a spatial variable describing the traffic flow regime, came next. They were followed by car manoeuvring and cycle road positioning, which are infrastructure characteristics that define bicycle interaction with the infrastructure. Depending on the rider’s age, the lighting conditions that cyclists face have an impact on their safety. This is a foregone conclusion because how different age groups react to different lighting settings is determined by their experience, physical and cognitive capabilities. The month of the journey (a spatial variable representing a combination of traffic flow regime and journey purpose), meteorological conditions, vehicle junction location, junction details, breath test (intoxication), speed limit, number of vehicles, special conditions at the site, carriageway hazard, day of the journey, road type, and first road class were then displayed. These are primarily infrastructure-related vulnerabilities. As a result, different age groups of cyclists interact differently with different types of road infrastructure. The constructed deep learning model’s variable significance, risk rates, and hotspot heat maps suggest that infrastructure, depending on its age, provides a specific threat to the rider. The findings might substantially impact road legislation, design, and planning. The current models do not consider the variable age; they are predicated on the premise that road safety is age independent. The rider’s age and interaction with the infrastructure under varied traffic flow, environmental, lighting, and meteorological circumstances are crucial variables that impact a cyclist’s safety. These findings provide further encouragement for choosing the last-mile route. As a result of changing the route, the change in time will be only a few seconds or, at most couple of minutes. However, this can considerably improve both perceived and actual safety. This can be critical for mode choice and additionally can be a vital step in establishing confidence in utilizing a bicycle as a method of transportation.

3.3. Route Choice Toolkit

In the route planning toolkit, the minimum travel path algorithm is complemented by the impendence of vehicular flow, specific junction details, and meteorological conditions. It was applied to the city centre of Newcastle city, depicted in Figure 4. The city centre was primarily divided into two zones. The first zone (Z1) housed two major universities with more than 65,000 students, around 7000 staff, and the Newcastle civic centre. The Newcastle civic centre houses all the principal government offices and the family court. The second zone (Z2) houses the major tourist destinations and nightlife venues. Newcastle is known for its nightlife across Europe, making it one of the most student-friendly cities in Europe. Two main routes connect the two zones, the first route (R1) and the second route (R2). Both have distinctive infrastructure features. The safety toolkit developed in the study was applied to both routes. Application of the study’s findings leads to the conclusion that the route choice for a cyclist does not only follow the minimum path algorithm; it depends upon the perceived safety that a route may offer. The two equations were obtained subsequently (Equations (1) and (2)). The perceived safety depends on the traffic flow, the number of conflicts, and infrastructure route parameters. This perceived safety was varied and changes with changes in lighting and meteorological conditions. These results agree with the route choice models developed for Dublin city (see [17,22]). This implies that the regional diversity in route intent and traffic flow conditions are significant variables that impact the safe use of infrastructure for a particular age group. This is a contribution to the present knowledge for the delivery of the last-mile mobility service.
Hence, while designing a last-mile delivery smart mobility system, the route selection needs to consider such variability and choices. This is critical for promoting sustainable mobility that can help users make better-informed decisions based on their preferences rather than designing a system and expecting them to comply. Such a shift in policy and decision-making is critical for a broader stakeholder engagement for better living city spaces. The results from this study can be integrated into the new 15-min city concept that is being explored (see [23]). Presently different electric mobility hubs are being trialled across western Europe to estimate the benefits of such a scheme (see [24]). The variability of a cyclist should be modelled in such a scheme and integrated with an intelligent real-time interactive platform (with a graphical user interface) for both mode and route choices.
R c         S P
S P   a 1 L n 1   a 2 M n 2 a 1 D n 1 a 1 X n 1 a 1 P n 1 a 1 C n 1 a 1 B n 1
where R c is the route choice, S P is the perceived safety, L is the lighting conditions, M is the meteorological conditions, D is the degree of separation of the cyclist from the vehicular motor flow, X is the traffic flow, P is the pedestrian conflicts, C is the cyclist flow, B is the bespoke infrastructure parameters.

4. Conclusions

In this paper, an intelligent real-time learning framework for the last mile delivery of mobility as a service based on safe use of infrastructure by users. A proposed intelligent real-time modelling system was proposed and applied to the Northumbria region of England’s northeast. It consists of four units; (a) Input Learning Unit (ILU), (b) Safety Predictive Toolkit (SPT), (c) Variable causation Processing Unit (VPU), and d) Last-Mile service Delivery Unit (LMDU). A knowledge-driven solution based on the specific user rather than generalized safe mobility practices were used for modelling. This was achieved through a hybrid approach integrating mathematics and supervised machine learning techniques. A predictive dynamic safety model was developed, and the interaction of various variables affecting a rider’s safety for the last-mile delivery was modelled. Users’ characteristics of age, which influence mode and route selection, were simulated.
The real-time intelligent learning system was applied as a case study on the northeast of England. The learning model’s average distinguishing power to reliably predict the riskiest age group was 95%, with a standard deviation of 0.02, suggesting a strong prediction accuracy across all age groups. According to the results, different infrastructural networks represent varying risks to riders of various ages. The rider’s age impacts how other road users engage with them. The regional diversity in trip intent and traffic flow conditions were significant elements influencing the safe use of infrastructure for a specific age group. Through the application of the route choice toolkit, on the Newcastle city centre, it was found that cyclists do not only consider the minimum path algorithm. The important elements influencing cycling route choices include perceived safety, lighting circumstances, meteorological conditions, degree of separation, traffic flow, pedestrian conflicts, cyclist flow, and unique infrastructure characteristics.
The study’s findings can significantly influence road legislation, design, and planning. The rider’s age and interaction with the infrastructure under varying traffic flow, environmental, lighting, and meteorological conditions were important factors influencing a cyclist’s safety. These findings provide further encouragement for choosing the last-mile route. The time difference will be merely a few seconds or at most a couple of minutes because of altering the route. However, this can significantly increase both perceived and actual safety. This can be crucial for mode selection and creating confidence in using a bicycle as a means of transportation. The constructed model, which integrated the rider’s fragility, sensitivity to externalities, and the varied safety impact dependent on its features, may even be used for infrastructure that is still in the planning/design phase. This work provides an in-depth understanding of the last-mile sustainable delivery of MaaS, which can be integrated into the presently researched concept of smart cities, mobility hubs, and fifteen-minute cities. It is envisaged that this research would aid in adopting sustainable (green) transportation options and the last-mile delivery of mobility as a service. Future work should aim to uncover the sensitivities of a rider from different countries and make a baseline comparison scenario.

Author Contributions

Conceptualization, methodology, software, validation, writing, F.A.M., L.D. and K.B.; data collection and review, M.K. and F.A.M., and supervision, funding acquisition, K.B. and L.D. All authors have read and agreed to the published version of the manuscript.

Funding

The authors would like to thank Northumbria University for sponsoring the research through the research development fund and Gateshead City Council for accessing the TADU crash database.

Conflicts of Interest

The authors declare no conflict of interest.

References

  1. Jokinen, J.-P.; Sihvola, T.; Mladenovic, M.N. Policy lessons from the flexible transport service pilot Kutsuplus in the Helsinki Capital Region. Transp. Policy 2019, 76, 123–133. [Google Scholar] [CrossRef]
  2. Heikkilä, S. Mobility as a Service—A Proposal for Action for the Public Administration, Case Helsinki. Ph.D. Thesis, Aalto University, Espoo, Finland, 19 May 2014. [Google Scholar]
  3. Boysen, N.; Fedtke, S.; Schwerdfeger, S. Last-mile delivery concepts: A survey from an operational research perspective. OR Spectr. 2021, 43, 1–58. [Google Scholar] [CrossRef]
  4. Bretzke, W.-R. Global urbanization: A major challenge for logistics. Logist. Res. 2013, 6, 57–62. [Google Scholar] [CrossRef]
  5. Machado, C.A.S.; De Salles Hue, N.P.M.; Berssaneti, F.T.; Quintanilha, J.A. An Overview of Shared Mobility. Sustainability 2018, 10, 4342. [Google Scholar] [CrossRef] [Green Version]
  6. Arnold, F.; Cardenas, I.; Sörensen, K.; Dewulf, W. Simulation of B2C e-commerce distribution in Antwerp using cargo bikes and delivery points. Eur. Transp. Res. Rev. 2018, 10, 2. [Google Scholar] [CrossRef]
  7. Anderluh, A.; Hemmelmayr, V.C.; Nolz, P.C. Synchronizing vans and cargo bikes in a city distribution network. Cent. Eur. J. Oper. Res. 2017, 25, 345–376. [Google Scholar] [CrossRef] [Green Version]
  8. Schliwa, G.; Armitage, R.; Aziz, S.; Evans, J.; Rhoades, J. Sustainable city logistics—Making cargo cycles viable for urban freight transport. Res. Transp. Bus. Manag. 2015, 15, 50–57. [Google Scholar] [CrossRef] [Green Version]
  9. Guthrie, N.; Davies, D.G.; Gardner, G. Cyclist’s Assessments of Road and Traffic Conditions: The Development of a Cyclability Index; Transport Research Laboratory: Crowthorne, UK, 2001. [Google Scholar]
  10. Bill, E.; Rowe, D.; Ferguson, N. Does experience affect perceived risk of cycling hazards? Scott. Transp. Appl. Res. (STAR) 2015, 1–19. [Google Scholar]
  11. Pucher, J.; Buehler, R. Making Cycling Irresistible: Lessons from The Netherlands, Denmark and Germany. Transp. Rev. 2008, 28, 495–528. [Google Scholar] [CrossRef]
  12. Walker, I. Drivers overtaking bicyclists: Objective data on the effects of riding position, helmet use, vehicle type and apparent gender. Accid. Anal. Prev. 2007, 39, 417–425. [Google Scholar] [CrossRef] [PubMed]
  13. Wardman, M.; Hatfield, R.; Page, M. The UK national cycling strategy: Can improved facilities meet the targets? Transp. Policy 1997, 4, 123–133. [Google Scholar] [CrossRef]
  14. Zhang, J.; Lindsay, J.; Clarke, K.; Robbins, G.; Mao, Y. Factors affecting the severity of motor vehicle traffic crashes involving elderly drivers in Ontario. Accid. Anal. Prev. 2000, 32, 117–125. [Google Scholar] [CrossRef]
  15. Theofilatos, A.; Graham, D.; Yannis, G. Factors Affecting Accident Severity Inside and Outside Urban Areas in Greece. Traffic Inj. Prev. 2012, 13, 458–467. [Google Scholar] [CrossRef] [PubMed]
  16. Hossain, M.; Muromachi, Y. A Framework for real-time crash prediction: Statistical Approach versus artificial intelligence. Infrastruct. Plan. Rev. 2009, 26, 979–988. [Google Scholar] [CrossRef] [Green Version]
  17. Lawson, A.R.; Pakrashi, V.; Ghosh, B.; Szeto, W.Y. Perception of safety of cyclists in Dublin City. Accid. Anal. Prev. 2013, 50, 499–511. [Google Scholar] [CrossRef] [PubMed] [Green Version]
  18. Heinen, E.; Maat, K.; van Wee, B. Day-to-Day Choice to Commute or Not by Bicycle. Transp. Res. Rec. J. Transp. Res. Board 2011, 2230, 9–18. [Google Scholar] [CrossRef]
  19. Aldred, R. Cycling near misses: Their frequency, impact, and prevention. Transp. Res. Part A 2016, 90, 69–83. [Google Scholar] [CrossRef]
  20. Bíl, M.; Bílová, M.; Müller, I. Critical factors in fatal collisions of adult cyclists with automobiles. Accid. Anal. Prev. 2010, 42, 1632–1636. [Google Scholar] [CrossRef] [PubMed]
  21. Aashto. Highway Safety Manual, 1st ed.; American Association of State Highway and Transportation Officials: Washington, DC, USA, 2010.
  22. Lawson, A. An Analysis of Cycling Safety and Development of a Bicycle Trip Assignment Methodology. Ph.D. Thesis, Trinity College Dublin, Dublin, Ireland, 2015. [Google Scholar]
  23. Bell, M.; Sarkar, P.K.; Dilum, D.; Namdeo, A. A Methodological Framework to Estimate GHG from Travel Pattern of Tyne & Wear of Newcastle, UK with Various Policy Options using Fuzzy Logic Modal Split Model. Int. J. Eng. Sci. Invent. 2015, 4, 1–5. [Google Scholar]
  24. Bösehans, G.; Bell, M.; Thorpe, N.; Liao, F.; Homem de Almeida Correia, G.; Dissanayake, D. eHUBs—Identifying the potential early and late adopters of shared electric mobility hubs. Int. J. Sustain. Transp. 2021, 1–20. [Google Scholar] [CrossRef]
Figure 1. The overview of the (a) Cyclist flow cameras and (b) Motor vehicle cameras in the study area.
Applsci 12 10643 g001
Figure 2. (a) ROC curve, (b) Gain chart, and (c) Lift chart for the constructed predictive deep learning-based model.
Applsci 12 10643 g002
Figure 3. Comparison of the created model to currently accessible models in the literature.
Applsci 12 10643 g003
Figure 4. Application of route choice toolkit in the city centre of Newcastle upon Tyne.
Applsci 12 10643 g004
Table 1. Output variable for constructing the predictive model.
No.Output VariableNo.Output Variable
1. 0–165.45–54
2.17–246.55–64
3.25–347.Over 65
4.35–44
Table 2. Deep learning network topography.
Topology of the NetworkHidden layers2
Number of neurons in a hidden layer 350
First two layers’ activation functionHyperbolic Tangent
Last layer activation functionSoftmax
Type of error functionCross-entropy
Stopping and Memory CriterionMaximum steps without error change9.9 × 105
Maximum permitted training time9.9 × 105
Maximum number of epochs in training9.9 × 105
Minimum relative training error change0.000001
Minimum training error ratio change0.000001
Maximum memory storage capacity cases999,999
TrainingTraining typeBatch
Training optimisationScaled conjugate gradient
Training Centre0
Training Offset±1 × 10⁻⁹
Training Sigma1 × 10−9
Training Lambda1 × 10−9
Quantity of output nodes7
Table 3. The model features of the predictive model.
InputLayer Units172
Hidden Layer(s)Number 2
Layer units 350
AfHyperbolic tangent
EfCross-entropy
Cee252.7
Output LayerLayer units 7
AfSoftMax
ErCross-entropy
Cee1392.2
Where Af = Activation function, Er = Error function, Cee = Cross entropy error.
Table 4. The gain and lift values for output variables.
VariableGain (Percentage)Lift
Data Point in percentage1030507010010305070100
Under 17226796981002.22.21.91.41
17–24589295981005.831.91.41
25–34639195981006.331.91.41
35–44829396991008.23.11.91.41
55–64889295981008.831.91.41
Over 6580829210010082.71.81.41
Table 5. The output variables’ area under the receiver operating curve (AUROC).
VariableAUROCVariableAUROC
<170.9717–240.95
25–340.9535–440.95
45–540.9555–640.95
>650.91Average 0.95
St. Dev0.02Median0.95
Table 6. Normalized importance of the input variables.
Variable ImportanceNormalised Importance
Rider journey purpose 0.058100.0%
Hour0.05492.8%
Vehicle Manoeuvre0.05288.3%
Road Location of Vehicle0.04983.7%
Light Conditions0.04678.9%
Month0.04576.9%
Weather0.04576.7%
Junction Location of Vehicle0.04576.3%
Junction Detail0.04475.6%
Breath Test0.04374.2%
Speed Limit0.04372.9%
Number of Vehicles0.04372.8%
Special Conditions at Site0.04272.1%
Carriageway Hazards0.04271.4%
Day0.04170.6%
Road Type0.04069.0%
1st Road Class0.04068.9%
2nd Road Class0.03967.5%
Road Surface Condition0.03762.5%
Skidding and Overturning0.03661.3%
Junction Control0.03458.1%
Driver Gender0.02746.3%
Weekday or Weekend0.02745.8%
Publisher’s Note: MDPI stays neutral with regard to jurisdictional claims in published maps and institutional affiliations.

