Article

Development of an Algorithm for Determining Defects in Cast-in-Place Piles Based on the Data Analysis of Low Strain Integrity Testing

Department of Automation of Technological Processes and Production, St. Petersburg Mining University, 2, 21 Line of Vasi-lyevsky Island, 199106 St. Petersburg, Russia
*
Author to whom correspondence should be addressed.
Appl. Sci. 2022, 12(20), 10636; https://doi.org/10.3390/app122010636
Submission received: 14 July 2022 / Revised: 17 October 2022 / Accepted: 19 October 2022 / Published: 21 October 2022
(This article belongs to the Special Issue Advanced Design and Manufacturing in Industry 4.0)

Abstract

:
Low strain integrity testing for pile quality control, based on the analysis of elastic waves, is one of the most common methods, due to its high efficiency. However, it also has a number of limitations that should be taken into account during pile testing. For additional study of the method and its effectiveness, an experimental site was constructed, consisting of ten cast-in-place piles with embedded defects. When analyzing field data, pile defects were not identified. For further analysis of the problem, as well as for interpreting the results and identifying pile defects, a cluster analysis method, the so-called ANN-classifier, is proposed. This paper describes the results of creating an algorithm for the recognition of defects and their localization in cast-in-place piles. It is proposed that use of the characteristic points of the spectrum of the signal as the input vector of the ANN classifier, and the type of pile defect as the output vector, is optimal. The results of the study led to the conclusion that the ANN-classifier can be used as the main tool for automatic interpretation of the results obtained by low strain integrity testing.

1. Introduction

Urbanization is a trend in the modern world [1,2]. Today, more than 50% of the world’s population lives in cities, and this tendency is growing gradually [3,4]. In order to cope with the needs triggered by the urbanization process, the construction industry is experiencing some transformations. For example, dust suppression systems are being implemented or improved [5,6]; new approaches to mining [7,8], processing, and recycling are being developed [9,10,11]. Moreover, the construction of high-rise buildings using underground space is also one example of such transformations. [12,13]. Cast-in-place piles have established themselves as one of the most reliable means of achieving safer construction and reliable operation of buildings and structures [14,15], especially in the construction of multi-storey buildings, as well as in conditions of soft soils and permafrost [16,17].
The primary task determining reliability is control of the quality of the work performed, which determines the bearing capacity of the pile, its achievement of the design depth, and so on. Although it is possible to identify deviations from the standard in driven piles at the production stage by means of inspection, the situation with cast-in-place piles is more complicated. In this type of pile, particular attention must be paid to integrity control, because of the defects occurring during pile installation, such as washout of concrete mixture, soil inclusions, caverns, voids, and so on. These cannot be visually identified and can lead to a reduced bearing capacity of the pile.
The most common methods for integrity testing are low strain integrity testing [18,19], ultrasonic pile integrity testing, and thermal integrity profiling [20,21]. There are also other methods for evaluating pile integrity and bearing capacity. For example, research [22] shows the relationship between pile deformation and changes in the magnetic field. A non-contact method has been proposed to determine deformations caused by hammer impact, using a dynamic magnetic scattering field. A study [23] gives an estimation of the limit state of piles using a parametric model by determining the lateral reaction of the pile. It shows the interaction of the pile and the soil evaluated by a number of parameters, such as, for example, pile cross-section size, concrete grade, reinforcement percentage, longitudinal and transverse reinforcement coefficient, axial load coefficient, and effective friction angle of the sand.
All of these methods certainly give a result and prove their worth when used on construction sites. However, they are most effective only after deciphering the values obtained. This interpretation requires time and manpower. In this case, the interpretation of the results largely depends on the human factor [24,25]. Under the given conditions, it is reasonable to develop algorithms that automate the process of interpretation of the results during pile integrity tests.
The purpose of this paper is to create an algorithm for defect detection and localization in cast-in-place concrete piles, based on low strain integrity testing data for pile integrity assessment, suitable for use on a construction site and capable of integration into existing instrumentation architectures. The integration capability implies the development of an algorithm that slightly increases the computational and power consumption of the existing equipment, as well as the computational modules of the instrumentation [26,27].
The means of interpretation of research results from low strain integrity testing widely varies: statistical methods, neural networks, wavelet transform, and so on [28,29]. Neural networks in general [30,31] and ANN classifier in particular [32,33], have demonstrated great efficiency in solving similar problems. Thus, a paper [34] shows the application of wavelet transform and machine learning to accurately determine the origin of acoustic signal when using an acoustic method of pile integrity control. One article [35] deals with the application of the acoustic emission method to control the process of corrosion and cracking in large diameter cast-in-place concrete piles. An acoustic emission signal filter, based on the amplitude and duration of the peak frequency, has been proposed. It is well-documented that joint analysis of acoustic emission signals and fractal dimensioning of coating cracks throughout the corrosion period allows global detection of local corrosion damage of piles, irrespective of sensor location.
One study [36] uses probabilistic neural network architecture to diagnose the causes of damage to prestressed cast-in-place concrete piles; it is used to determine the general features of concrete pile damage and their causes.
Most of the work related to neural network algorithms is used to solve regression problems in the broad sense—that is, predicting various values, such as predicting the pile load-settlement curve using the properties of the pile [37]; predicting the piles’ lateral deflection [38]; predicting the bearing capacity of piles [39]; predicting the skin friction capacity of driven piles embedded in clay [40]; and predicting the pile settlement [41]. For these purposes, the ANN-model is used and requires complex computing power for its implementation. One paper [42] uses a classifier applied to numerical pile integrity tests considering concrete piles; however, to reduce the input data dimension and extract features, it is proposed to use the model obtained by the finite element method.
Thus, the hypothesis of this paper can be formulated as follows. An algorithm based on an ANN classifier, its input vector being the characteristic points of the spectrum of the received signal and the output type of the pile defect, can be used as the main tool for the automatic interpretation of the results of pile integrity testing, conducted with the low strain integrity testing method.

2. Materials and Methods

Currently, low strain integrity testing [43,44] is one of the most common methods used for pile integrity control. This method of non-destructive control is based on the principle of acoustic flaw detection, founded on the physical phenomenon of elastic wave propagation—namely, the analysis of the passage and reflection of an acoustic wave in a pile [45,46,47]. The elastic wave is generated with handheld hammer impact on a pile top that is dry and clean. The wave spreads along the pile’s body and reflects off the pile defects, as well as from the pile toe. The reflected waves are recorded by a sensor mounted on the pile head and further processed by special computer software.
Although this method is widely used and has clear advantages, it also has a number of limitations [18,48]. For example, small defects, inclusions, and minor changes in the pile cross-section cannot be detected using this method. The acoustic properties of the surrounding soil also affect the accuracy of the pile length determination. In addition, in most cases, the test method does not allow for estimation of the pile integrity after the first significant signal anomaly.
This work proposes a method of cluster analysis, the so-called ANN classifier, for interpretation of results and identification of pile defects. An important feature of the proposed solution is the data set proposed for use in creating the ANN classifier. The aggregation of this dataset will be based on the characteristic points of the signal spectrum obtained from the sensors. In this paper, we suggest using the peak points of the signal spectrum as such points. The principle of finding characteristic points is used in related fields, such as power engineering [49,50], medicine [51,52], and so on.
The development of an ANN classifier. Data processing was conducted using Matlab software and the Classification Learner application. This software is widely used for various engineering applications [53,54].
The proposed method has low computational complexity and can be realized on inexpensive equipment, allowing for quick interpretation of pile integrity test results in the field.

3. Experiments

To obtain the initial data, an experimental site was constructed, consisting of ten CFA piles with defects, which corresponded to types of defects such as soil inclusions and washout of the concrete mixture in the pile body [55].
The piles were constructed using CFA (continuous flight auger) technology, namely by rotation of a 450 mm diameter hollow auger to a depth of 3 m. After this, the concrete mixture was pumped into and filled the drilled borehole. The defects were made of polystyrene with the following dimensions: (1) Ø250 mm, 100 mm thick; (2) 100 × 150 × 300 mm; (3) 100 × 150 × 150 mm. Such defect sizes were chosen to test the resolution of the low strain integrity testing and its ability to localize and recognize small defects. Defects in expanded polystyrene correspond to such defects as soil inclusions and washing out of concrete from the pile shaft. Taking into account the production experience with piles, such defects are the most common in weak and water-saturated soils. The defects were fixed in the middle of the reinforcement cage with a tying wire and lowered in a borehole filled with concrete mixture. Three piles were constructed for each type of defect, including one flawless pile (Figure 1).
The test was performed 7 days after casting. The pile tops were cleaned and smoothly grinded. The test was carried out with the Interpribor Spectr-4 equipment set, which includes a tablet computer, a special hammer, and an accelerometer sensor. At least five impacts were applied to each pile top at several locations, with a rubber hammer weighing approximately 0.5 kg. The accelerometer was attached to the top of the pile with a special putty for better acoustic contact. A low strain integrity testing diagram is shown in Figure 2.
This paper is the first in the search for an algorithm for the automatic interpretation of pile integrity test results obtained by low strain integrity testing. Therefore, experiments were carried out to test the validity of the proposed hypothesis. Only the shape and position of the artificially created pile defect was a variable parameter. The length, diameter, and casting method of the pile were constant. It is exactly these experimental conditions that the authors believe will answer the following question: can an ANN classifier be used to recognize defects and develop an initial methodology for applying the classifier when interpreting the results?

4. Results and Discussion

Figure 3 shows the appearance of the received signal in the three experiments and the spectra of these signals. The spectrum is obtained using a Fourier transform. The utilized apparatus immediately provides the generation of this spectrum. Therefore, the signal spectrum obtained through the software application of the instrument was used in further processing. The signals in Figure 3 were taken from the first transducer in three different experiments. The bottom row of Figure 3 illustrates the results of the same three experiments, superimposed onto each other.
The result of the data visual analysis is the idea of characteristic peaks in the spectral signal, taken at different points in the experiment. This idea forms the basis of the processing method proposed in this article.
Figure 4 shows the operation of the peak search algorithm (first five) for one of the signals.
To generate test data and develop an algorithm, five characteristic points were identified for each obtained signal spectrum. These five points are the very first five peak points of the spectrum. A pre-analysis of the data showed a spread of the number of peaks for each signal, from 7 to 15. For the initial stage, the first five peaks were selected. The number five gives further insight into the effect of the number of peaks selected as an input on the convergence of the algorithm and the quality of the solution obtained.
It should be emphasized that an evaluation of the impact of the number of peaks on the performance of the whole algorithm will be described below, once the proposed solution has been selected and proven to be viable.
Working with the data peaks of all available signals, the following patterns were found: most of the peaks were in certain frequency ranges. The distribution between the sensor and finding a peak in a certain frequency range is shown in the Table 1.
The criterion for range selection was to find more than 80% of the values in the range, and not to increase the percentage of finding when the range is expanded. The information presented in Table 1 will be used to improve the ANN classifier algorithm.
Figure 5 shows the result of training an ANN classifier (Confusion matrix) on pre-processed data by Linear SVM.
The given ANN classifier was trained on data representing an array of values, where the first five values are the first five peak points of the signal and the sixth value is the class number. The training of the classifier used the membership of each class, where the class was defined as each sensor installed on the pile: Class 1–3: three sensors on defective pile №1; class 4–5: two sensors on defective pile №2; class 6: defect-free pile; class 7–9: defective pile №4. As can be seen from the Confusion matrix results, with an overall accuracy of the ANN classifier (accuracy = 85.9%), class 6 is predicted to be 100% correct. This means that the ANN classifier is 100% accurate in predicting whether there is a defect in the pile. The highest error percentage of 33% is in class 8, and it can be seen that errors occur in false class 7 and 9 instead of class 8. The 7, 8, and 9 sensors are sensors installed on the same defective pile №4. It is probably more appropriate to operate an ANN classifier where all cases that exist are divided into four classes, instead of nine. Under each class, we should refer to the pile numbers, or more precisely, the type of pile defect.
Figure 6 shows the result of training another ANN classifier (Confusion matrix) on pre-processed Quadratic SVM data.
The present ANN classifier was trained on the same data as the classifier with the results shown in Figure 5. The classes were defined by pile defects. The first class is pile defect №1; the second class is pile defect №2; the third class is a defect-free pile; and the fourth class is pile defect №3. The results demonstrate 100% identification of a defective pile, and rather high overall accuracy (accuracy = 91.9%). At the same time, the highest percentage of errors was found between the classification of piles with defect numbers 1 and 2.
Table 2 provides full details of the ANN classifiers trained during this study.
Table 2 shows the results for the four experiments. In experiments №1 and №2, each sensor taking measurements was used as classes. The first five peak points of the spectrum were used as input data in experiment №1, and the average values of the spectrum amplitudes over the frequency range for each of the five intervals shown in Table 1 were used in experiment №2. Experiments №3 and №4 used pile defect numbers as classes (defect type 1, 2, 3 and defect-free type). The input data were used similarly to experiments №1 and №2.
As is clear from Table 2, the best result was shown by the classifier type defining four defect types, where the input data were the averaged spectrum values in the pre-determined ranges. It is worth emphasizing, however, that the results in all cases were quite high (accuracy > 80%). Consequently, the ANN classifier was demonstrated to be valid. It should be noted that, in all cases, the defective pile was identified 100% accurately. The result shows the validity of two approaches: the use of an ANN classifier to determine the pile defect at once, and to determine the defect with reference to the operating conditions of a particular sensor. However, this solution is intermediate and requires interpretation of sensor and pile defect conditions.
Table 3 provides training data for the ANN classifier on data with different numbers of peaks.
By analyzing the results of the experiments detailed in Table 3, we can conclude that reducing the number of peaks to use them as input data is not feasible, as the accuracy of the ANN classifier is reduced.

5. Implementation

An important issue is the question of the implementation of the developed defect detection algorithms and principles. In this paper, all results and conclusions were based on experimental data for homogeneous pile cases. In the experiment, the length and diameter of the piles, and the material and the pouring method, were constant. In fact, in order to implement the obtained results in practical application, it is essential to extend the experiments with variation of other parameters. However, according to a preliminary estimate, these variations will not have a significant effect on the methods used in the algorithm; the accuracy of the ANN classifier and its consistency in defect detection at this stage are beyond doubt.
The following are some important recommendations for introducing an ANN classifier when interpreting:
  • The data obtained should be subjected to preprocessing. The following procedures should be required, according to the authors:
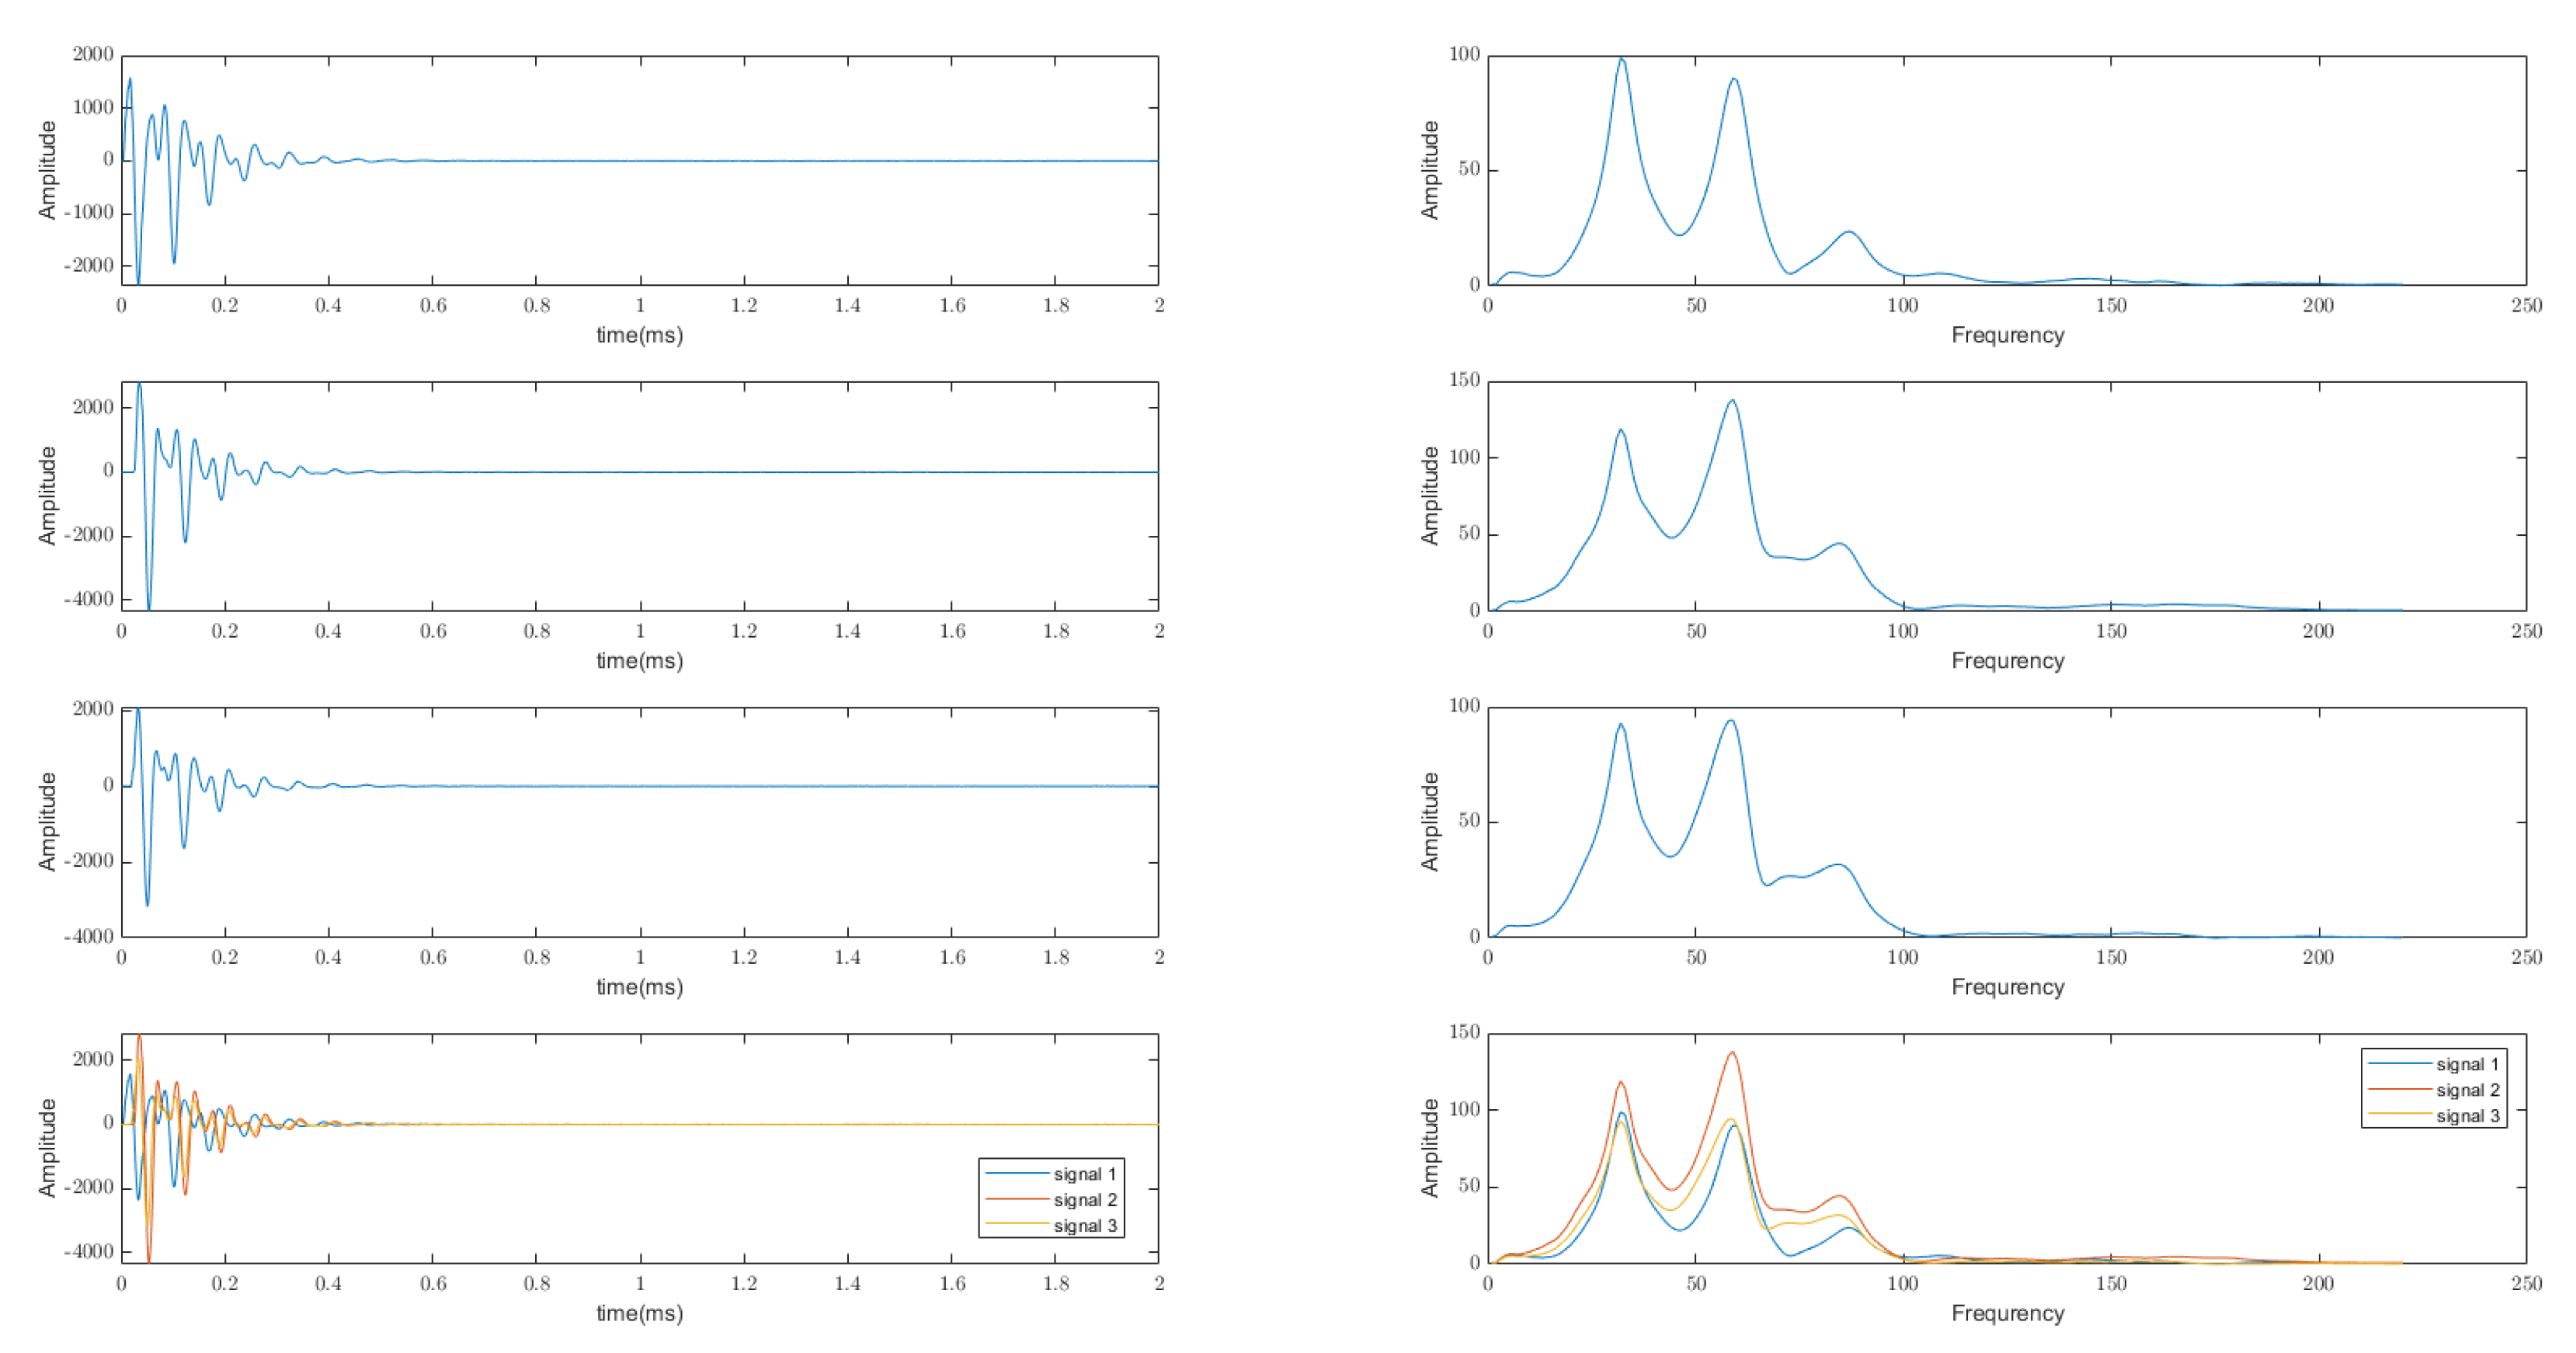
    • The initial conversion operation of the resulting signal is the Fourier transform window. The next step is to work with the frequency spectrum of the signal. It should be pointed out that the equipment used in the experiment already included a function to transform the signal from the time to the frequency domain. It is, therefore, possible to initially take this spectrum as input data for processing.
    • So-called deep learning should be used, the first of which should be an algorithm that shows whether or not an ANN classifier can be applied to the acquired signal data. It should be mentioned that experiments have shown that, especially in the first steps, an algorithm for estimating amplitudes at the characteristic frequencies of the signal spectrum can be used instead of the ANN classifier. For the experimental data used in this paper, the characteristic frequencies are: 4–6, 27–32, 52–60, 79–87, 90–113. One simplified approach is to compare the average amplitude at the contiguous and the above frequency ranges. An instance where it is smaller is a condition for the application of the ANN classifier.
    • Formation of an input matrix of size (1 × 5) for the classifier operation, attaching an array of five points, where each one is the peak of the signal spectrum obtained by low strain integrity testing. It is reasonable to use the first five peaks, which has been proven in the course of this work.
  • In all possible experimental algorithms, the defect-free pile was determined with high confidence. In a practical context, the authors suggest creating an experimental pile to produce such a characteristic. Further, in a second preprocessing step, the authors recommend the use of an algorithm to detect defects in principle from the accumulated external data. It is possible to run dynamic clustering algorithms, find new clusters, and modify the classifier already directly in the device, with the possibility of recognizing defect classes detected by dynamic clustering algorithms.
  • Accumulate history from the data by matching the characteristic points of the signal spectrum with the defects detected. In this way, provided the construction technique is not significantly changed, an accurate ANN classifier diagnosing all possible defects can be obtained over time. The advantage of having such a toolkit is that it eliminates the human interpreter, gives a quick result on site, and stores data on defects for the entire monitoring period. This information can then be helpful in complex automation systems of companies directly or indirectly involved in construction or facility management.

6. Conclusions

The results of this study proves the validity of the following hypothesis: the ANN classifier, with its input vector being the characteristic points of the spectrum of the received signal and its output being the type of the pile defect, can be used as the basic tool for automatic interpretation of the results. In this case, the peak values of the signal spectrum can be used as characteristic spectrum points for training, testing, and operation of the ANN classifier. The study shows that the first five peak points are optimal for the creation, testing, and operation of the ANN classifier. In addition, five values obtained by averaging the amplitude of the signal spectrum in five frequency bands, respectively, can also be used instead of these points. The characteristic frequencies of the spectrum of the signals obtained in this work are as follows: 4–6, 27–32, 52–60, 79–87, 90–113. As a result of the ANN classifier, classifications can be used for each monitoring sensor installed on piles, or directly for pile defect types. In the first scenario, the solution is intermediate and requires interpretation of the sensor and pile defect conditions. To simplify the integration of the ANN classifier into construction practice, it is advisable to consider the recommendations proposed in the Implementation section.

Author Contributions

Conceptualization: N.K.; methodology: N.K.; software: N.K.; formal analysis: N.K.; resources: E.L.; writing—original draft preparation: N.K.; writing—review and editing: E.L. and N.K., with supervision of N.K.; project administration: N.K. and E.L; experiments: E.L. All authors have read and agreed to the published version of the manuscript.

Funding

This research received no external funding.

Institutional Review Board Statement

Not applicable.

Informed Consent Statement

Not applicable.

Data Availability Statement

Not applicable.

Conflicts of Interest

The authors declare no conflict of interest.

References

  1. Shabalov, M.Y.; Zhukovskiy, Y.L.; Buldysko, A.D.; Gil, B.; Starshaia, V.V. The influence of technological changes in energy efficiency on the infrastructure deterioration in the energy sector. Energy Rep. 2021, 7, 2664–2680. [Google Scholar] [CrossRef]
  2. Litvinenko, V.S. Digital Economy as a Factor in the Technological Development of the Mineral Sector. Nat. Resour. Res. 2020, 29, 1521–1541. [Google Scholar] [CrossRef]
  3. Taubenböck, H.; Droin, A.; Standfuß, I.; Dosch, F.; Sander, N.; Milbert, A.; Eichfuss, S.; Wurm, M. To be, or not to be ‘urban’? A multi-modal method for the differentiated measurement of the degree of urbanization. Comput. Environ. Urban Syst. 2022, 95, 101830. [Google Scholar] [CrossRef]
  4. Filatova, I.; Nikolaichuk, L.; Zakaev, D.; Ilin, I. Public-Private Partnership as a Tool of Sustainable Development in the Oil-Refining Sector: Russian Case. Sustainability 2021, 13, 5153. [Google Scholar] [CrossRef]
  5. Yan, J.; Nie, W.; Xiu, Z.; Yuan, M.; Zhou, W.; Bao, Q.; Peng, H.; Niu, W.; Yu, F. Development and characterization of a dust suppression spray agent based on an adhesive NaAlg−gln−poly/polysaccharide polymer. Sci. Total Environ. 2021, 785, 147192. [Google Scholar] [CrossRef]
  6. Kondrasheva, N.K.; Kireeva, E.V.; Zyryanova, O.V. Development of new compositions for dust control in the mining and mineral transportation industry. J. Min. Inst. 2021, 248, 272–280. [Google Scholar] [CrossRef]
  7. Mardashov, D.; Duryagin, V.; Islamov, S. Technology for Improving the Efficiency of Fractured Reservoir Development Using Gel-Forming Compositions. Energies 2021, 14, 8254. [Google Scholar] [CrossRef]
  8. Bondarenko, A.V.; Islamov, S.R.; Mardashov, D.R.; Mingaleva, T. Features of oil well killing in abnormal carbonate reservoirs operating conditions. In Proceedings of the 15th Conference and Exhibition Engineering and Mining Geophysics, Gelendzhik, Russia, 22–26 April 2019; European Association of Geoscientists and Engineers: Gelendzhik, Russia, 2019; pp. 629–633. [Google Scholar] [CrossRef]
  9. Aleksandrova, T.; Nikolaeva, N.; Afanasova, A.; Romashev, A.; Kuznetsov, V. Selective Disintegration Justification Based on the Mineralogical and Technological Features of the Polymetallic Ores. Minerals 2021, 11, 851. [Google Scholar] [CrossRef]
  10. Kadochnikov, V.G.; Dvoynikov, M.V. Development of Technology for Hydromechanical Breakdown of Mud Plugs and Improvement of Well Cleaning by Controlled Buckling of the Drill String. Appl. Sci. 2022, 12, 6460. [Google Scholar] [CrossRef]
  11. Lavrenko, S.A.; Shishlyannikov, D.I. Performance Evaluation of Heading-and-Winning Machines in the Conditions of Potash Mines. Appl. Sci. 2021, 11, 3444. [Google Scholar] [CrossRef]
  12. Lin, D.; Broere, W.; Cui, J. Underground space utilisation and new town development: Experi-ences, lessons and implications. Tunn. Undergr. Space Technol. 2022, 119, 104204. [Google Scholar] [CrossRef]
  13. Chen, Y.; Chen, Z.; Guo, D.; Zhao, Z.; Lin, T.; Zhang, C. Underground space use of urban built-up areas in the central city of Nanjing: Insight based on a dynamic population distribution. Undergr. Space 2022, 7, 748–766. [Google Scholar] [CrossRef]
  14. Khademalrasoul, A.; Goudarzi, E.; Labibzadeh, M. Underwater blast response and pile failure analysis of submerged reinforced concrete piles and pile group foundations. Ocean Eng. 2022, 248, 110788. [Google Scholar] [CrossRef]
  15. Zhang, W.-X.; Cai, X.-D.; Liu, R.; Xie, H.-T.; Yi, W.-J. Seismic behavior of reinforced concrete frame substructure with cast-in-place slab on independent foundation. Soil Dyn. Earthq. Eng. 2022, 157, 107255. [Google Scholar] [CrossRef]
  16. Syas’Ko, V.; Shikhov, A. Assessing the State of Structural Foundations in Permafrost Regions by Means of Acoustic Testing. Appl. Sci. 2022, 12, 2364. [Google Scholar] [CrossRef]
  17. Potapov, A.I.; Shikhov, A.I.; Dunaeva, E.N. Geotechnical monitoring of frozen soils: Problems and possible solutions. IOP Conf. Series: Mater. Sci. Eng. 2021, 1064, 012038. [Google Scholar] [CrossRef]
  18. Amir, J.M. Pile integrity testing: History, present situation, and future agenda. In Proceedings of the 3rd Bolivian International Conference on Deep Foundations, Santa Cruz de la Sierra, Bolivia, 27–29 April 2017; pp. 17–32. [Google Scholar]
  19. Khokhlov, S.; Abiev, Z.; Makkoev, V. The Choice of Optical Flame Detectors for Automatic Explosion Containment Systems Based on the Results of Explosion Radiation Analysis of Methane- and Dust-Air Mixtures. Appl. Sci. 2022, 12, 1515. [Google Scholar] [CrossRef]
  20. Brettmann, T.; Hertlein, B.; Meyer, M.; Whitmire, B. Guideline for Interpretation of Nondestructive Integrity Testing of Augered Cast-in-Place and Drilled Displacement Piles; Deep Foundations Institute: Hawthorne, NJ, USA, 2011. [Google Scholar]
  21. Lozovsky, I.; Zhostkov, R.A.; Churkin, A.A. Numerical simulation of ultrasonic pile integrity testing. Russ. J. Nondestruct. Test. 2020, 56, 1–11. [Google Scholar] [CrossRef]
  22. Meijers, P.C.; Tsouvalas, A.; Metrikine, A.V. Magnetomechanical response of a steel monopile during impact pile driving. Eng. Struct. 2021, 240, 112340. [Google Scholar] [CrossRef]
  23. Ahmed, B.F.; Dasgupta, K. Seismic limit states for reinforced concrete bridge pile in sand. Structures 2021, 33, 128–140. [Google Scholar] [CrossRef]
  24. Vasilyeva, N.V.; Boikov, A.V.; Erokhina, O.O.; Trifonov, A.Y. Automated digitization of radial charts. J. Min. Inst. 2021, 247, 82–87. [Google Scholar] [CrossRef]
  25. De Domenico, D.; Messina, D.; Recupero, A. Quality control and safety assessment of prestressed concrete bridge decks through combined field tests and numerical simulation. Structures 2022, 39, 1135–1157. [Google Scholar] [CrossRef]
  26. Lopez-Arreguin, A.J.R.; Montenegro, S. Machine learning in planetary rovers: A survey of learning versus classical estimation methods in terramechanics for in situ exploration. J. Terramechanics 2021, 97, 1–17. [Google Scholar] [CrossRef]
  27. Ali, S.; Kumar, R. Hybrid energy efficient network using firefly algorithm, PR-PEGASIS and ADC-ANN in WSN. Sensors Int. 2021, 3, 100154. [Google Scholar] [CrossRef]
  28. Janusz, A.; Grzegorowski, M.; Michalak, M.; Wróbel, L.; Sikora, M.; Ślęzak, D. Predicting seismic events in coal mines based on underground sensor measurements. Eng. Appl. Artif. Intell. 2017, 64, 83–94. [Google Scholar] [CrossRef]
  29. Samu, V.; Guddati, M. Nondestructive length estimation of an embedded pile through combined analysis of transverse and longitudinal waves. NDT E Int. 2020, 110, 102203. [Google Scholar] [CrossRef]
  30. Boikov, A.; Payor, V.; Savelev, R.; Kolesnikov, A. Synthetic Data Generation for Steel Defect Detection and Classification Using Deep Learning. Symmetry 2021, 13, 1176. [Google Scholar] [CrossRef]
  31. Hameed, S.S.; Muralidharan, V.; Ane, B.K. Comparative analysis of fuzzy classifier and ANN with histogram features for defect detection and classification in planetary gearbox. Appl. Soft Comput. 2021, 106, 107306. [Google Scholar] [CrossRef]
  32. Sultanbekov, R.; Beloglazov, I.; Islamov, S.; Ong, M.C. Exploring of the Incompatibility of Marine Residual Fuel: A Case Study Using Machine Learning Methods. Energies 2021, 14, 8422. [Google Scholar] [CrossRef]
  33. Mini, P.P.; Thomas, T.; Gopikakumari, R. EEG based direct speech BCI system using a fusion of SMRT and MFCC/LPCC features with ANN classifier. Biomed. Signal Process. Control 2021, 68, 102625. [Google Scholar] [CrossRef]
  34. Zhang, M.; Li, M.; Zhang, J.; Liu, L.; Li, H. Onset detection of ultrasonic signals for the testing of concrete foundation piles by coupled continuous wavelet transform and machine learning algorithms. Adv. Eng. Inform. 2020, 43, 101034. [Google Scholar] [CrossRef]
  35. Zheng, Y.; Zhou, Y.; Zhou, Y.; Pan, T.; Sun, L.; Liu, D. Localized corrosion induced damage monitoring of large-scale RC piles using acoustic emission technique in the marine environment. Constr. Build. Mater. 2020, 243, 118270. [Google Scholar] [CrossRef]
  36. Tam, C.M.; Tong, T.K.L.; Lau, T.C.T.; Chan, K.K. Diagnosis of prestressed concrete pile defects using probabilistic neural networks. Eng. Struct. 2004, 26, 1155–1162. [Google Scholar] [CrossRef]
  37. Ismail, A.; Jeng, D.-S. Modelling load–settlement behaviour of piles using high-order neural network (HON-PILE model). Eng. Appl. Artif. Intell. 2011, 24, 813–821. [Google Scholar] [CrossRef]
  38. Zhang, M.; Yang, J.; Ma, R.; Du, Q.; Rodriguez, D. Prediction of small-scale piles by considering lateral deflection based on Elman Neural Network—Improved Arithmetic Optimizer algorithm. ISA Trans. 2022, 127, 473–486. [Google Scholar] [CrossRef]
  39. Cao, M.-T.; Nguyen, N.-M.; Wang, W.-C. Using an evolutionary heterogeneous ensemble of artificial neural network and multivariate adaptive regression splines to predict bearing capacity in axial piles. Eng. Struct. 2022, 268, 114769. [Google Scholar] [CrossRef]
  40. Alzabeebee, S.; Chapman, D.N. Evolutionary computing to determine the skin friction capacity of piles embedded in clay and evaluation of the available analytical methods. Transp. Geotech. 2020, 24, 100372. [Google Scholar] [CrossRef]
  41. Jebur, A.A.; Atherton, W.A.; Al Khaddar, R.M.; Aljanabi, K.R. Performance analysis of an evolutionary LM algorithm to model the load-settlement response of steel piles embedded in sandy soil. Measurement 2019, 140, 622–635. [Google Scholar] [CrossRef]
  42. Protopapadakis, E.; Schauer, M.; Pierri, E.; Doulamis, A.D.; Stavroulakis, G.E.; Böhrnsen, J.; Langer, S. A genetically optimized neural classifier applied to numerical pile integrity tests considering concrete piles. Comput. Struct. 2016, 162, 68–79. [Google Scholar] [CrossRef]
  43. Khokhlov, S.; Sokolov, S.; Vinogradov, Y.; Frenkel, I.B. Conducting industrial explosions near gas pipelines. J. Min. Inst. 2021, 247, 48–56. [Google Scholar] [CrossRef]
  44. Mao, W.; Aoyama, S.; Towhata, I. A study on particle breakage behavior during pile penetration process using acoustic emission source location. Geosci. Front. 2020, 11, 413–427. [Google Scholar] [CrossRef]
  45. Zheng, C.; Kouretzis, G.P.; Ding, X.; Liu, H.; Poulos, H.G. Three-dimensional effects in low-strain integrity testing of piles: Analytical solution. Can. Geotech. J. 2015, 53, 225–235. [Google Scholar] [CrossRef] [Green Version]
  46. Likins, G.; Rausche, F. Recent advances and proper use of PDI low strain pile integrity testing. In Proceedings of the 6th International Conference on the Application of Stress-Wave Theory to Piles, Sao Paulo, Brazil, 11–13 September 2000; pp. 211–218. [Google Scholar]
  47. ASTM D5882-16; Standard Test Method for Low Strain Impact Integrity Testing of Deep Foundation. ASTM International: West Conshohocken, PA, USA, 2016.
  48. Chai, H.-Y.; Phoon, K.-K. Detection of shallow anomalies in pile integrity testing. Int. J. Géoméch. 2013, 13, 672–677. [Google Scholar] [CrossRef]
  49. Korolev, N.; Kozyaruk, A.; Morenov, V. Efficiency Increase of Energy Systems in Oil and Gas Industry by Evaluation of Electric Drive Lifecycle. Energies 2021, 14, 6074. [Google Scholar] [CrossRef]
  50. Aly, H.H. A proposed intelligent short-term load forecasting hybrid models of ANN, WNN and KF based on clustering techniques for smart grid. Electr. Power Syst. Res. 2020, 182, 106191. [Google Scholar] [CrossRef]
  51. Rahul, J.; Sora, M.; Sharma, L.D. A novel and lightweight P, QRS, and T peaks detector using adaptive thresholding and template waveform. Comput. Biol. Med. 2021, 132, 104307. [Google Scholar] [CrossRef]
  52. Amit, G.; Gavriely, N.; Intrator, N. Cluster analysis and classification of heart sounds. Biomed. Signal Process. Control 2009, 4, 26–36. [Google Scholar] [CrossRef]
  53. Morenov, V.; Leusheva, E.; Lavrik, A.; Lavrik, A.; Buslaev, G. Gas-Fueled Binary Energy System with Low-Boiling Working Fluid for Enhanced Power Generation. Energies 2022, 15, 2551. [Google Scholar] [CrossRef]
  54. Chen, J.; Li, Y.; Chen, J.; Liu, D.; Yang, Y. Identification of Typical Partial Discharge Defects of Distribution System Equipment Based on Classification Learner. In Proceedings of the 2022 7th Asia Conference on Power and Electrical Engineering (ACPEE), Hangzhou, China, 15–17 April 2022; pp. 2025–2029. [Google Scholar] [CrossRef]
  55. Loseva, E.; Lozovsky, I.; Zhostkov, R. Identifying small defects in cast-in-place piles using low strain integrity testing. Indian Geotech. J. 2022, 52, 270–279. [Google Scholar] [CrossRef]
Figure 1. Testing piles: (a) flawless pile; (b) defect Ø250 mm, thickness 100 mm; (c) 100 × 150 × 300 mm; (d) 100 × 150 × 150 mm.
Applsci 12 10636 g001
Figure 2. Low strain integrity testing: (1) cast-in-place pile; (2) soil mass; (3) handheld hammer; (4) equipment set; red dotted lines indicate wave propagation.
Applsci 12 10636 g002
Figure 3. Appearance of the experimental data (first sensor, three experiments).
Applsci 12 10636 g003
Figure 4. The algorithm operation for searching the peaks (first five) for one of the signals.
Applsci 12 10636 g004
Figure 5. Confusion matrix for ANN-classifier.
Applsci 12 10636 g005
Figure 6. Confusion matrix for ANN-classifier.
Applsci 12 10636 g006
Table 1. Distribution the peak value by frequency range.
Peak NumberActual Value RangeChosen Value RangeNumber of Values in the Chosen Range (%)
MinMaxMinMax
P1394684.58
P21032273297.51
P33060526094.53
P45690778788.56
P5711549011386.06
Table 2. Training results of ANS classifiers.
Experiment NumberBrief DescriptionAccuracy for Different Types of Learning Algorithm, %
Fine TreeLiner SVMQuadratic SVMFine KNNMedium KNN
19 classes 5 peaks72.585.981.982.661.7
29 classes, range averages values67.187.287.985.273.2
34 classes 5 peaks73.271.191.987.971.1
44 classes, range averages values75.883.293.393.384.6
Table 3. The results of the experiments.
Experiment NumberNumber of Defined ClassesNumber of PeaksAccuracy for Different Types of Learning Algorithm, %
Fine TreeLiner SVMQuadratic SVMFine KNNMedium KNN
195 72.585.981.982.661.7
9466.475.875.273.260.4
9367.175.874.569.162.4
345 73.271.191.987.971.1
4475.862.479.286.671.8
4371.863.181.977.969.1
Publisher’s Note: MDPI stays neutral with regard to jurisdictional claims in published maps and institutional affiliations.

