Article

Model Test on Effect of Ground Fissure on the Behavior of Oblique Two-Section Subway Tunnel

1
Urban Construction School, Beijing City University, Beijing 100083, China
2
Geological Environmental Monitoring Central Station of Qinghai Province, Xining 810001, China
3
Chinese Academy of Geological Sciences, Beijing 100037, China
*
Author to whom correspondence should be addressed.
Appl. Sci. 2022, 12(20), 10472; https://doi.org/10.3390/app122010472
Submission received: 2 September 2022 / Revised: 8 October 2022 / Accepted: 11 October 2022 / Published: 17 October 2022
(This article belongs to the Special Issue Pile Foundation Analysis and Design)

Abstract

:
The dynamic interaction between the ground fissure and an oblique two-section horseshoe-shaped subway tunnel under the subway dynamic load was investigated based on a series of model tests in this study. The results indicated that the subway subway-induced vibration attenuated in different degrees when propagating in the directions in the soil layer, while the ground fissure had an attenuation effect on subway vibration. Furthermore, the vibration of the soil layer below the tunnel near the ground fissure was stronger than that of the upper soil layer, and the vibration response at the tunnel bottom was stronger than that of the arch waist and the tunnel crown. The additional contact pressure between the tunnel bottom and the soil was relatively large when the ground fissure was not active, while the additional strain at the top and bottom of the tunnel caused by the excitation was small. Moreover, when the hanging wall of the ground fissure descended, the additional contact pressure at the tunnel crown in the hanging wall and the tunnel bottom in the footwall significantly increased, and a negative additional stain was identified at those two positions. Meanwhile, a positive additional stain was identified at the tunnel crown in the footwall and the tunnel crown in the hanging wall, increasing with the descent of the hanging wall.

1. Introduction

The dynamic interaction between the ground fissure and subway tunnel attracted much attention after the operation of the Xi’an subway in China, which is of great significance to the long-term sustainability and vibration effect prevention of the subway. Recently, much effort has been paid to the dynamic impacts of subway-travelling-induced vibration on the tunnel structure and the propagation process of vibration in the soil stratum [1,2,3,4,5,6,7,8,9,10,11,12,13]. Nevertheless, Xi’an subway has special features in terms of geological settings and tunnel structure: (1) a total of 14 active ground fissures were identified in Xi’an, and the operated subway was in the special geological condition of active ground fissures. (2) Segmented tunnel structures were selected for the Xi’an subway to ensure its safe operation. The comprehensive interaction between the ground fissures and segmented tunnel structure eventually caused a relatively complicated propagation for the subway-induced vibration.
Yuan et al. [14,15] performed a dynamic model test for the scenario that the ground fissure was orthogonal to the horseshoe-shaped tunnel, and analyzed the mutual influence of subway tunnels, stratum, and ground fissures under the action of traffic load. The model results helped reveal the dynamic response of monolithic and segmented tunnels under the complied action of active ground fissures and traffic loads. Yang et al. [16,17] established a tunnel–ground fissure–stratum interaction model with different lining types to investigate the basic characteristics of soil vibration adjacent to the ground fissure, and the influence of the size and shape of the tunnel section on the vibration response. Yang et al. [18] analyzed the dynamic response among the ground fissure, subway tunnel, and surrounding rock under subway vibration load through the physical model test under the condition that the ground fissure and the shield tunnel were orthogonal. Although these studies focused on the interaction between ground fissures and the dynamic response of subway tunnel via model test, very few works have been conducted on the dynamic effect of traffic loading on the subway tunnel with the impact of ground fissures, especially for the scenario that the ground fissure is obliquely intersected with a subway tunnel.
This study performed a model test to investigate the dynamic interaction characteristics of ground fissures and an oblique two-section horseshoe-shaped subway tunnel under a dynamic subway load.

2. Experimental Design and Scheme
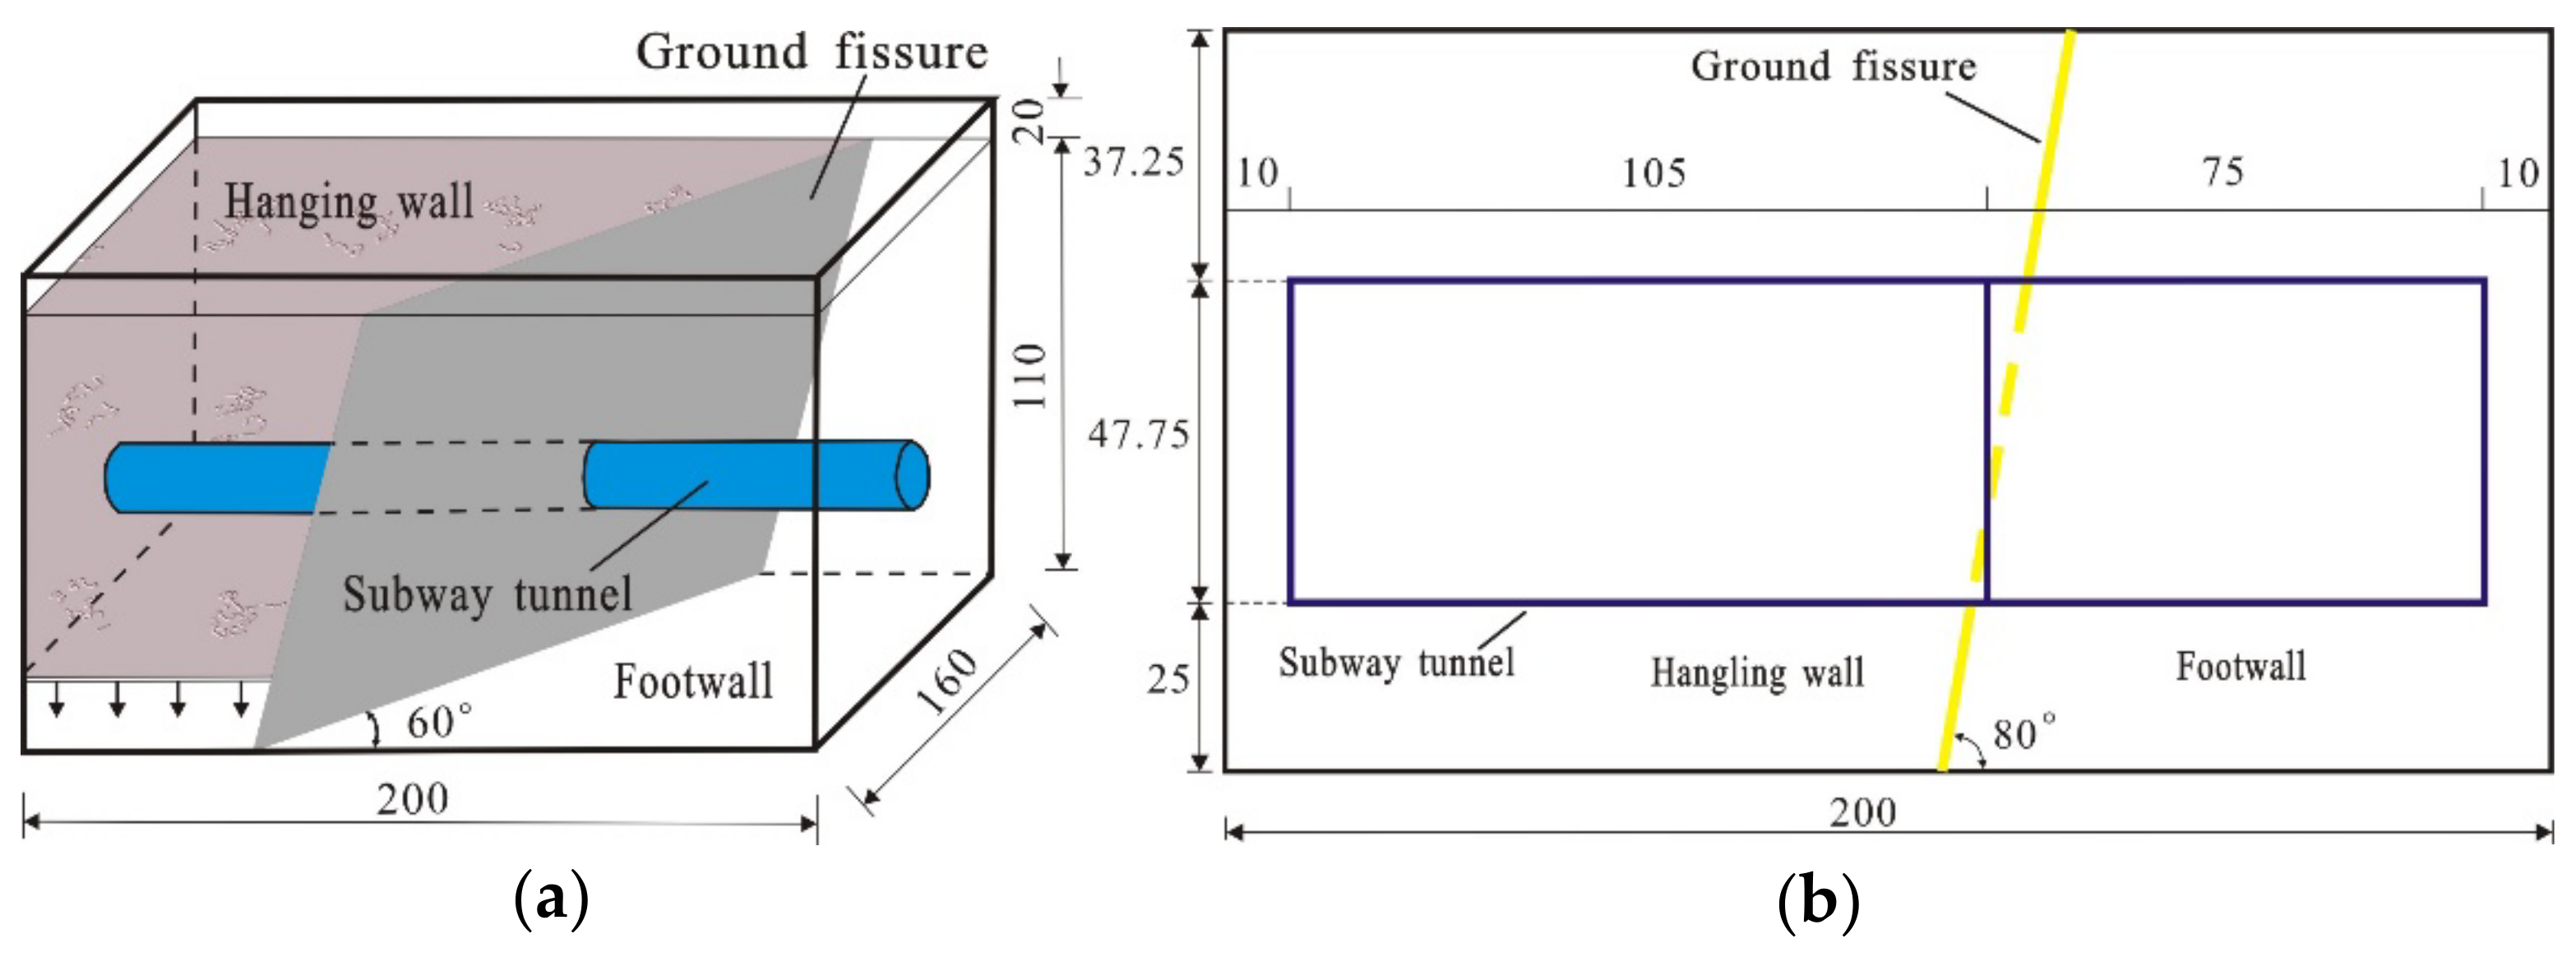
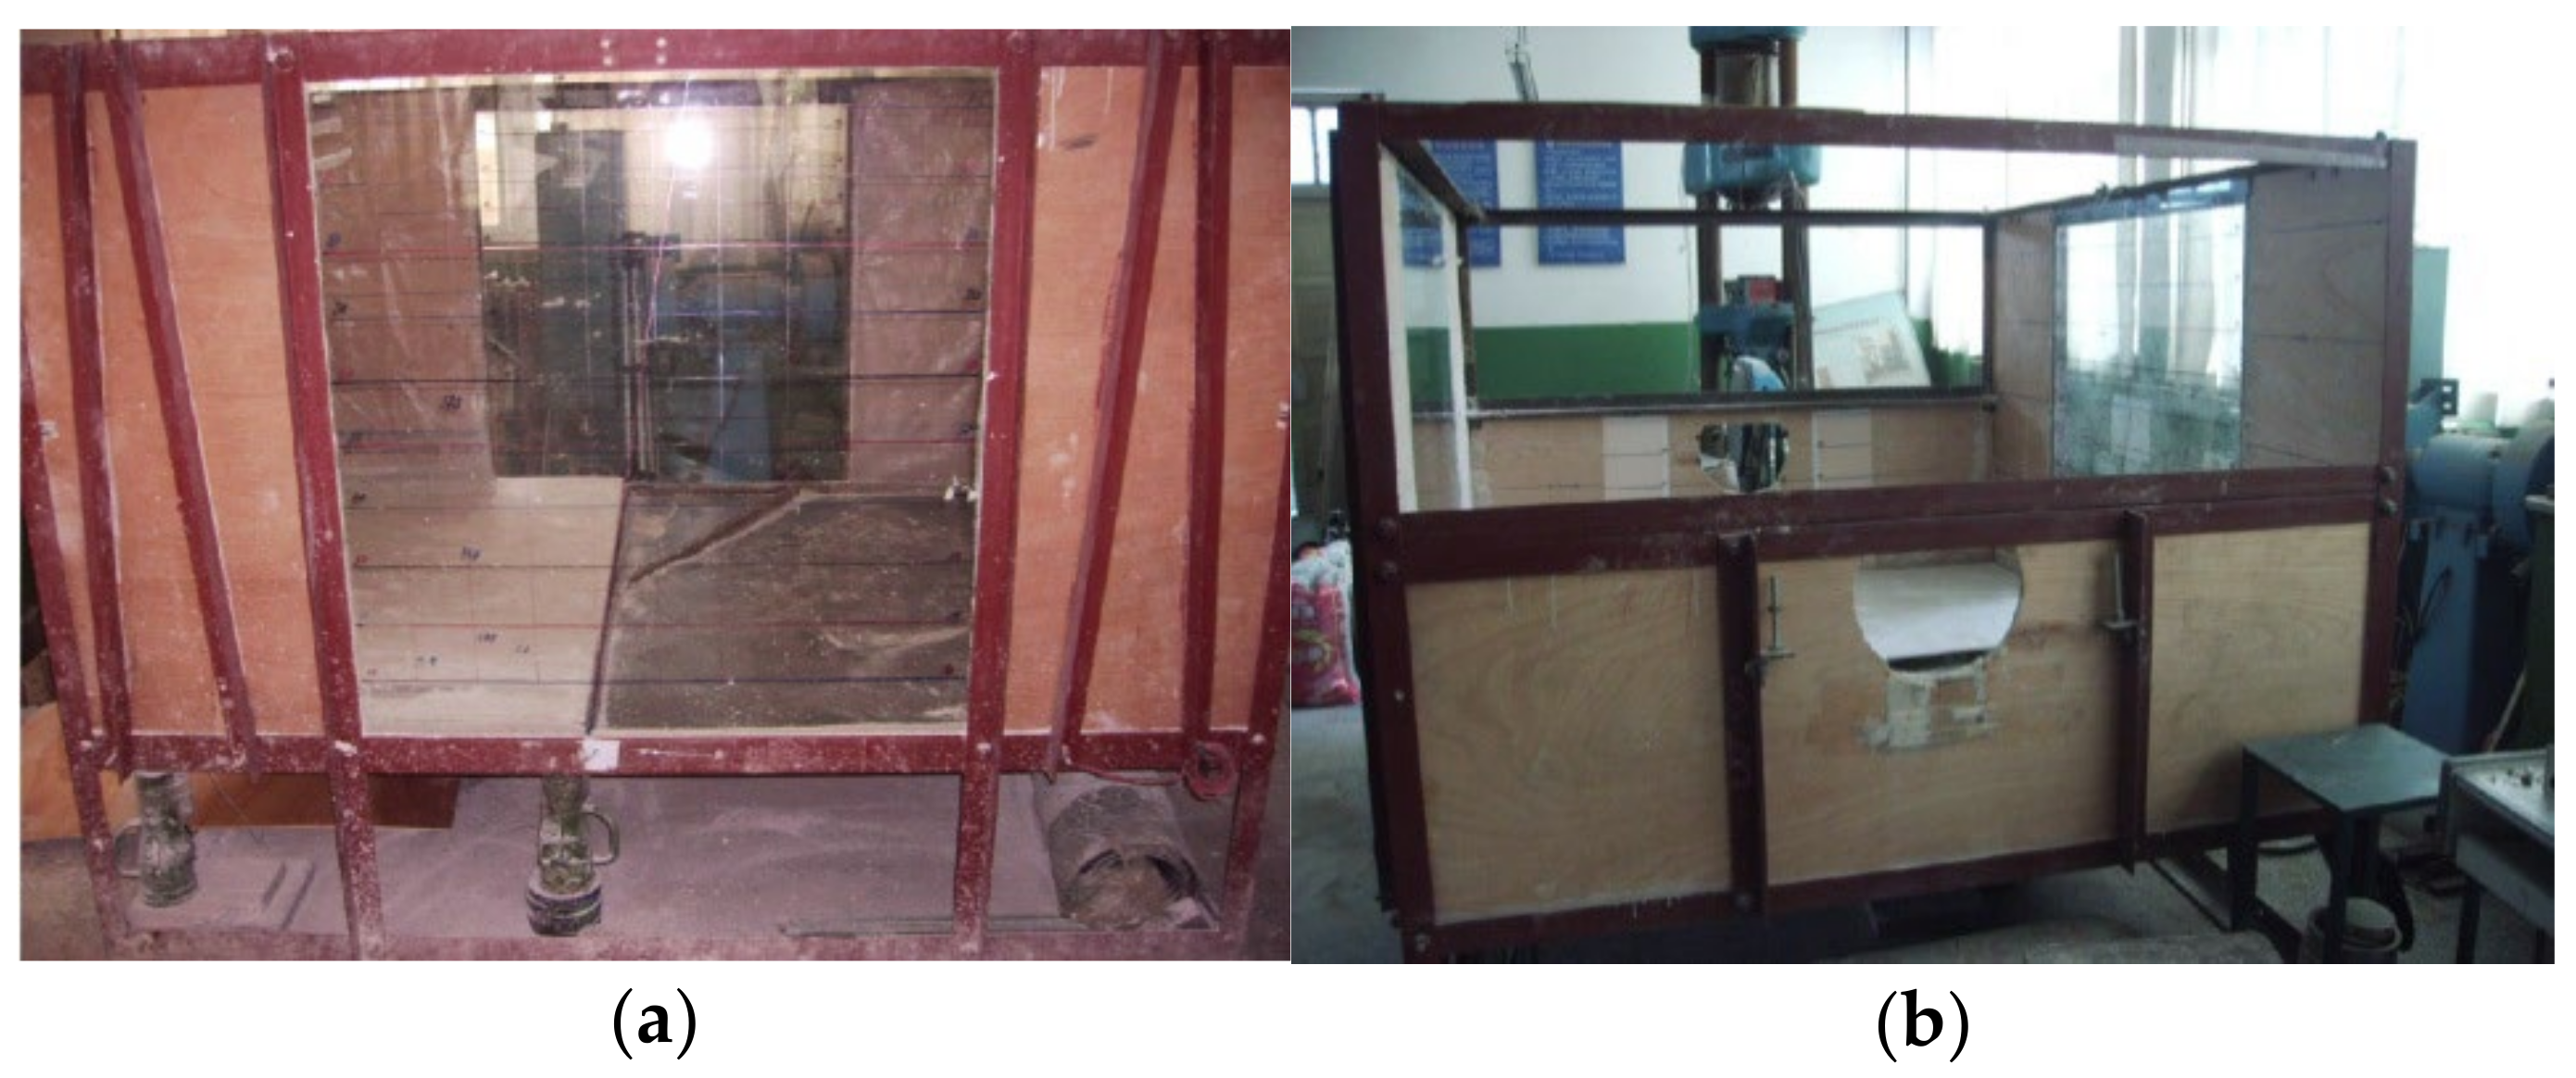
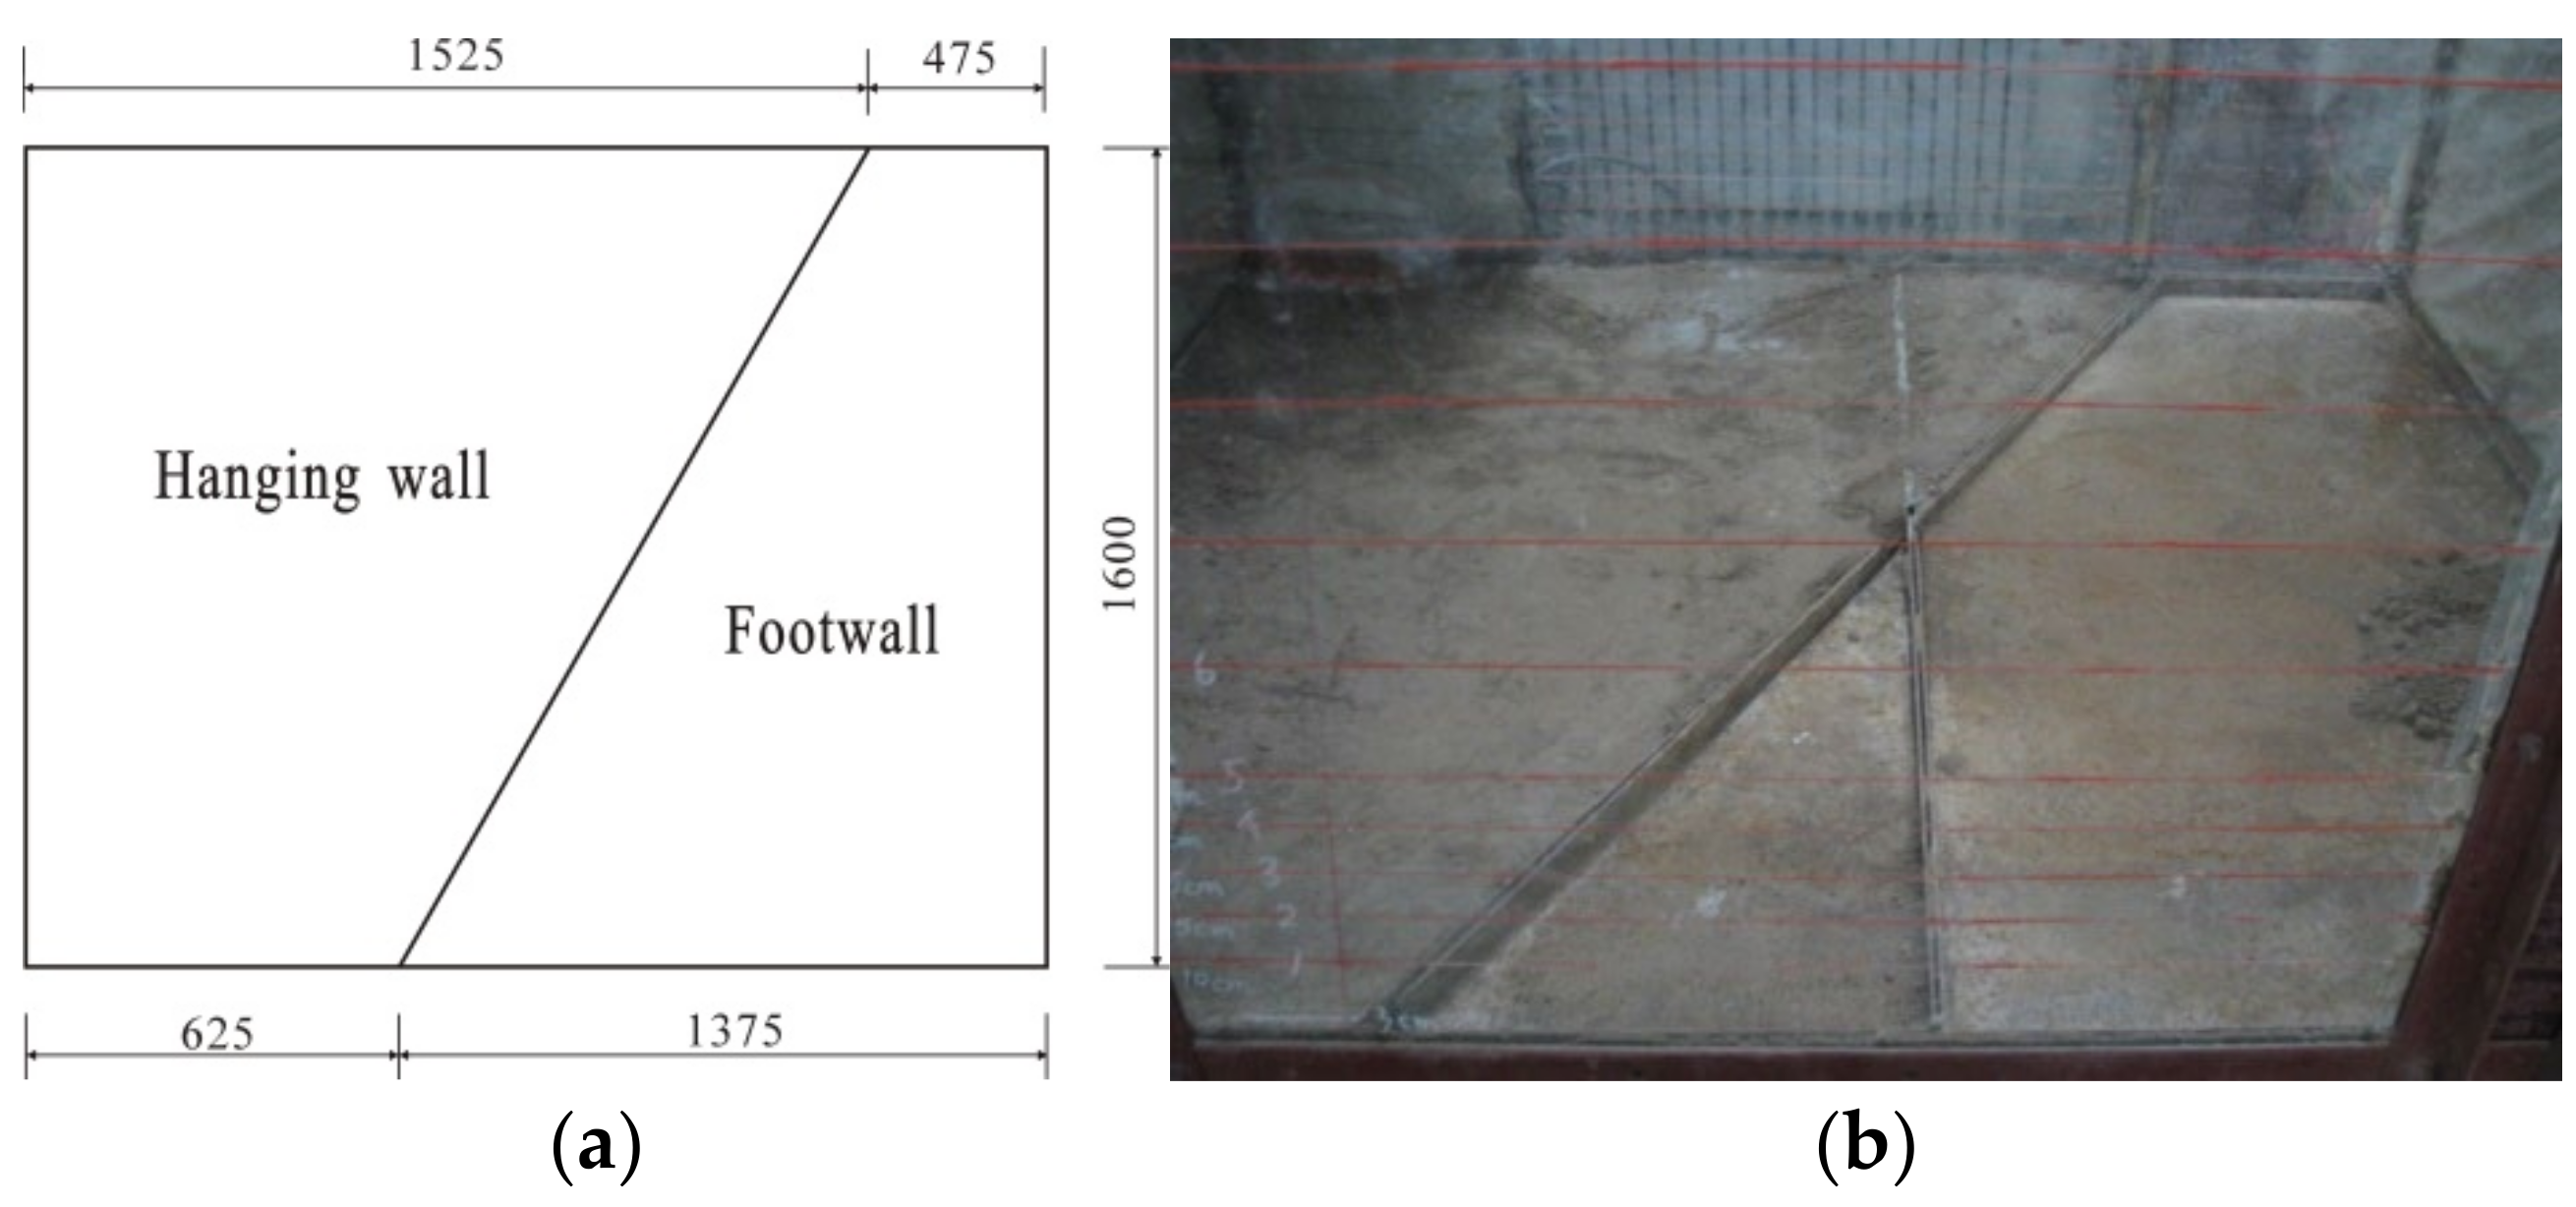
2.1. Test Principle

The similarity relationship between the model and the prototype was determined based on the geological setting and test equipment. The soil layer and the tunnel model were made separately and the ground fissure was set up in advance. The ground fissure activity was modeled by controlling the soil settlement in the hanging wall while the vibration exciter was used to simulate the vibration of the subway, and then the dynamic responses of the subway tunnel under the action of vibration load were investigated when the subway and the ground fissure crossed obliquely. Furthermore, the stress and strain of the tunnel structure were tested using pressure boxes and strain gauge, respectively, while the subway vibration was tested by accelerometer. The schematic diagram of the test model is shown in Figure 1. The intersection angle between the ground fissure and the tunnel axis is 60°, and the dip angle of the ground fissure is 80°. The subway tunnel structure is two-section.
The model test in this study was performed in a model box, as shown in Figure 2 and Figure 3. The maximum allowable model size is 2.0 m (length) × 1.6 m (width) × 1.2 m (height), and the modeled tunnel obliquely crossed the ground fissure at an angle of 60°. The bottom plate of the model box was divided into 2 pieces and 5 lifting jacks were installed at the bottom plate of the hanging wall to simulate its settlement. Additionally, in order to reduce the friction between the soil layer and the model wall, two layers of polystyrene plastic film were laid on the inner wall of the model box, and talcum powder was spread between the two layers of plastic film.

2.2. Design of Similarity Scale

The subway prototype used in this study is the horseshoe-shaped tunnel structure of Xi’an Subway Line 2 that crosses the ground fissure, with a height of 9.55 m and a buried depth of 20 m. The geometric similarity (Cl) and elastic modulus similarity (CE) were set as 20 and 1.5, respectively. The other similar relationships were calculated according to the similar criteria π [19], as shown in Table 1.

2.3. Model Materials

2.3.1. Stratum

The Xi’an subway is mainly buried in the Chinese loess–paleosol sequences. In order to better restore the soil properties [20,21,22], the material for the model test was mixed with barite powder, cohesive soil, and river sand with a proportion of 55:30:10:5.

2.3.2. Ground Fissure

Ground fissures were pre-set in the physical model, with a width of 10 mm and an inclination of 80°. In the process of filling the soil mass by layer, a 10 mm thick partition was buried at the pre-set position of the ground fissure, and then both sides of the partition were filled with soil. Afterwards, partition was moved after the soil was compacted and eventually formed fissure was filled with silty fine sand.

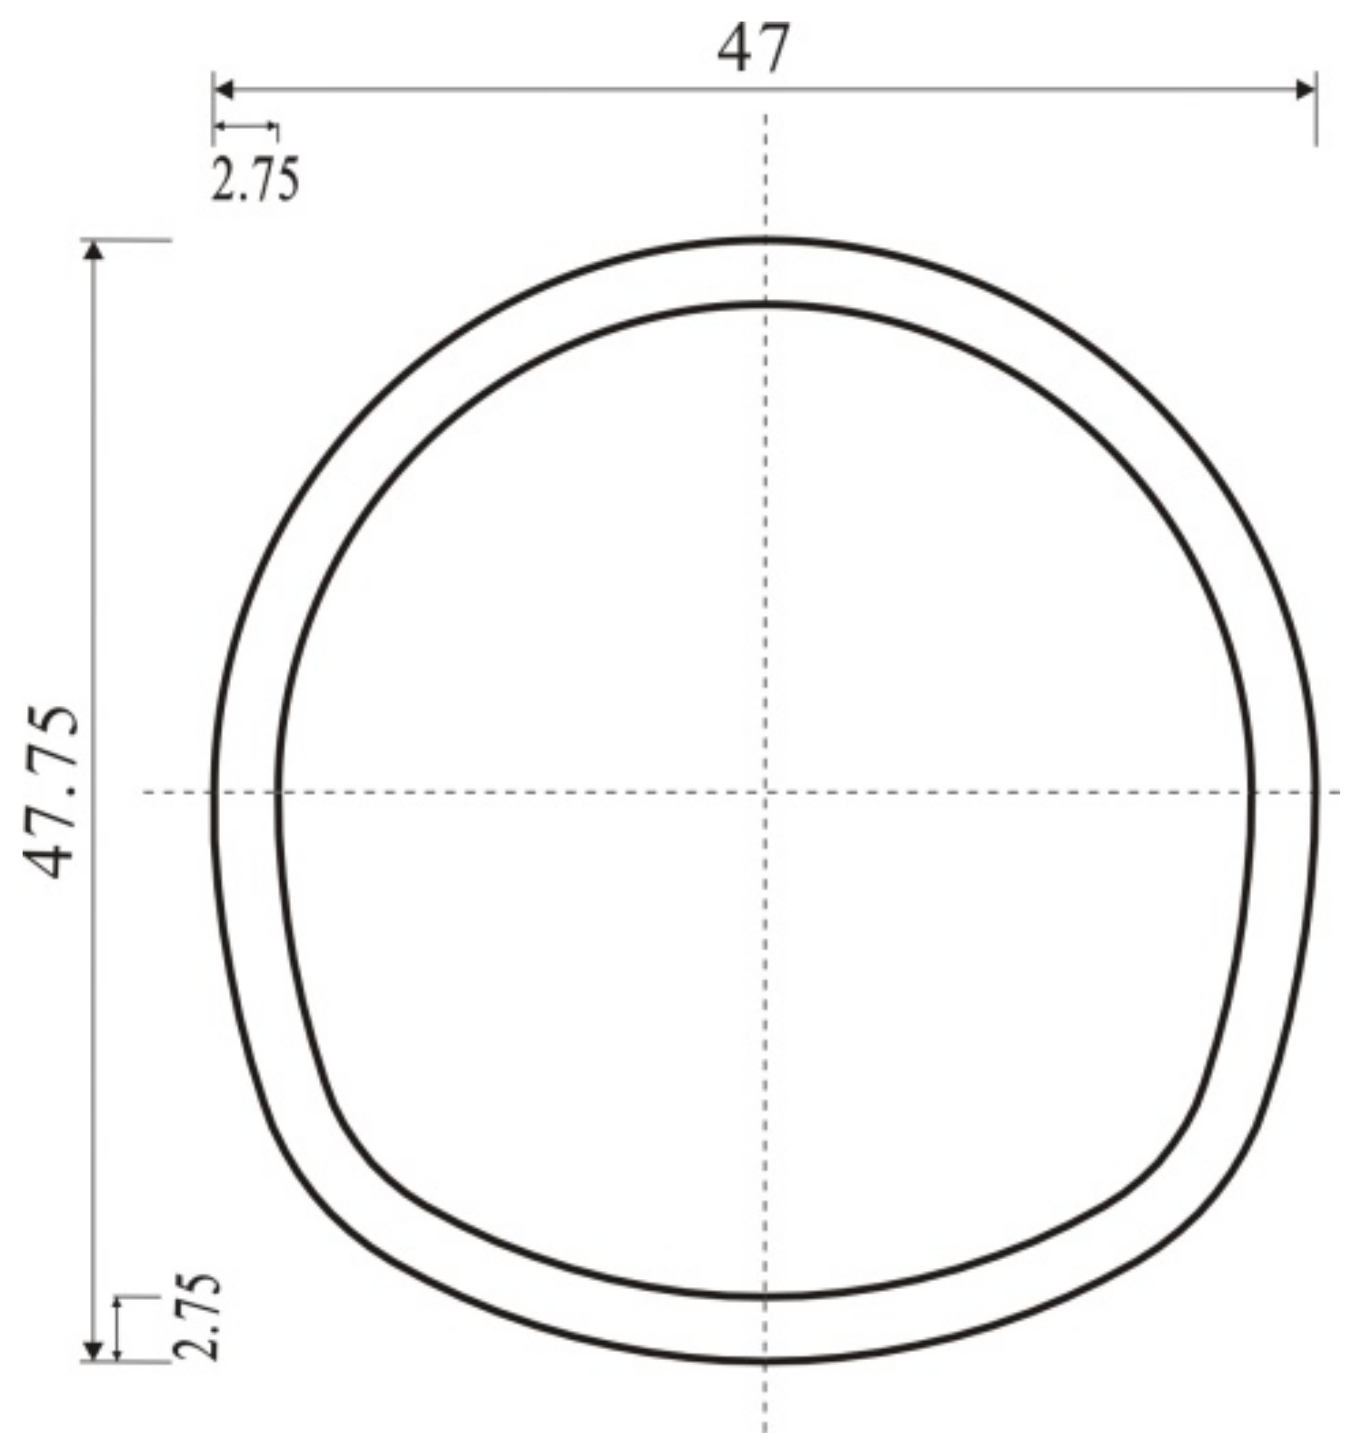
2.3.3. Tunnel Structure

The model tunnel was designed to be 47.75 cm high, 47 cm wide, and 2.75 cm thick, according to the similar relationship with the prototype. The concrete C15 was selected for the model with an overall length of 1.8 m. Furthermore, 38 Φ2 steel bars were set in the longitudinal direction with a spacing of 40 mm, and 86 Φ2 steel bars were set in the transverse direction with a spacing of 20 mm. The detailed information about the tunnel cross-section is presented in Figure 4.

2.4. Subway-Induced Vibration Load

Xi’an Subway Line 2 is composed of 6 segments with a wheelset load (P0) of 160 kN. In this study, vibration exciters were used to generate the vibration load. In order to make the generated vibration load match the actual situation well, two parallel rails, which were connected by a steel beam, were installed at the bottom of the tunnel, and the vibration exciter was fixed on the steel beam to transmit a relatively even vibration load to the two rails. The exciter-induced force (F(t)) can be expressed as:
F t = 100 2 [ 1 + sin 2 π f t π 2 ]
where t is the time step, and f is the frequency, which was set to be 10 Hz in the test according to the suggested value from previous investigation in Xi’an [23].
Taking into account the variation of the train position during the movement process, 2 vibration exciters were set inside the tunnel at a distance of 60 cm and 100 cm from the right margin (Figure 5) of the tunnel.

2.5. Measurement Equipment

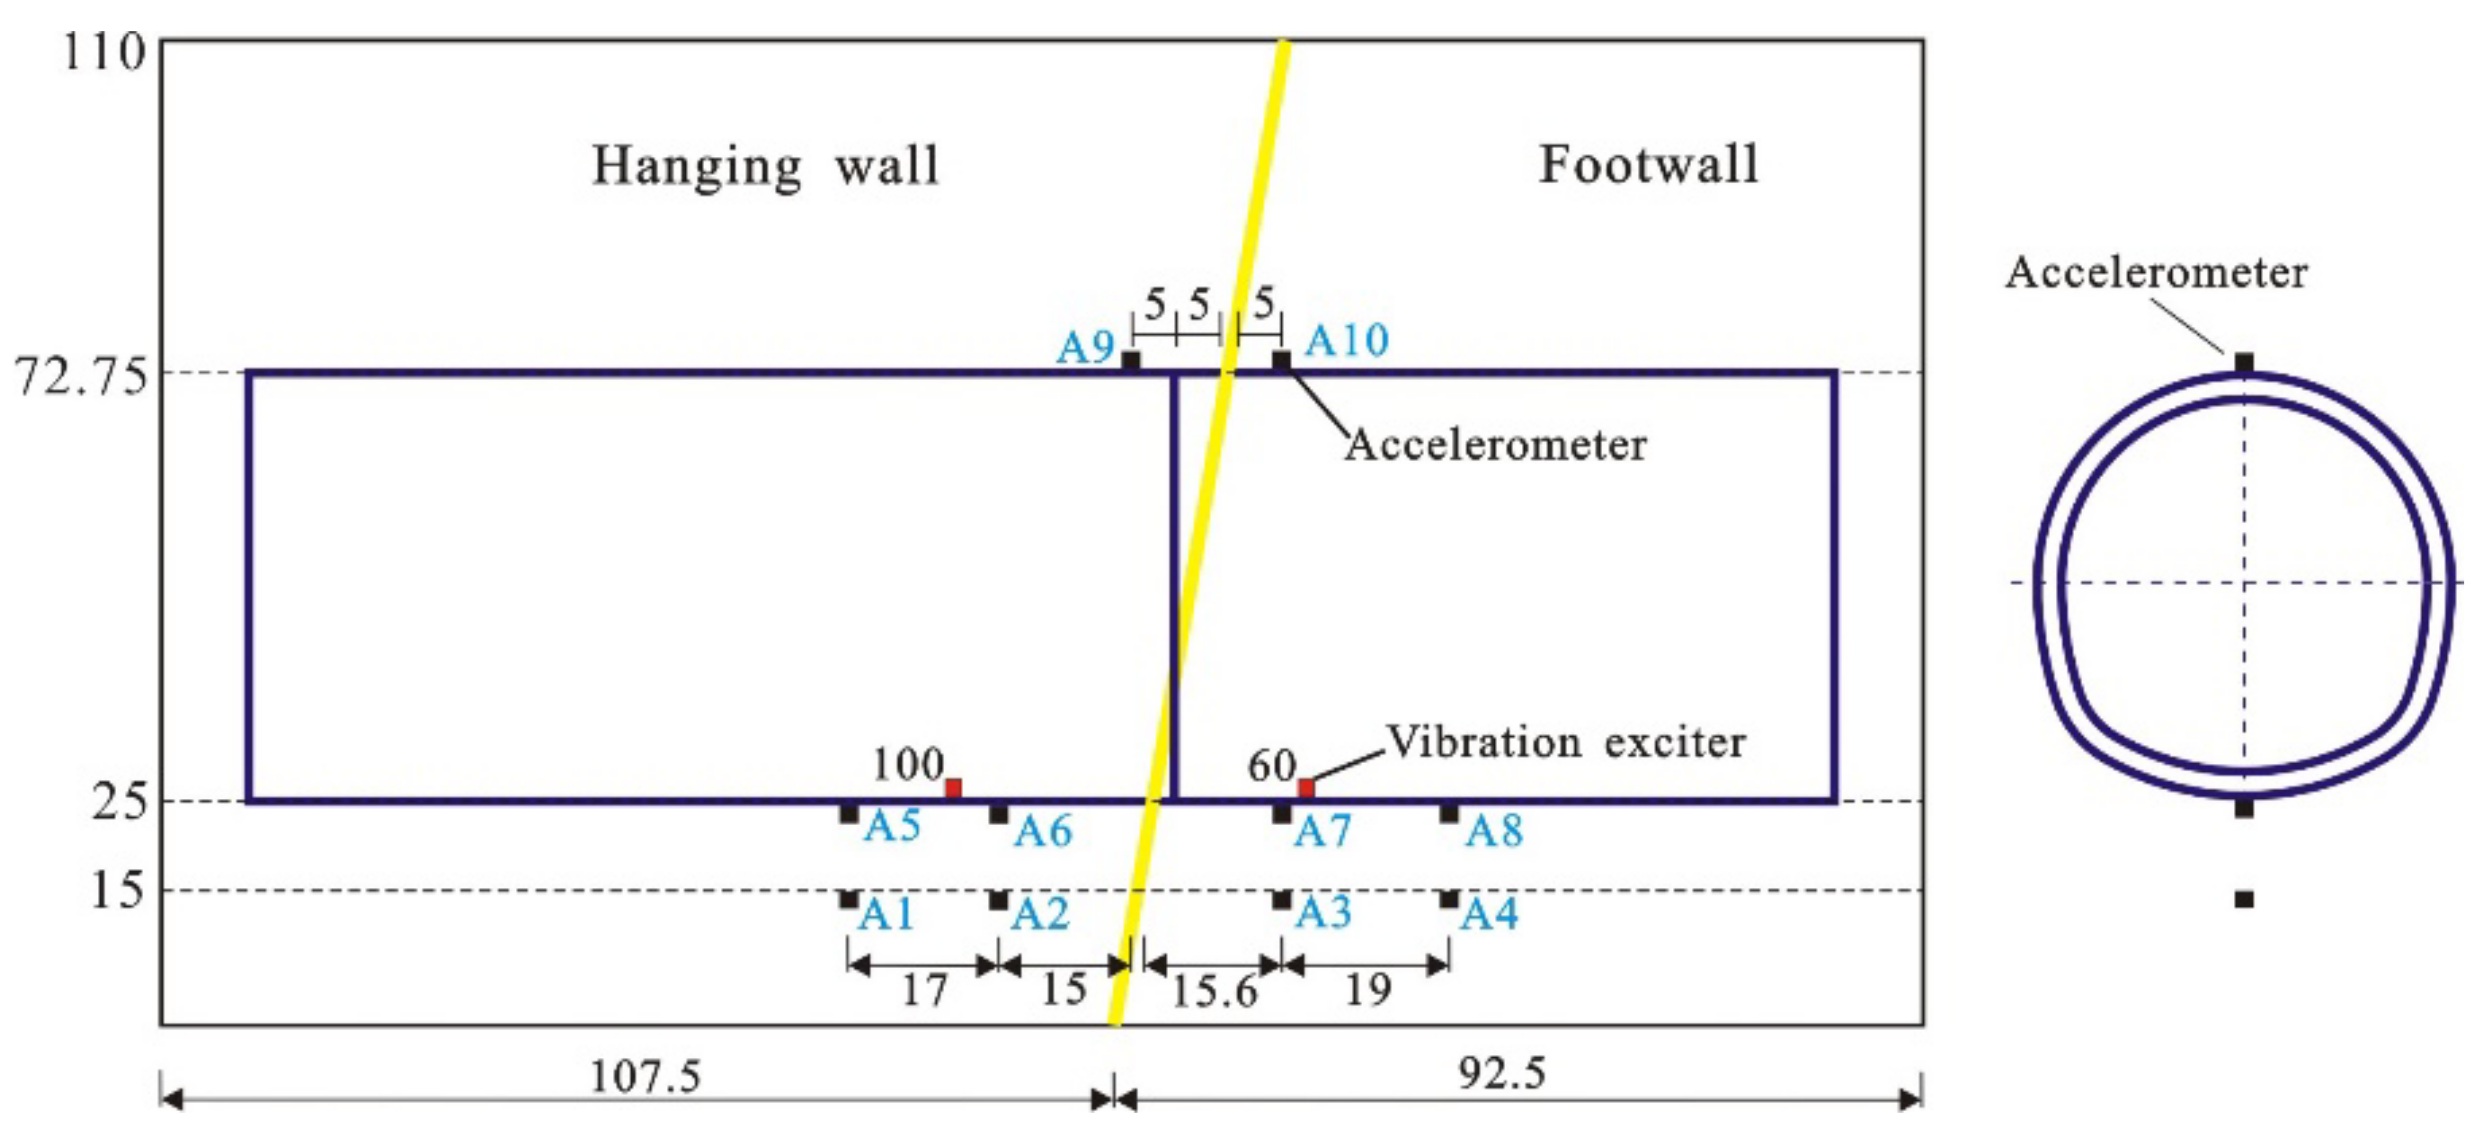
2.5.1. Acceleration Measurements

The acceleration was tested using the LC0801 strain-type accelerometer with a range of ±10 g, a frequency range of 0–200 Hz, and a sensitivity of 90 με/g. The measurement accuracy is 1%. A total 10 accelerometers were embedded in the central axis section of the tunnel, with a height of 15 cm, 25 cm (tunnel bottom), and 72.75 cm (tunnel crown), respectively. The detailed locations of accelerometers are presented in Figure 5.

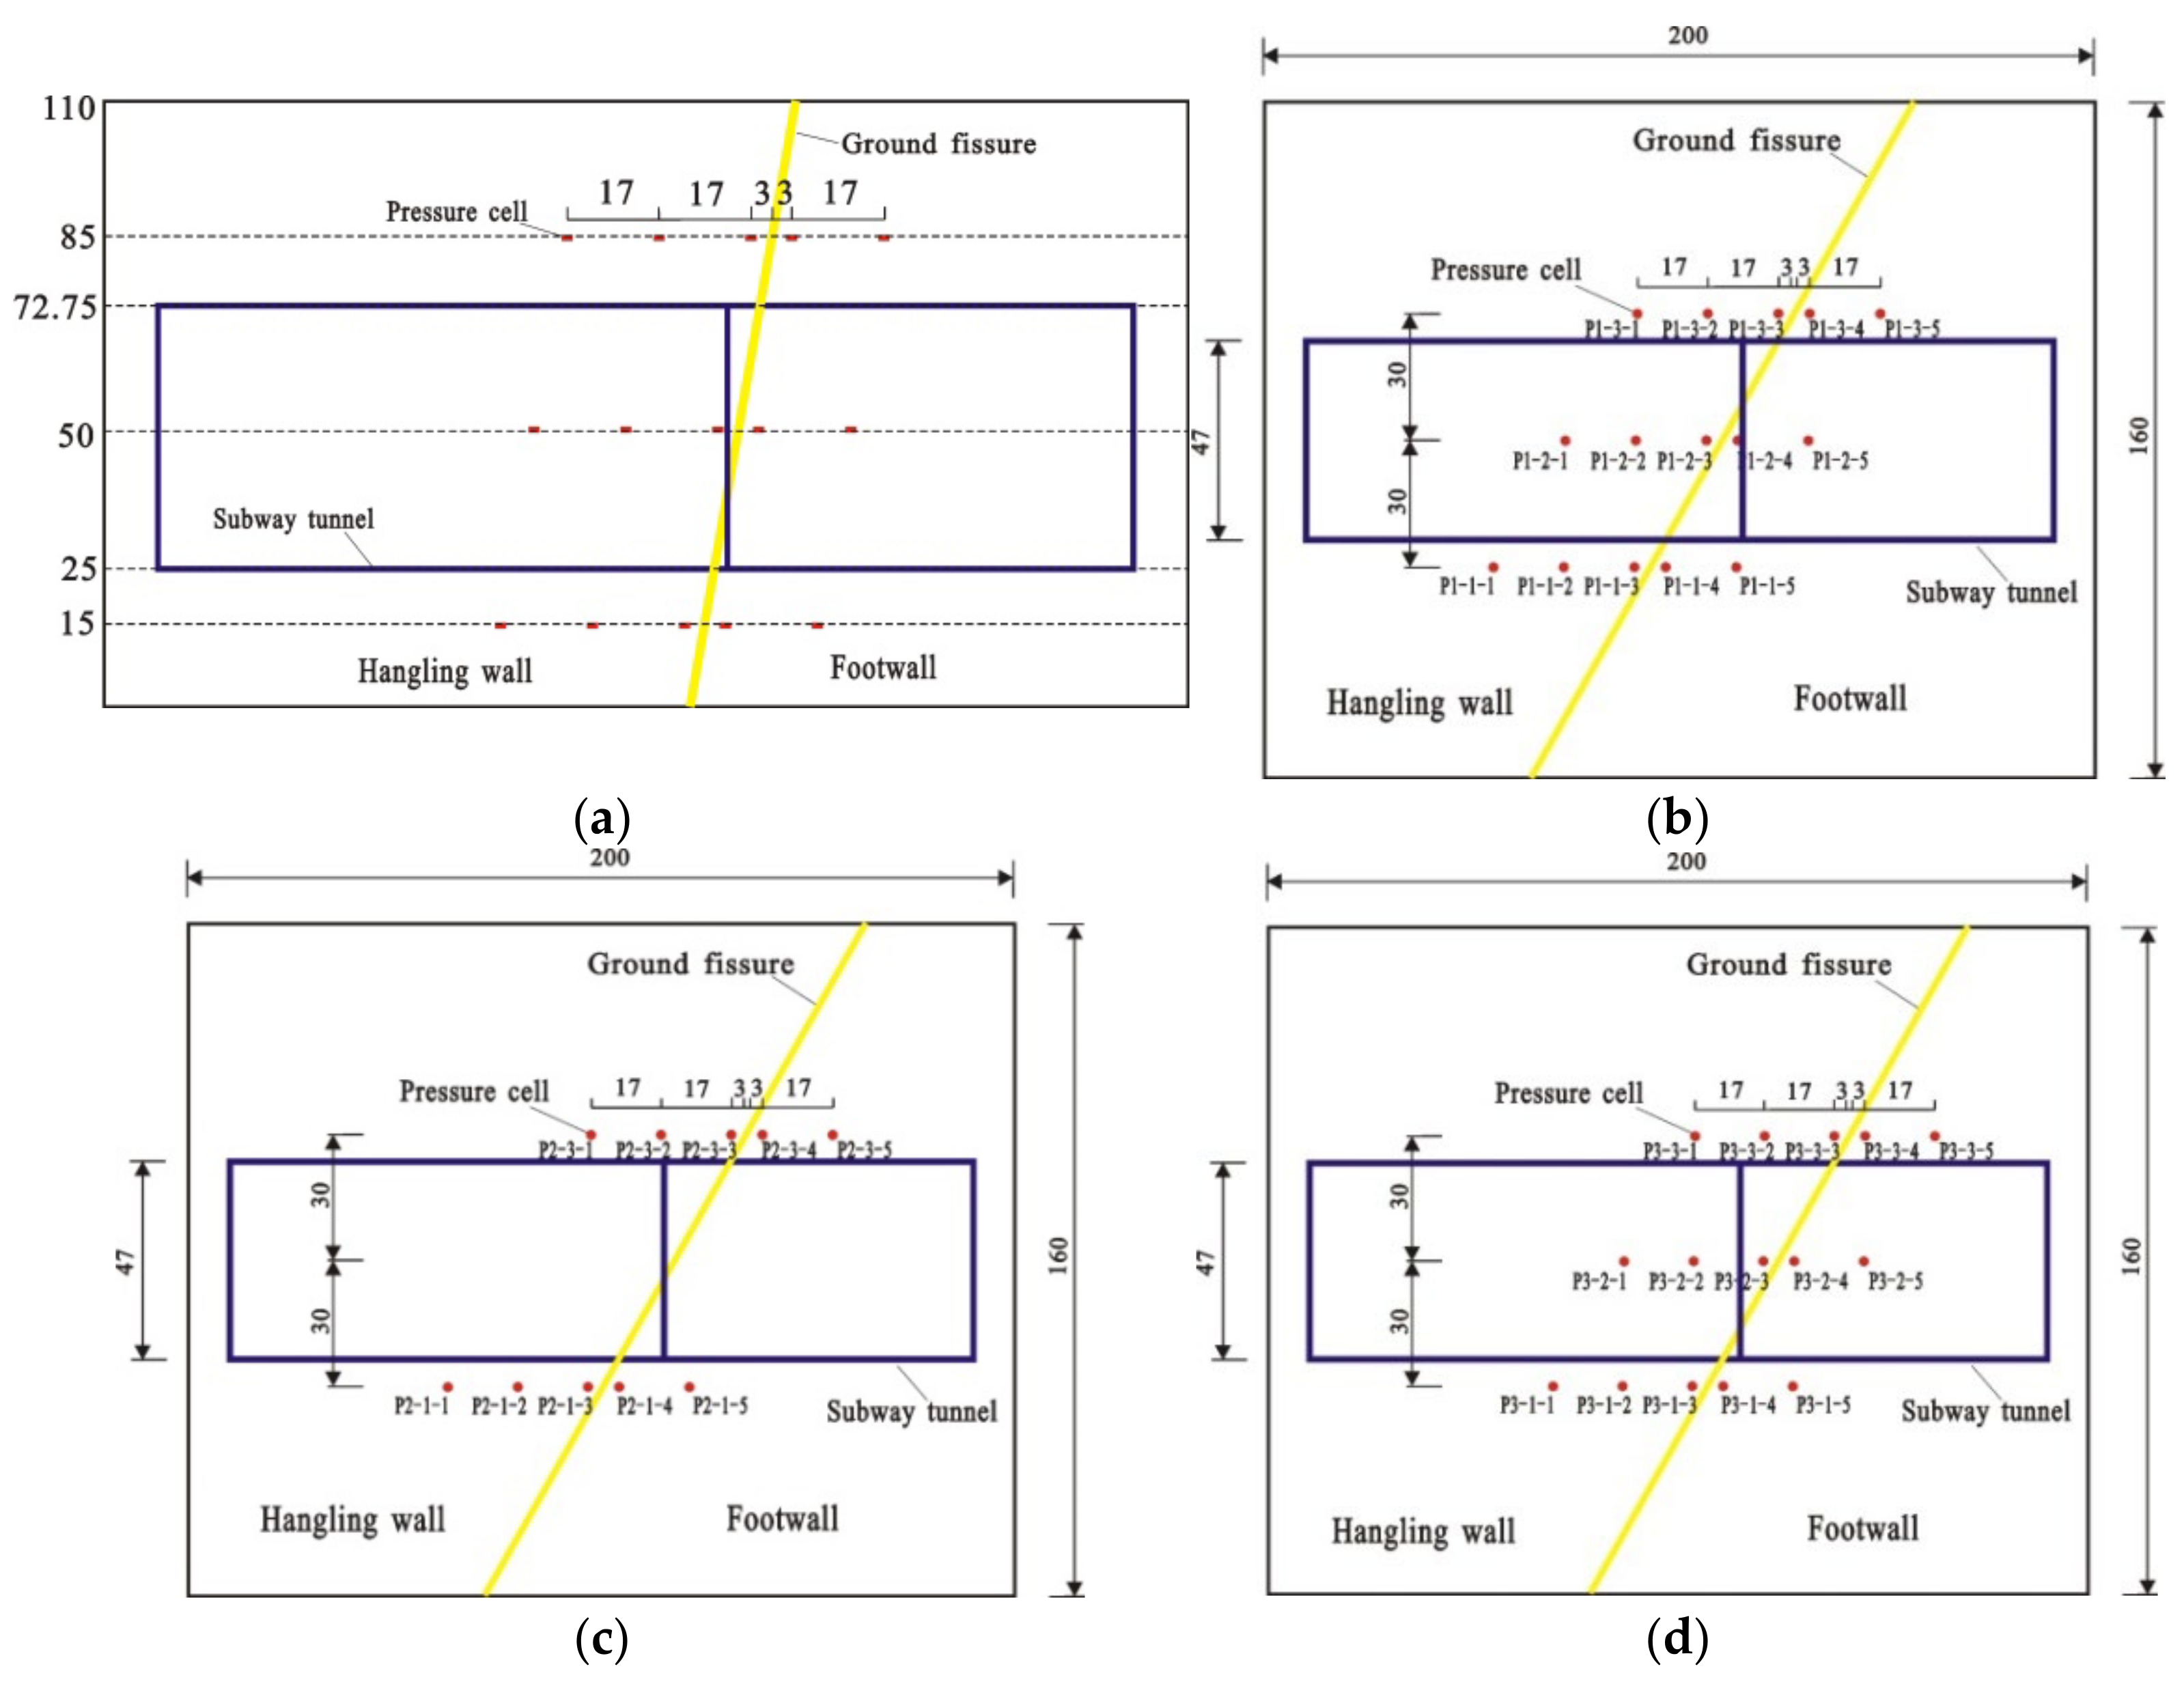
2.5.2. Earth Pressure in the Soil

The earth pressure was tested based on the ZFCY180 earth pressure cell. Three layers of pressure cells were embedded at the positions where the filling height of the soil layer was 15 cm, 50 cm, and 85 cm. The detailed locations of pressure cells are presented in Figure 6.

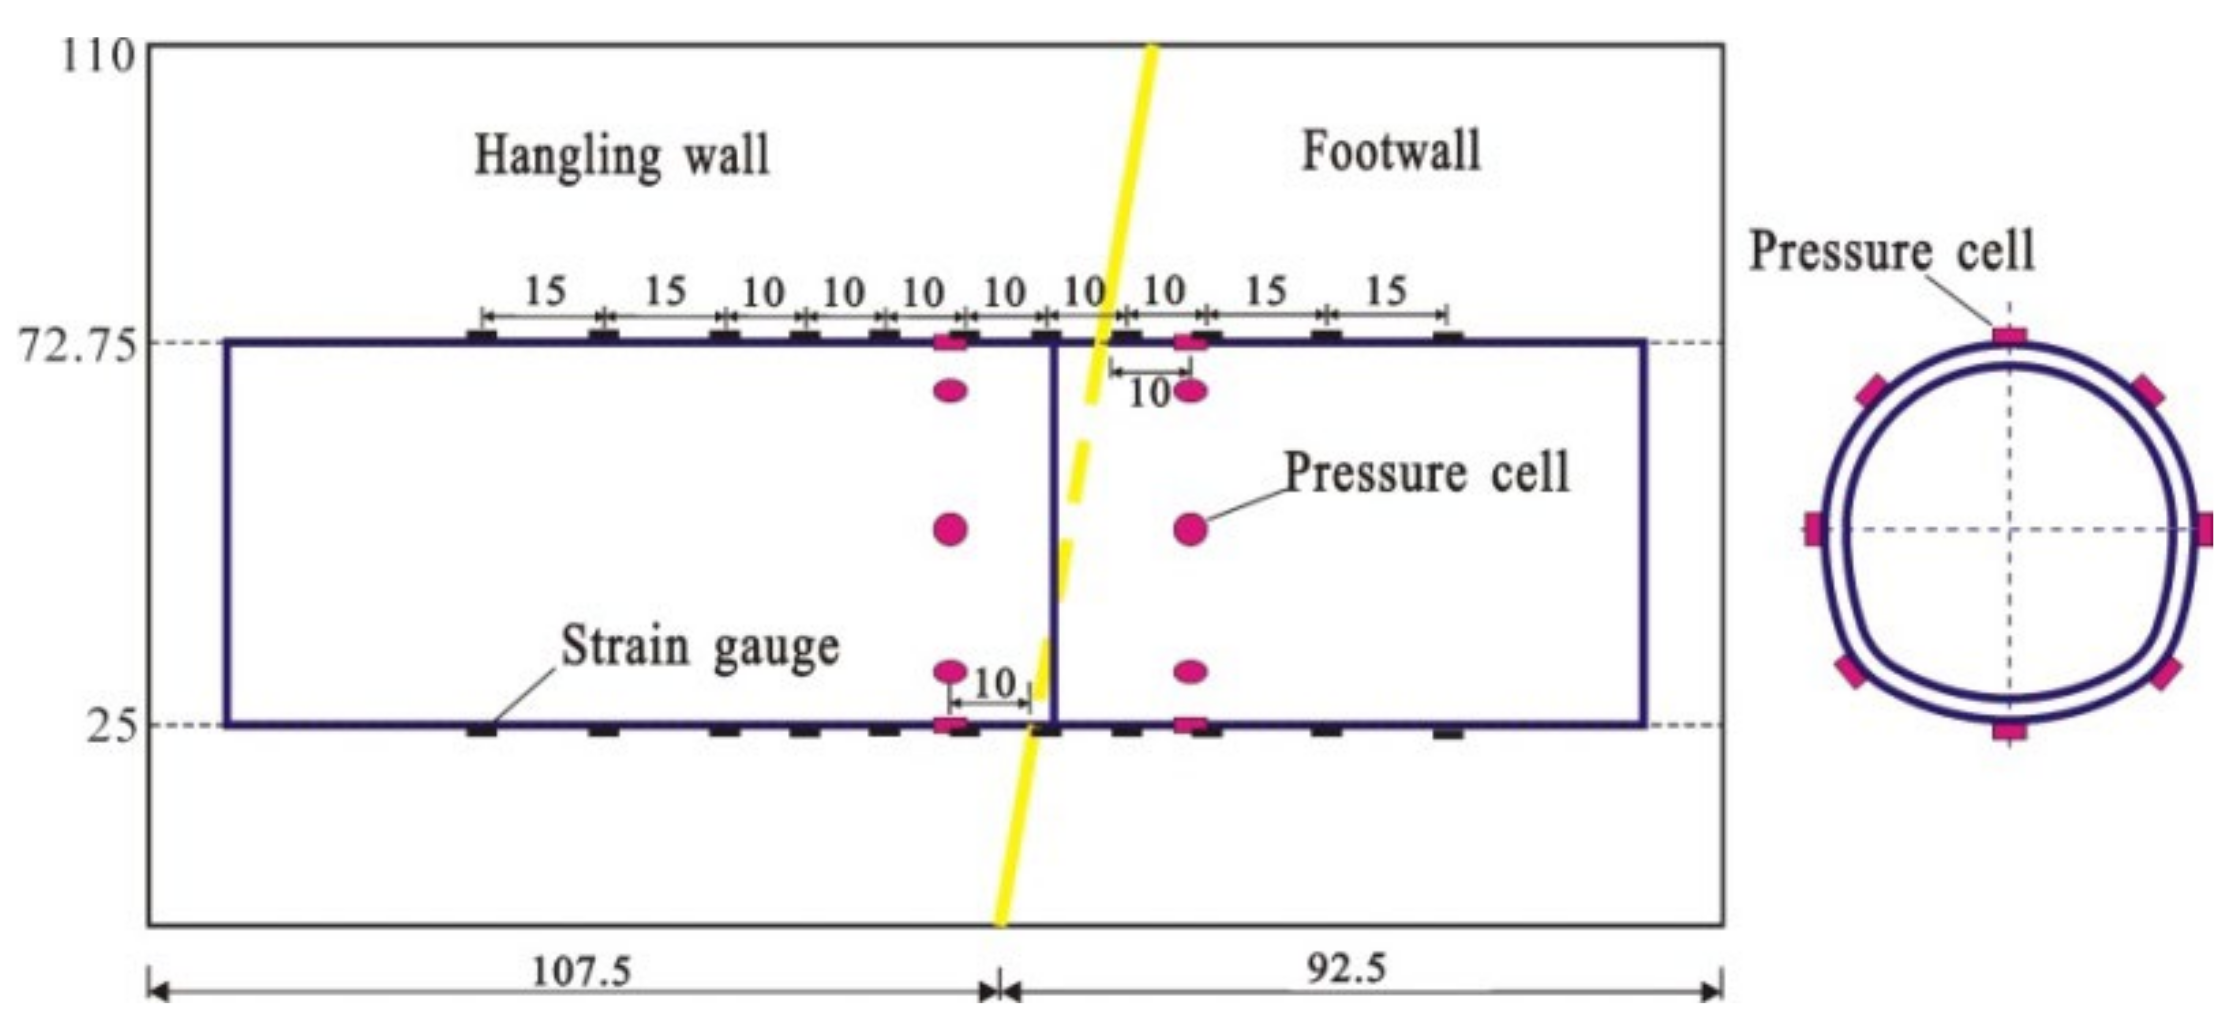
2.5.3. Contact Pressure between the Tunnel and Soil Mass

In order to measure the variation of the contact pressure between the soil and the tunnel, two circles of ZFCY180 earth pressure cells (8 cells in each circle) were installed in the tunnel on both sides of the ground fissure, as shown in Figure 7.

2.5.4. Strain of the Tunnel

Two groups of BX120-5AA strain gauges (each with 10 gauges) were set at the crown and bottom of the tunnel, respectively, to measure the strain of the tunnel structure, as shown in Figure 7.

3. Results and Discussion

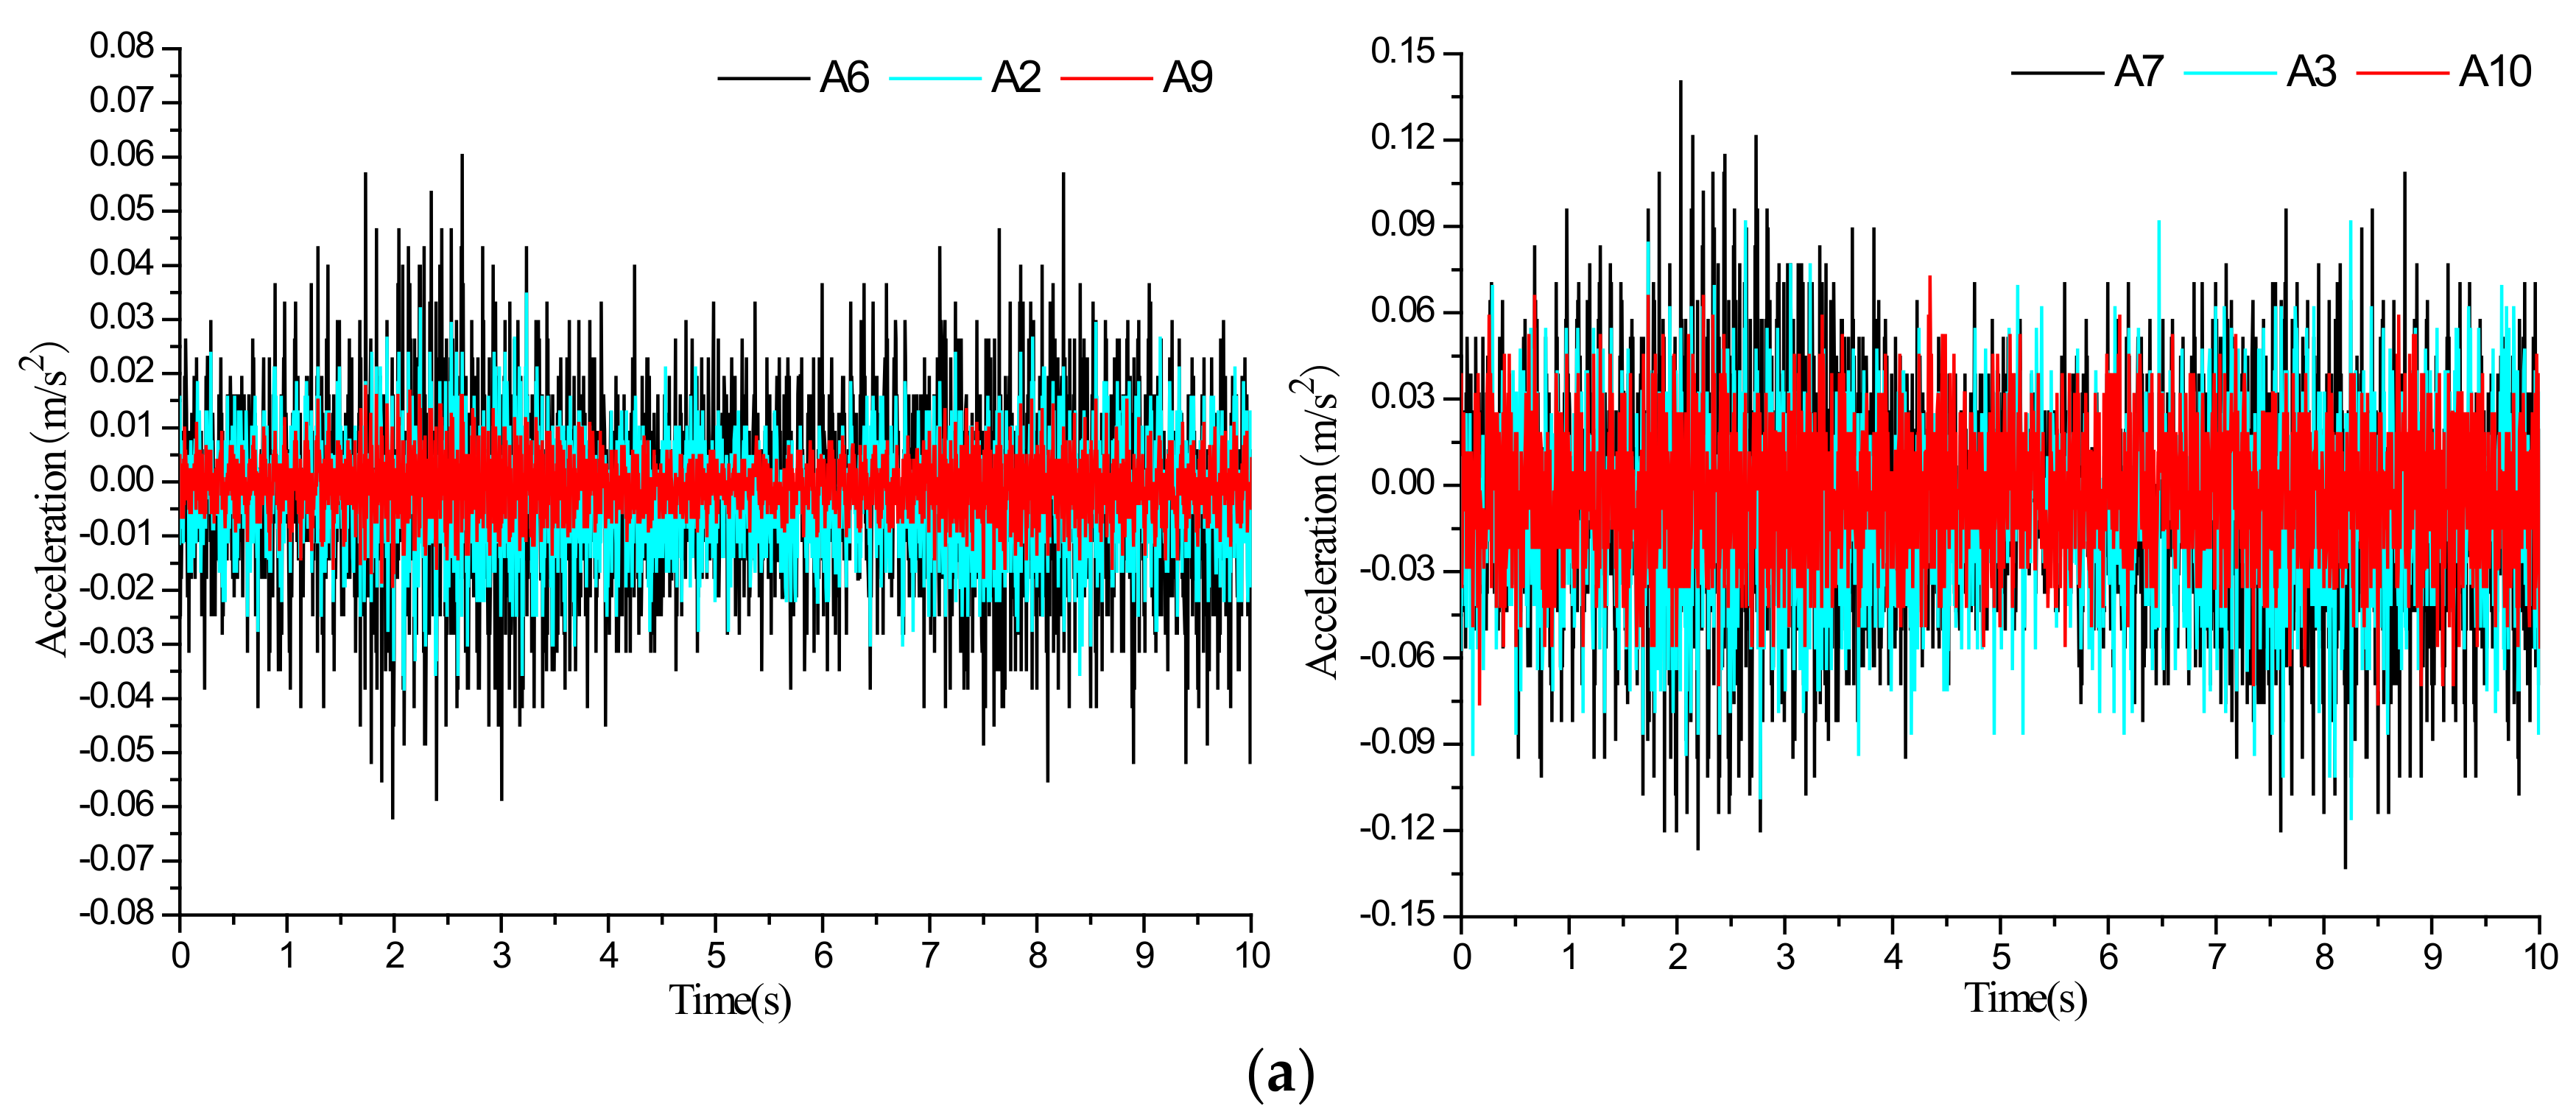
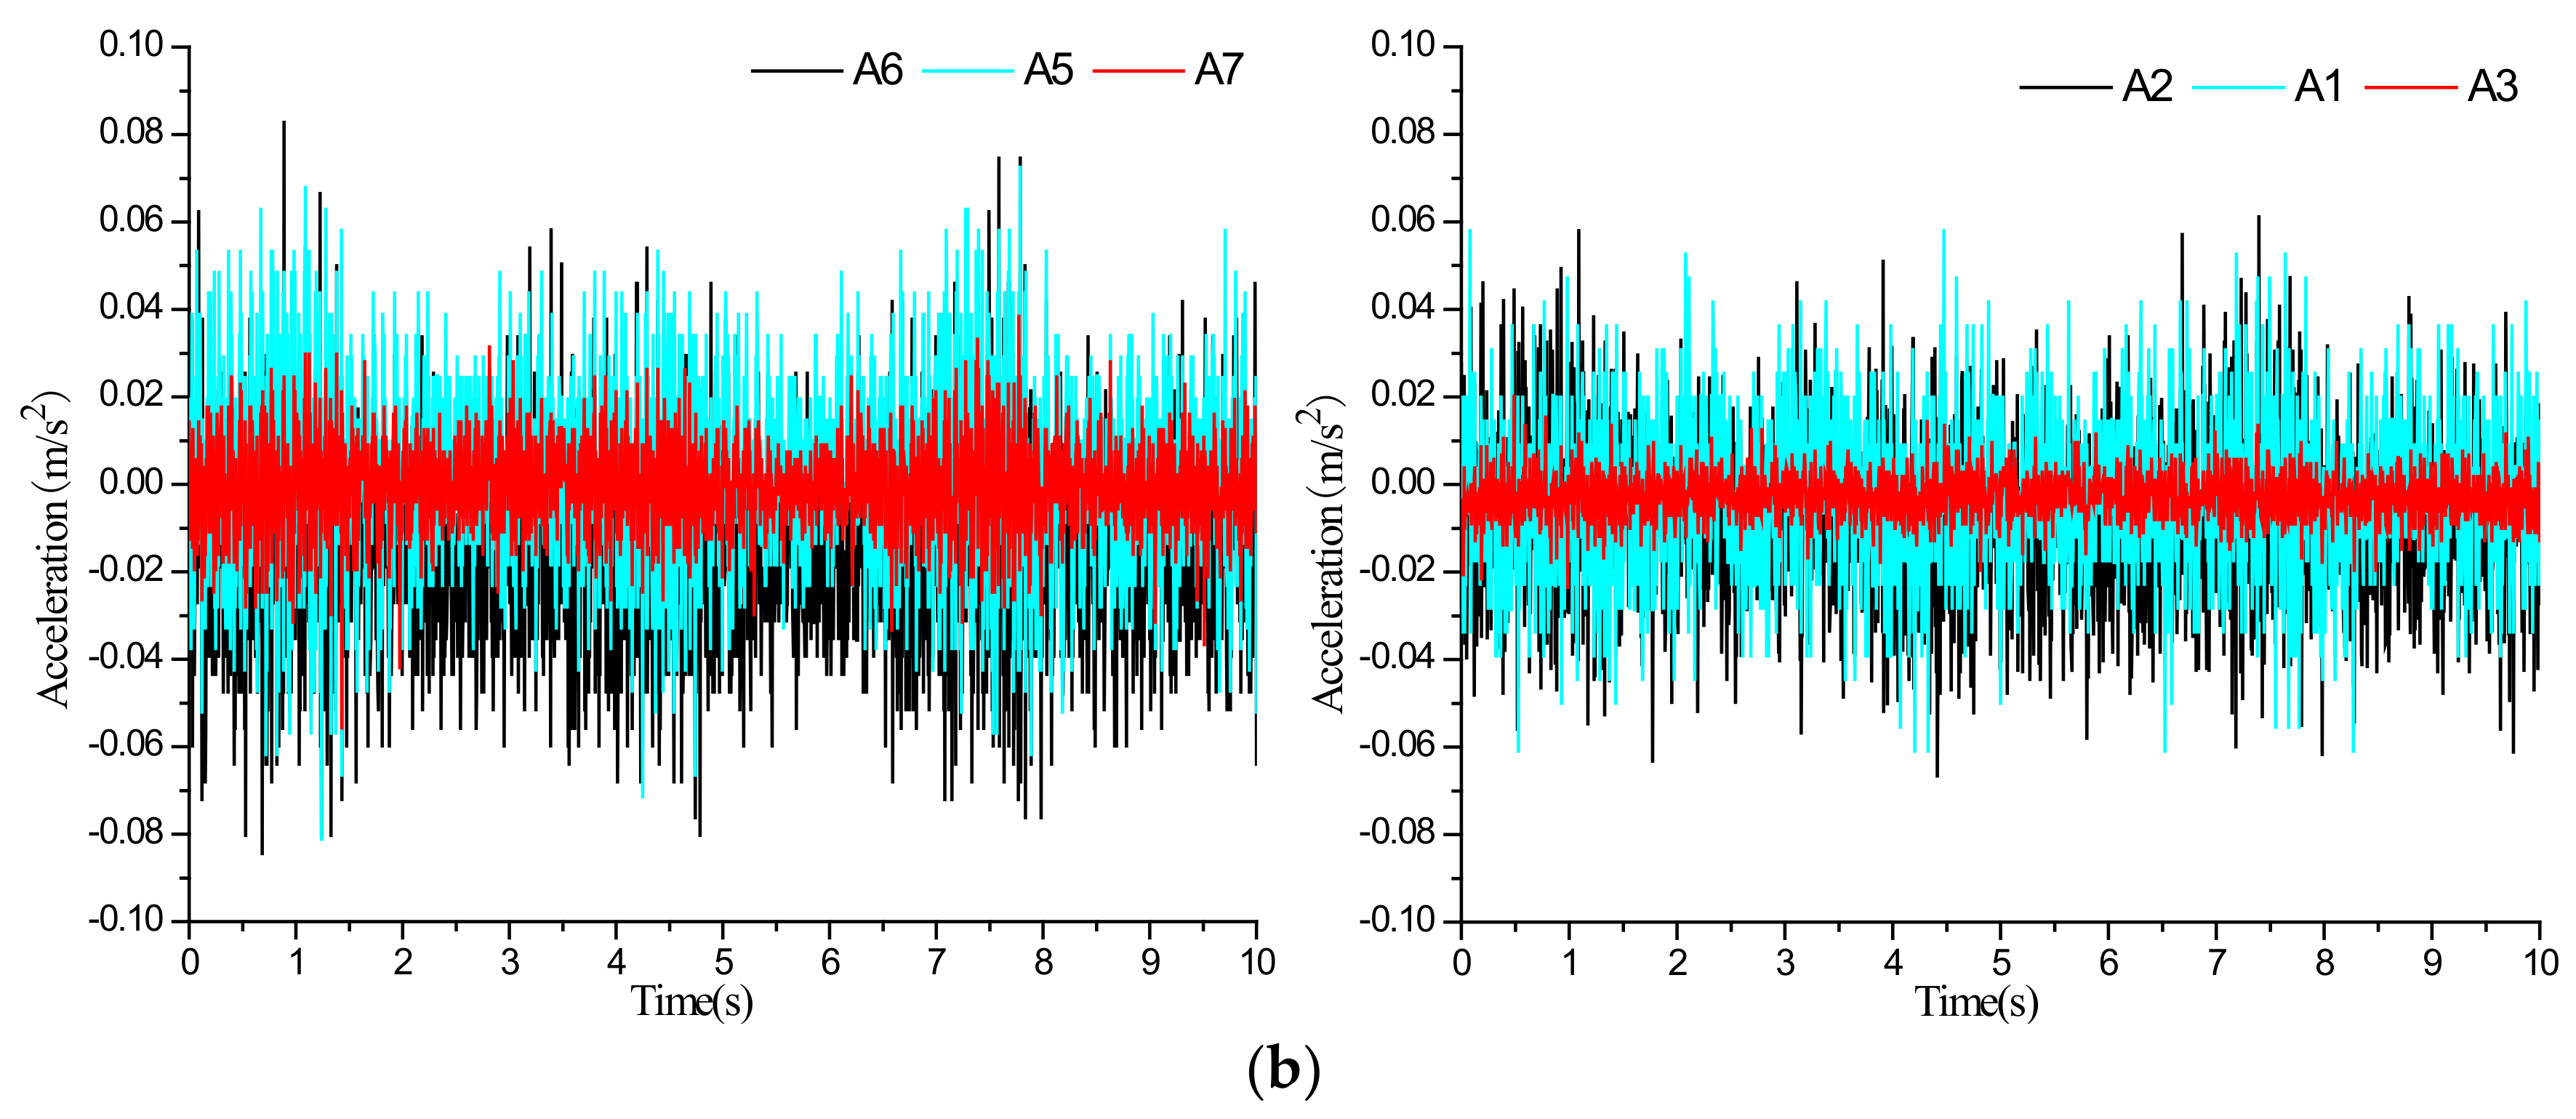
3.1. Acceleration Response of Soil

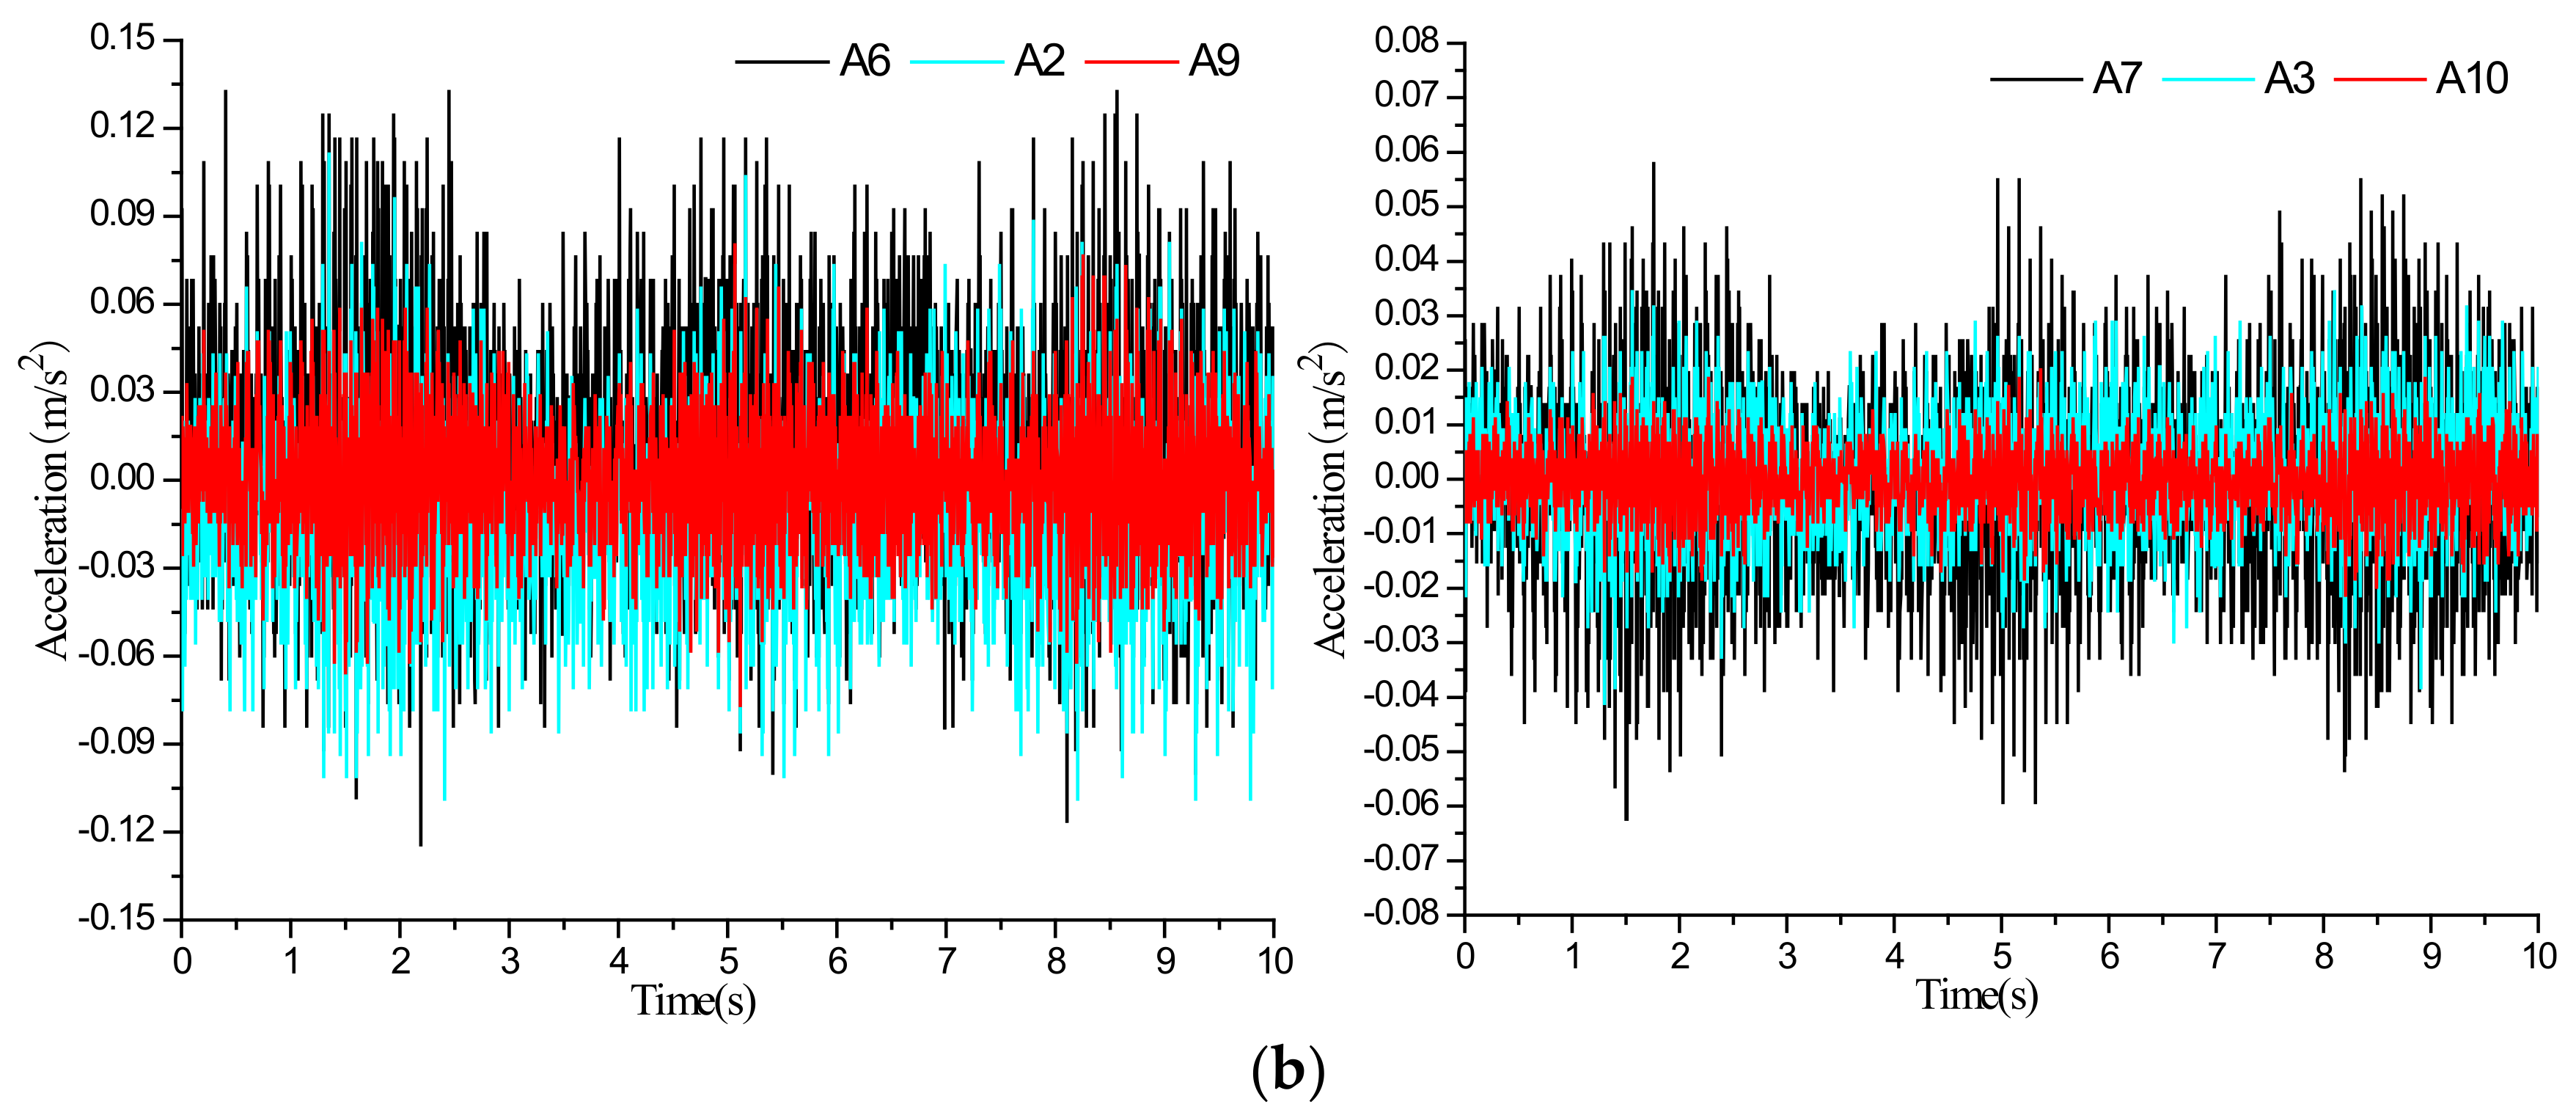
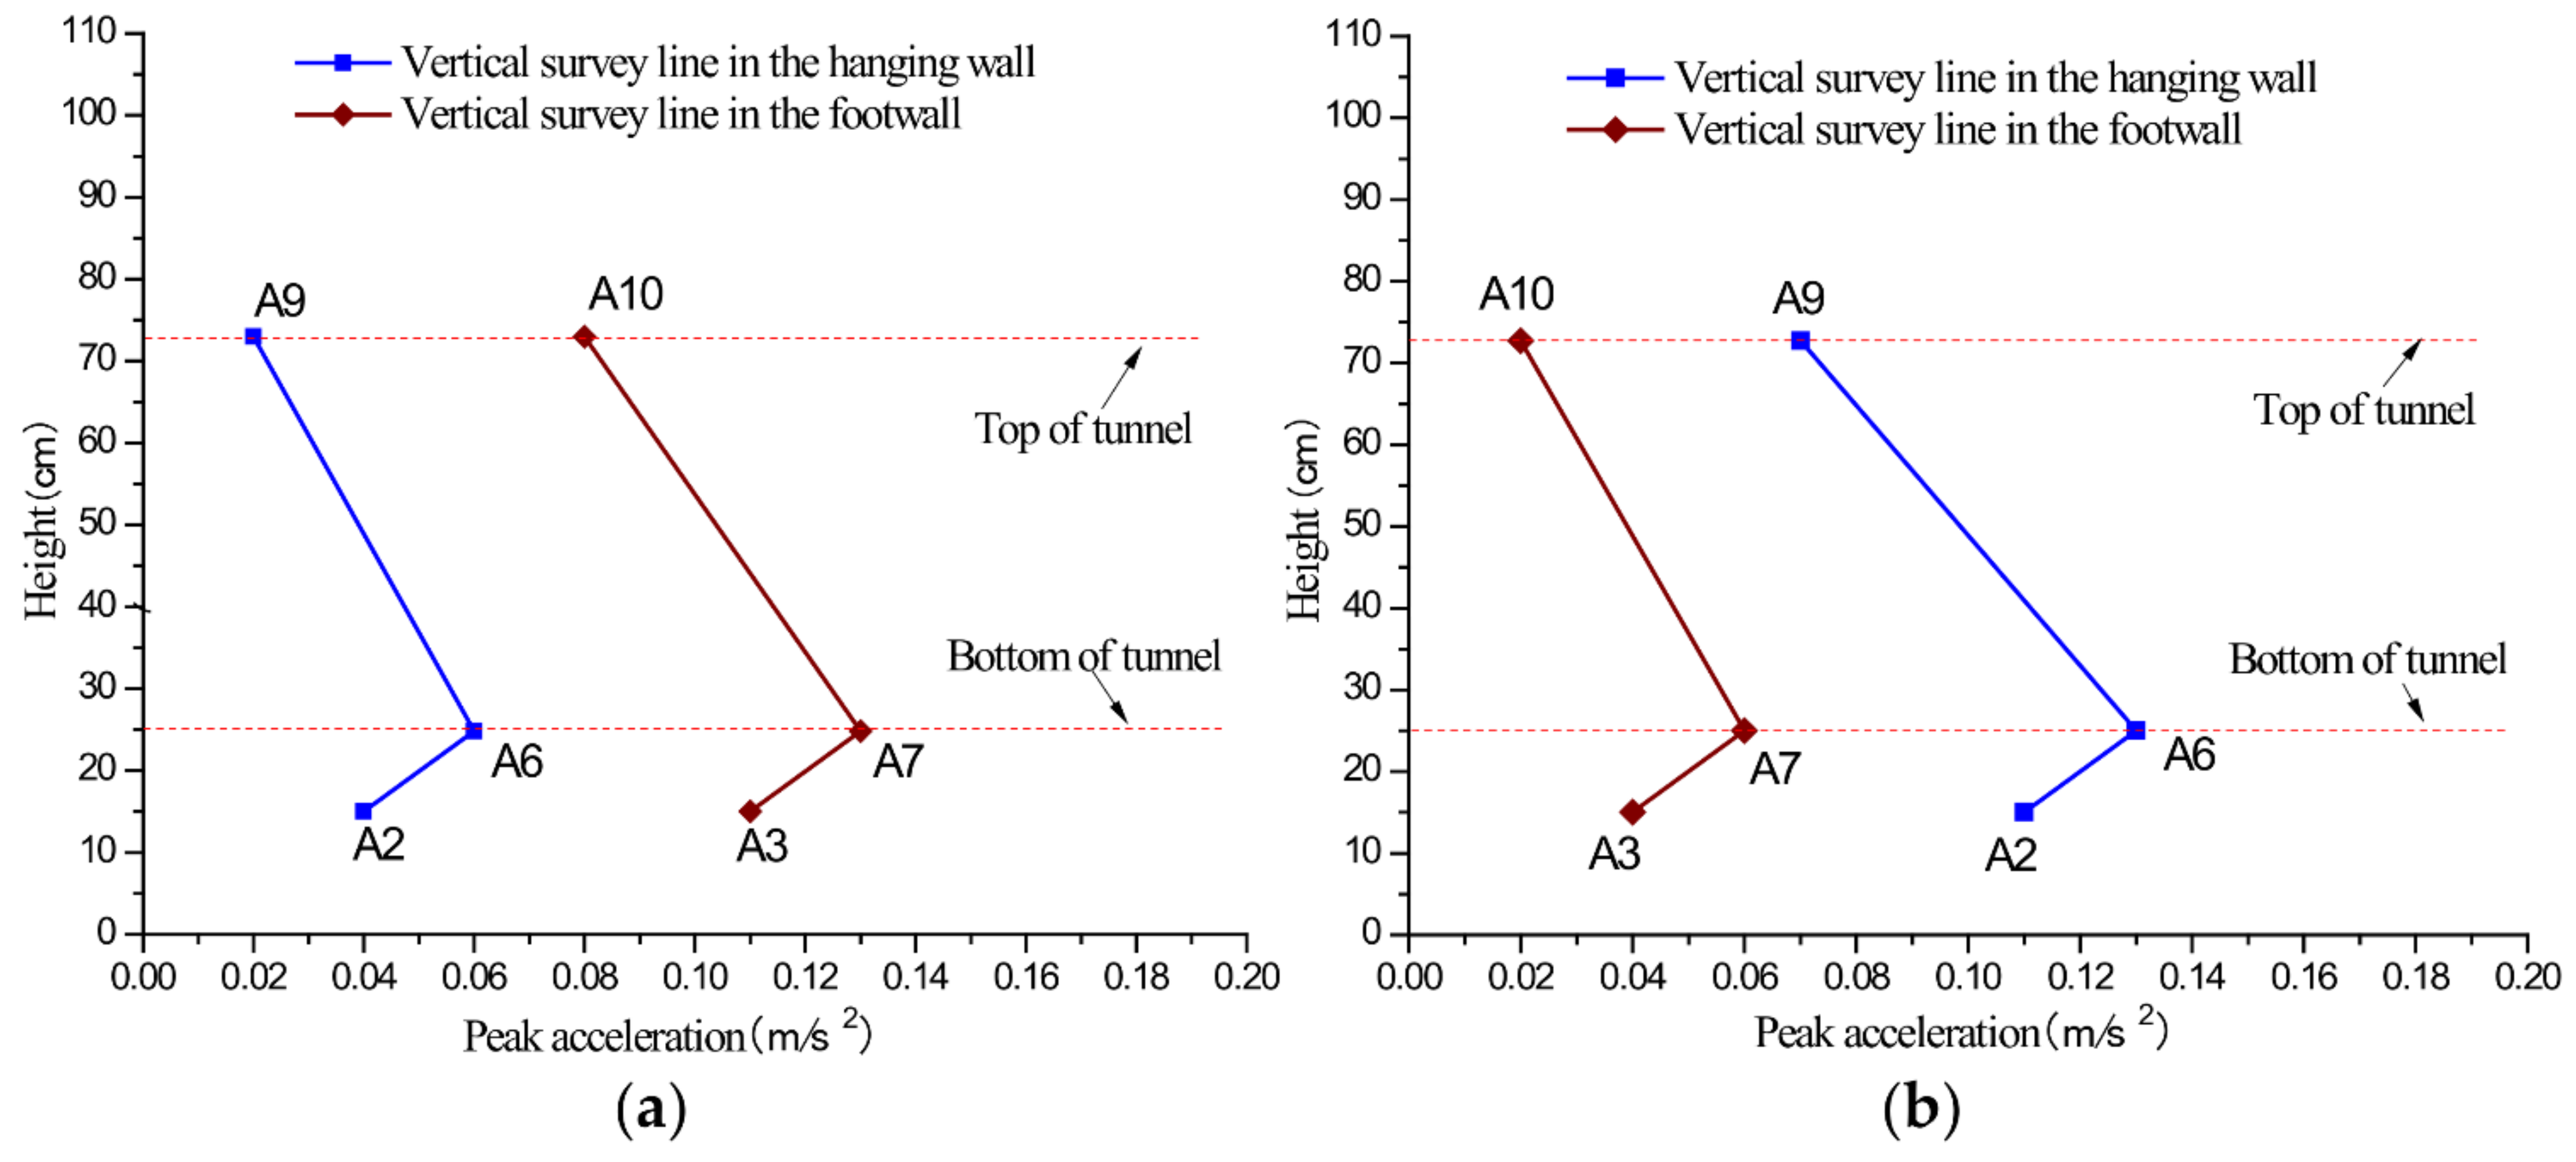
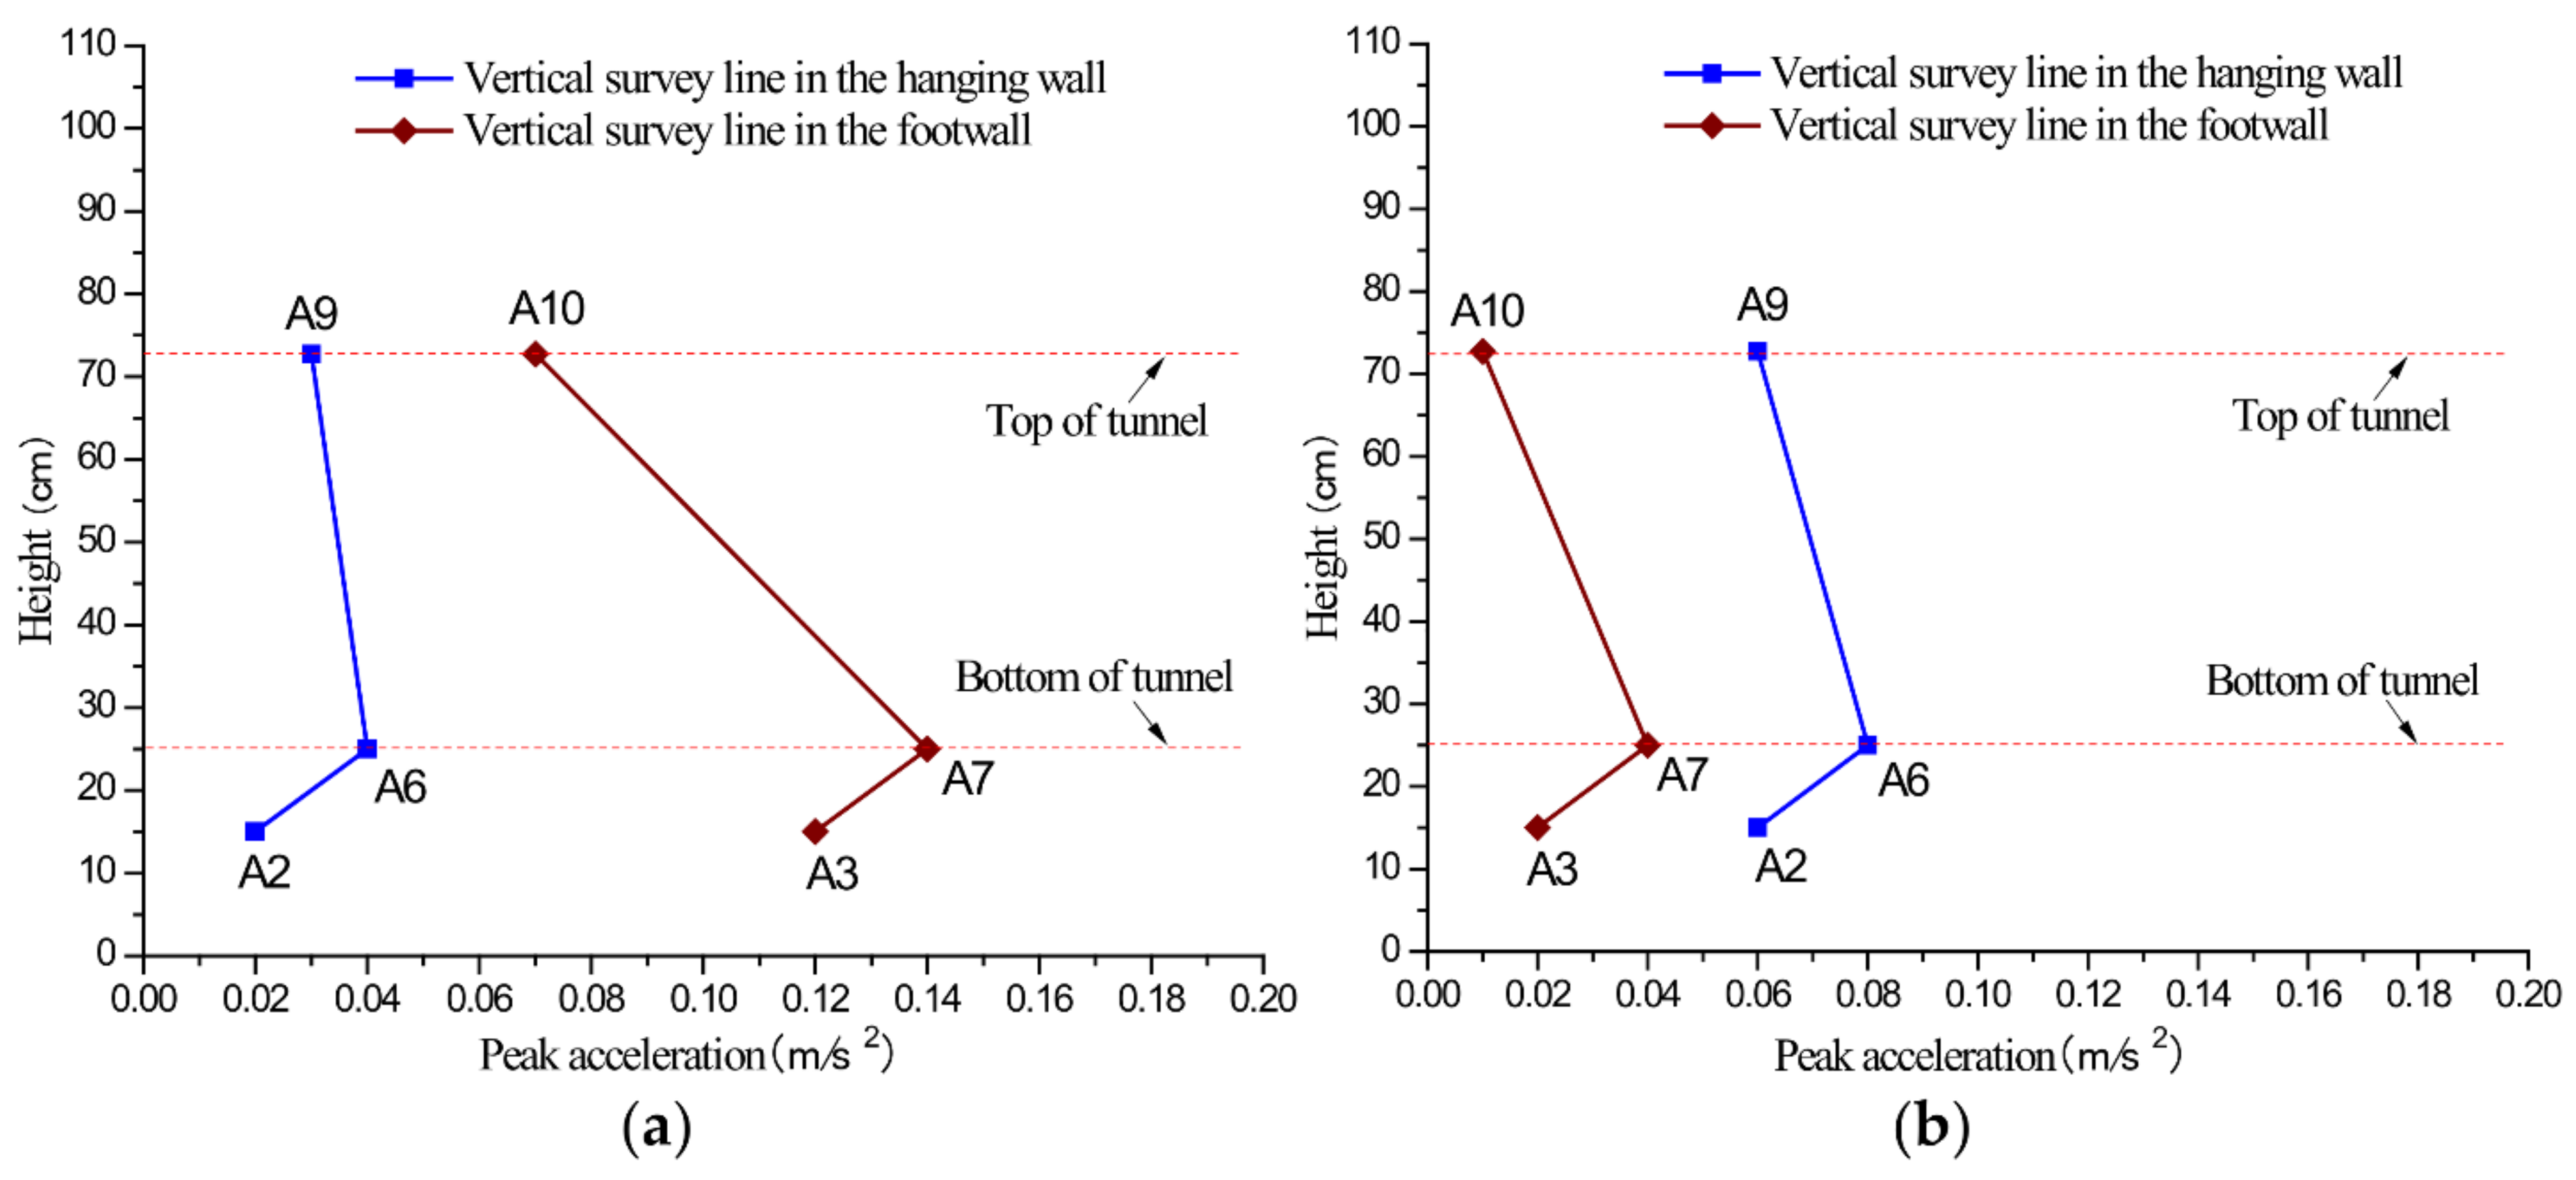
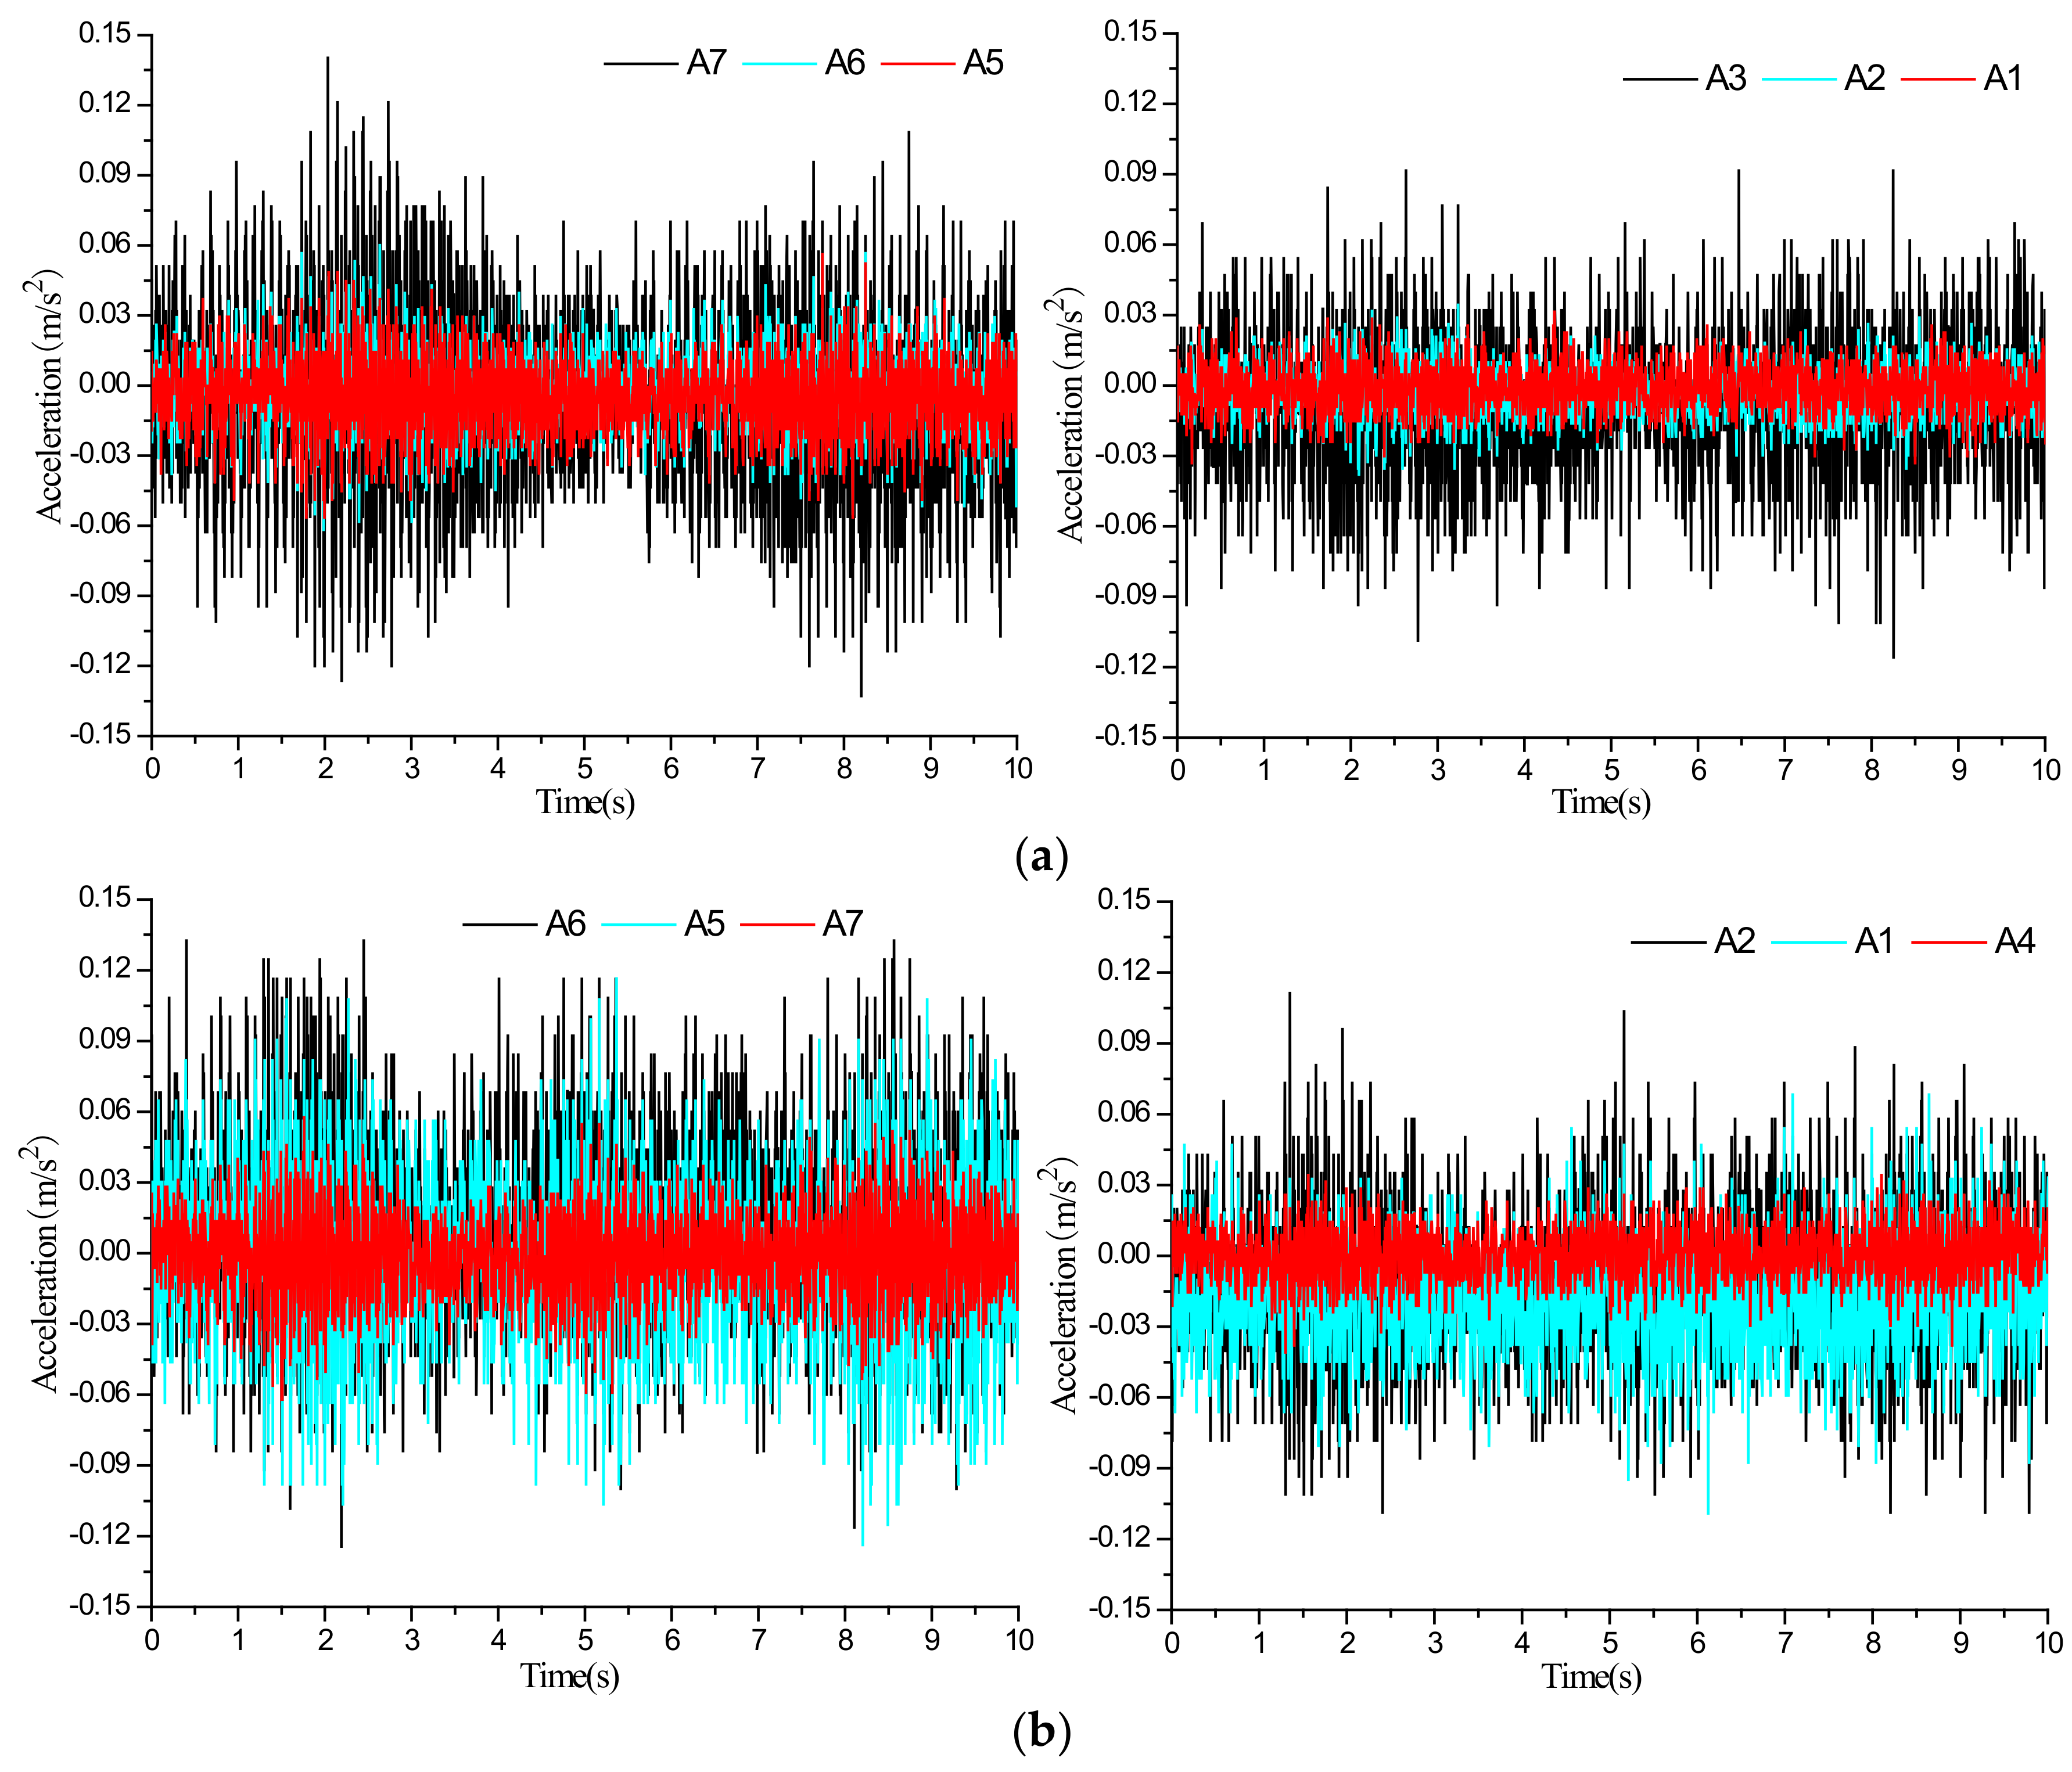
3.1.1. Dynamic Response at Different Depth

The results from test points of A3, A7, and A10 in the hanging wall, and A2, A6, and A9 in the footwall were analyzed to investigate the dynamic response at different embedded depth. Figure 8 and Figure 9 show the acceleration time series and the peak acceleration curve at test points under 10 Hz excitation at 60 and 100 cm from the right margin of the tunnel. When the vibration exciter at 60 cm works, the peak acceleration at points A6 and A7 (0.06 and 0.13 m/s2, respectively) is obviously higher than that at A2 and A3 (0.04 and 0.11 m/s2, respectively), indicating the attenuation effect of the soil layer on the subway-induced vibration. Meanwhile, peak acceleration at points A9 and A10 at the tunnel crown is quite low in such a condition, with values of 0.02 and 0.08 m/s2, respectively. When the vibration exciter at 100 cm works, the test results show a similar variation as the test points at the tunnel bottom, which show the largest peak acceleration, and the points at the tunnel crown and 10 cm below the tunnel bottom, which show the decreasing peak acceleration. In general, the soil acceleration attenuates both upward and downward from the vibration exciter with the maximum value at the tunnel bottom.
Figure 10 and Figure 11 show the acceleration time series and peak acceleration of test points (A2, A3, A6, A7, A9, A10) under the combined impact of the ground fissure descending (1 cm) and 10 Hz excitation at 60 and 100 cm from the right margin of the tunnel. Results show a complicated stress state for soil and tunnel near the ground fissure because of the oblique intersection between the ground fissure and tunnel.
In the central axis section of the tunnel, voiding and compacting phenomena between the tunnel and soil mass are identified near the ground fissure. Among them, the tunnel bottom in the hanging wall and the tunnel crown in the footwall are voided from the soil, while the tunnel crown in the hanging wall and the tunnel bottom in the footwall are compacted with the soil. Moreover, the variation of the contact state between the tunnel and soil also affects the propagation process of vibration. When the vibration exciter at 60 cm from the right margin of the tunnel works, the test points of A6 and A2 that are below the tunnel in the hanging wall present a decreasing acceleration (0.04 and 0.02 m/s2, respectively) due to the impact of the partial void, while the compaction causes the increase in acceleration at point A9 (0.03 m/s2). Similarly, A7 and A3 test points at the tunnel bottom in the footwall show a decreasing peak acceleration (0.14 and 0.12 m/s2, respectively), while the A10 point shows an increasing one (0.07 m/s2). Additionally, the test results of the scenario that the vibration exciter at 100 cm works also show a similar variation, except for a higher peak acceleration in the compaction region and a lower acceleration in the voiding region.
In summary, for a two-section subway tunnel, the peak acceleration of soil shows the maximum value near the tunnel bottom and decreases with the increase in distance from the vibration exciter. The soil acceleration attenuates from the vibration exciter to both sides in the vertical direction. Notably, the movement of the ground fissure only causes the variation in the acceleration value, but has no effect on its attenuation law.

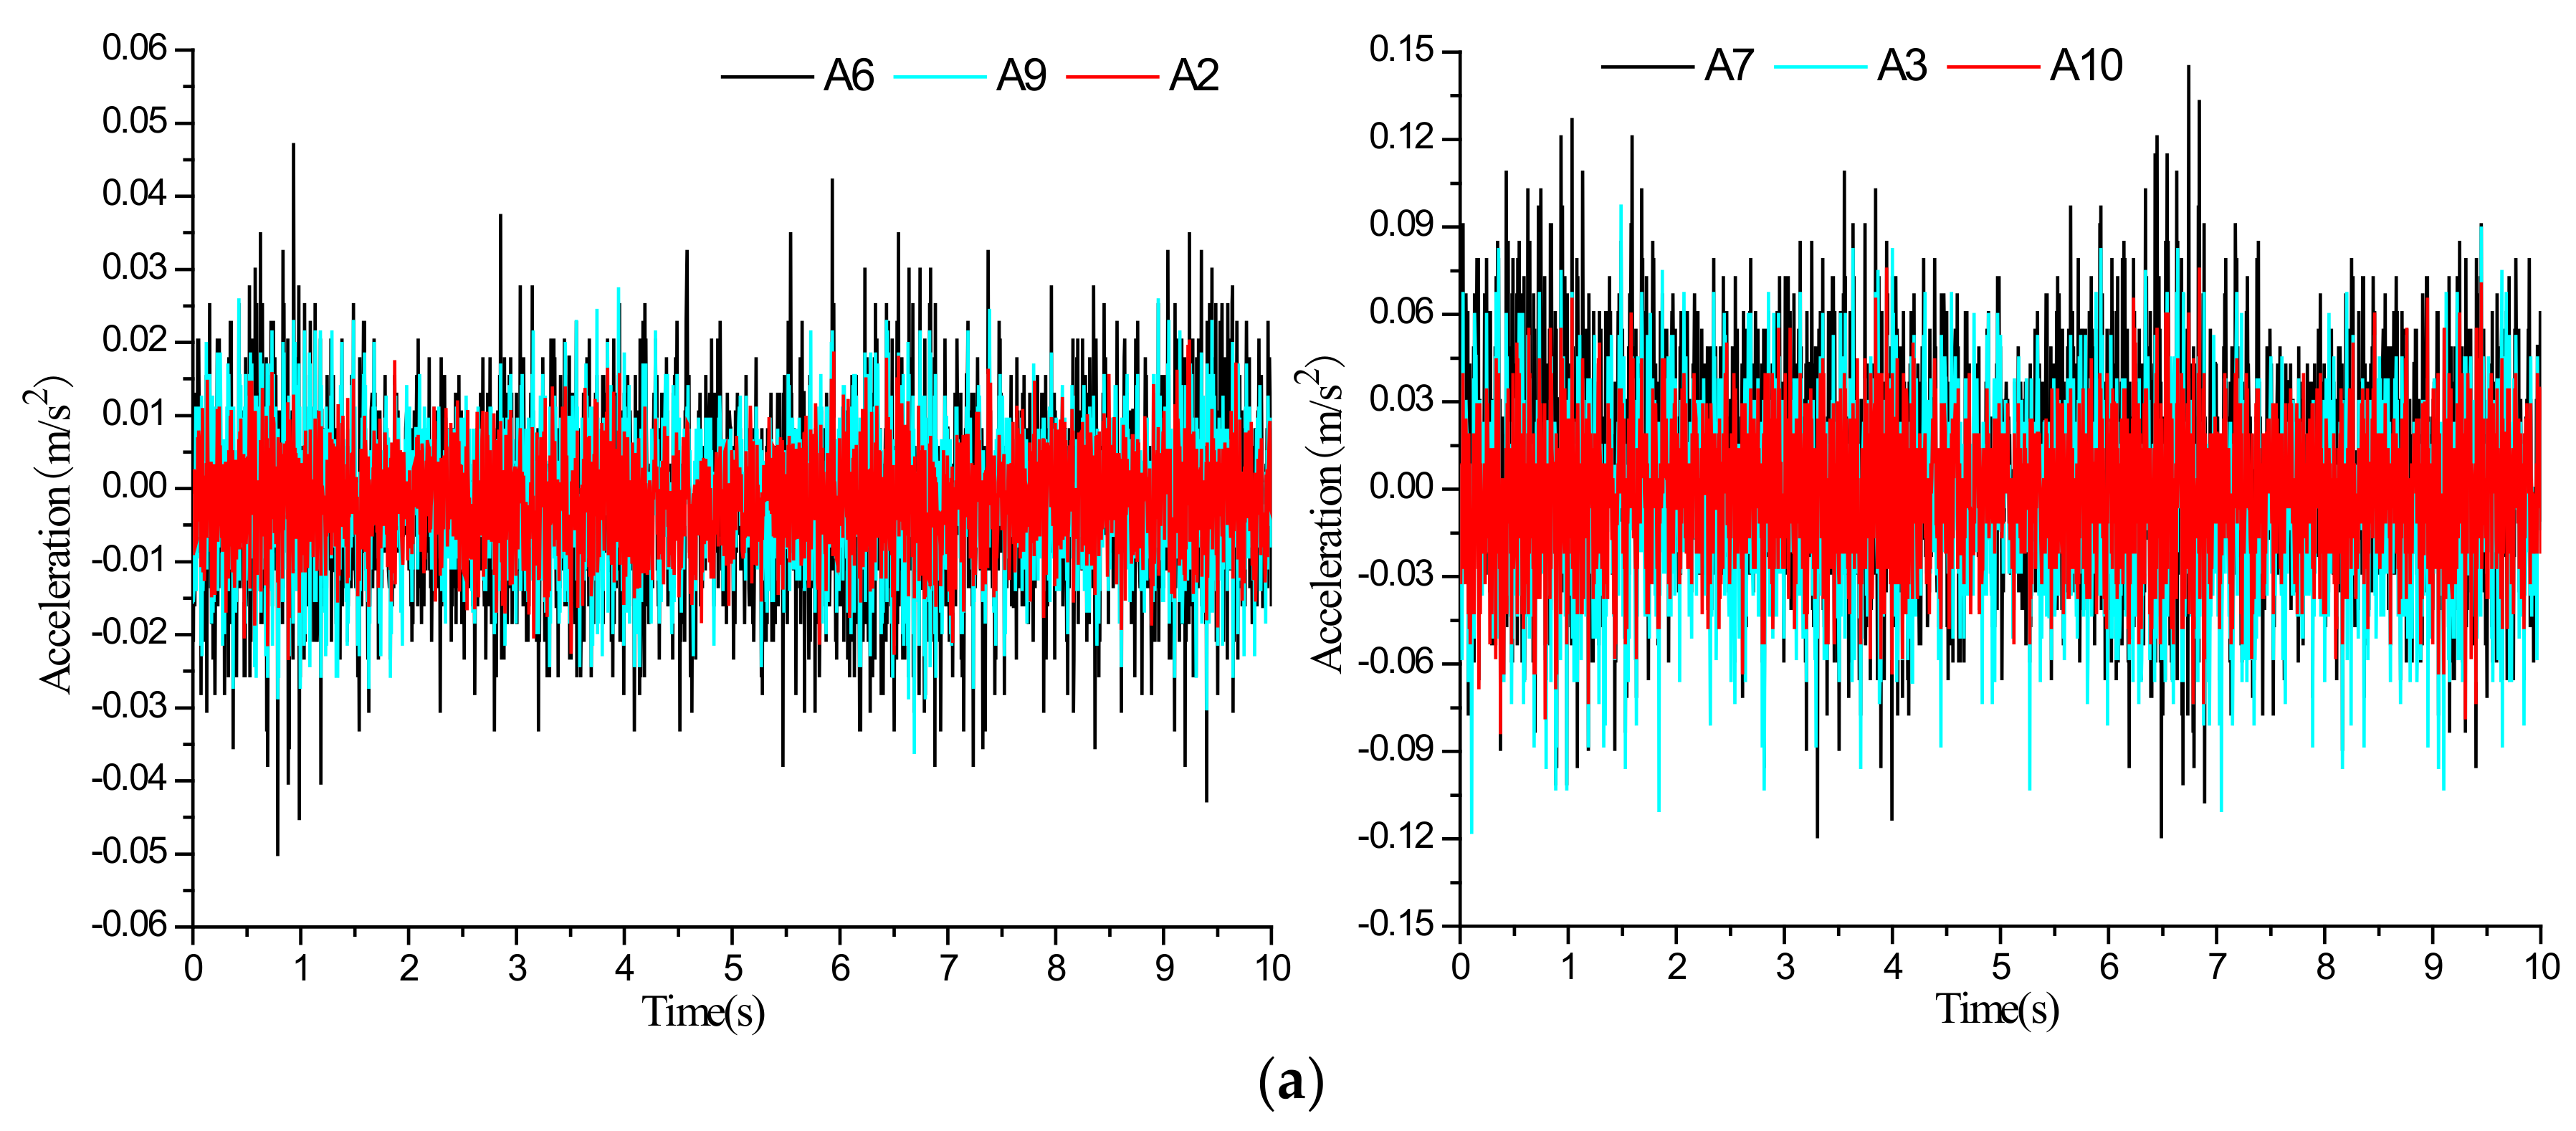
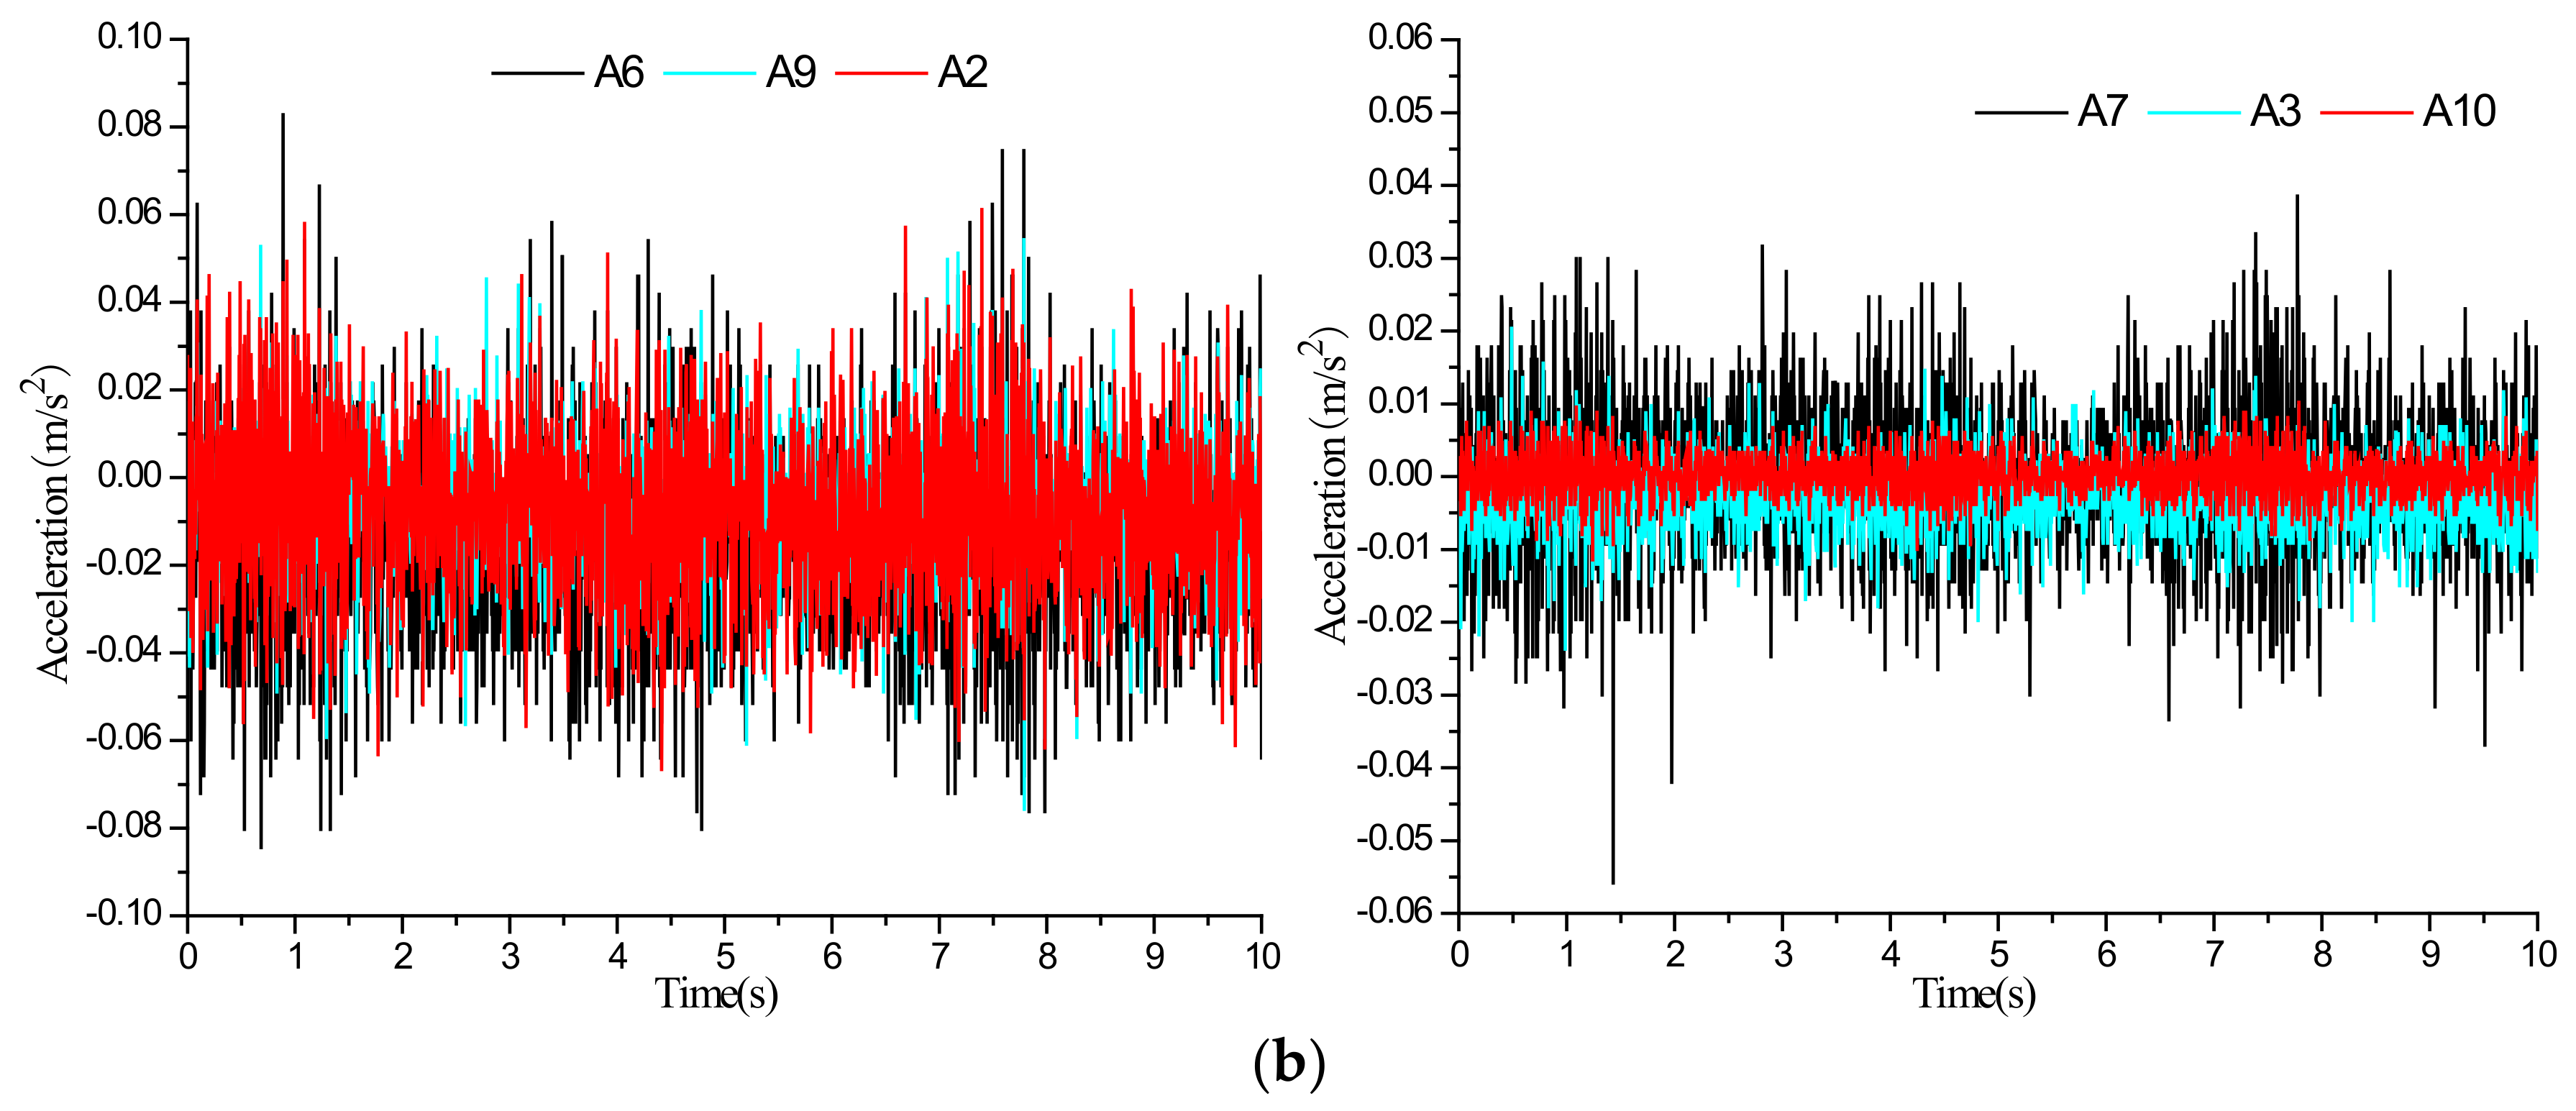
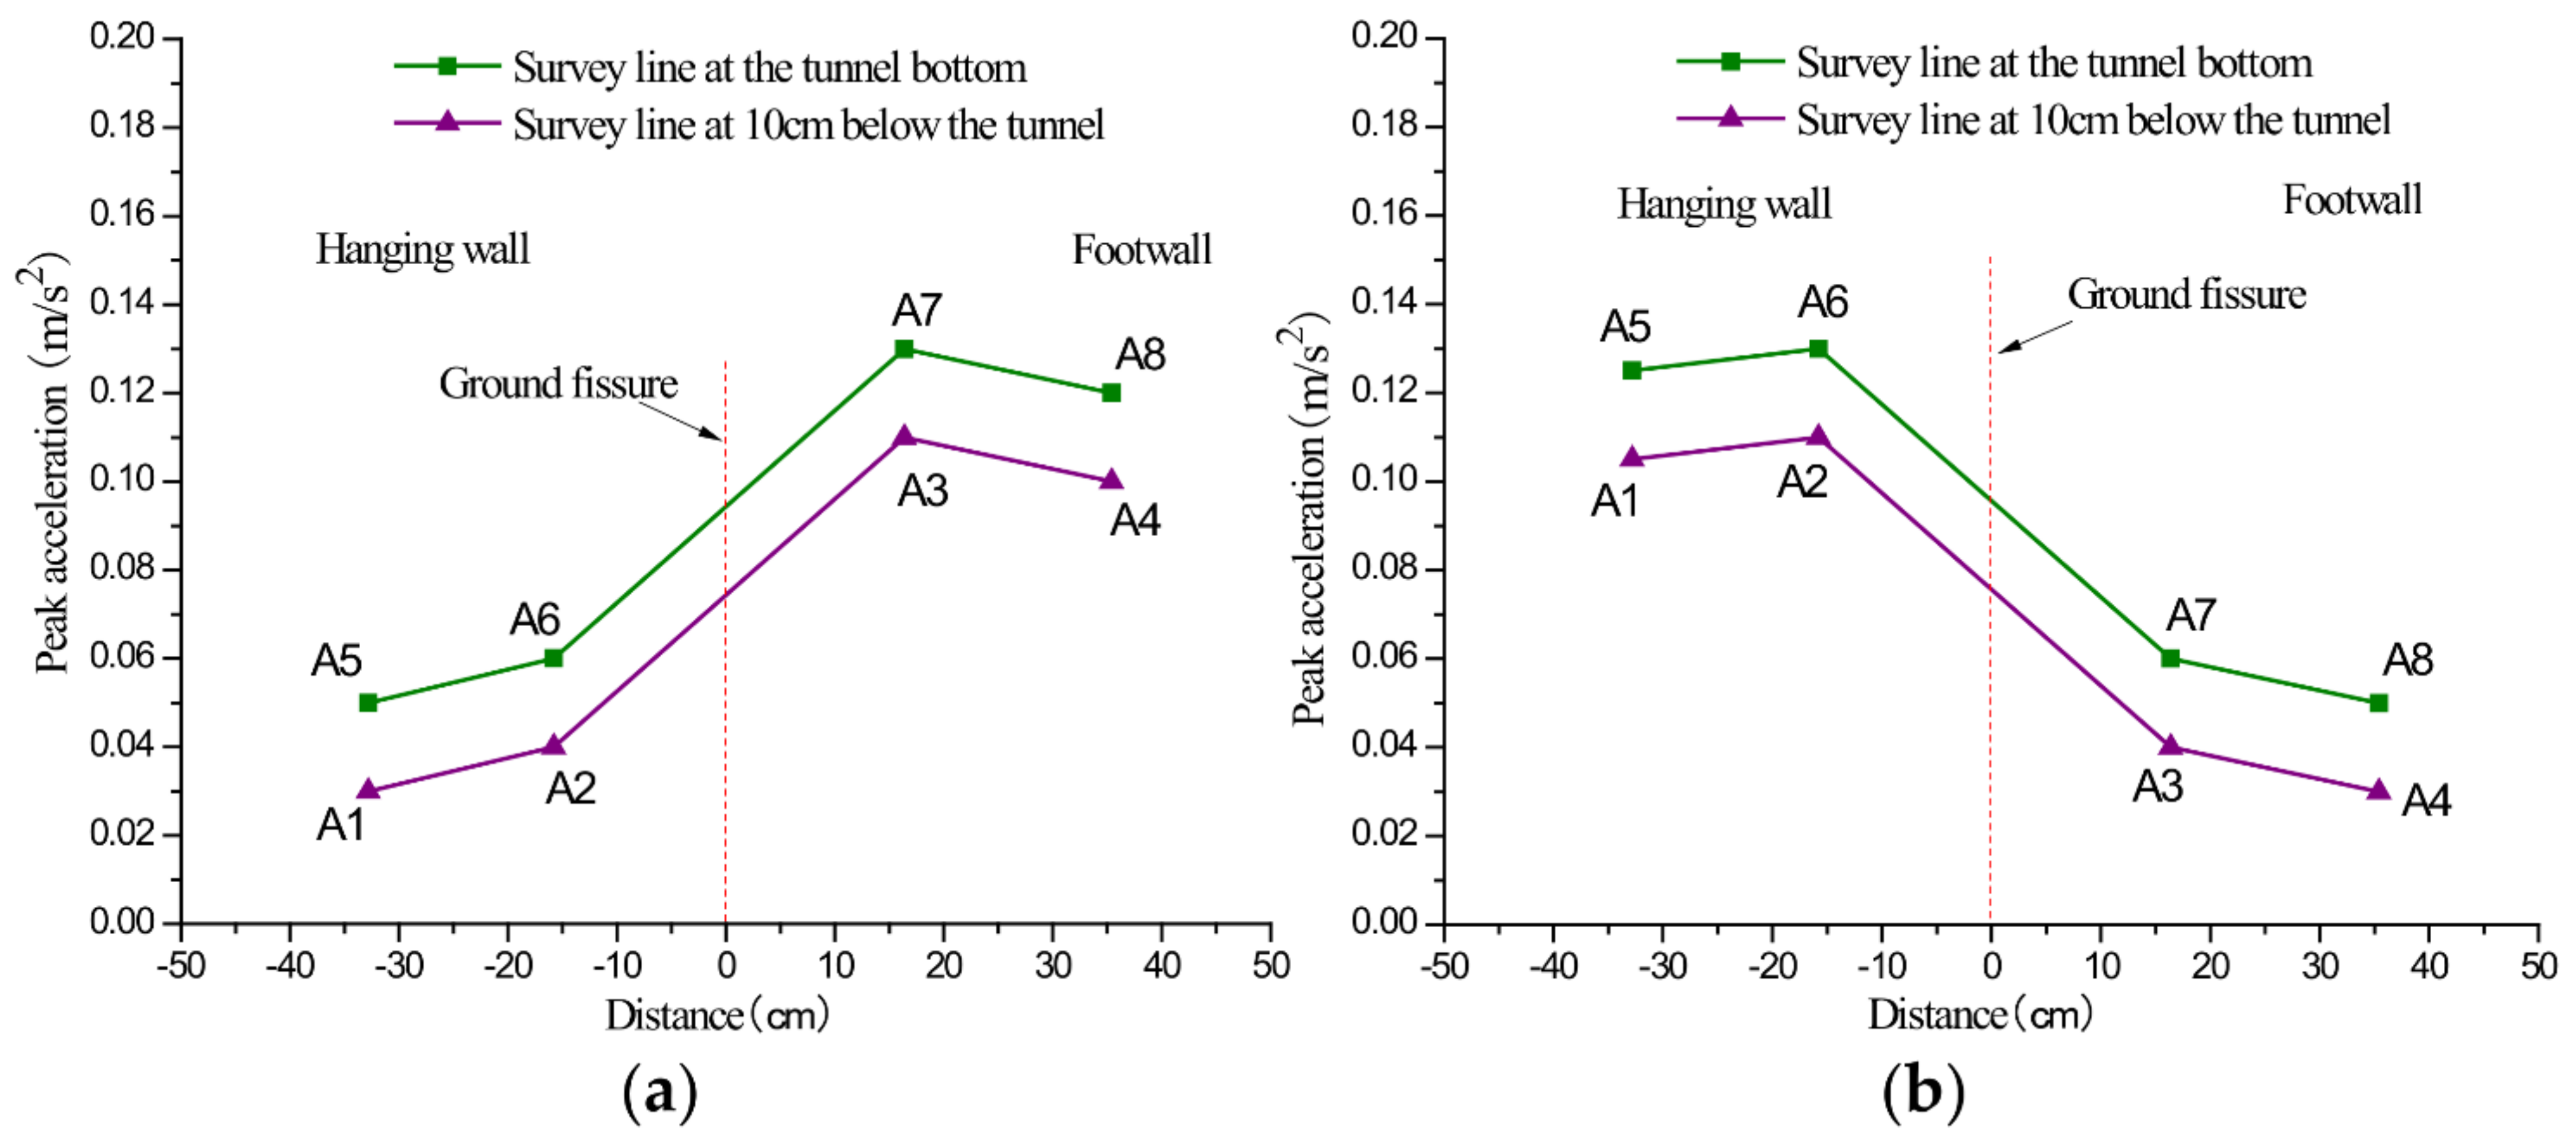
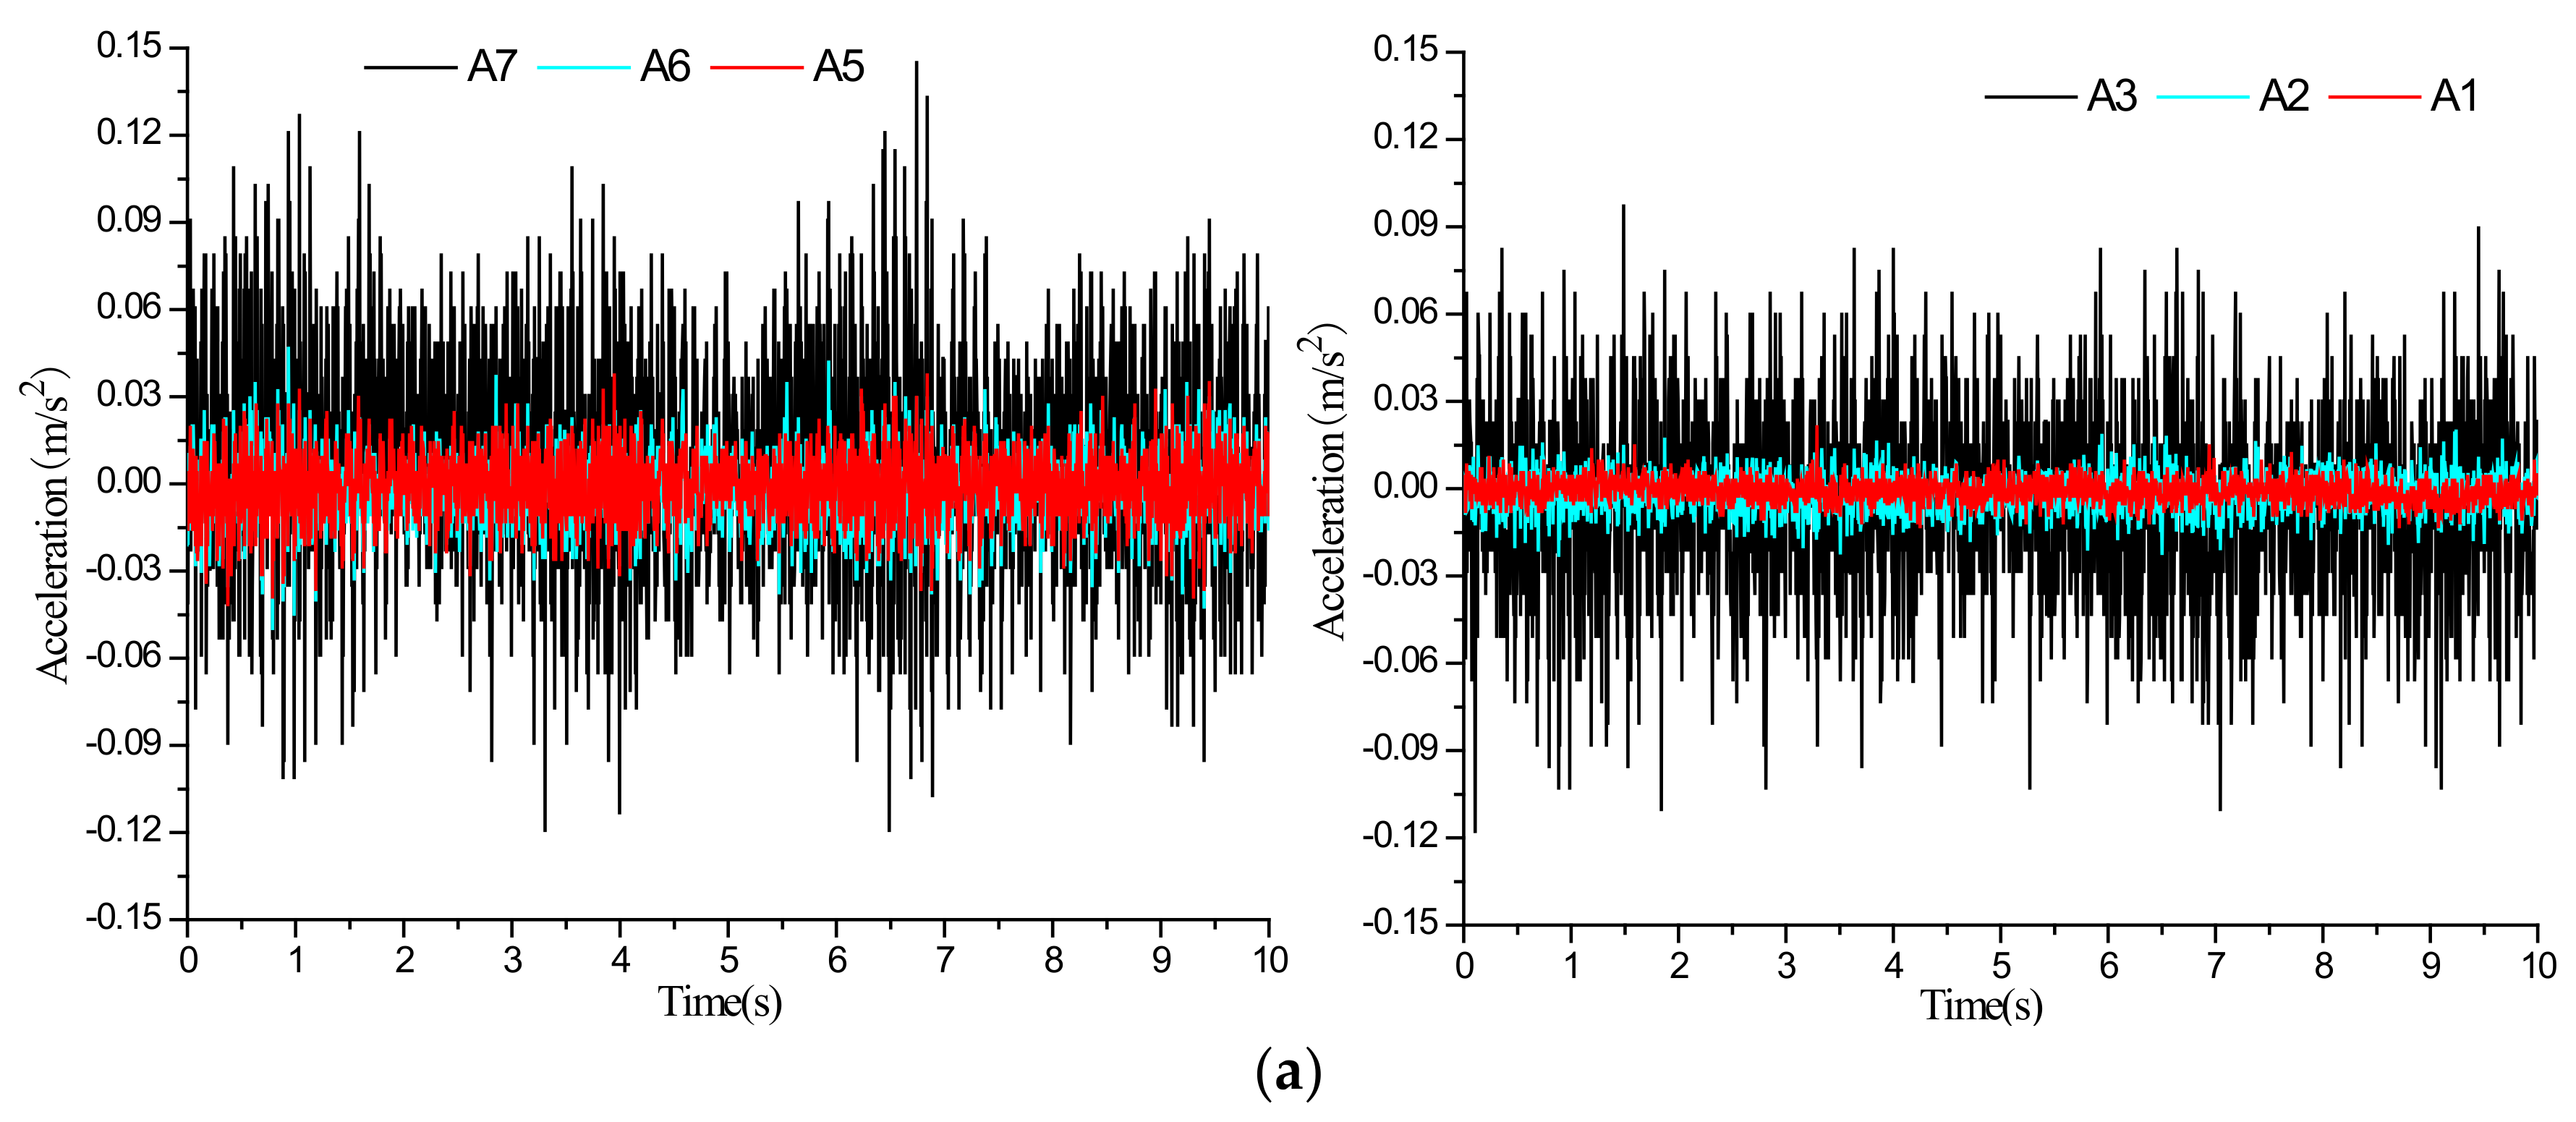
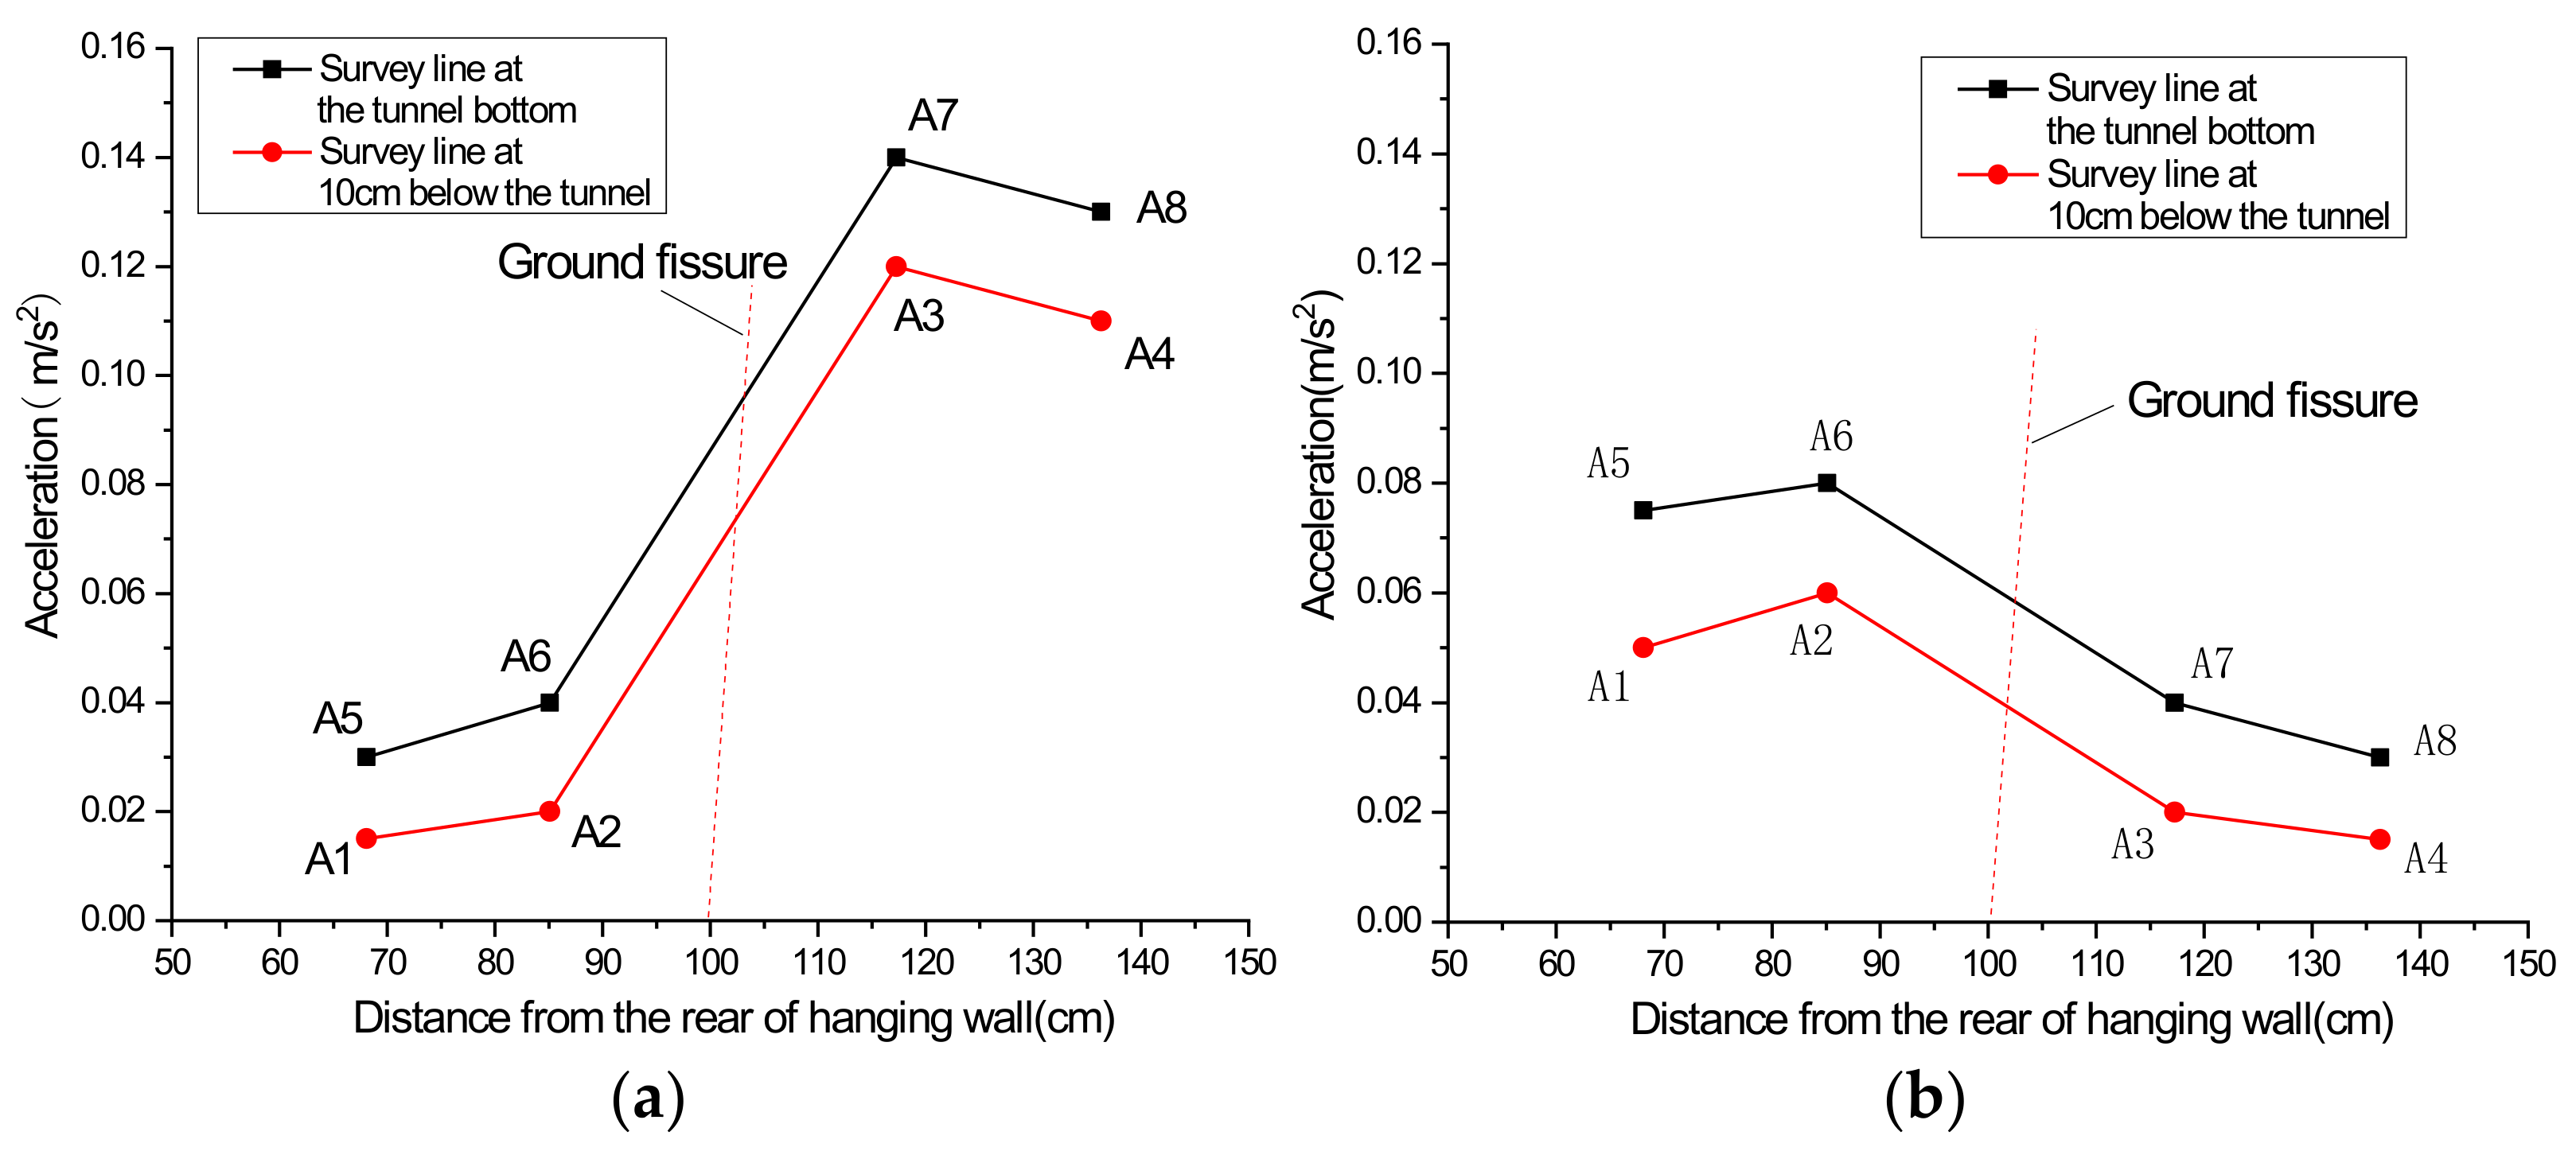
3.1.2. Dynamic Response Longitudinal along the Tunnel

The test results of points A5, A6, and A7 at the tunnel bottom (named survey line 1) and points A1, A2, and A3 at 10 cm below the tunnel bottom (named survey line 2) were analyzed to investigate the dynamic response longitudinal along the tunnel. Figure 12 and Figure 13 show the acceleration time series and peak acceleration at these two survey lines under 10 Hz excitation at 60 and 100 cm from the right margin of the tunnel. When the vibration exciter at 60 cm works, the A7 point, which is closest to the excitation point, shows the largest acceleration, followed by A8, while the points A5 and A6, which are located in the hanging wall, show a lower value. The test results of points at 10 cm below the tunnel bottom show a similar variation. Additionally, when the vibration exciter at 100 cm (in the hanging wall) works, the A6 point, which is closest to the vibration exciter, shows the largest acceleration, followed by A5, while the points A7 and A8, which are located in the footwall, show a lower value. Similar variation is observed at 10 cm below the tunnel bottom. The results indicate the great contribution of ground fissure to the vibration attenuation. Interestingly, similar reduction amplitude of acceleration is identified in the above two scenarios, indicating the even attenuation of acceleration when crossing the ground fissure in both directions.
Figure 14 and Figure 15 show the acceleration time series and peak acceleration of points along the above two longitudinal survey lines under the combined impact of the ground fissure descending (1 cm) and 10 Hz excitation at 60 and 100 cm from the right margin of the tunnel. Test results indicate similar variation to that of an inactive ground fissure. Nevertheless, when the vibration exciter at 60 cm (in the footwall) works, the peak acceleration difference between the test points on both sides of the ground fissure further increases compared to the scenario that with an inactive ground fissure. Furthermore, an opposite phenomenon is identified when the vibration exciter at 100 cm (in the hanging wall) works, indicating a more significant vibration attenuation under the impact of the ground fissure descending than propagation through a ground fissure from the footwall to the hanging wall.

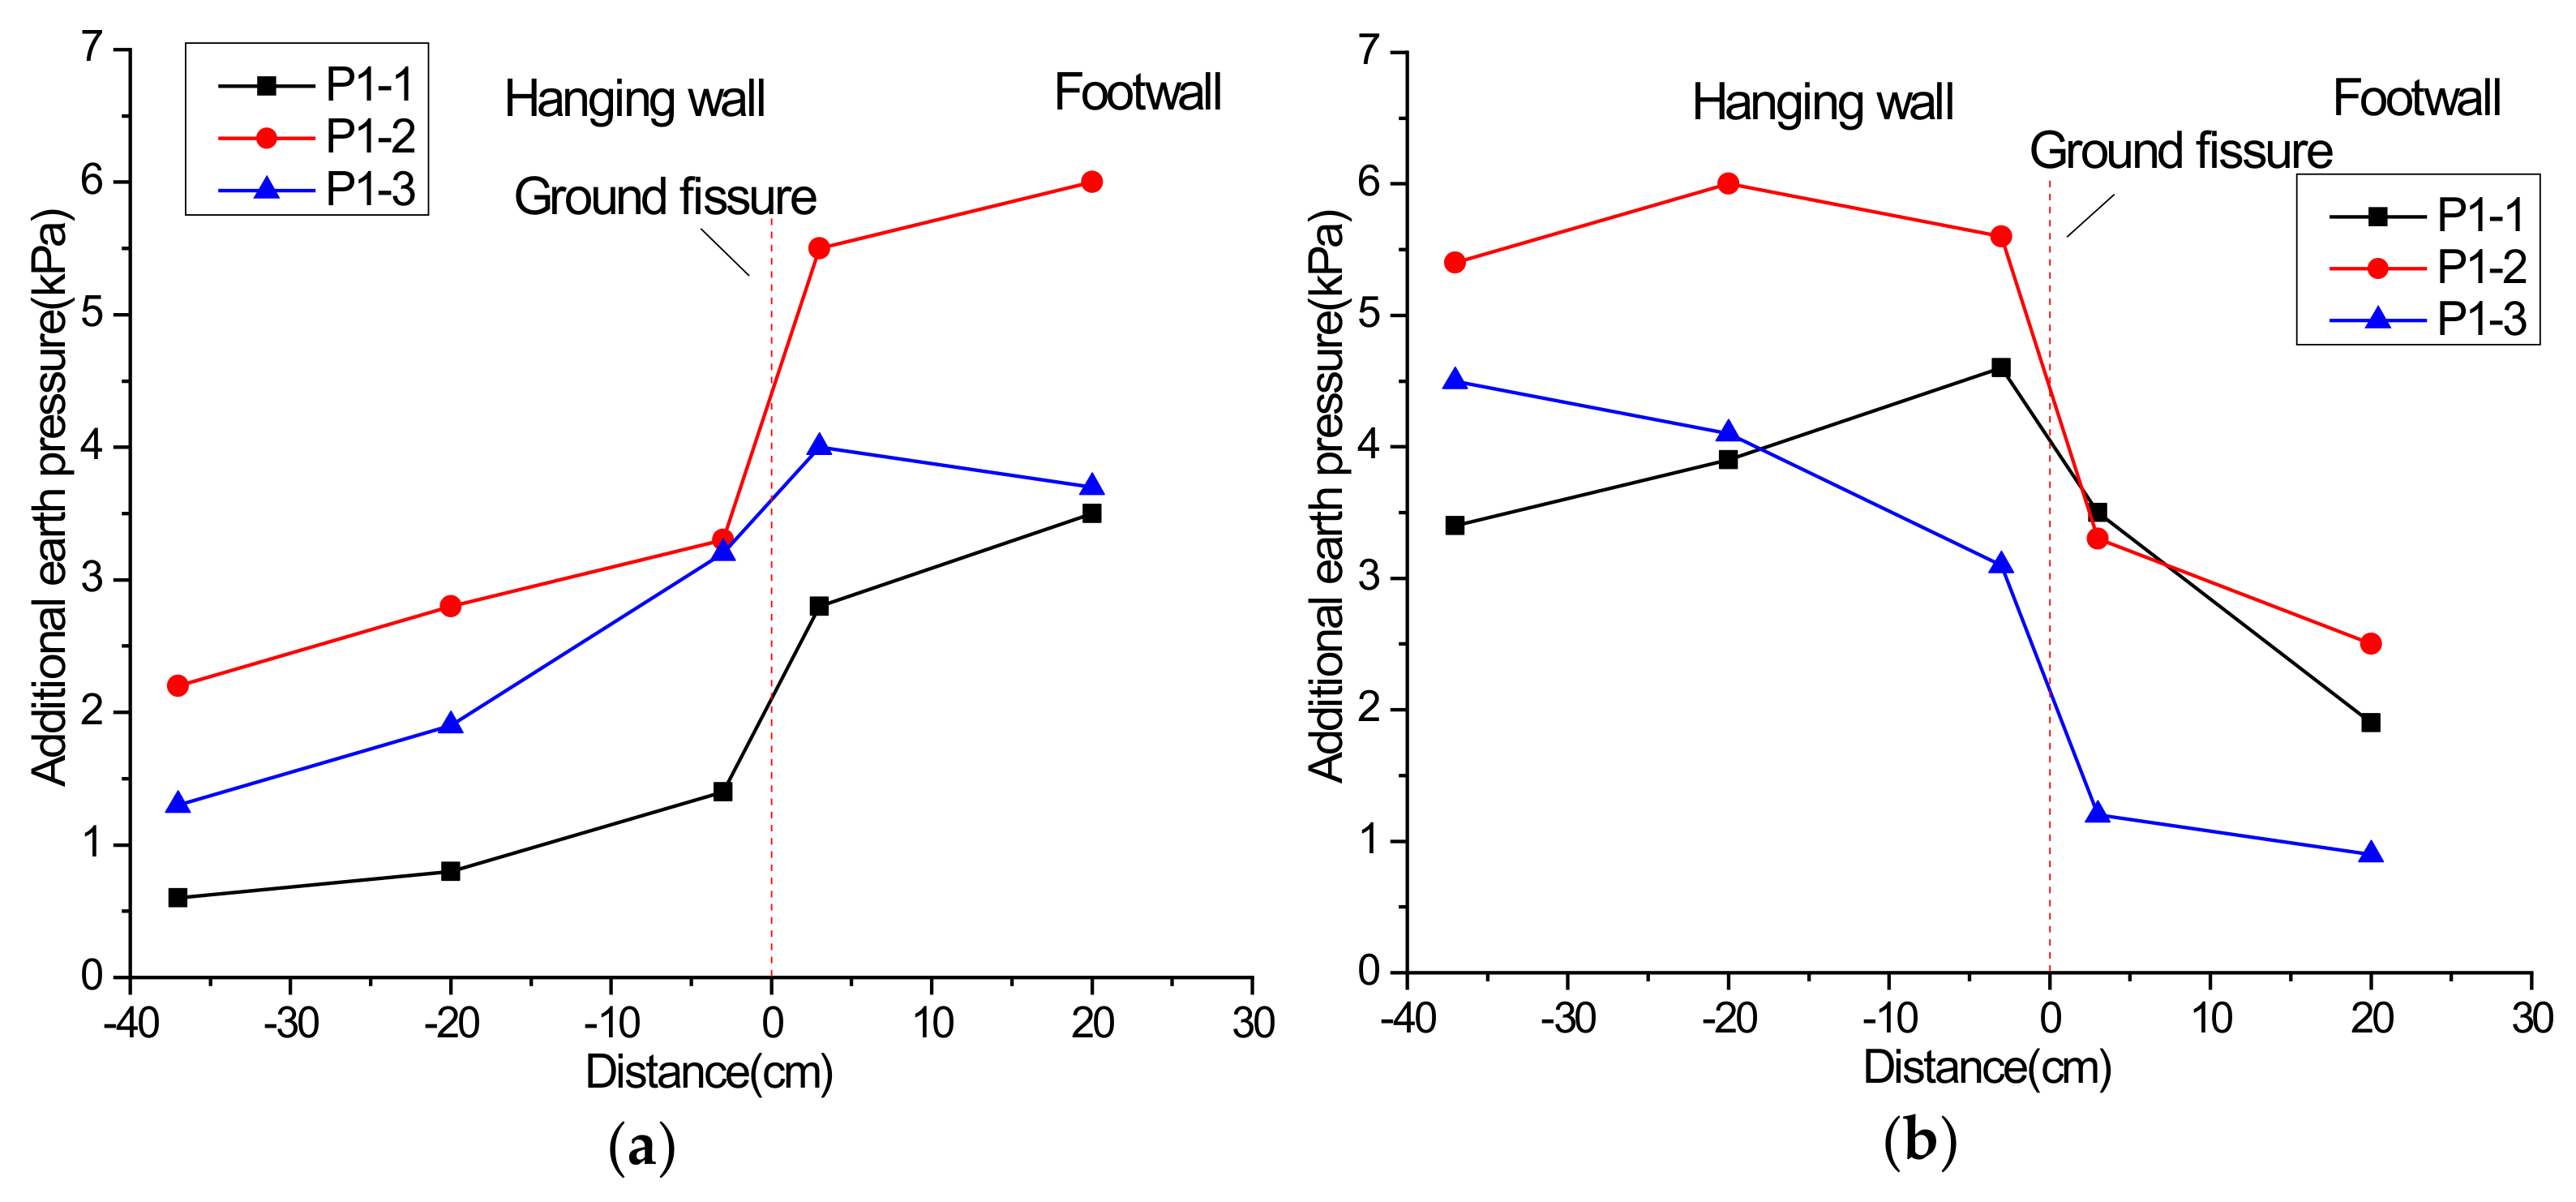
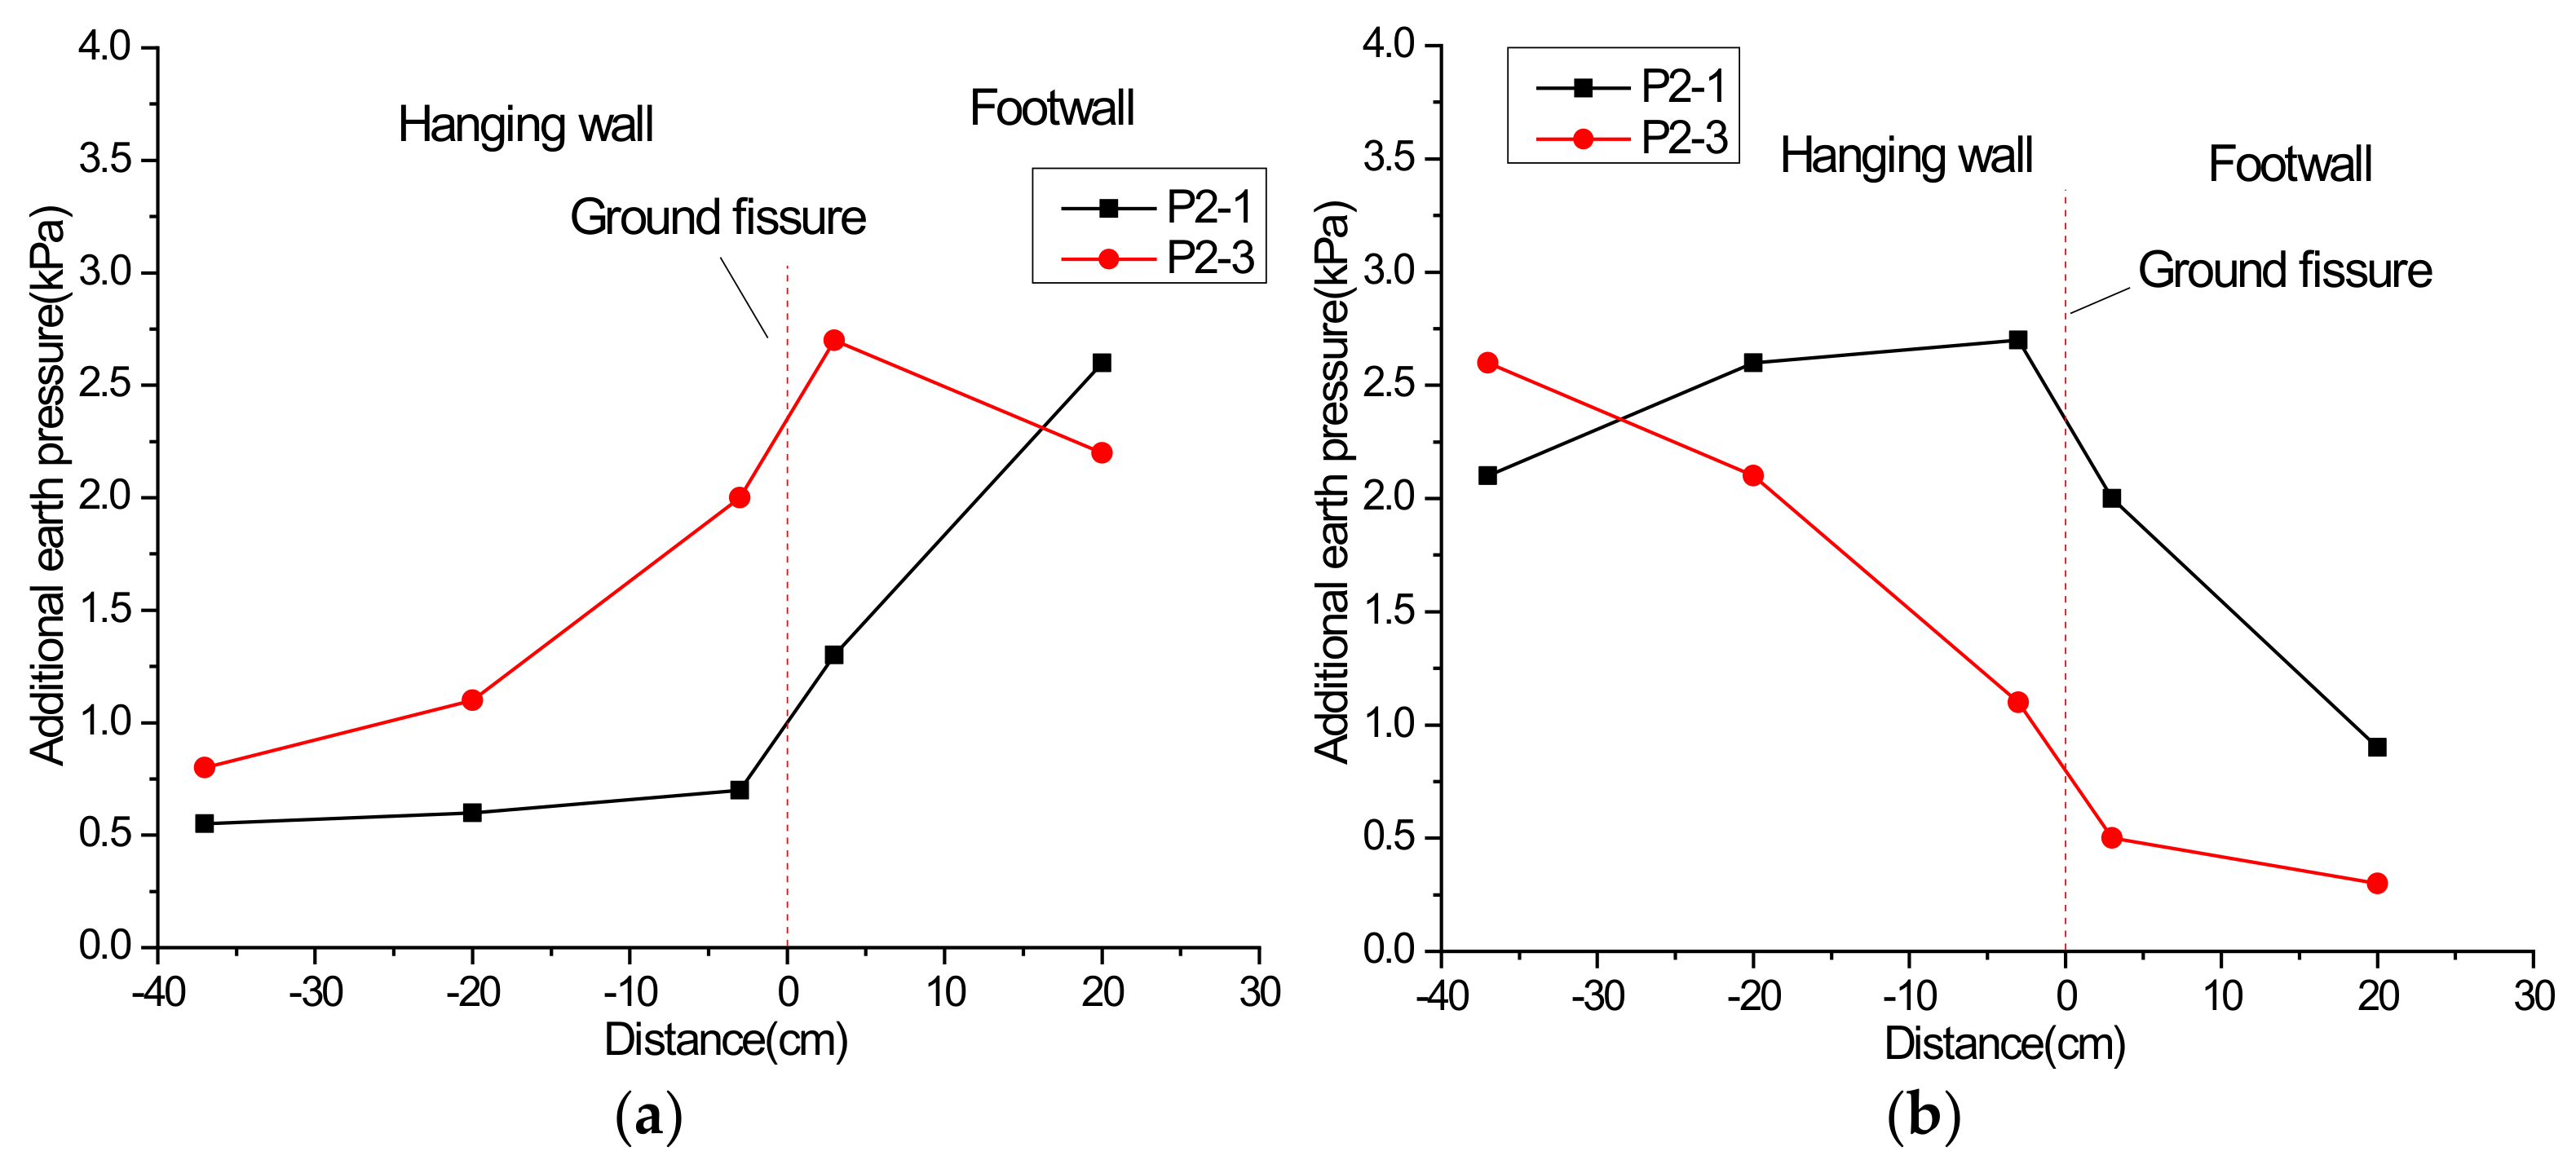
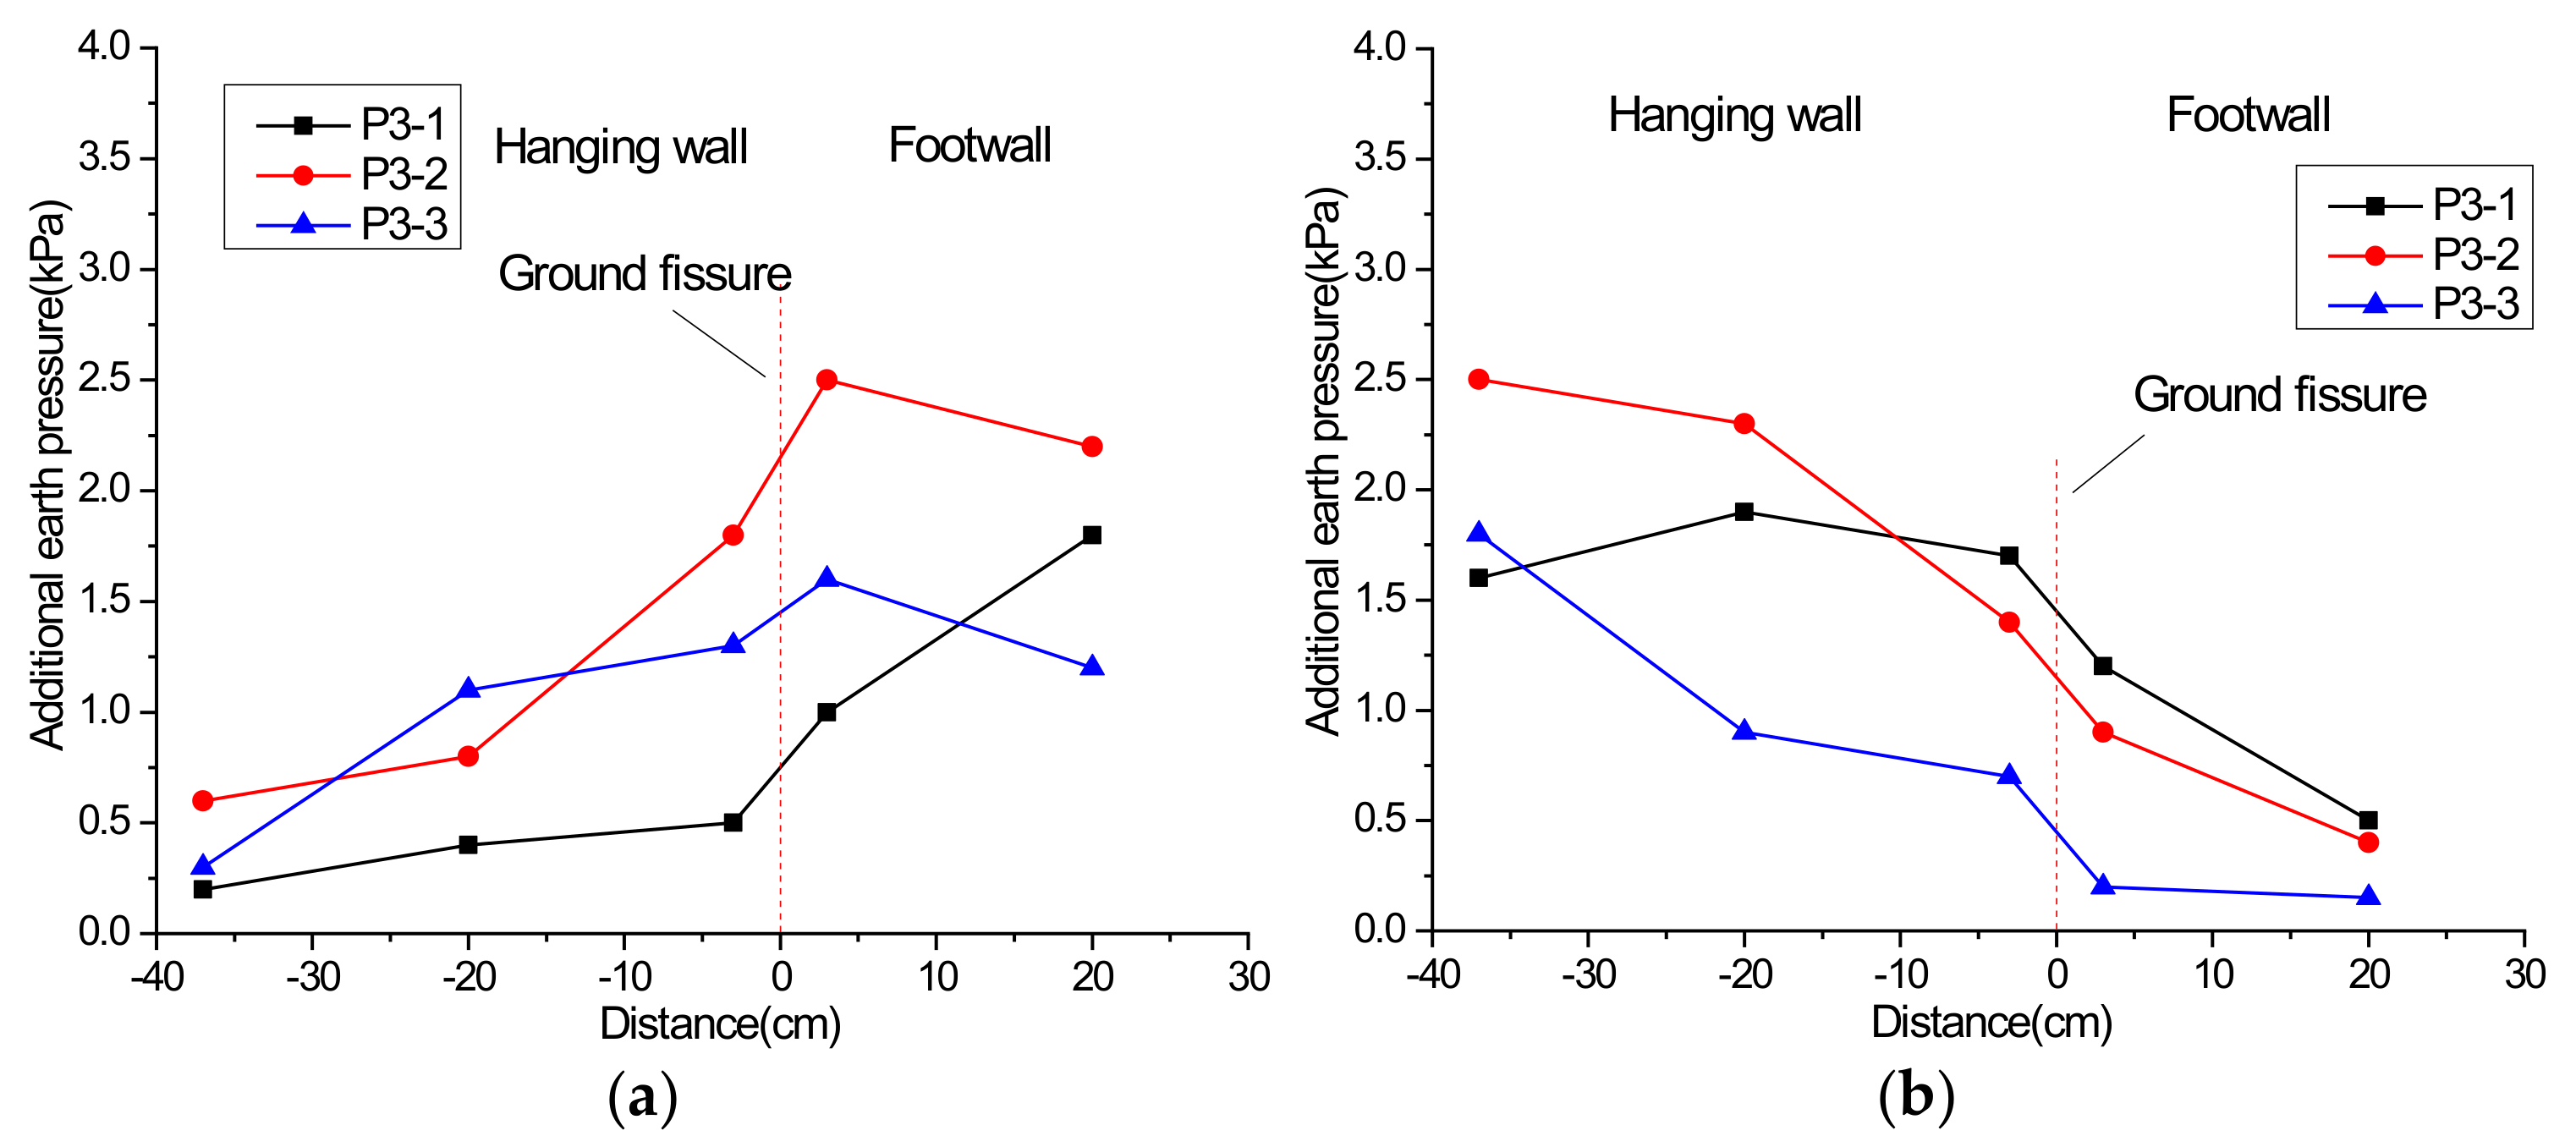
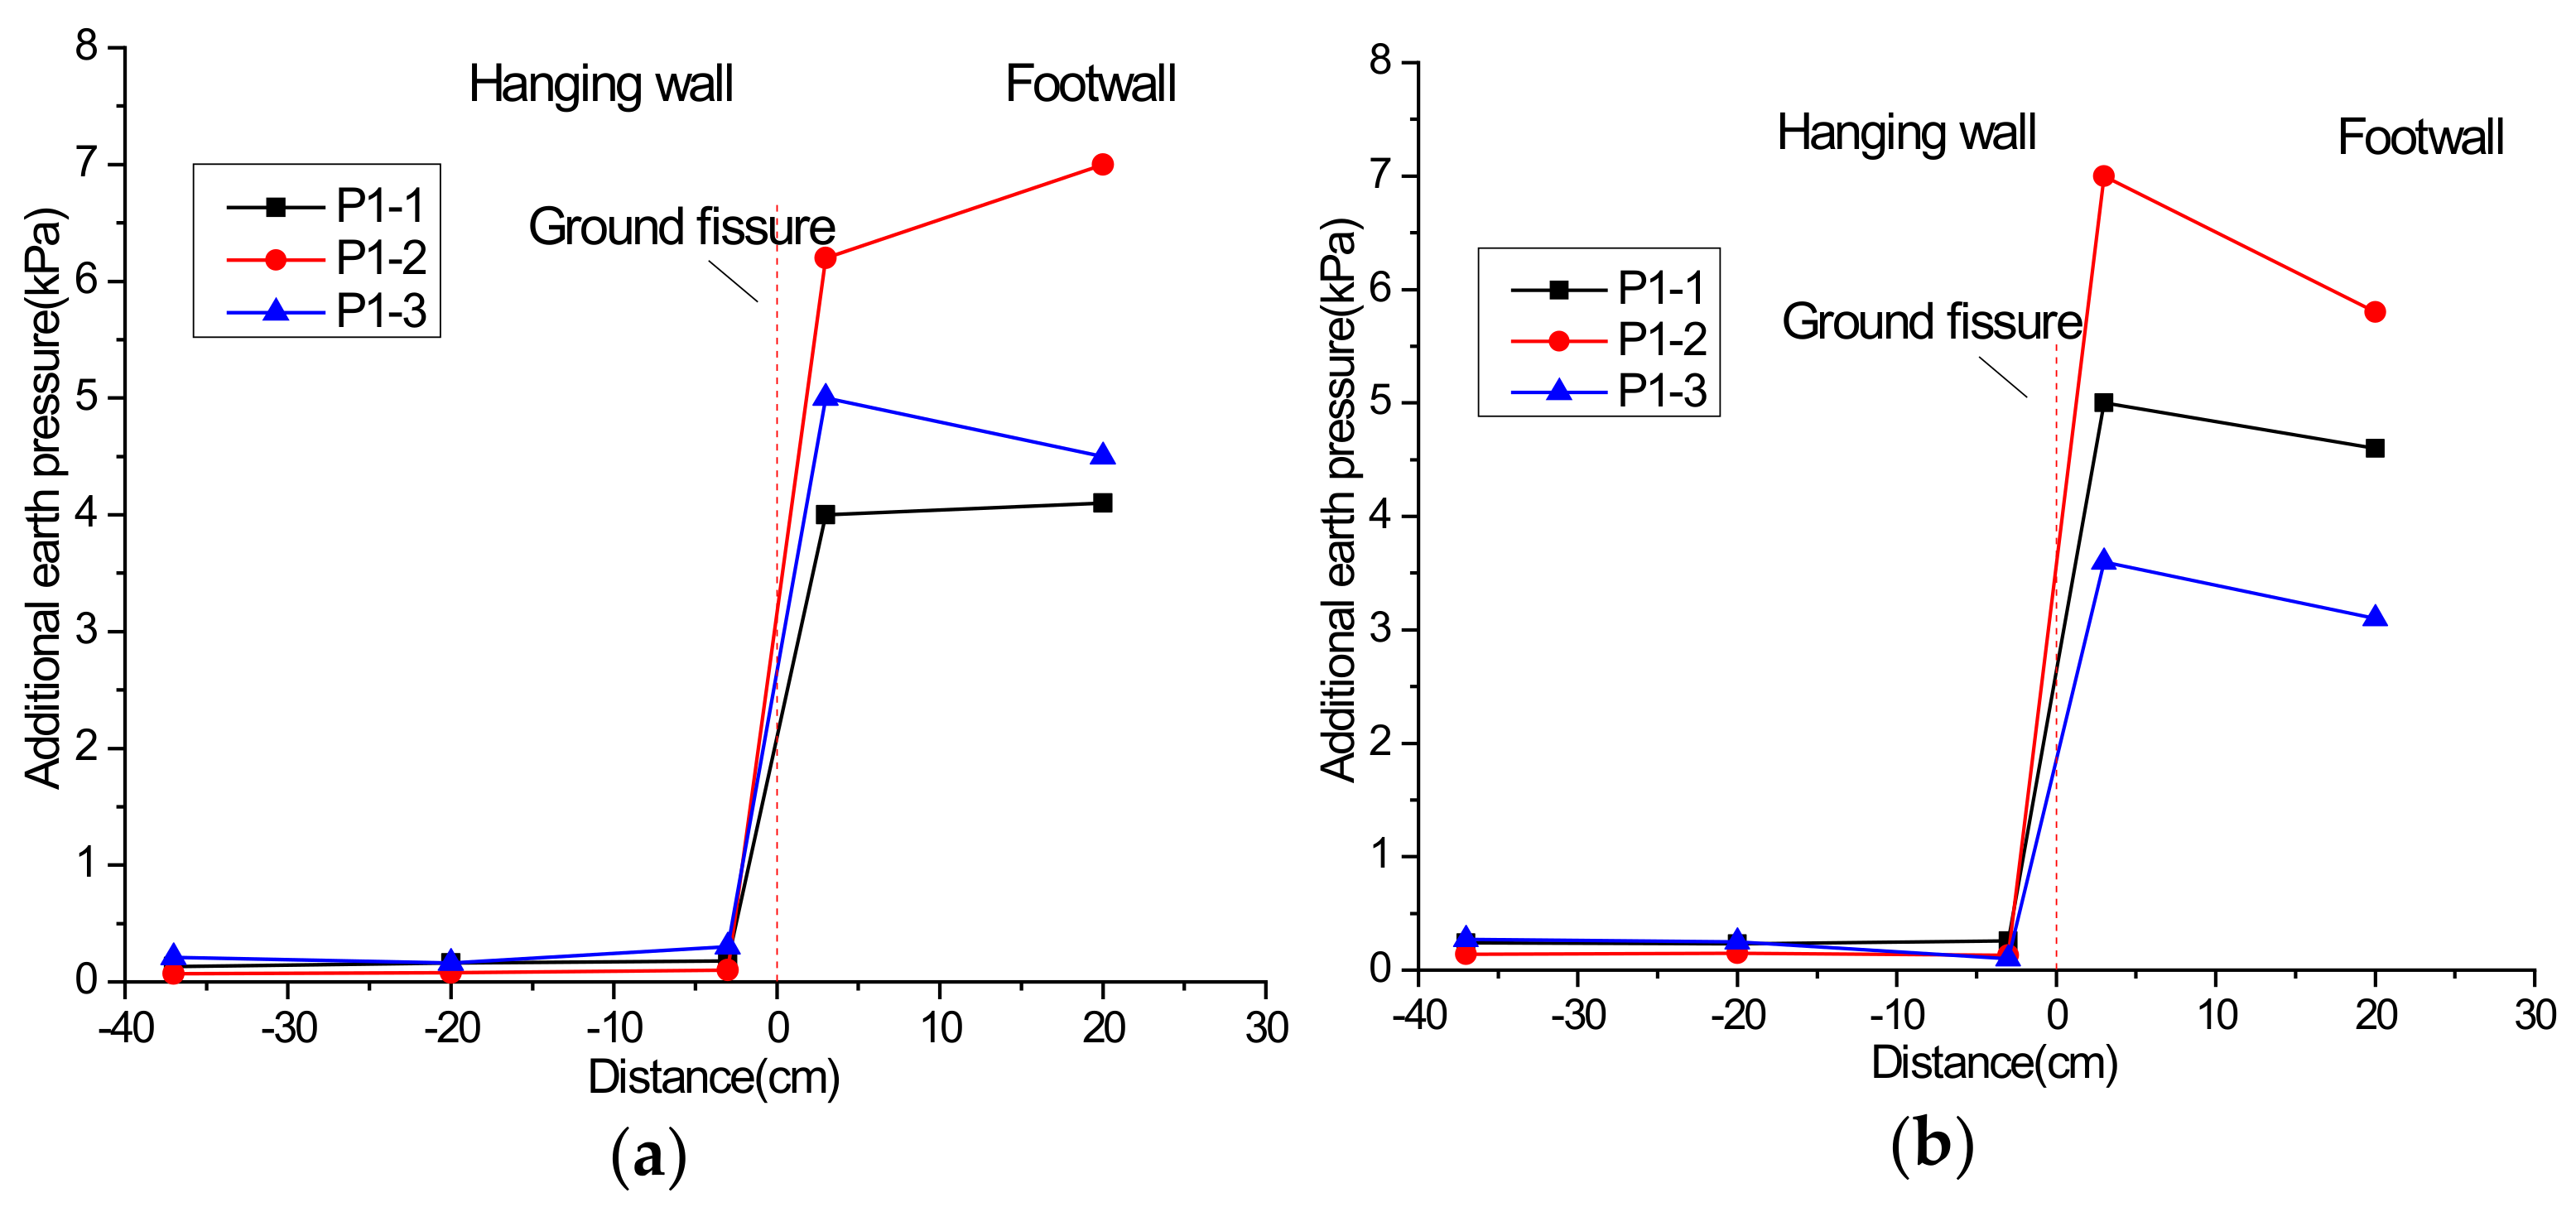
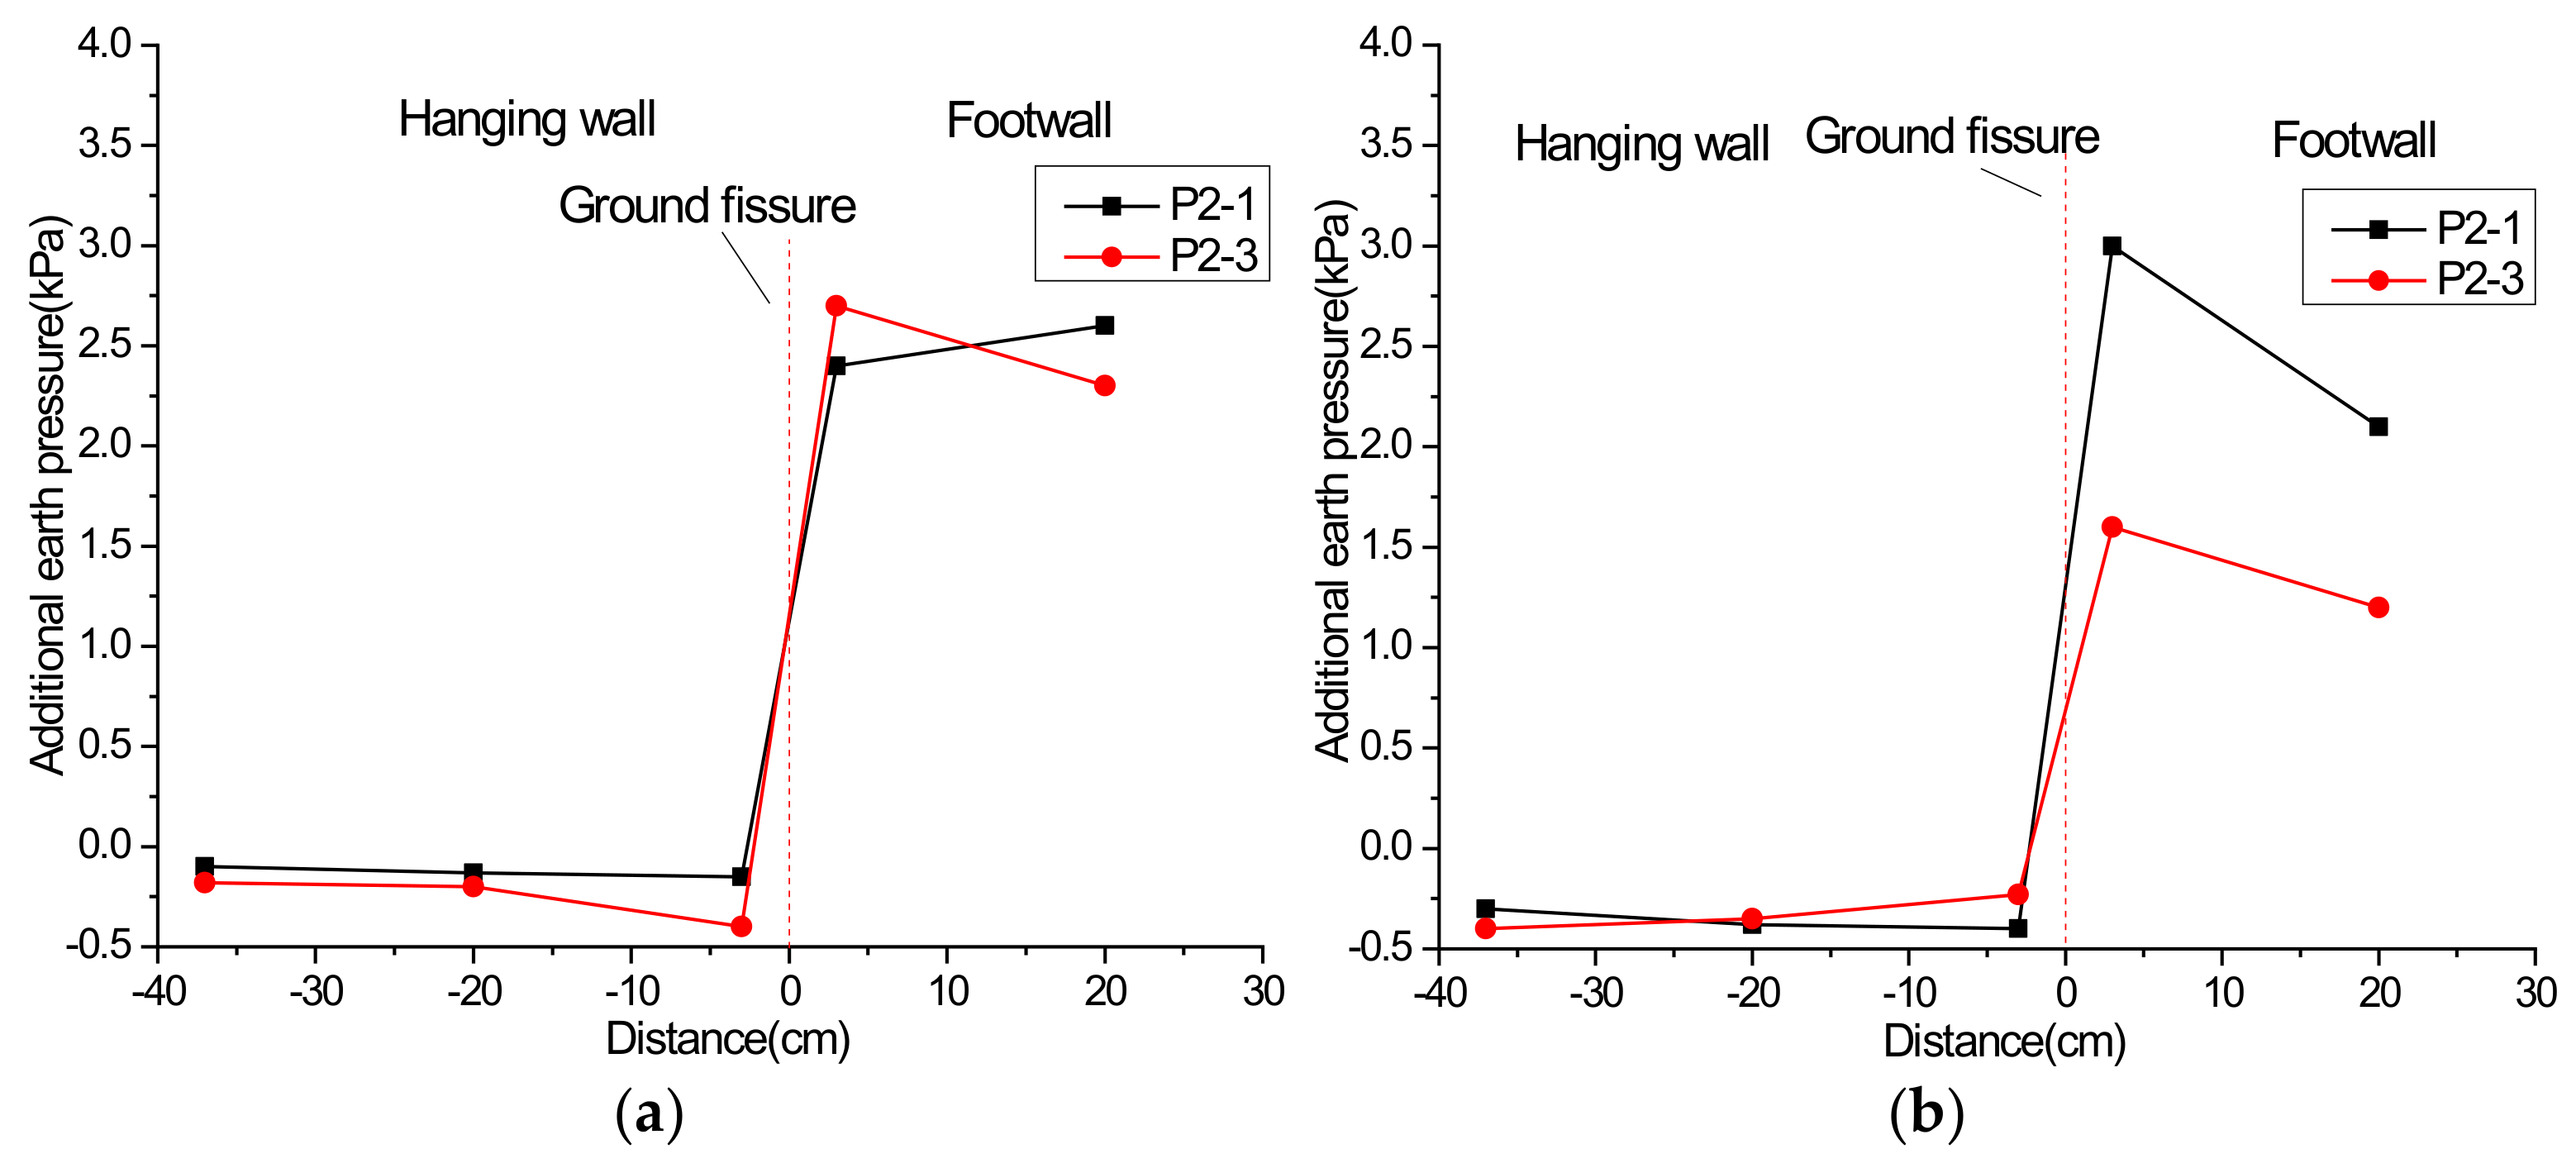
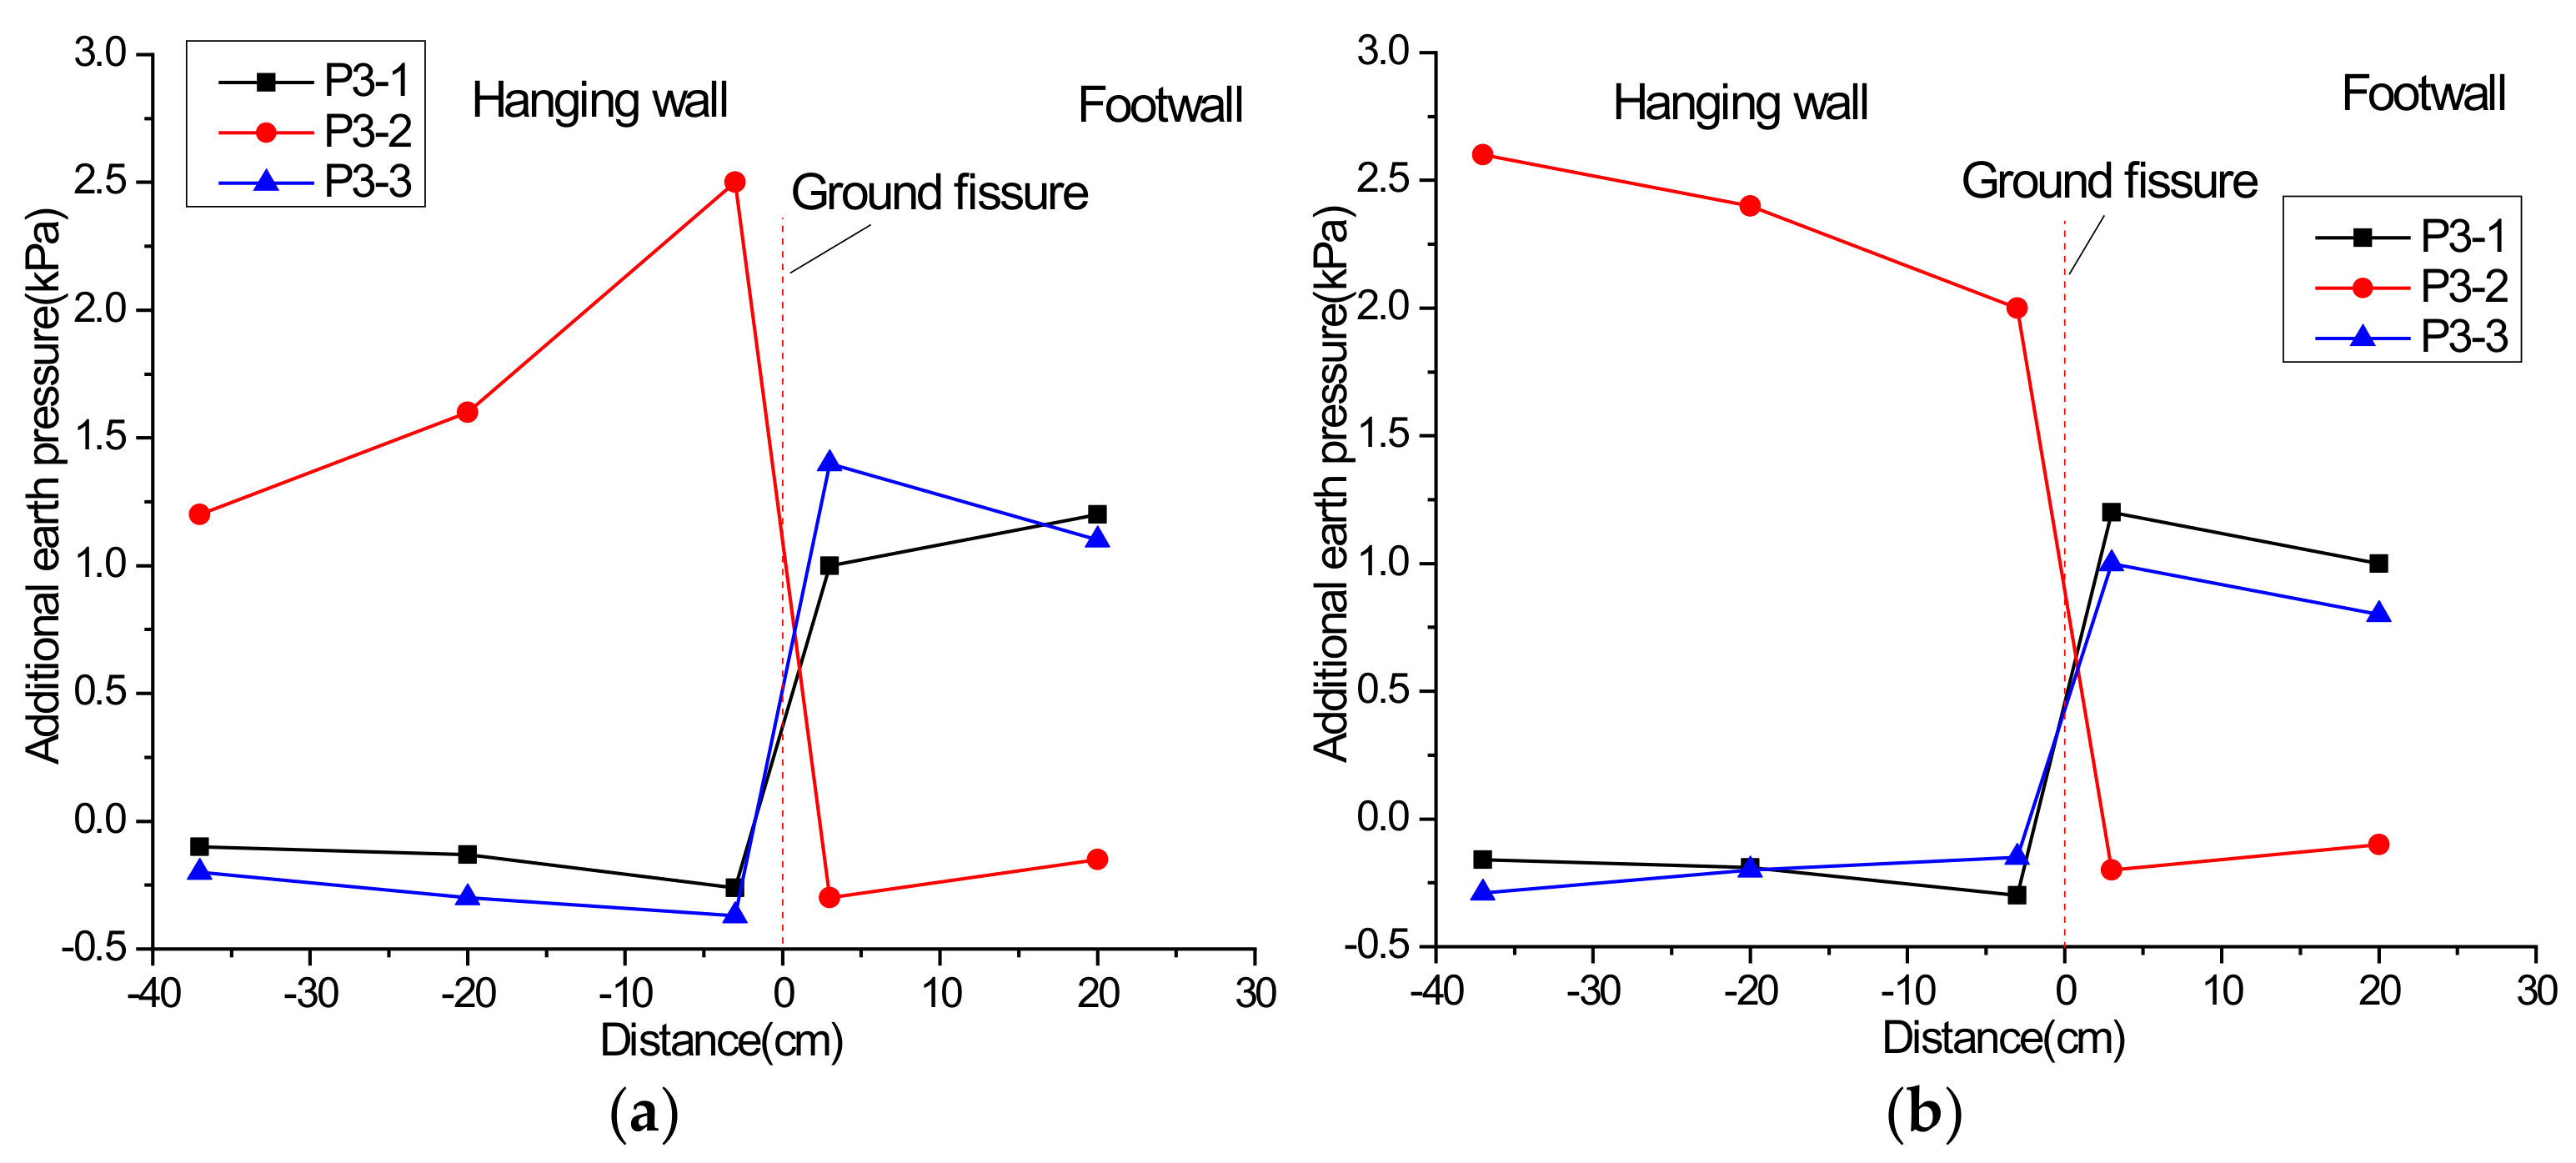
3.2. Dynamic Response of Earth Pressure

Figure 16, Figure 17 and Figure 18 show the additional earth pressure at different depths under the 10 Hz excitation. Here, the additional earth pressure implies the difference in earth pressure before and after the application of the excitation load. Positive earth pressure is observed in all the survey lines when the ground fissure is inactive, and the earth pressure increases with the embedded depth. According to the test results, the main reasons for such a phenomenon can be deduced as: (1) the static earth pressure increases with the buried depth and (2) the distance of the three layers (from bottom to top) to the vibration exciter increases in sequence, and, thus, the impact of vibration decreases in sequence. Furthermore, in the longitudinal direction of the tunnel, the additional earth pressure on the same side as the vibration exciter is greater than that on the other side as the earth pressure significantly decreases when crossing the ground fissure, while the maximum additional earth pressure in the vertical direction is identified near the tunnel axis.
Figure 19, Figure 20 and Figure 21 depict the additional earth pressure at different depths due to the descending of the ground fissure hanging wall (1 cm). The additional earth pressure at the height of 15 cm (10 cm below the tunnel) in the hanging wall is basically 0 because of the generated voids between the tunnel and the underlying soil. The additional earth pressure in the footwall increases compared with the condition of the inactive ground fissure, and the largest additional earth pressure is identified at the axis of the tunnel. This phenomenon is caused by the compaction between the tunnel (in the footwall) and the underlying soil under the action of vibration. Furthermore, when the working vibration exciter varies from 60 cm (in the footwall) to 100 cm (in the hanging wall), the additional earth pressure in the footwall is reduced because of the larger distance from the excitation point.
The test results of the two survey lines with a height of 50 cm show a huge difference in earth pressure between the hanging wall and footwall. Negative values are observed in the hanging wall, indicating the slight decreasing earth pressure caused by vibration in this region. Additionally, the additional earth pressure in the footwall shows a larger value, yet it decreases when the vibration exciter moves from the footwall to the hanging wall.
The test results of additional earth pressure at 85 cm (~12 cm above the tunnel) indicate a quite different variation from the upper two layers. The measured additional earth pressure at survey line P3-2 shows a positive value in the hanging wall while showing a negative value in the footwall. It is due to the fact that when the active ground fissure descends from the original place, the tunnel in the hanging wall compacts the upper soil and the footwall tunnel voids from the upper soil. This phenomenon is further exacerbated by the vibration load. Moreover, the additional earth pressure at the P3-1 and P3-3 survey lines (at the two sides of the tunnel) highly agrees with that of the soil at 15 cm and 50 cm height from the model bottom. The additional earth pressure is relatively small in this region because of the shallow buried depth and weak vibration impact.

3.3. Dynamic Response of Tunnel Contact Pressure

The circumferential additional contact pressure of the tunnel is presented in Figure 22. When the hanging wall stays in place, the tunnel bottom shows a relative larger contact pressure compared with the tunnel crown, while the minimum additional contact pressure is identified on both sides of the tunnel. Furthermore, a relatively larger additional contact pressure is also identified at the place on the same side as the vibration exciter.
Further investigating shows the variation in circumferential additional contact pressure when the hanging wall of the ground fissure descends. The additional contact pressure at the tunnel crown slightly increases in such a scenario, while that at the tunnel bottom greatly decreases, even to a negative value. Among the scenarios, the huge decrease in the additional contact pressure is identified when the vibration exciter at 100 cm works. Furthermore, an increase in the additional contact pressure at the tunnel bottom and a decrease at the tunnel crown in the footwall is observed, and the maximum variation is reached when the vibration exciter at 100 and 60 cm works, respectively, for the two places. Notably, the descent of the hanging wall shows insignificant impact to the contact pressure on both sides of the tunnel.

3.4. Dynamic Response of Tunnel Strain

Figure 23 and Figure 24 show the maximum longitudinal additional strain at the crown and bottom of the tunnel under the 10 Hz excitation from 60 and 100 cm. Results show a neglected additional strain at the tunnel crown when the ground fissure stays in place (nearly 0), as shown in Figure 23. Moreover, after the hanging wall of the ground fissure descends from the original place, a negative additional strain develop at the tunnel crown in the hanging wall (compression), while a slight positive additional strain is identified at the tunnel crown in the footwall (tension). This is due to the existence of the tunnel section. The downward force of the soil only affects the local region that is near the ground fissure, and, thus, causes a relatively low additional strain. Test results at the tunnel bottom (Figure 24) show that the excitation-induced additional strain at the tunnel bottom is quite small when the hanging wall of ground fissure stays in place. When the hanging wall of the ground fissure descends from the original place, a positive additional strain is generated at the tunnel bottom in the hanging wall, and a small strain is measured at the tunnel bottom in the footwall.

4. Conclusions

In this study, a physical model test is performed to investigate the dynamic interaction between the ground fissure and an oblique two-section horseshoe-shaped subway tunnel under the subway dynamic load. The main conclusions are drawn as follows:
(1)
The vibration-induced soil acceleration attenuates when crossing the ground fissure and the degree of attenuation has nothing to do with the propagation direction (from one side of the ground fissure to the other side). Nevertheless, for the scenario that the hanging wall of the ground fissure descends from the original place, a more significant attenuation is observed when the vibration propagates from the footwall to the hanging wall, while the enhancement phenomenon is observed with an opposite propagation direction;
(2)
The vibration near the ground fissure is stronger in the soil layer below the tunnel than that of the upper soil layer. The rapid attenuation of vibration intensity is identified when the vibration propagates from the lining to the lower and the upper stratum;
(3)
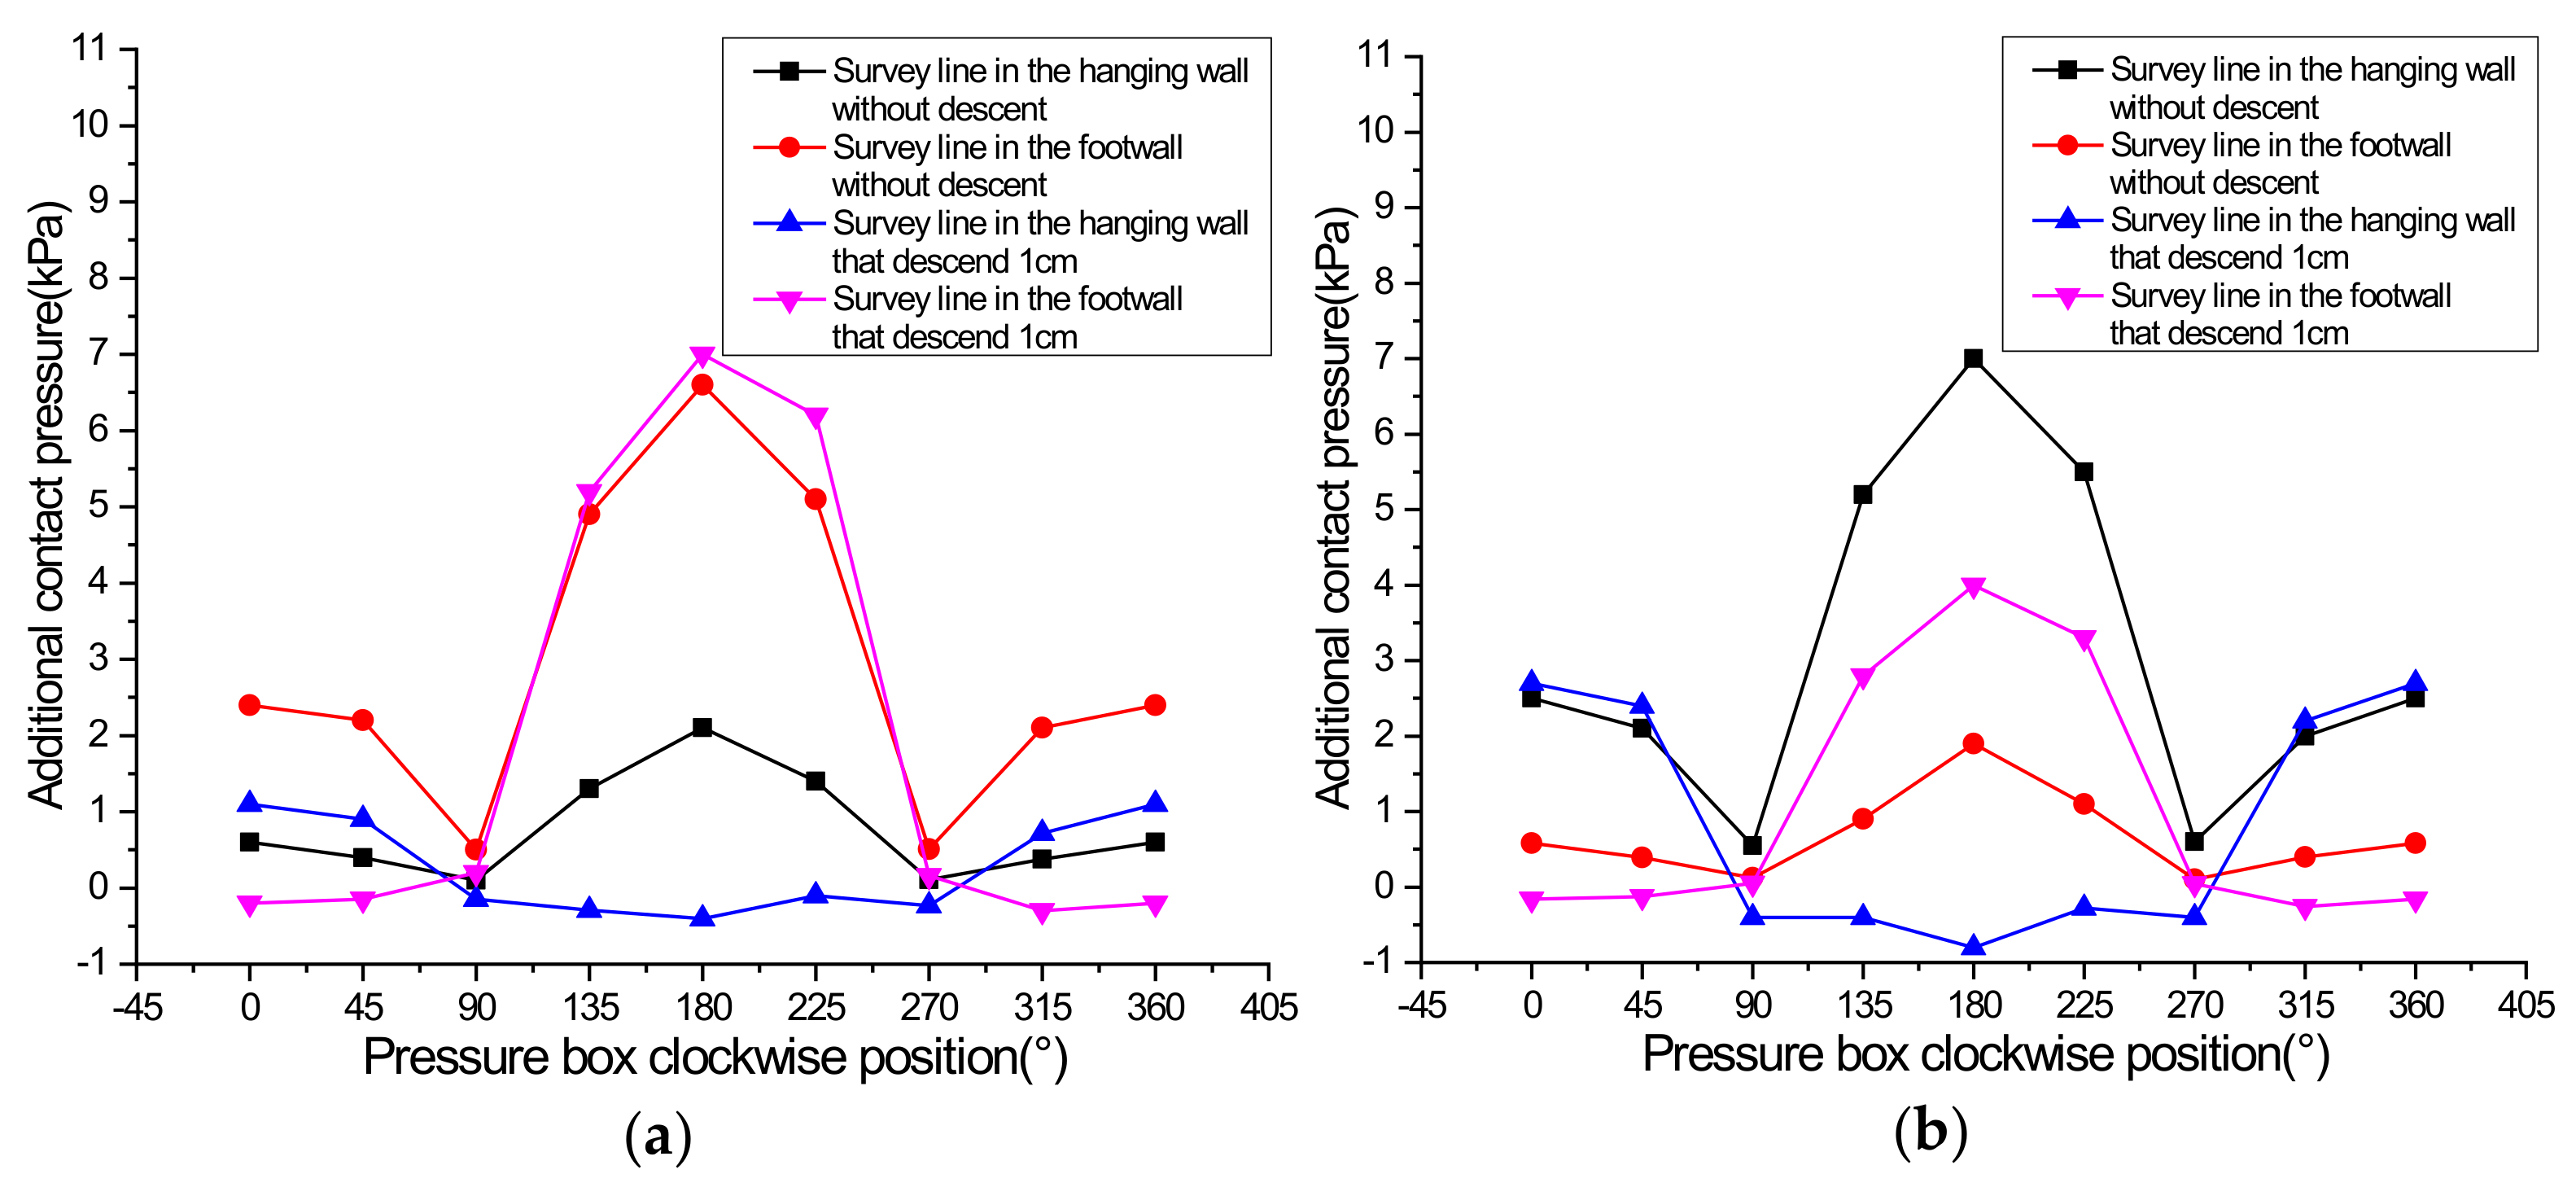
The additional contact pressure at the tunnel bottom is relatively larger than that at the tunnel crown when the hanging wall of the ground fissure does not move, and the minimum value is identified on both sides of the tunnel. A relatively larger additional contact pressure is also identified at the place on the same side as the vibration exciter. Additionally, when the hanging wall moves downward, an increase in additional contact pressure is observed at the tunnel crown in the hanging wall, while that at the tunnel bottom significantly decreases to a negative value. The additional contact pressure at the tunnel bottom in the footwall increases in such a condition, and that at the tunnel crown nearly decreases to zero. Notably, the additional contact pressure at the tunnel bottom decreases with the movement of vibration exciter from the footwall to the hanging wall, and the movement of the ground fissure has little effect on the additional contact pressure on both sides of the tunnel;
(4)
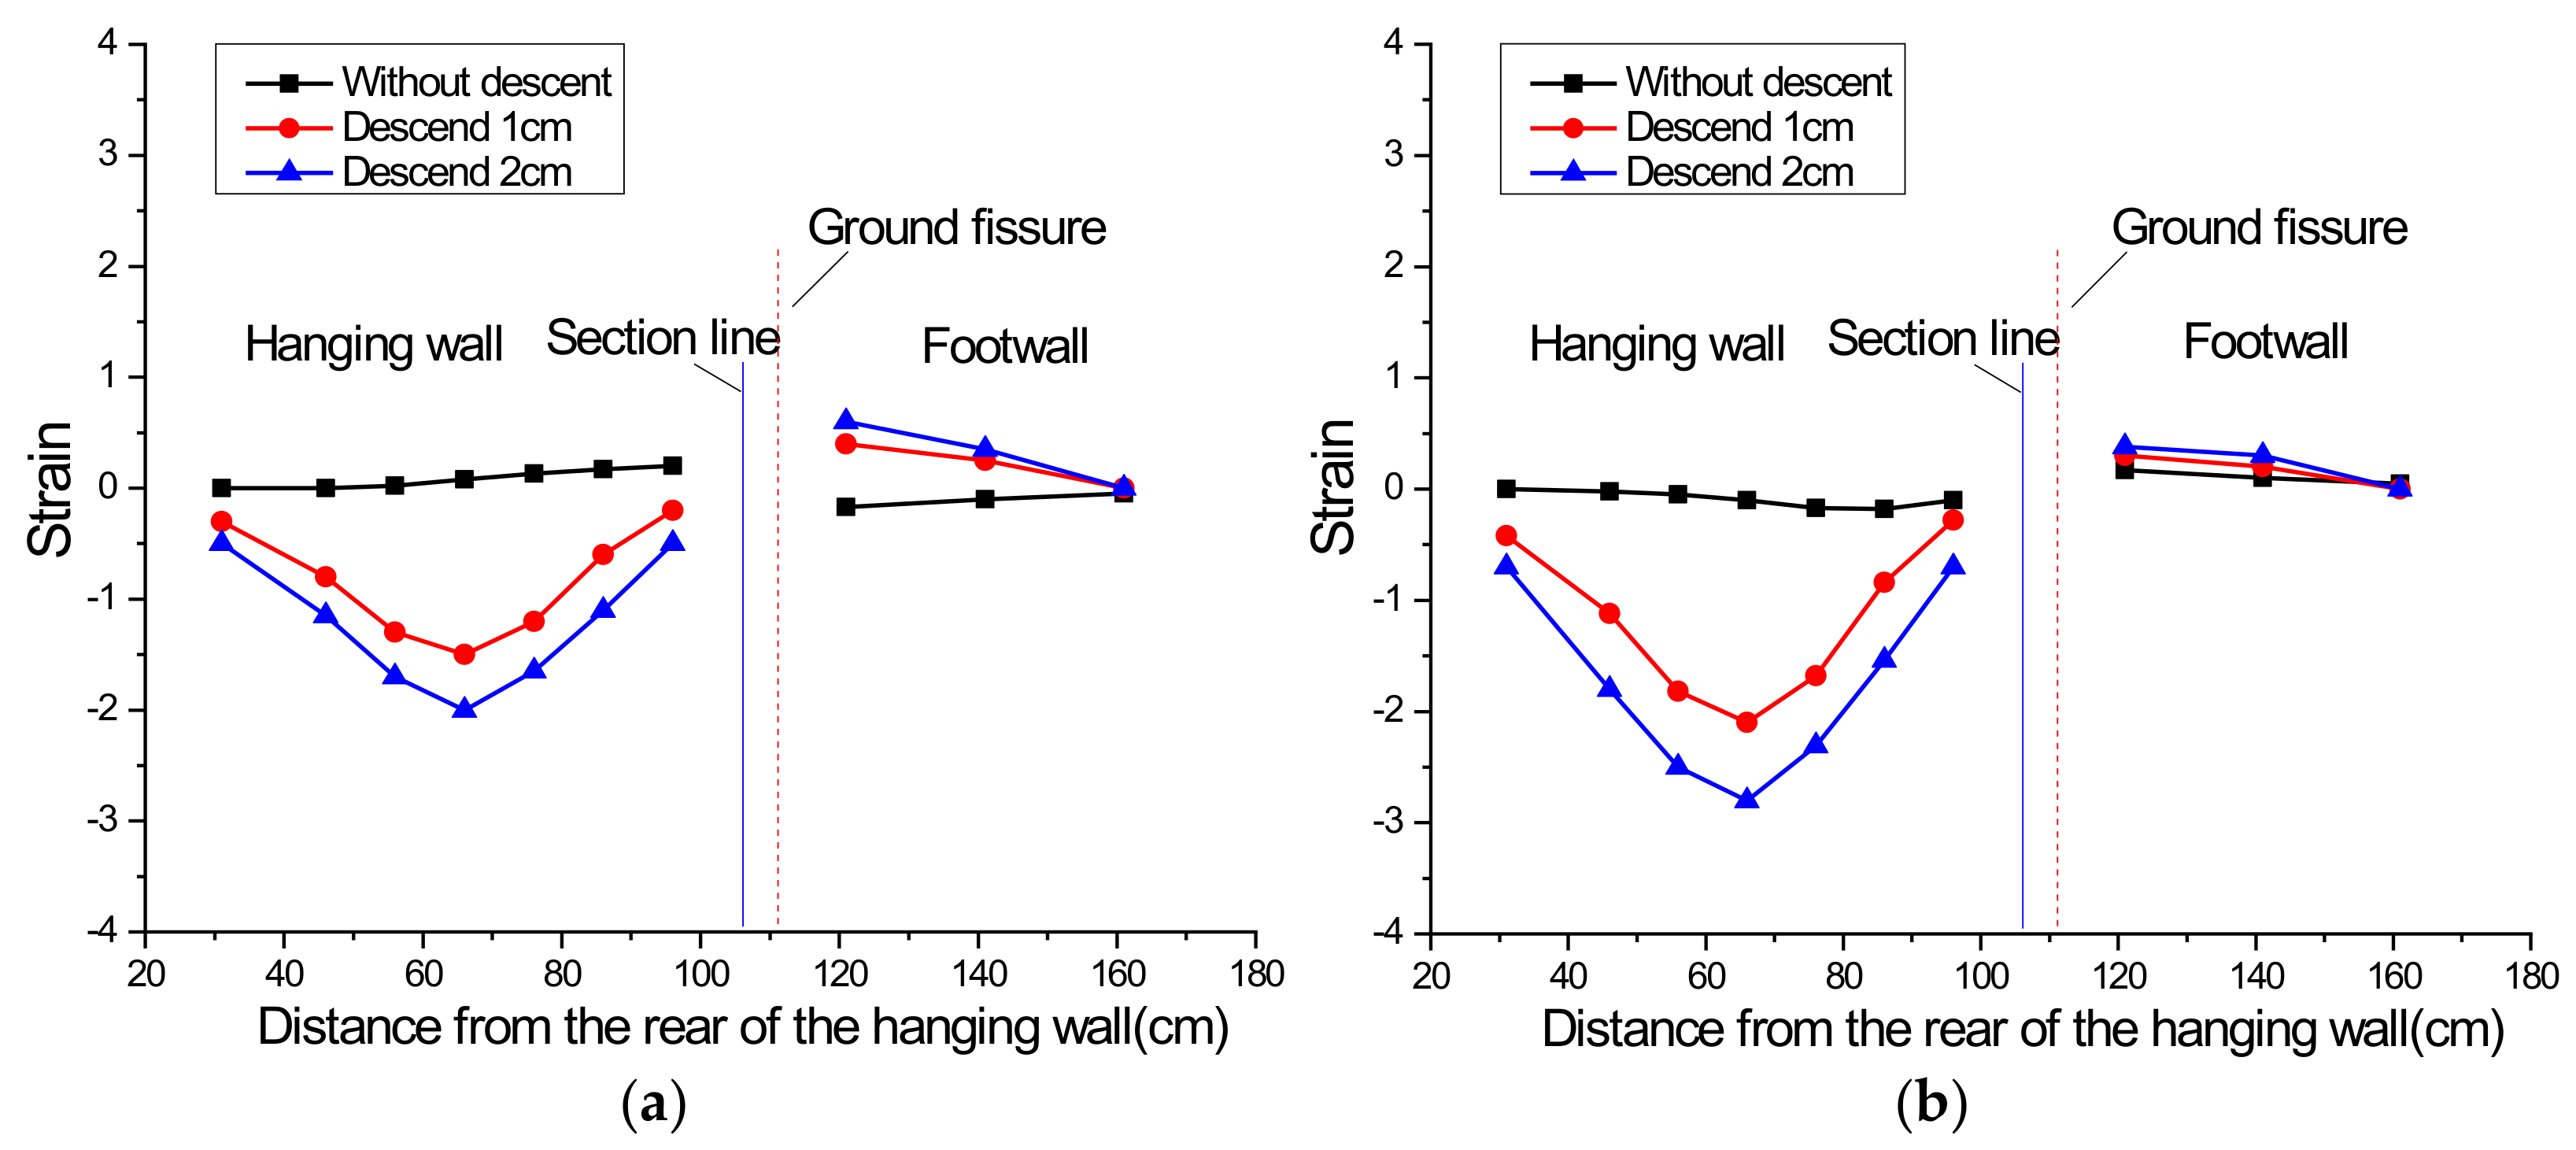
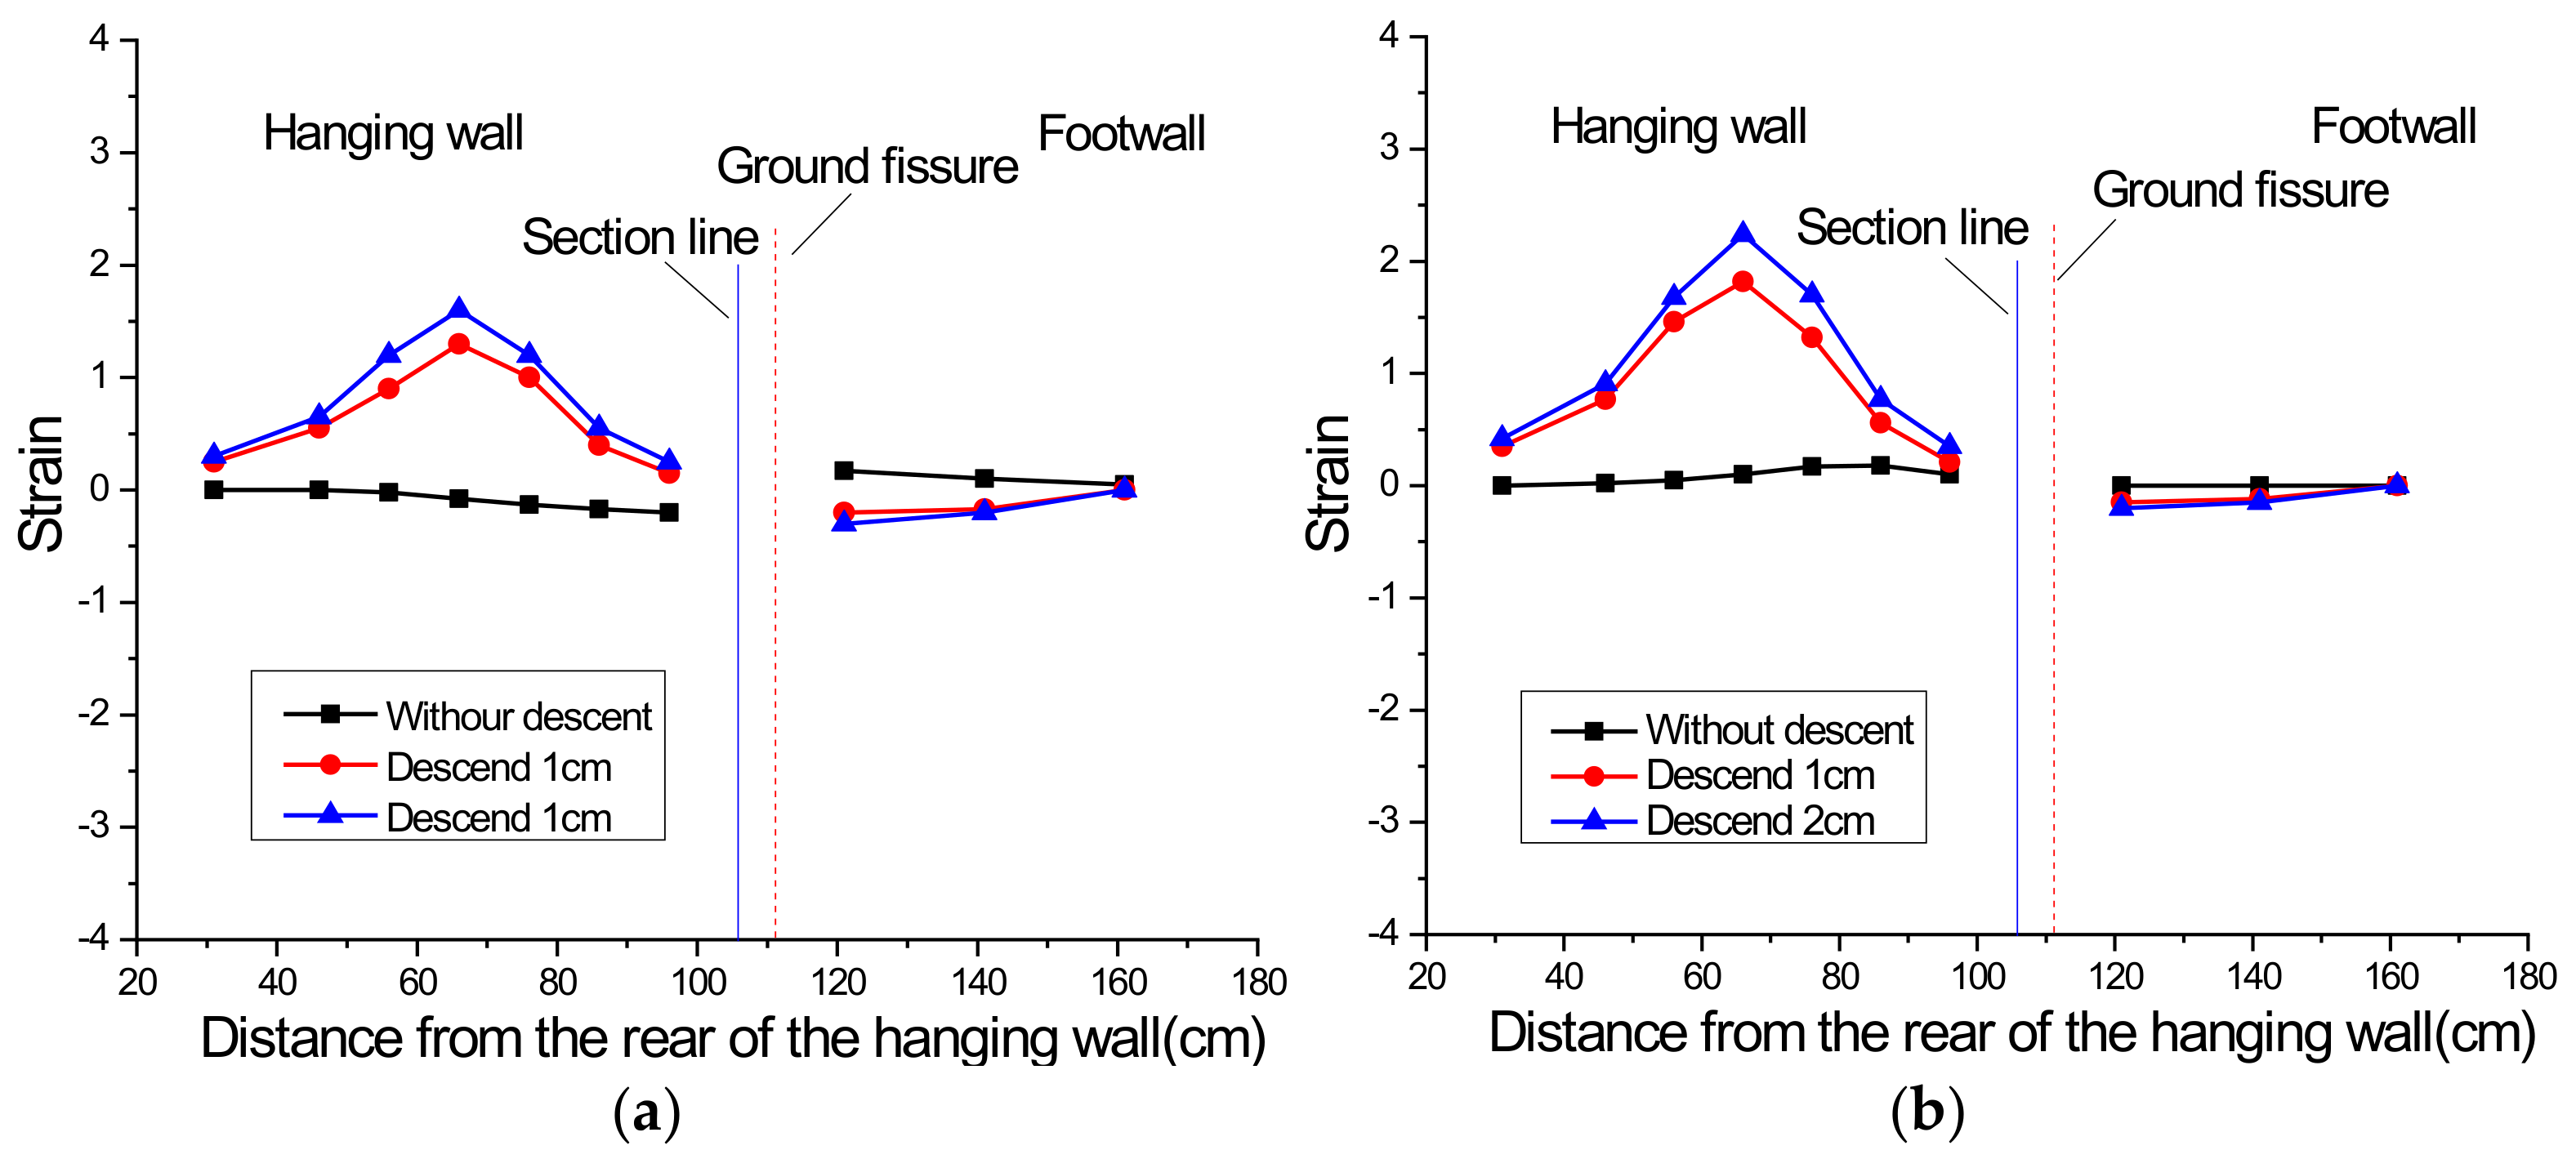
The excitation-induced additional strain at the crown and bottom of the tunnel are approximately zero with a condition of an inactive ground fissure. When the hanging wall of the ground fissure descends from the original place, negative and positive additional strain is identified at the crown and bottom of the tunnel in the hanging wall, respectively, implying a compression state. Meanwhile, positive and negative additional strain is observed at the crown and bottom of tunnel in the footwall, respectively, implying a tensile state.

Author Contributions

Funding acquisition, J.-K.Y.; Investigation, Z.-H.W.; Methodology, T.M.; Writing—original draft, L.L. All authors have read and agreed to the published version of the manuscript.

Funding

The authors would like to give sincere thanks to the funding agencies that supported this research. This work was supported by China Geological Survey Project (Grant nos. DD20211314).

Institutional Review Board Statement

Not applicable.

Informed Consent Statement

Not applicable.

Data Availability Statement

Not applicable.

Conflicts of Interest

The authors declare no conflict of interest.

References

  1. Pan, C.S.; Xie, Z.G. Measurement and analysis of vibrations caused by passing trains in subway running tunnel. China Civ. Eng. J. 1990, 23, 21–28. (In Chinese) [Google Scholar]
  2. Zhang, Y.E.; Bai, B.H. The method of identifying train vibration load acting on subway tunnel structure. J. Vib. Shock 2000, 19, 68–70. [Google Scholar]
  3. Liu, W.F.; Liu, W.N.; Degrande, G. Experimental validation of a numerical model for prediction of metro train-induced ground-surface vibration. J. Vib. Eng. 2010, 23, 373–379. (In Chinese) [Google Scholar]
  4. Mo, H.H.; Deng, F.H.; Wang, J.H. Analysis of dynamic responses of shield tunnel during metro operation. Chin. J. Rock Mech. Eng. 2006, 25, 3507–3512. [Google Scholar]
  5. Tang, Y.Q.; Wang, Y.L.; Huang, Y.; Huang, Y.; Wang, Y.; Zhou, N. Dynamic Strength and Dynamic Stress-strain Relation of Silt Soil under Traffic Loading. J. Tongji Univ. 2004, 32, 701–704. (In Chinese) [Google Scholar]
  6. Bian, X.; Hong, Z.S.; Ding, J.W. Evaluating the effect of soil structure on the ground response during shield tunnelling in Shanghai soft clay. Tunn. Undergr. Space Technol. 2016, 58, 120–132. [Google Scholar] [CrossRef]
  7. Xiong, L.X.; Li, T.B.; Liu, Y. Numerical Simulation of Seismic Response at the Entrance of the Unsymmetrical Loading Tunnel. J. Geomech. 2007, 13, 255–260. (In Chinese) [Google Scholar]
  8. Li, J.S.; Peng, H.; Cui, W.; Ma, X.M.; Yang, S.X.; Liao, J.S. Results of Rock Stress Measurements and Engineering Application of a Railway Tunnel in Northwestern Yunnan. J. Geomech. 2005, 11, 135–144. (In Chinese) [Google Scholar]
  9. Hussein, D.H. A power flow method for evaluating vibration from underground railways. J. Sound Vib. 2006, 293, 667–679. [Google Scholar] [CrossRef]
  10. Forrest, J.A.; Hunt, H.E.M. A three dimentional tunnel model for calculation of train induced ground vibration. J. Sound Vib. 2006, 294, 678–705. [Google Scholar] [CrossRef]
  11. Bian, X.; Zeng, L.L.; Li, X.Z.; Shi, X.S.; Zhou, S.M.; Li, F.Q. Fabric changes induced by super-absorbent polymer on cement and lime stabilized excavated clayey soil. J. Rock Mech. Geotech. Eng. 2021, 13, 1124–1135. [Google Scholar] [CrossRef]
  12. Nejati, H.R.; Ahmadi, M.; Hashemolhossein, H. Numerical analysis of ground surface vibration induced by under-ground train movement. Tunn. Undergr. Space Technol. 2012, 29, 1–9. [Google Scholar] [CrossRef]
  13. Bian, X.; Zeng, L.L.; Li, X.Z.; Hong, J.T. Deformation modulus of reconstituted and naturally sedimented clays. Eng. Geol. 2021, 295, 106450. [Google Scholar] [CrossRef]
  14. Yuan, L.Q.; Men, Y.M.; Liu, H.J.; Liu, L. A Numerical Simulation of Interactions between Ground Fissures and Xi’an Metro Tunnel. J. Catastrophology 2013, 28, 11–13. (In Chinese) [Google Scholar]
  15. Yuan, L.Q.; Men, Y.M.; Liu, N.N. The Dynamic Response Simulation Analysis of U-shaped Metro Tunnel Orthogonal with the Ground Fissure. J. Disaster Prev. Mitig. Eng. 2015, 35, 354–358. (In Chinese) [Google Scholar]
  16. Yang, M.; Men, Y.M.; Yuan, L.Q.; Yang, L.W. Numerical Analysis of Subway Vibration Responses for Different Tunnel Types in Ground Fissure Areas. J. Disaster Prev. Mitig. Eng. 2016, 36, 188–195. (In Chinese) [Google Scholar]
  17. Yang, M.; Men, Y.M.; Cao, R. Numerical Analysis of Stress in Soil due to Subway Moving Loads in Ground Fissure Area. Chin. J. Undergr. Space Eng. 2016, 12, 1545–1552. (In Chinese) [Google Scholar]
  18. Yang, L.; Yang, M.; Men, Y. Model Teston Dynamic Interaction among Ground Fissure, Tunnel, and Surrounding Rock. China Earthq. Eng. J. 2019, 41, 710–716. (In Chinese) [Google Scholar]
  19. Yang, J.J. Similarity Theory and Construction Model Experiment; Wuhan University of Technology Press: Wuhan, China, 2005. (In Chinese) [Google Scholar]
  20. Bian, X.; Zeng, L.L.; Ji, F.; Xie, M. Plasticity role in strength behaviour of cement-phosphogypsum stabilized soils. J. Rock Mech. Geotech. Eng. 2022, 14, 1343–1670. [Google Scholar] [CrossRef]
  21. Zhao, S.K. The Study on the Micro-structure Distortion Mechanics of Soft Clay under the Subway-Included Loading. Ph.D. Thesis, Tongji University, Shanghai, China, 2006. (In Chinese). [Google Scholar]
  22. Bian, X.; Zhang, W.; Li, X.Z.; Shi, X.S.; Deng, Y.F.; Peng, J. Changes in strength, hydraulic conductivity and microstructure of superabsorbent polymer stabilized soil subjected to wetting-drying cycles. Acta Geotech. 2022, 1–12. [Google Scholar] [CrossRef]
  23. Engineering Design and Research Institute of Chang’an University. Detailed Investigation Report on Ground Cracks along Xi’an Urban Rapid Rail Transit Line 2; Engineering Design and Research Institute of Chang’an University: Xi’an, China, 2007. (In Chinese) [Google Scholar]
Figure 1. Test model (unit: cm): (a) schematic diagram of test model; (b) profile of the test model.
Applsci 12 10472 g001
Figure 2. Schematic diagram of the model box: (a) front view of the model box; (b) side view of the model box.
Applsci 12 10472 g002
Figure 3. Schematic diagram of the bottom plate (unit: mm): (a) design of the bottom plate; (b) view of the spliced bottom plate.
Applsci 12 10472 g003
Figure 4. Section diagram of tunnel model (unit: cm).
Applsci 12 10472 g004
Figure 5. Layout of vibration exciters and accelerometers (unit: cm).
Applsci 12 10472 g005
Figure 6. Layout of pressure cells in the soil (unit: cm): (a) elevation view of pressure cells layout; (b) top view of pressure cells layout at the height of 15 cm; (c) top view of pressure cells layout at the height of 50 cm; (d) top view of pressure cells layout at the height of 85 cm.
Applsci 12 10472 g006
Figure 7. Layout of pressure cells and strain gauges on the subway tunnel (unit: cm).
Applsci 12 10472 g007
Figure 8. Acceleration time series of the two-section subway tunnel under the scenario of inactive ground fissure: (a) vibration exciter at 60 cm; (b) vibration exciter at 100 cm.
Applsci 12 10472 g008aApplsci 12 10472 g008b
Figure 9. Peak acceleration curves under the scenario of inactive ground fissure: (a) vibration exciter at 60 cm; (b) vibration exciter at 100 cm.
Applsci 12 10472 g009
Figure 10. Acceleration time series under the scenario of hanging wall descend 1 cm: (a) vibration exciter at 60 cm; (b) vibration exciter at 100 cm.
Applsci 12 10472 g010aApplsci 12 10472 g010b
Figure 11. Peak acceleration curves under the scenario of hanging wall descend 1 cm: (a) vibration exciter at 60 cm; (b) vibration exciter at 100 cm.
Applsci 12 10472 g011
Figure 12. Acceleration time series under the combined impact of inactive ground fissure and 10 Hz excitation: (a) vibration exciter at 60 cm; (b) vibration exciter at 100 cm.
Applsci 12 10472 g012
Figure 13. Peak acceleration curves under the combined impact of inactive ground fissure and 10 Hz excitation: (a) vibration exciter at 60 cm; (b) vibration exciter at 100 cm.
Applsci 12 10472 g013
Figure 14. Acceleration time series under the combined impact of hanging wall descending (1 cm) and 10 Hz excitation: (a) vibration exciter at 60 cm; (b) vibration exciter at 100 cm.
Applsci 12 10472 g014aApplsci 12 10472 g014b
Figure 15. Peak acceleration curves under the combined impact of hanging wall descending (1 cm) and 10 Hz excitation: (a) vibration exciter at 60 cm; (b) vibration exciter at 100 cm.
Applsci 12 10472 g015
Figure 16. Additional earth pressure at 15 cm height under the scenario of inactive ground fissure: (a) vibration exciter at 60 cm; (b) vibration exciter at 100 cm.
Applsci 12 10472 g016
Figure 17. Additional earth pressure at 50 cm height under the scenario of inactive ground fissure: (a) vibration exciter at 60 cm; (b) vibration exciter at 100 cm.
Applsci 12 10472 g017
Figure 18. Additional earth pressure at 85 cm height under the scenario of inactive ground fissure: (a) vibration exciter at 60 cm; (b) vibration exciter at 100 cm.
Applsci 12 10472 g018
Figure 19. Additional earth pressure at 15 cm height under the scenario of hanging wall descending (1 cm): (a) vibration exciter at 60 cm; (b) vibration exciter at 100 cm.
Applsci 12 10472 g019
Figure 20. Additional earth pressure at 50 cm height under the scenario of hanging wall descending (1 cm): (a) vibration exciter at 60 cm; (b) vibration exciter at 100 cm.
Applsci 12 10472 g020
Figure 21. Additional earth pressure at 85 cm height under the scenario of hanging wall descending (1 cm): (a) vibration exciter at 60 cm; (b) vibration exciter at 100 cm.
Applsci 12 10472 g021
Figure 22. Distribution of the circumferential additional contact pressure: (a) vibration exciter at 60 cm; (b) vibration exciter at 100 cm.
Applsci 12 10472 g022
Figure 23. Distribution of the maximum longitudinal additional strain at the tunnel crown: (a) vibration exciter at 60 cm; (b) vibration exciter at 100 cm.
Applsci 12 10472 g023
Figure 24. Distribution of the maximum longitudinal additional strain at the tunnel bottom: (a) vibration exciter at 60 cm; (b) vibration exciter at 100 cm.
Applsci 12 10472 g024
Table 1. Similitude ratio of the model test.
Parameter Scaling Factor
Tunnel StructureSoil Mass
GeometryLength l20
Area A400
Distance u20
Elastic modulus E1.5
Deformation modulus 20
MaterialStrain ε11
Stress σ1.520
Poisson’s ratio μ11
Density ρ11
Cohesion C 20
LoadConcentrated force F600
Surface load q1.5
Mass m8000
DynamicTime t16.9
Frequency ω0.06
Velocity v1.2
Acceleration a0.1
Publisher’s Note: MDPI stays neutral with regard to jurisdictional claims in published maps and institutional affiliations.

