1. Introduction
The ancient Egyptian Pharaonic civilization is considered one of the oldest and most prestigious civilizations on the earth, for 5000 years. There is no region in Egypt where one cannot find proof of this civilization and the story of Egypt’s role in most of the world’s historical events from the dawn of time to the current day. According to archaeologists and geoscientists, some of the world’s most important ancient sites are in jeopardy. Egyptian archaeological sites were established in dry environments as the ancient architects intended; for example, Abydos temple at Sohag, Karnak temple at Luxor, Hawara Pyramid in El-Fayoum, Pyramids and Sphinx in the Giza area, etc., are regarded as the most valuable archaeological sites in the world. Some of these sites subjected to climatic changes due to the affection of groundwater rising causing the weathering of these sites.
The rising of the groundwater levels or humidity causes significant damage to the monuments. The irrigation of crops and gardens near these monuments may affect the increase of the groundwater level and humidity. Humidity can build up in the wall gaps and freezes in the winter; in addition, it melts in the spring, causing damage to the mortar, and separating the internal and external layers, compromising the construction materials.
The study area is located within the Abydos archeological site west of El-Balyana town, Sohag Governorate, Egypt. It is a significant archaeological place in the low desert, in the southwestern portion of Sohag Province, approximately 15 km from to the Nile valley and 500 km south of Cairo (
Figure 1).
At the Abydos temple site, groundwater levels are rising in the winter season. As a result, we are frantically trying to figure out where the rising groundwater is coming from and to find the groundwater flow paths so that we can safeguard the Abydos temple from these hazards. Identifying the source of the groundwater rising that is causing the deterioration of archaeological sites can facilitate the creation of appropriate mitigation strategies and the direction of future study.
Many authors studied the problems of groundwater rising level at numerous Egyptian ancient sites [
1,
2,
3,
4,
5,
6,
7,
8]. On the other hand, authors in various nations outside of Egypt investigated the identical topic [
9,
10,
11]. Many scientists utilized a variety of geophysical and environmental approaches on the archaeological site of Abydos [
12,
13,
14,
15,
16,
17,
18,
19,
20,
21,
22,
23,
24,
25].
Unpublished reports were collected from many foreign and Egyptian archeological missions that worked at the Abydos site to study the archaeological history of and discover hidden remains at the site: (1) foreign missions, such as: (a) the American mission in 2004 and 2011 under the guidance of James S. Westerman; and (b) the Swiss mission Association of Friends of Cemeteries at the University of Basel from 2001 until 2010 under the leadership of Abt Siudor; and (2) Egyptian missions, such as: (a) the Egyptian mission between Sohag and Assiut universities in 2011–2015; and (b) a collaborative project between American archaeologist James Westerman and Egyptian Scientist Dr. Bahay Issawi in 1992.
The main goals of the current work are determining the subsurface succession and lithology; assessment of groundwater distribution and water table depth; and mapping any hidden subsurface paleochannels, which represent conduits for groundwater flow paths using 2D and 3D electrical resistivity tomography (ERT) to reduce the deterioration troubles of the stone foundations at the Abydos ancient site. All this information aids the decision-makers in pinpointing the real reasons of the groundwater level rise around the Osirion site as well as in developing long-term solutions to solve this problem.
The expected outcome of this study is advising the policymakers to use engineering safeguards, such as dams and partition walls, to prevent the groundwater from reaching crucial ancient monuments. They should also monitor and control groundwater level changes near archaeological foundations by taking all the required measurements to prevent soil subsidence and foundation collapse, and establishing a network of dewatering systems.
Electrical resistivity tomography (ERT) is one of the primary methods that is frequently employed in hydro-geophysical investigation and groundwater monitoring. Vertical and horizontal changes in the resistivity values indicate the change in the subsurface lithology and its containing groundwater. This method is preferred to be used in archaeological sites due to the difficulty of excavation, which has a destructive effect on the discovered and undiscovered antiquities. By development ERT for 2D and 3D profiles, the near surface geology and structure can be easily determined. This technique has proven its dependability in the identification of groundwater aquifers and their distributions.
2. Historical Archaeological Background
The archaeological site of Abydos is considered one of the most famous and adored Egyptian places, as it was one of the most important burial places for the ancient Egyptian pharaohs and the heart of the worship of the god of the dead, Osiris, because of the presence of temples for King Seti I and Ramses II [
15]. This site is also well-known for being home to archaeological remains from all eras of the ancient Egyptian religion. The Early Dynastic royal cemetery at Umm el-Qa’ab, located in the heart of the principal wadi in Abydos, is a highlight of the region [
26].
The Osirion is one of the greatest, most spectacular, and little-understood ancient Egyptian constructions. The Osirion, which is located below the temple of Seti I, is regarded to have been a significant structure for the Ancient Egyptians. Its massive masonry blocks form a rectangular stone island in the center, which is ringed by a water-filled waterway almost 13 m below the surrounding ground surface. Within the Osirion, the water level increases to a water head of 1–2 m (
Figure 2). The Pharaonic funeral ceremonies are thought to have occurred at the Osirion site. The dead corpses were cleaned by water during these ceremonies; thus, it was necessary for the water to reach the Osirion location. The Osirion temple was built in a unique way by an Egyptian architect. He used many construction materials, such as limestone, sandstone, granite, and wall murals that were painted with earthen pigments, including yellow ochre, red ochre, and carbon black, which were then mixed with a binder for stabilizing [
27].
The Osirion site was distorted by a combination of different factors, which collected to increase the severity of the damage surrounding the temple. The salinity of the water is the most crucial and harmful of all these factors. The production of insoluble and soluble salts, which have caused chemical and physical degradation to the temple stones of different kinds and porosity, is the most hazardous on the sequence of groundwater. The types and amounts of the soluble salts in the groundwater, as well as the type of stones, are all important factors in the formation and dispersion of salts on the stones. Furthermore, the hydration and crystallization pressures are important steps of masonry deterioration, as well as the alternation in salinity water levels between low and high, and the alternation between drying and wetting due to many aspects of weathering in temple stones [
28].
Figure 2 illustrates the deterioration of ancient symbols and colors on the stone surfaces, the breakdown of construction material, the crystallization of salts in foundation walls, the disintegration of stones, the loss of moral paintings, the bleeding of stones, and the destruction of wall paintings and texts at the Abydos archaeological site.
3. Geological Background
The area of investigation is a part of the Nile Valley plain that has been studied by a variety of authors [
8,
29,
30,
31]. Geologically, the Abydos site is mainly composed of Quaternary to Pliocene sediments that, uncomfortably, overlie the Early Tertiary Esna Shale [
8]. The Osirion site is situated 70 km south of Sohag governorate, on the west side of the Nile Valley, on the edge of the desert. The elevation of this site is 100 m above sea level, and it is bound by the limestone plateau from the western side with an average elevation of 300 m. The plateau follows an uneven path with numerous promontories and embayments.
Figure 3 illustrates the geology of the Sohag district, including the study area. The oldest exposed rocks are the green to grey shale, strongly fissile with gypsum veinlets, and found on the plateau’s slope. Only the top 25 to 30 m of the Esna Shale are visible in the study site. The top of the scarp and the plateau surface are formed by a thick hard limestone rock (Thebes formation). The limestone has an average thickness of 80 m and continues to thicken as it moves westward. Early Eocene formations include the Esna and Thebes formation. Quaternary sands and gravels cover the wadi surface, which becomes silty clay as one moves to the east, cutting the cultivated land. The Dandara formation, which comprises the first Ethiopian deposits carried by the Nile River from Ethiopia and Sudan, is the fluviatile fine sand–silt intercalation that covers the Osirion [
29]. Silt lenses are formed by another river as channel fill sediments, truncating the Qena sand formation at the Abydos site. The stream that deposited the Qena sands was perpendicular to the river with north–south direction. This silt reaches a maximum thickness of 3 m in the center of the lens; however, it decreases in both directions from the channel middle to the point (about 50 m on either side of the channel axis) when it eventually disappears [
8].
Geomorphologically, the limestone plateau is dissected by a group of wadis trending in the east–west direction and cutting the study area. Following these plateaus inwards, low desert terrain lands are encountered, followed by agricultural lands near the Nile River. Structurally, the limestone cliff surrounding the Abydos site is encircled by two main faults that trend NW–SE and NE–SW, generating a significant promontory. These promontories have a profound influence on the groundwater movement in the study area [
20].
4. Material and Methods
The authors collected the required maps of geomorphology, geology, and geophysics, in addition to the archaeological background and the information from the Egyptian Antiquities Authority, which could be used for this work. Published and unpublished reports from the local and foreign archaeological missions were also collected. The methodology of this work included the implementation of a near-surface geophysical approach, including an ERT survey employing pole–dipole electrode configuration using the ARES resistivity system. This method was applied on a regular grid to cover the investigation site. The findings of six boreholes drilled within and near the investigated site were also collected and correlated with the ERT findings. RES2DINV software packages, version 3.52 (Geotomo software) and Geosoft Oasis Montaj version 8.3 were used for processing, interpretation, and illustration of the results.
4.1. Electrical Resistivity Tomography (ERT)
ERT is a rapidly developing geophysical imaging approach that is now employed to examine the subsurface structures, lithological variations, identify the water-bearing formations, water table level, the pattern of groundwater flow, and aquifer water quality [
4,
33,
34,
35,
36,
37,
38,
39]. A pair of current electrodes is used to inject a direct current into the ground during the resistivity measurements, and a pair of potential electrodes is used to measure the potential difference between them. These measurements allow for the estimation of the real resistivity of the subsurface. The key advantages of the ERT are its easy use, low cost, non-invasive nature, and its ability to be illustrated as 2D and 3D subsurface models.
4.1.1. ERT Data Acquisition
Fourteen ERT profiles were surveyed to collect the resistivity data for the 2D sections in the study site (
Figure 4), utilizing the pole–dipole configuration with 2.5 m electrode spacing, to provide more in-depth information on the subsurface. The pole–dipole arrangement was chosen for this inquiry because it has a substantially greater signal to noise ratio [
40]. An automatic resistivity system (ARES GF instrument) was used to conduct this survey using a multielectrode cable for implementing the automatic resistivity measurements. A depth of around 21 m was achieved in this survey by the selected (a) and (n) spacing.
4.1.2. ERT Data Processing
RES2DINV packages, version 3.52 (Geotomo software) licensed to the Geology Department, Faculty of Science, Sohag University were used to analyze and interpret the acquired ERT data to filter out the bad and noisy field data, and create pseudo resistivity sections. The RES2DINV program was used to invert the data that was gathered along with the ERT profiles that were performed [
41]. The RES2DINV program is undertaken to create two-dimensional resistivity models of the subsurface. A 3D model of the subsurface was created by collecting all the 2D ERT profiles in one block representing the entire area.
5. Results and Discussion
5.1. Two-Dimensional Electrical Resistivity Tomography (2D-ERT)
Eleven profiles were surveyed around the Osirion, with a total length of 360 m; six of them (P1–P6) were performed in the direction of NW–SE, while the other five profiles (P7–P11) are in the direction of NE–SW, forming a mish-like shape. The remaining three profiles, (P12–P14) are trending NW–SE. P12, P13, and P14 have lengths of 360 m, 140 m, and 73 m respectively, based on the accessibility of the profile places (
Figure 4). The lithology and the thickness of the subsurface succession were determined in the 2D resistivity data; and the results were confirmed with the results of the available wells, which located on and near the surveyed profiles. Nine wells were available, with varying total depth from 63 to 103 m, and used for this purpose. Only two wells (W1 and W5) were used for comparison with the inverted ERT profiles because the well W1 is located directly on profile 10 and well W5 is very close to profile 1 (
Figure 4).
The interpretation of the 2D inverted resistivity profiles P1 and P10 after calibration, with the lithology were implemented. Using the conceptual knowledge from this calibration with well data, all the inverted resistivity profiles were interpreted (
Figure 5,
Figure 6,
Figure 7 and
Figure 8). The depths to the water table of wells W1 and W5 are shown in
Figure 5 and
Figure 7.
Following the careful inspection of the ERT profiles, four distinct geoelectrical zones with varying resistivity values were recognized as the following:
The first zone is characterized by high resistivity values (more than 2000 ohm.m), which are consistent with the surface wadi deposits at the site. This zone is mostly composed of gravel, sand, and silt deposits. The thickness of this zone varies progressively from 2.5 m to 18 m. In some locations, the resistivity values increase to be about 10,000 ohm.m, reflecting the presence of gravel deposits. This zone is recorded in most of the profiles except for profiles 13 and 14.
The second geoelectrical zone has moderate resistivity values ranging from 200 to 2000 ohm.m, which reflects a nature of medium sand deposits. It was constituted due to high currents suspended by the medium grain size of sands that invaded the gravels of the former zone, scouring it forming cuttings and remnants of medium sand.
The third geoelectric zone is characterized by low resistivity values (50 to 200 ohm.m). It was interpreted as muddy sand deposits. The formation of this zone is similar to the formation of the former zone. It was formed due to active currents suspended by muddy sand invading the wadi deposits zone, scouring it forming cuttings and remnants of muddy, sand-like roots within this zone. This zone is saturated with the groundwater as it was confirmed from the adjacent wells. The thickness of this zone is not uniform through all the profiles due to sedimentation processes. It varies from 6 m to 19 m.
The fourth geoelectric zone is characterized by very low resistivity values (less than 50 ohm.m). The maximum thickness of this zone is recorded in profiles 13 and 14, which correspond to the Nile River clay deposits near the cultivated lands. It is noticed that the thickness of this zone is increasing in the direction of the River Nile and decreasing in the direction of the limestone plateau. It was recorded as spots in the rest of the other profiles and may be expected to be bound deeper beneath all the recorded zones.
It is crucial to inspect all of the resistivity profiles together as will be discussed later in 3D interpretation and the data of the available wells; the water table level in the study site varies from 5 m in some places to 14 m in other places.
5.2. 3D Illustration and Interpretation of Electrical Resistivity Tomography
The goal of creating a three-dimensional ERT model for the study area was to characterize the vertical and the horizontal distributions of the resistivity values of the subsurface lithological units beneath the surface. Geosoft Oasis Montaj software version 8.3 was used to create a 3D VOXEL model using the outcomes of the inverted 2D ERT profiles; specifically, profiles 1–11 west of the Osirion site and excluded the other profiles (P12–P14). The statistical kriging algorithm was primarily employed in this procedure for 3D meshing to generate a 3D voxel network model, which involved combining the inverted results of 2D ERT files into a single file (
Figure 9). The required data must have the following three data fields: X, Y, and Z, where X and Y are the actual universal transverse mercator (UTM) coordinates in meters; Z is the depth in meters; and the data field is the resistivity in ohm.m.
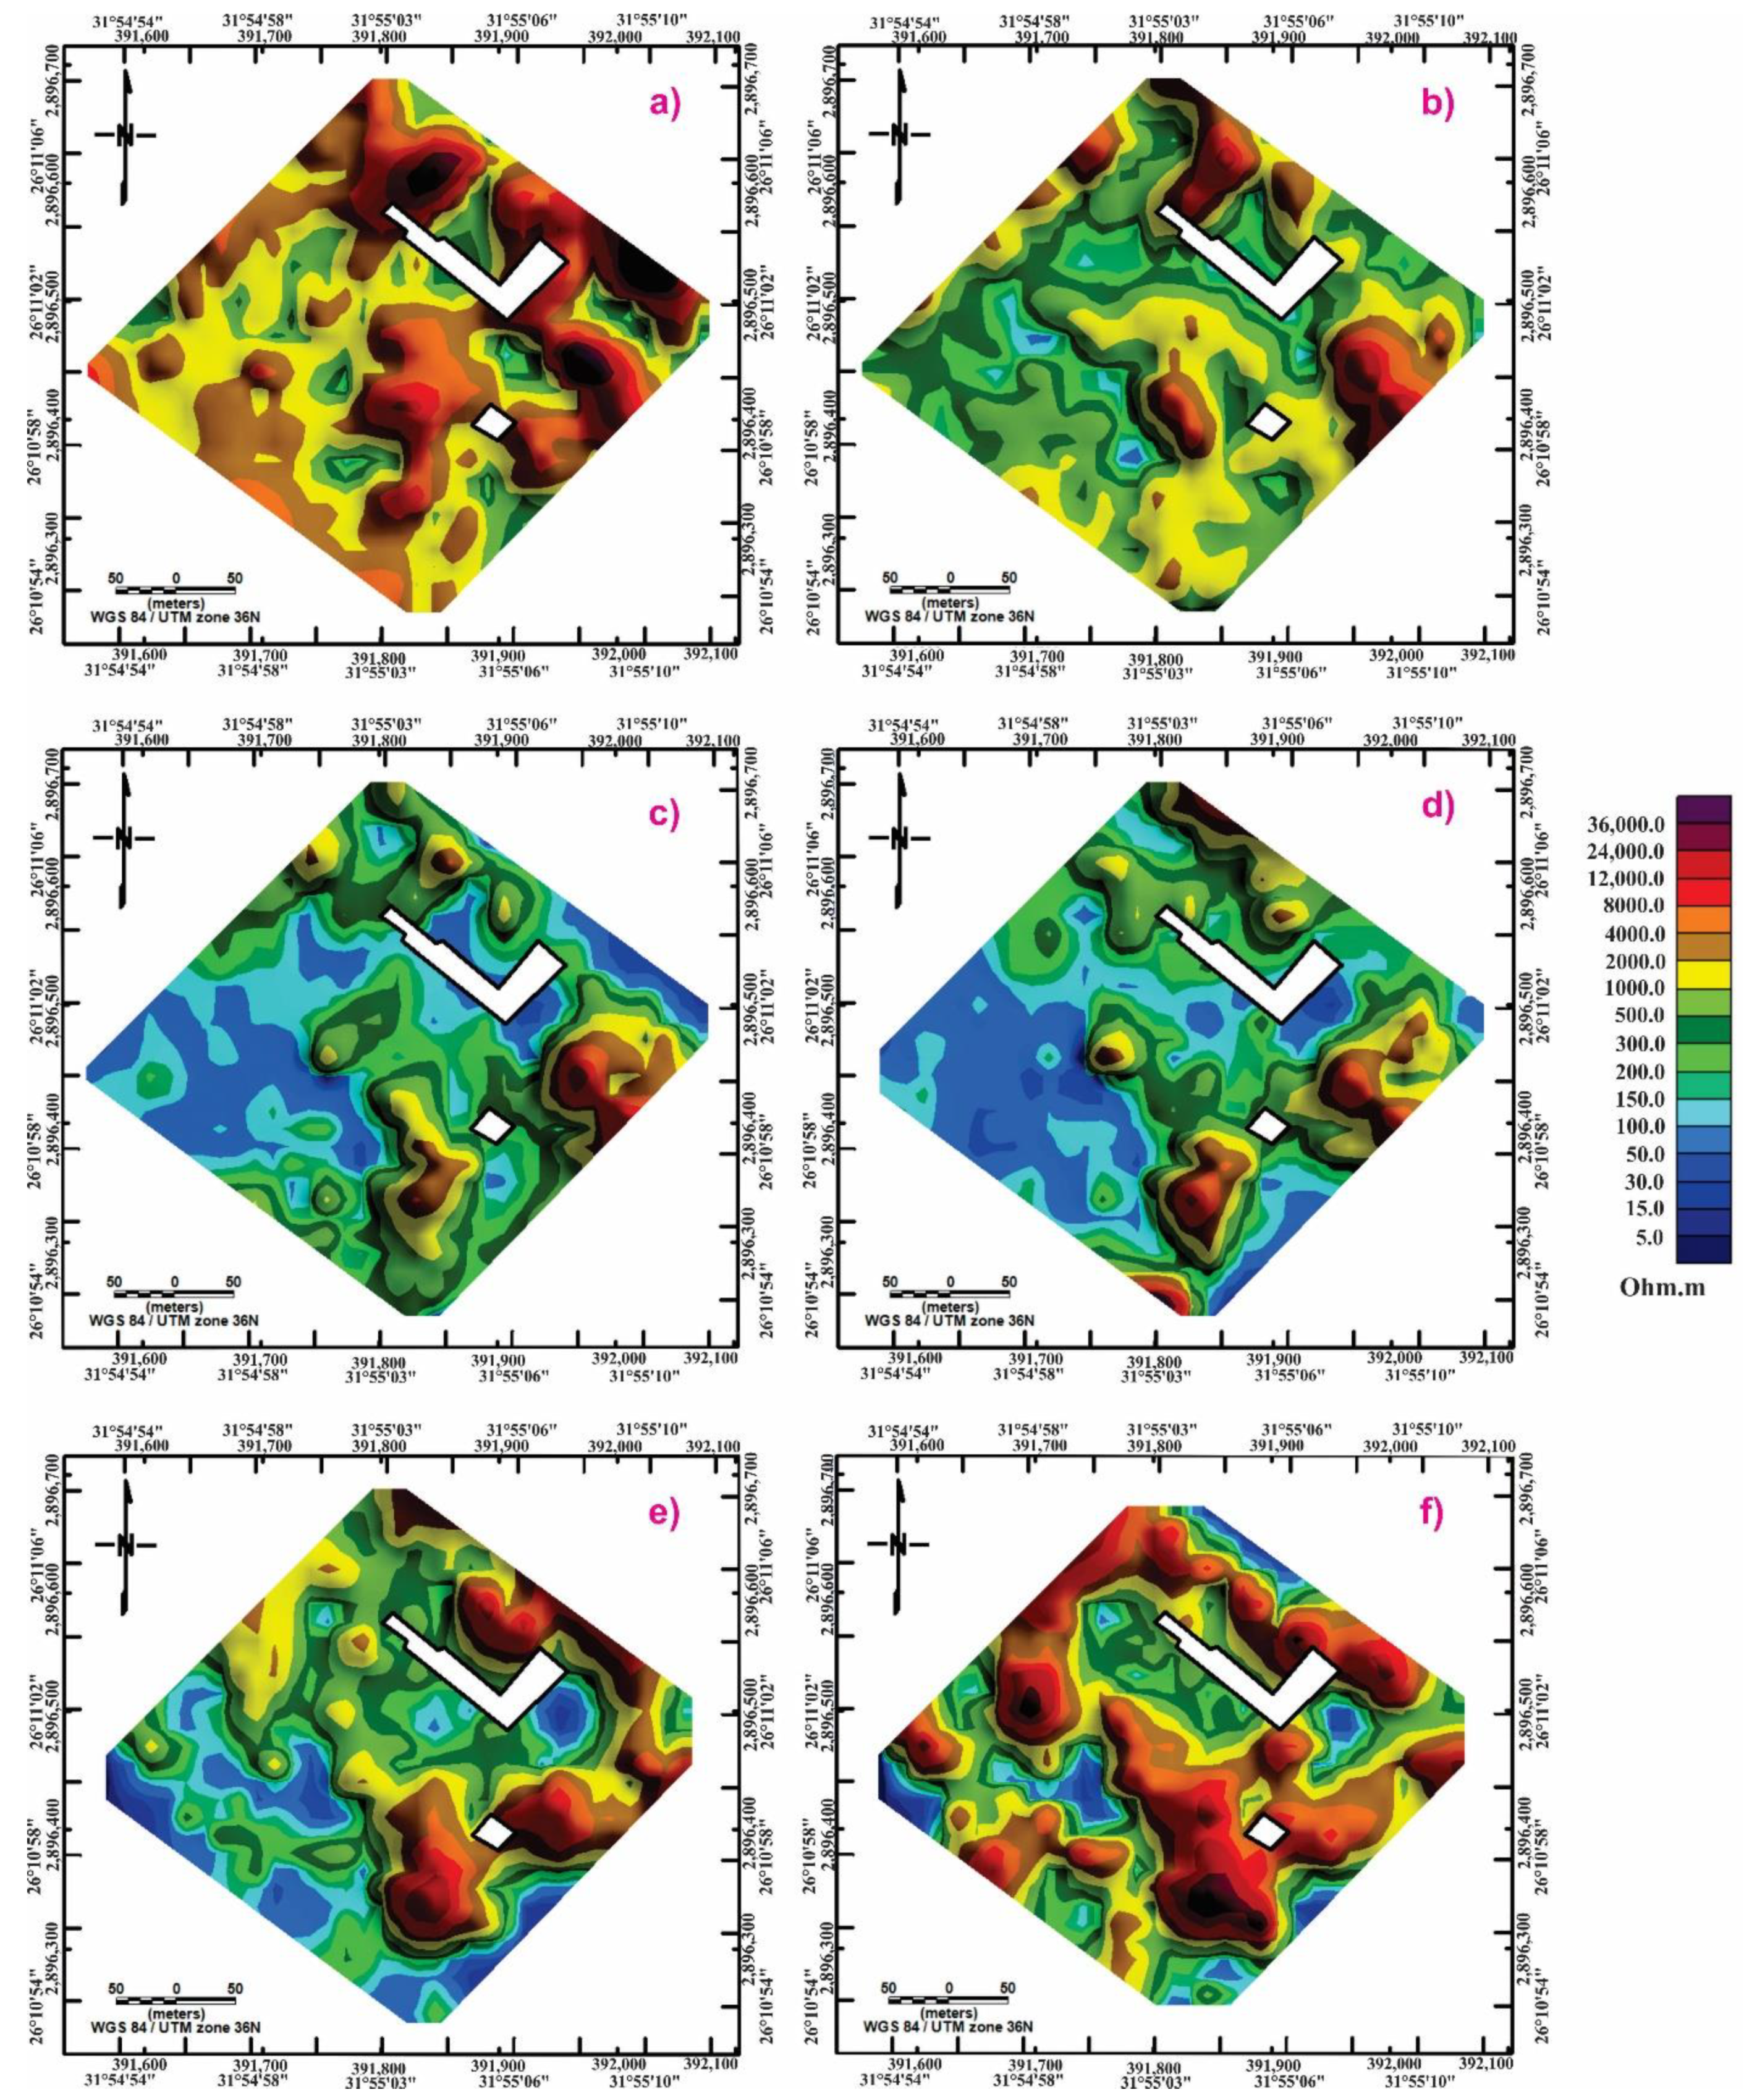
In order to clearly portray the 3D illustration of the electrical resistivity distributions of the geoelectric zones that characterize the site at various depths from the ground surface (
Figure 10), the 3D voxel was sliced into 13 horizontal slices. To keep the length of this paper, only six slices at depths of 0.51, 3.8, 6.53, 9.85, 16.16, and 21.49 m were used to describe the horizontal and vertical distributions of the resistivity values (
Figure 11).
The first geoelectrical zone appears progressively near the ground surface at a depth of about 0.51 m in the northern and north-eastern directions of the study site, and decreases in the western and southern directions. With increasing the depth, this zone begins to gradually disappear until a depth of about 6.53 m; and then, begins to increase again until it reaches its highest appearance at a depth of 21.49 m, which means that this zone was invaded by active water current suspended with other material. These currents eroded this zone, replacing it with other rock materials forming different geoelectrical zones.
The second geoelectrical zone obviously appears in the western and southern parts of the mapped area, at a depth of about 0.51 m, while it increases in the eastern part to a depth of about 3.8 m, which indicates that the rock grain sizes increase in the east and decrease in the west until a depth of 9.85 m; then, it appears again at a depth of 16.16 m in the western and northern directions until the end of the mapped area.
The third geoelectrical zone appears as clear as possible at a depth of 6.53 m to 16.16 m; then, it begins to decrease again. The thickness of this zone, which considers as a water-bearing formation (aquifer), is about 10 m. This thickness increases to the west and decreases to the east. It is worth mentioning that this zone is more noticeable in the eastern direction near the agricultural areas from the inspection of the 2D profiles; especially profiles nos. P12–P14, which were not represented in the 3D voxel model.
The fourth geoelectrical zone appears in the western portion of the investigated site in addition to the eastern side of the mapped area near the cultivated land. It is expected that this zone appears beneath the last three zones due to the sedimentation processes as confirmed by the well data.
Figure 12 displays the generated 3D voxel representation of the inverted 2D ERT data to display the relation between the 2D sections and their locations; in addition to the virtualized representation of the resistivities in both the vertical and horizontal directions.
Figure 13 shows a 3D representation of the water-bearing muddy sand formation in the study area, which shows the location of a conduit channel; especially in profiles 12, 13, and 14, which contain an expected channel that might be interpreted as a water conduit pathway to the Osirion site coming from the northeastern side of the Nile River. Based on the thickness of the muddy sand-bearing formation, the groundwater flow in the investigated site is from the east to the west as the Nile River feeds the aquifer from the discovered channel at the site. This finding is inconsistent with archaeological studies conducted at the Osirion site, where the ancient archaeological text and drawings on the temple walls and columns (
Figure 14) indicate that there was a paleochannel for transporting the boats and stones from the Nile River to Osirion [
26]. These findings are in agreement with those extracted by [
42]; Reference [
18] on the existence of an old channel connecting the Nile River to the temple, and they suggested that this channel is probably to blame for the lake-water supply of the Osirion site from the Nile River. Our findings in the current work discovered the direction of this channel.
Accordingly, climate change at the Nile River will affect the level of the groundwater rising around Osirion. There are piezometers connected to the wells nos. 1 and 5, which have proven that the groundwater level rising around the Osirion increases in the winter and decreases in the summer [
28].
6. Conclusions
An archaeogeophysical survey was carried out using the electric resistivity tomography method on the Osirion at the archaeological Abydos site. Fourteen two-dimensional profiles using pole–dipole configuration were implemented to solve the problem of the increasing rise of groundwater at the Osirion site. This groundwater has harmful environmental effects on the erosion of the foundations of the temple, distorting its architecture, changing its colors, and obliterating ancient archaeological drawings and writings on it. The ERT results were confirmed by the boreholes data.
The results of this work reveal that the subsurface succession was categorized into four geoelectric zones based on the fundamental changes in the resistivities. These zones are the high resistivity zone (>2000 ohm.m), moderate resistivity zone (200–2000 ohm.m), low resistivity zone (50–200 ohm.m), and very low resistivity zone (<50 ohm.m). These zones lead to the classification of the subsurface lithology into four different units: (1) wadi deposits, which are mainly composed of gravels, sands, and silts; (2) medium sand deposits; (3) muddy sand deposits; and (4) clay deposits. The third unit of muddy sands is a groundwater bearing formation as confirmed from the nearby wells. The water table level in the study site varies from 5 m to 14 m as confirmed from all the ERT profiles together with the available borehole data. A potential paleochannel in the north-east direction and its location was recognized from the 3D view of the ERT data, where this channel is responsible for supplying the groundwater from the Nile River to the Osirion site. This paleochannel is the main reason for groundwater rising at the Osirion site. This result matches well with the previous archaeological studies undertaken at the Osirion site, where there are ancient archaeological drawings and texts on the temple walls that refer to this finding.
The authors recommend that decision-makers take engineering precautions, such as dams and partitions, to prevent groundwater from reaching important archaeological sites. Furthermore, they should monitor and control groundwater level changes near archaeological foundations by taking all the necessary measurements to prevent soil subsidence and foundation collapse, as well as establishing a network of dewatering systems.
The potential economic impact of this work will motivate the administrators of the Egyptian Ministry of Antiquities and the Ministry of Water Resources to move towards taking immediate action to protect these important archaeological artifacts (4000 years old), which are considered some of the most important sources of the reactivation of tourism and increasing the income of Egypt.
Author Contributions
Conceptualization, A.M.M. and M.A.M.; formal analysis, G.Z.A.A. and M.A.M.; investigation, A.M.A., A.M.M. and M.A.M.; methodology, A.M.A., G.Z.A.A., A.M.M. and M.A.M.; software, G.Z.A.A. and A.M.M.; supervision, G.Z.A.A.; writing—original draft, A.M.A.; writing—review and editing, A.M.M. and M.A.M. All authors have read and agreed to the published version of the manuscript.
Funding
This research was funded by the Science, Technology, and Innovation Funding Authority (STIFA) of Egypt, grant number 37087.
Data Availability Statement
The data is available upon request from the authors.
Acknowledgments
The Science, Technology, and Innovation Funding Authority (STIFA) of Egypt, grant no. 37087, provided financial support for this project.
Conflicts of Interest
The authors declare no conflict of interest.
References
- Zaghloul, E.A.; Abdeen, M.M.; Elbeih, S.F.; Soliman, M.A. Water logging problems in Egypt’s deserts: Case study Abu Mena archaeological site using geospatial techniques. Egypt. J. Remote Sens. Space Sci. 2020, 23, 387–399. [Google Scholar] [CrossRef]
- Megahed, H. Hydrological and archaeological studies to detect the deterioration of Edfu temple in upper Egypt due to environmental changes during the last five decades. SN Appl. Sci. 2020, 2, 1–18. [Google Scholar] [CrossRef]
- Abu El-Magd, S.; Abdel Moneim, A.; Sefelnasr, A. Assessment of some heavy metals in groundwater: Case study around an archaeological site, Abydos, Sohag, Egypt. Hydrology 2020, 8, 34. [Google Scholar] [CrossRef]
- Morelli, G.; Tayyab, M. Investigation of seepage through embankment dam using 3d investigation of seepage through embankmemt dam in Makkah, KSA using 3d electrical resistivity tomography and 3d ground penetrating radar imaging. In Proceedings of the Symposium on the Application of Geophysics to Engineering and Environmental Problems, Denver, CO, USA, 19–23 March, 2017; pp. 1–6. [Google Scholar]
- Abdel Moneim, A.; Abu El-Magd, S. Groundwater level-rise monitoring and recharge determination at an old archaeological site: Abydos, Sohag, Egypt. In Proceedings of the Eighth International Conference on the Geology of Africa, Assiut University, Assiut, Egypt, 8–10 February 2015; Volume IV; p. 83. [Google Scholar]
- El-Sayed, S.; Atta, E.; Al-Ashri, K. Groundwater table rise in northwest Nile delta: Problems and recommendations. J. Radiat. Res. Appl. Sci. 2012, 5, 141–171. [Google Scholar]
- Parizek, A.; Abdel Moneim, A.; Fantle, M.; Westerman, J.; Issawi, B. Isotopic data: Implications for the source (s) of Osirion groundwater, Abydos, Egypt. Egypt. J. Archaeol. Restor. Stud. 2011, 1, 61–72. [Google Scholar]
- Brooks, J.E.; Issawi, B. Groundwater in the Abydos Areas, Egypt; the Flooding of the Osirion; Water Paper; Egyptian Journal of Archaeological and Restoration Studies “EJARS”: Cairo, Egypt, 1992. [Google Scholar]
- Sharafeldin, S.M.; Essa, K.S.; Youssef, M.A.; Karsli, H.; Diab, Z.E.; Sayil, N. Shallow geophysical techniques to investigate the groundwater table at the great pyramids of Giza, Egypt. Geosci. Instrum. Methods Data Syst. 2019, 8, 29–43. [Google Scholar] [CrossRef] [Green Version]
- Afshar, A.; Abedi, M.; Norouzi, G.; Riahi, M. Geophysical investigation of underground water content zones using electrical resistivity tomography and ground penetrating radar: A case study in Hesarak-Karaj, Iran. Eng. Geol. 2015, 196, 183–193. [Google Scholar] [CrossRef]
- Ahmed, A.A.; Fogg, G.E. The impact of groundwater and agricultural expansion on the archaeological sites at Luxor, Egypt. J. Afr. Earth Sci. 2014, 95, 93–104. [Google Scholar] [CrossRef] [Green Version]
- Abdel-Azeem, A.M.; Held, B.W.; Richards, J.E.; Davis, S.L.; Blanchette, R.A. Assessment of biodegradation in ancient archaeological wood from the middle cemetery at Abydos, Egypt. PLoS ONE 2019, 14, e0213753. [Google Scholar]
- Sefelnasr, A.; Abdel Moneim, A.; Abu El-Magd, S. 3d-groundwater flow modeling for water level-rise detection and recharge determination at an old archaeological site: Abydos, Sohag, Egypt. In Proceedings of the Eighth International Conference on the Geology of Africa, Assiut, Egypt, 8–10 February 2015; pp. 105–118. [Google Scholar]
- Elbeih, S.F. An overview of integrated remote sensing and GIS for groundwater mapping in Egypt. Ain Shams Eng. J. 2015, 6, 1–15. [Google Scholar] [CrossRef] [Green Version]
- O’Connor, D.B. Abydos: Egypt’s First Pharaohs and the Cult of Osiris; Thames & Hudson: London, UK, 2009. [Google Scholar]
- Westerman, J. An archaeological analysis of the Osirion. In Proceedings of the Third International Conference on the Geology of the Tethys, Aswan, Egypt, 8–11 January 2008. [Google Scholar]
- Farrag, A. The hydraulic and hydrochemical impacts of the Nile system on the groundwater in upper Egypt. Assiut Univ. Bull. Environ. Res. 2005, 8, 87–102. [Google Scholar]
- Abdel-Hafez, T.M.M. Geophysical and Geotechnical Studies in Pharaonic and Urban Egypt; Citeseer; Bern University: Bern, Swiss, 2004. [Google Scholar]
- El-Gamili, M.; El-Mahmoudi, A.; Osman, S.S.; Hassaneen, A.G.; Metwaly, M. Geoelectric resistance scanning on parts of Abydos cemetery region, Sohag governorate, upper Egypt. Archaeol. Prospect. 1999, 6, 225–239. [Google Scholar] [CrossRef]
- Abdel Moneim, A. Groundwater studies in and around Abydos temples, upper Egypt. J. Geol. Surv. Egypt 1999, 22, 357–368. [Google Scholar]
- Odah, H.; Abdallatif, T.; Hussain, A. Micromagnetic prospecting to delineate the buried solar boats in Abydos area, Sohag, Egypt. J. Environ. Sci. Mansoura Univ. Egypt 1998, 16, 121–133. [Google Scholar]
- Abdallatif, T. Magnetic Prospection for Some Archaeological Sites in Egypt. Unpublished Ph.D. Dissertation, Ain Shams University, Cairo, Egypt, 1998. [Google Scholar]
- O’Connor, D. Report on Abydos: The Early Dynastic Project; New York University: New York, NY, USA, 1997; pp. 1–5. [Google Scholar]
- Abdel Moneim, A. In Effect of groundwater extraction on the river Nile water using numerical simulation techniques. In Proceedings of the National Conference on the River Nile, Cairo, Egypt, 3–5 February 1995; Assiut University Center for Environmental Studies: Asyut, Egypt, 1995. [Google Scholar]
- Abdel Moneim, A. Numerical Simulation and Groundwater Management of the Sohag Aquifer, the Nile Valley, Egypt. Ph.D. Thesis, University of Strathclyde, Glasgow, UK, 1992. [Google Scholar]
- Damarant, A.; Abd el-Raziq, Y.; Okasha, A.; Wegner, J.; Cahail, K.; Wegner, J. A new temple: The Mahat of Nebhepetre at Abydos. Egypt. Archaeol. 2015, 46, 3–7. [Google Scholar]
- Baedeker, S. Egypt from a to z. In Handbook for Travellers; Jarrold and Sons Ltd.: Cairo, Egypt, 1978. [Google Scholar]
- Abu El-Magd, S. Evaluation of the Aquifer Potentiality and Land Suitability for development in the Desert Area Surrounding Sohag Governorate, Egypt; Using Geographic Information Systems. Master’s Thesis, Geology Department, Faculty of Science, Sohag University, Sohag, Egypt, 2008. [Google Scholar]
- Omer, A.; Issawi, B. In Lithostratigraphical, mineralogical and geochemical studies on the Neogene and quaternary Nile basin deposits, Qena-Assiut stretch, Egypt. In Proceedings of the 4th International Conference on Geology of the Arab World, Cairo, Egypt, 31 March 1998. [Google Scholar]
- Mahran, T.; El Haddad, A. Facies and depositional environments of upper Pliocene-Pleistocene Nile sediments around Sohag area, Nile valley. J. Saharian Stud. 1992, 1, 11–40. [Google Scholar]
- Issawi, B.; McCauley, J.F. The Cenozoic rivers of Egypt: The Nile problem. Follow. Horus Egypt: Stud. Assoc. Public 1992, 2, 121–138. [Google Scholar]
- Conoco, C. Geological Map of Egypt, Scale 1: 500,000-nf 36 ne-Bernice, Egypt; The Egyptian General Petroleum Corporation: Cairo, Egypt, 1987. [Google Scholar]
- Mohammed, M.A.; Abudeif, A.M. Geoelectrical characterization of the Al-Kawamil new settlement, Sohag, Egypt. J. Environ. Eng. Geophys. 2019, 24, 327–332. [Google Scholar] [CrossRef]
- Mohammed, M.; Senosy, M.; Abudeif, A. Derivation of empirical relationships between geotechnical parameters and resistivity using electrical resistivity tomography (ERT) and borehole data at Sohag university site, upper Egypt. J. Afr. Earth Sci. 2019, 158, 103563. [Google Scholar] [CrossRef]
- Baharuddin, M.; Hazreek, Z.; Azman, M.; Madun, A. In Prediction of groundwater level at slope areas using electrical resistivity method. J. Phys. Conf. Ser. 2018, 995, 012084. [Google Scholar] [CrossRef]
- Aziman, M.; Hazreek, Z.; Azhar, A.; Fahmy, K.; Faizal, T.; Sabariah, M.; Ambak, K.; Ismail, M. In Electrical resistivity technique for groundwater exploration in quaternary deposit. J. Phys. Conf. Ser. 2018, 995, 012110. [Google Scholar] [CrossRef]
- Mohamaden, M.; El-Sayed, H.; Hamouda, A. Combined application of electrical resistivity and GIS for subsurface mapping and groundwater exploration at el-themed, southeast Sinai, Egypt. Egypt. J. Aquat. Res. 2016, 42, 417–426. [Google Scholar] [CrossRef] [Green Version]
- Loke, M.H.; Acworth, I.; Dahlin, T. A comparison of smooth and blocky inversion methods in 2d electrical imaging surveys. Explor. Geophys. 2003, 34, 182–187. [Google Scholar] [CrossRef] [Green Version]
- Dahlin, T. The development of dc resistivity imaging techniques. Comput. Geosci. 2001, 27, 1019–1029. [Google Scholar] [CrossRef] [Green Version]
- Athanasiou, E.; Tsourlos, P.; Papazachos, C.; Tsokas, G. Combined weighted inversion of electrical resistivity data arising from different array types. J. Appl. Geophys. 2007, 62, 124–140. [Google Scholar] [CrossRef]
- Loke, M. Rapid 2-D Resistivity and IP Inversion Using the Least-Squares Method, Geoelectrical Imaging 2D and 3D; Geotomo Software; Penang Publishers: Penang, Malaysia, 2012. [Google Scholar]
- Rostem Osman, R. The Scheme Planned by the Late Abdel Salam Mohamed Husein for the Protection of the Monuments of Seti I at Abydos; Chapter I of the Report on Expedition; ASAE: Osirion, Egypt, 1950. [Google Scholar]
Figure 1.
Location map of the Abydos archaeological site, El-Balyana city, Sohag, Egypt, where (a) indicates the global map of Egypt, and (b) is a detailed map of the Abydos archaeological site that shows the Osirion site and the adjacent boreholes.
Figure 1.
Location map of the Abydos archaeological site, El-Balyana city, Sohag, Egypt, where (a) indicates the global map of Egypt, and (b) is a detailed map of the Abydos archaeological site that shows the Osirion site and the adjacent boreholes.
Figure 2.
Showing the effects of the groundwater at the Osirion site, where (A) indicates the decreasing of the groundwater level in summer season; (B) shows the increasing of the groundwater rising in winter season; (C) shows the efflorescence line levels in granite pillars; (D) indicates the deterioration of historic symbols and colors on stone surfaces; and (E) indicates the destruction of wall paintings at the Abydos Temple.
Figure 3.
Geological map of Sohag governorate, including the study area that shows the main surface geologic units [
32] and cross section through the study area passing through the Osirion site (modified after [
20]).
Figure 3.
Geological map of Sohag governorate, including the study area that shows the main surface geologic units [
32] and cross section through the study area passing through the Osirion site (modified after [
20]).
Figure 4.
Index map for the surveyed profiles using 2D electrical resistivity tomography, where fourteen ERT profiles were covered at the aimed site. The locations of two available boreholes are also shown.
Figure 4.
Index map for the surveyed profiles using 2D electrical resistivity tomography, where fourteen ERT profiles were covered at the aimed site. The locations of two available boreholes are also shown.
Figure 5.
Interpreted 2D inverted resistivity model of profiles 1–4. According to the resistivity values, four difference geoelectric zones were recognized. These zones are: (1) wadi deposits, which are mainly composed of gravels, sands, and silts; (2) medium sand deposits; (3) muddy sand deposits; and (4) clay deposits.
Figure 6.
Interpreted 2D inverted resistivity model of profiles 5–8. According to the resistivity values, four difference geoelectric zones were recognized. These zones are: (1) wadi deposits, which are mainly composed of gravels, sands, and silts; (2) medium sand deposits; (3) muddy sand deposits; and (4) clay deposits.
Figure 7.
Interpreted 2D inverted resistivity model of profiles 9–12. According to the resistivity values, four difference geoelectric zones were recognized. These zones are: (1) wadi deposits, which are mainly composed of gravels, sands, and silts; (2) medium sand deposits; (3) muddy sand deposits; and (4) clay deposits.
Figure 8.
Interpreted 2D inverted resistivity model of profiles 13–14. According to the resistivity values, four difference geoelectric zones were recognized. These zones are: (1) wadi deposits, which are mainly composed of gravels, sands, and silts; (2) medium sand deposits; (3) muddy sand deposits; and (4) clay deposits.
Figure 9.
A 3D voxel model of the inverted 2D electrical resistivity profiles (P1 to P11) using Geosoft Oasis Montaj Software version 8.3 that was sliced to horizontal sections at different depths to explain the vertical and horizontal changes in the resistivity values within the investigated site.
Figure 9.
A 3D voxel model of the inverted 2D electrical resistivity profiles (P1 to P11) using Geosoft Oasis Montaj Software version 8.3 that was sliced to horizontal sections at different depths to explain the vertical and horizontal changes in the resistivity values within the investigated site.
Figure 10.
A 3D illustration of the major detected subsurface geoelectric zones in the study site, where (a) is the first geoelectric zone representing the wadi deposits, (b) is the second geoelectric zone corresponding to medium sand, and (c) is the third geoelectric zone representing the muddy sand (saturated with groundwater).
Figure 11.
Horizontal slices of electrical resistivity at depths of (
a) 0.51 m, (
b) 3.8 m, (
c) 6.53 m, (
d) 9.85 m, (
e) 16.16 m, and (
f) 21.49 m from the ground surface that were sliced from the block diagram (
Figure 9).
Figure 11.
Horizontal slices of electrical resistivity at depths of (
a) 0.51 m, (
b) 3.8 m, (
c) 6.53 m, (
d) 9.85 m, (
e) 16.16 m, and (
f) 21.49 m from the ground surface that were sliced from the block diagram (
Figure 9).
Figure 12.
A 3D voxel model of the inverted electrical resistivity of profiles 1 to 14. This model explains that the resistivity value elsewhere is not the same. They change in both the horizontal and vertical directions due to the fluid content and lithology.
Figure 12.
A 3D voxel model of the inverted electrical resistivity of profiles 1 to 14. This model explains that the resistivity value elsewhere is not the same. They change in both the horizontal and vertical directions due to the fluid content and lithology.
Figure 13.
A 3D displays of the muddy sand-bearing water and locating the possible conduit channel at the study area.
Figure 13.
A 3D displays of the muddy sand-bearing water and locating the possible conduit channel at the study area.
Figure 14.
(
a) Photograph of the wall after excavation, showing Neshmet on the right and Menit on the left, “the mooring post”; (
b) the dedication text for the building is written on the west wall. Kevin Cahail and Jennifer Wegner collaborated on this illustration; and (
c) detailed translation of the hieroglyphic writing claiming that the king dug a canal for the Abydene gods’ boats to be transported [
26].
| Publisher’s Note: MDPI stays neutral with regard to jurisdictional claims in published maps and institutional affiliations. |
© 2022 by the authors. Licensee MDPI, Basel, Switzerland. This article is an open access article distributed under the terms and conditions of the Creative Commons Attribution (CC BY) license (https://creativecommons.org/licenses/by/4.0/).


