1. Introduction
Metal additive manufacturing (MAM) technologies like laser powder bed fusion (LPBF) represent laser-based techniques employed to develop products using powdered metals. It is used to manufacture prototypes during product development, as well as for applications with small batch sizes and with frequent design changes [
1]. Thanks to its flexibility, speed, and cost effectiveness [
2], the technique is also being investigated for the development of injection molding tools [
3]. The conventional methods of producing these tools are through subtractive manufacturing, which is time-consuming and relatively expensive. Furthermore, additive manufacturing (AM) offers opportunities for innovative modifications in the product design that conventionally are not possible in an effective and efficient way.
The choice of injection mold tooling using AM can bring several advantages, such as flexible development, design freedom (to improve the product’s performance), and reduced assembly effort, but also some disadvantages such as higher machine and material cost and the skills gap in using sophisticate machinery and software [
4,
5].
Hence, the manufacturing of high-performance tooling can currently be achieved either with conventional machining (CM), i.e., subtractive technologies such as milling, or AM [
6]. As both methodologies present advantages and disadvantages, a detailed analysis must be conducted to identify the consequences of selecting a method over the other throughout the process and value chains.
Such a comparison of subtractive and additive manufacturing is already available in literature; for example, in [
7], Quinlan et al. compared AM against conventional manufacturing processes. To describe AM, they introduced the statement of “complexity for free”. The metaphor describes the fact that, in the case of AM, an increased complexity in product design does not correspond to an increase in cost of production, which is contrary to conventional manufacturing. Furthermore, the research presents a framework for a direct comparison of LPBF and conventional machining (computer numerical controlled (CNC) milling). However, a detailed split of the costs and time contributions to the full value chain has not been fully investigated and, currently, a research gap in this topic remains. The lack of such a perspective makes the decision of the manufacturing route to follow (AM or CM) not as informed as it should be, without a clear understanding of the costs and lead time involved, together with the general productivity of the specific technology chosen.
In the research presented in this paper, AM and CM value chains are compared quantitatively and qualitatively for producing mold inserts for plastic injection molding, with the goal to provide a relevant example of the costs, lead time, and production efficiency involved in the two manufacturing routes, together with a proven methodology to conduct such a comparison. The AM and CM produced mold inserts are equally capable and can withstand the same number of molding cycles; therefore, the AM products are not considered as a prototype or a preventive maintenance tool (as in [
8]) or a spare part (as in [
9,
10]), but a fully functional and finished product, totally comparable to the tools produced by CM. At first, a detailed technology comparison is presented, followed by the economic analysis. Such a step-by-step analysis is particularly relevant to better understand the consequence in terms of the technologies involved and the economic impact of the choice of the two streams on the final product. The article is structured as follows:
Section 1 (‘Introduction’) presents the research topic and explains how the work addresses the current research gap in terms of quantitative comparison of tooling value chains;
Section 2 (‘Related Research’) discusses the relevant state-of-the-art in the fields of virtual models and simulation of production and cost modelling techniques of additive manufacturing;
Section 3 (‘Materials and Methods’) describes the details of the analyzed tool insert and study case;
Section 4 (‘Technology comparison’) and
Section 5 (‘Economic analysis’) present the application and the results of the process chain simulation and of the cost analysis, respectively;
Section 6 (‘Results’) discusses the cost drivers of both value chains and their implications in terms of productivity; finally,
Section 7 (‘Conclusions’) summarizes the paper and provides indications for future research.
2. Related Research
The use of virtual models in a computer simulation to simulate production floor is not novel in the literature. Factory simulation allows experiments to be conducted efficiently to test different scenarios and process capabilities, reducing the need for costly and time-consuming physical experiments. Such physical experiments are also difficult to conduct directly online [
11]. To run a simulation of the production parameters, one of the most popular tools is Tecnomatix Plant Simulation by Siemens Digital Industries Software, which is a discrete simulation program, event-controlled, and object-oriented [
11,
12,
13].
Many researchers have used the tool to optimize manufacturing systems, for example, Klos et al. [
13], who analyzed resource availability, user allocation, and throughput in a conventional manufacturing factory floor [
14,
15]. Vaclav et al. presented a simulation for planning an assembly system, with the goal to improve workflow and remove interruptions [
16]. Tecnomatix has also been successfully used to evaluate machine utilization and production efficiency [
17] and energy-related considerations towards the creation of a digital factory [
18]. Other applications include a detailed analysis of production process and the detection of bottlenecks [
19]. Moreover, Trebuna et al. used a simulation tool to early compare different production plans, verifying the accuracy of the different solutions before realization [
20].
Regarding cost models, especially for AM, different examples can be found in the literature, as discussed in [
21]. Most of them focused on a single aspect of the AM process (typically the part generation by the machine), without necessarily covering a holistic view of the full process chain from design to deployment. In the field of injection molding tool inserts’ manufacturing, a cost model and comparison between the costs of AM- and CM-based process chains was presented in [
22]. Fera et al. analysed previous cost models for AM and presented a new model named MiProCAMAM (mixed production cost allocation model for additive manufacturing) [
23]. The model consists of five phases: preparation, build job, setup, building, and removal. The model calculates the production costs starting from the process and the geometry of the part, considering the design freedom given by AM. Process times and performance are evaluated by estimating the build time. A similar structure is presented in this paper.
Other techniques can be applied to conduct cost estimations and to collect the data required for the technology and cost model. For example, Baldinger et al. [
24] identified four classes of data required for such a cost analysis. These are qualitative—intuitive (based on experience), qualitative—analogical (based on historical data), quantitative—parametric (defined from a variable), and quantitative—analytical (using enterprise resource planning). Qualitative data are easier to use and are helpful in early decision-making; however, they can sometimes lack accuracy. Intuitive data rely on the experience of skilled specialists, but they make it possible to run an early evaluation when little or no stored data exist. Intuitive and analogical data are the types mainly used in this research. Extra input data were obtained from the literature data, where necessary and available. Obviously, a proper and reliable data collection plan is vital for the success of such a project, as the quality of the input data will affect the quality of the simulations and the results of the cost model. The great variety of applications of AM shows the importance of having a reliable method for an accurate manufacturing methods’ comparison, including a more detailed business model and cost–benefit calculation tools, as reported in the review in [
25].
3. Materials and Methods
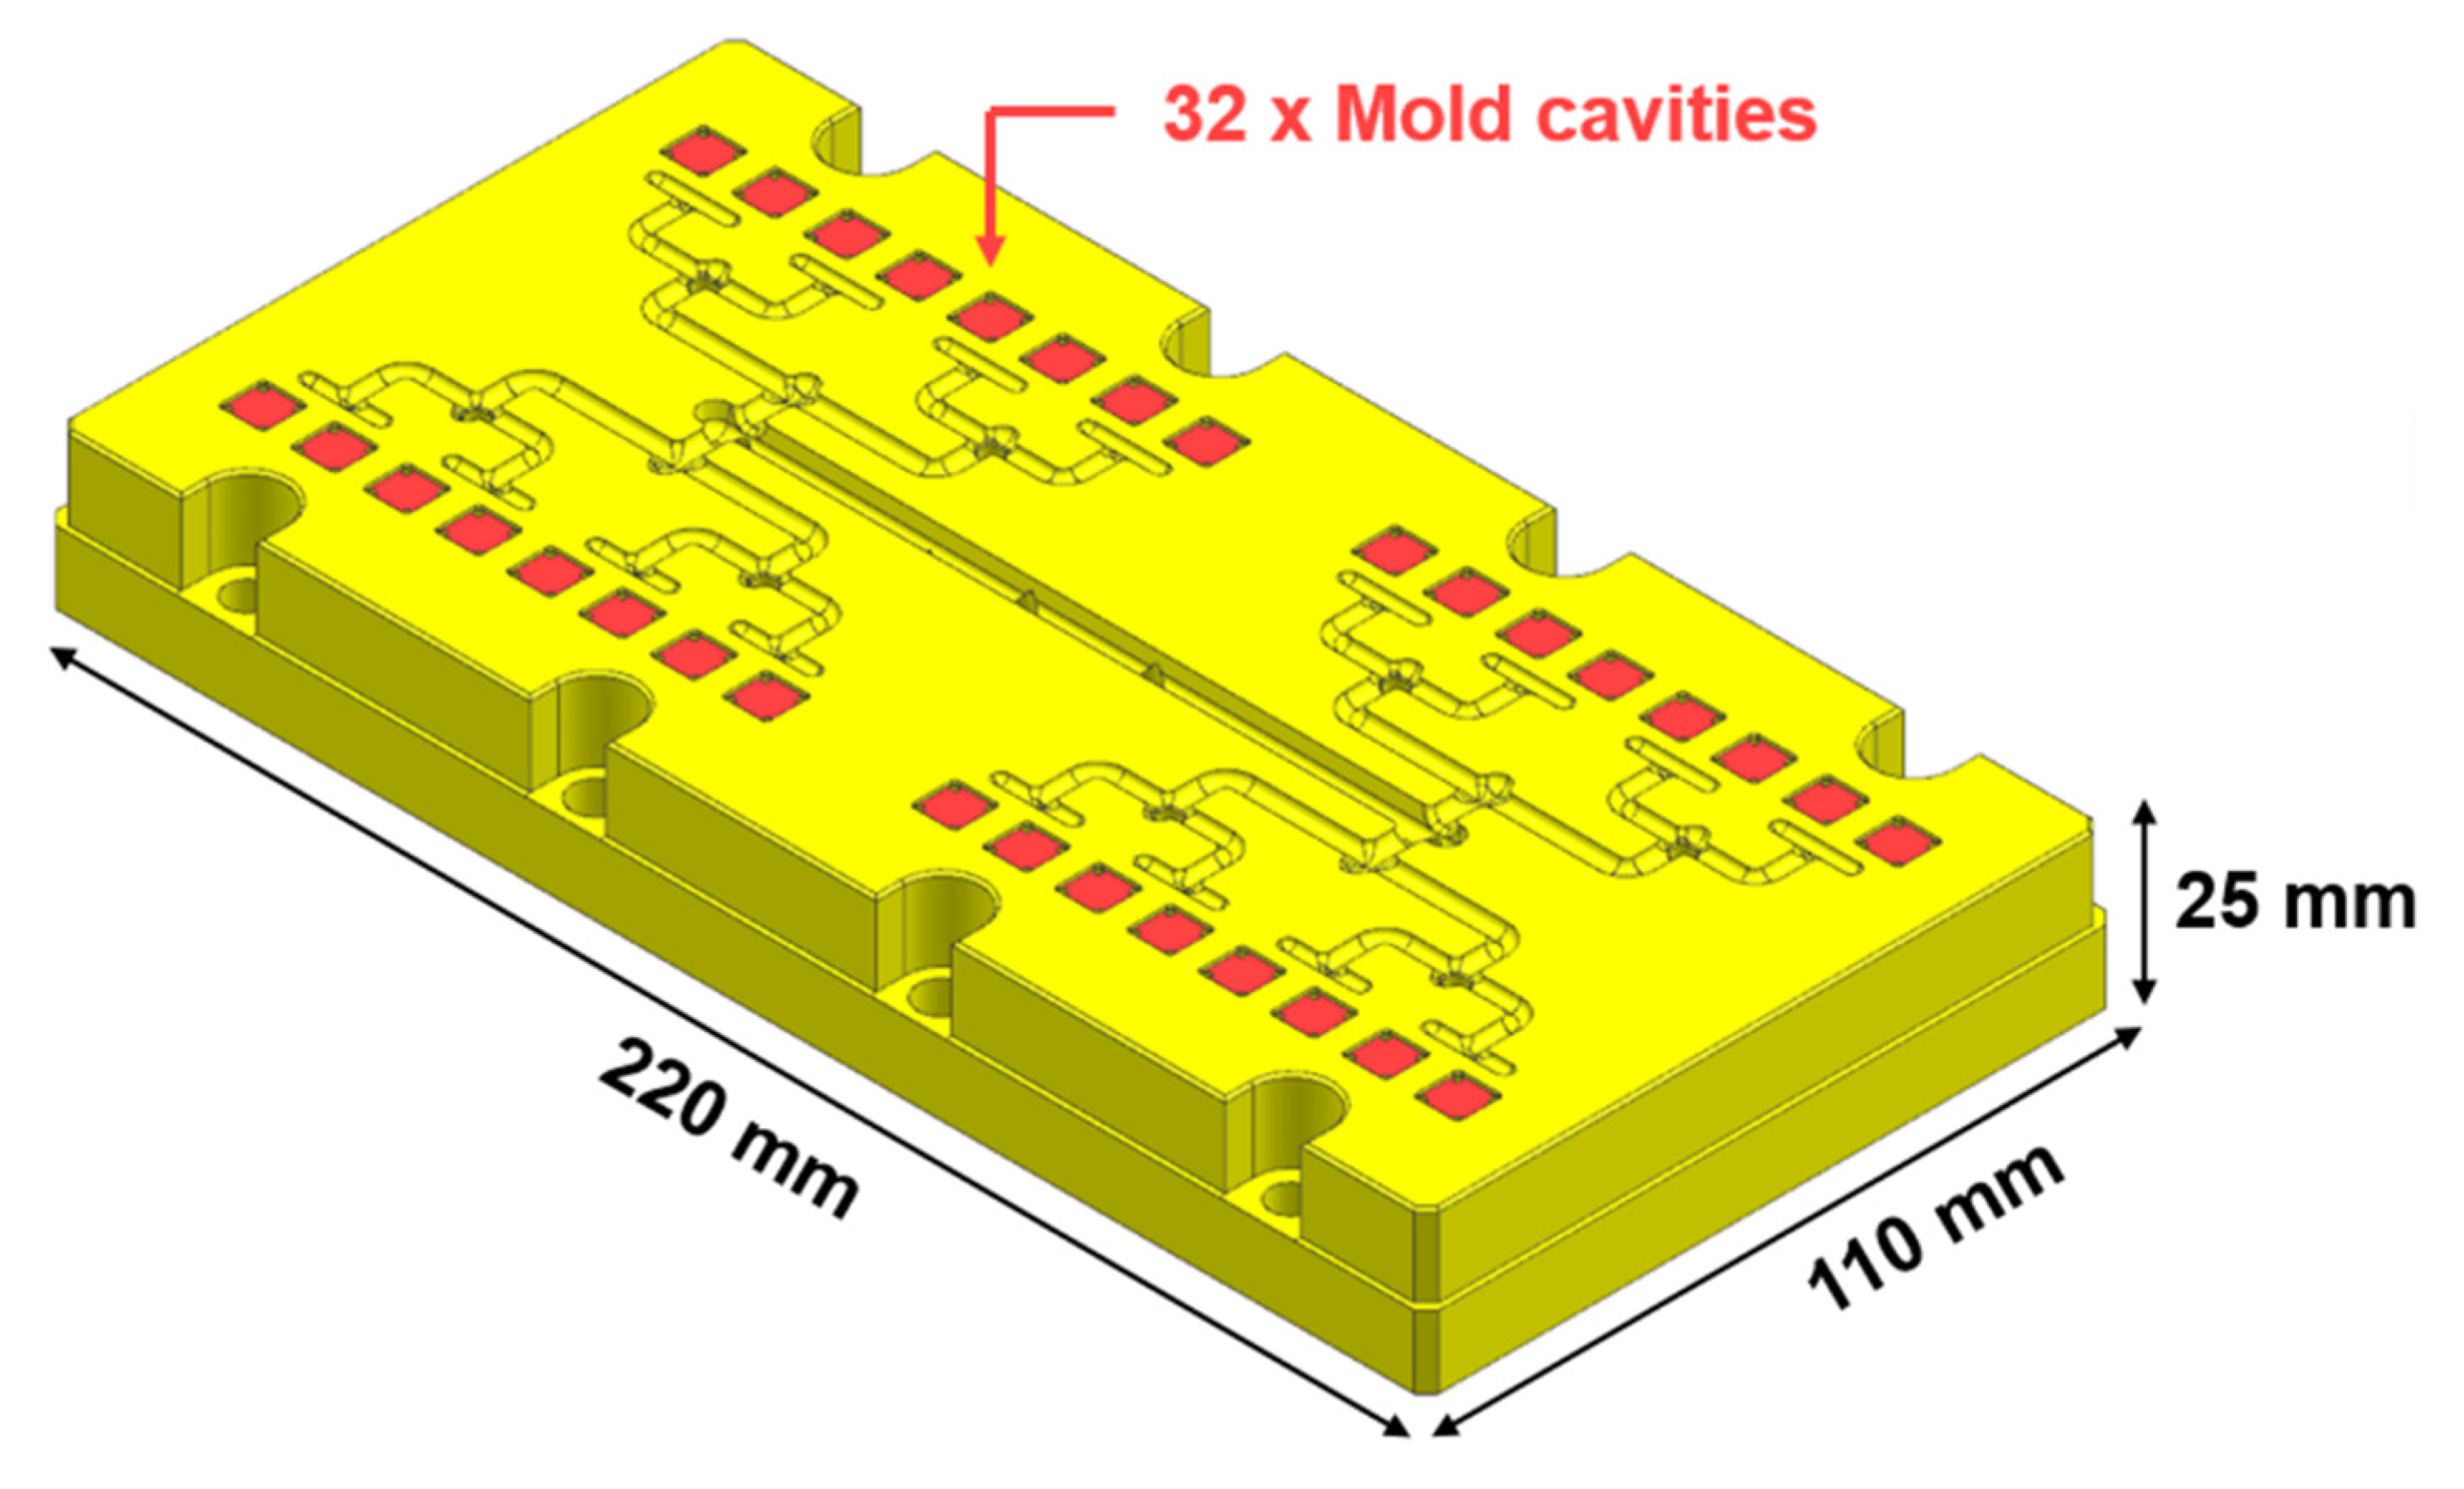
For running this evaluation, a dedicated industrial case study was selected, as presented in
Figure 1. This is the design of a mold insert for plastic injection molding used to manufacture consumer goods made in acrylonitrile butadiene styrene or ABS [
26].
The insert is made of maraging steel grade 300 (1.2709), a very common material in the tooling industry. The insert can be manufactured with both CM and AM. With the higher design freedom allowed by AM, it was demonstrated that the number of cavities in the insert could be increased from 16 to 32, thanks to a better thermal management supplied by the conformal cooling channels [
26].
To run the technology analysis and the production performance, the production process was simulated using discrete simulation, while the detailed cost–benefit analysis was performed with a custom-built tool based on an Excel spreadsheet that also incorporates the performance of the insert during the injection molding process.
The data used in this paper come partially from the literature and were partially collected by interviewing knowledgeable experts in the company where the research was conducted.
4. Technology Comparison
The simulation is used to obtain a full technology comparison between the CM and AM process chains. The dynamic simulation helped to define lead times, identify bottlenecks, and understand resource utilization. Different scenarios were defined and simulated to achieve this, allowing opportunities for improvements. The methodology used in the simulation presented is inspired by [
27].
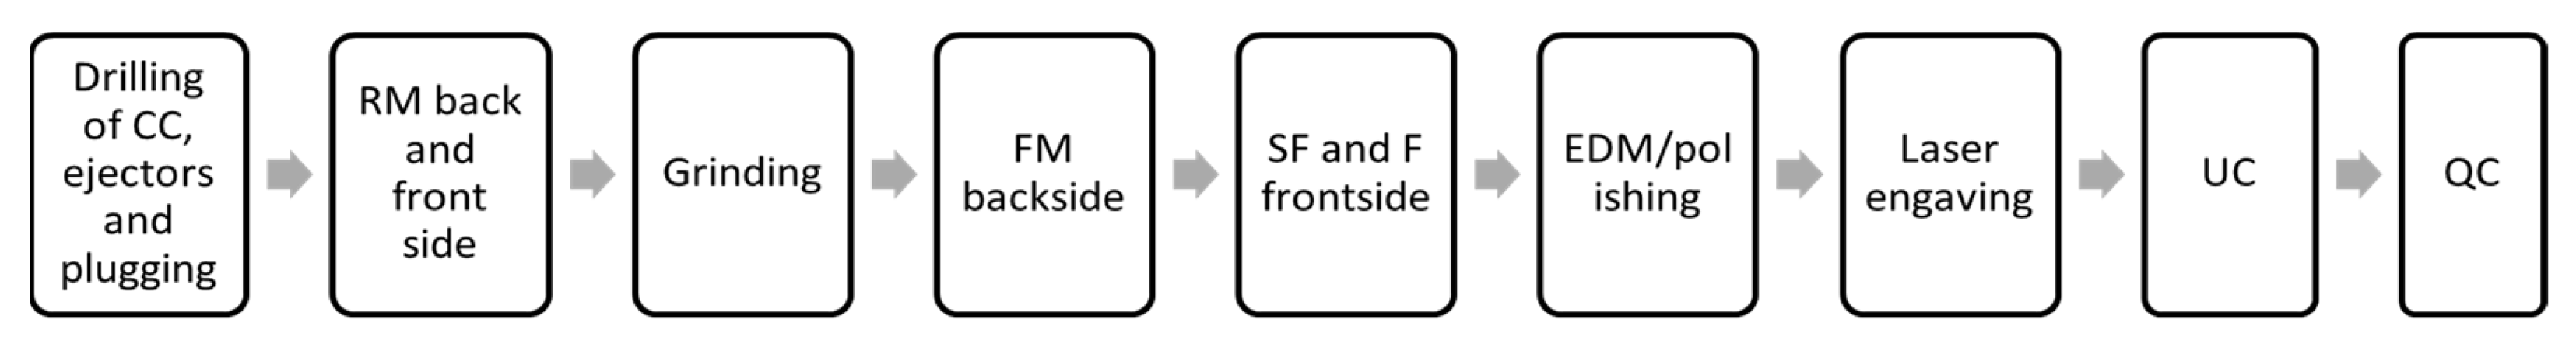
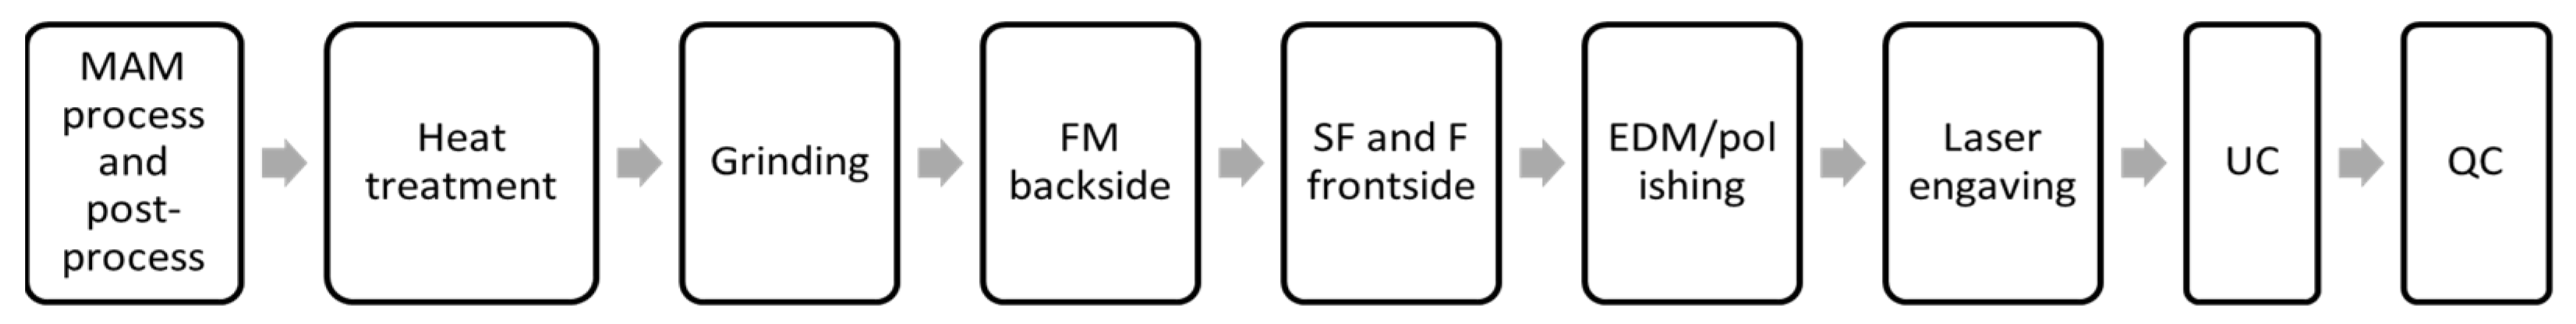
As a first step for this analysis, the process flow for the fabrication of the selected tool had to be mapped. The simplified process flow schematic of CM and AM process chains is presented in
Figure 2 and
Figure 3, respectively.
In the CM flow, the first step consists of drilling in the metal block the holes for cooling channels (CCs) and ejector pins and plugging one of the ends, followed by rough milling (RM) and grinding with three-axis CNC. Finish-milling (FM), semi-finishing (SF), and finishing (F) operations are conducted with five-axis CNC, in order to achieve the specified shape and dimensional tolerances. To achieve the required texture and shape for the plastic product, the next step consists of electrical discharge machining (EDM) or manual polishing. Laser engraving is performed to mark the surface of the cavity for traceability. The last two steps are ultrasonic cleaning (UC) of the insert, to remove all residual lubricants, oil, and chips, before proceeding to quality control (QC) via 3D scanning.
The AM process chain starts with the MAM process and relative post-processes (i.e., powder cleaning, cutting from build plate, and support removal) and heat treatment. The next steps are then very similar to the CM workflow. However, at the start of each step, some additional time may be required to select the suitable cutting tools, as the printed part is near-net-shape and has different surface characteristics as compared with the CM-generated components.
To build up the model and run the simulation, it was necessary to collect, among others, data regarding the setup time [
28], processing time [
29], availability (the ratio between the time the machine is running successfully and the total time in which it could be running) [
30], MMTR (mean time to repair, i.e., the time necessary to repair a machine) [
31], number of workers, and any special observations.
The data were, as mentioned, collected through (i) conversations with experienced users, (ii) historical data, and (iii) literature research. An average was calculated when differences were noticed. The data were collected for each step of the manufacturing flow for both the CM and AM process chains. The processing and setup time data collected to run the simulations are presented in
Table 1.
In the considered case, there are twenty-two workers in the factory, of which fifteen are dedicated to the CM area, two on AM, four on EDM, and one for the UC and QC. The number of workers is proportional to the number of machines involved.
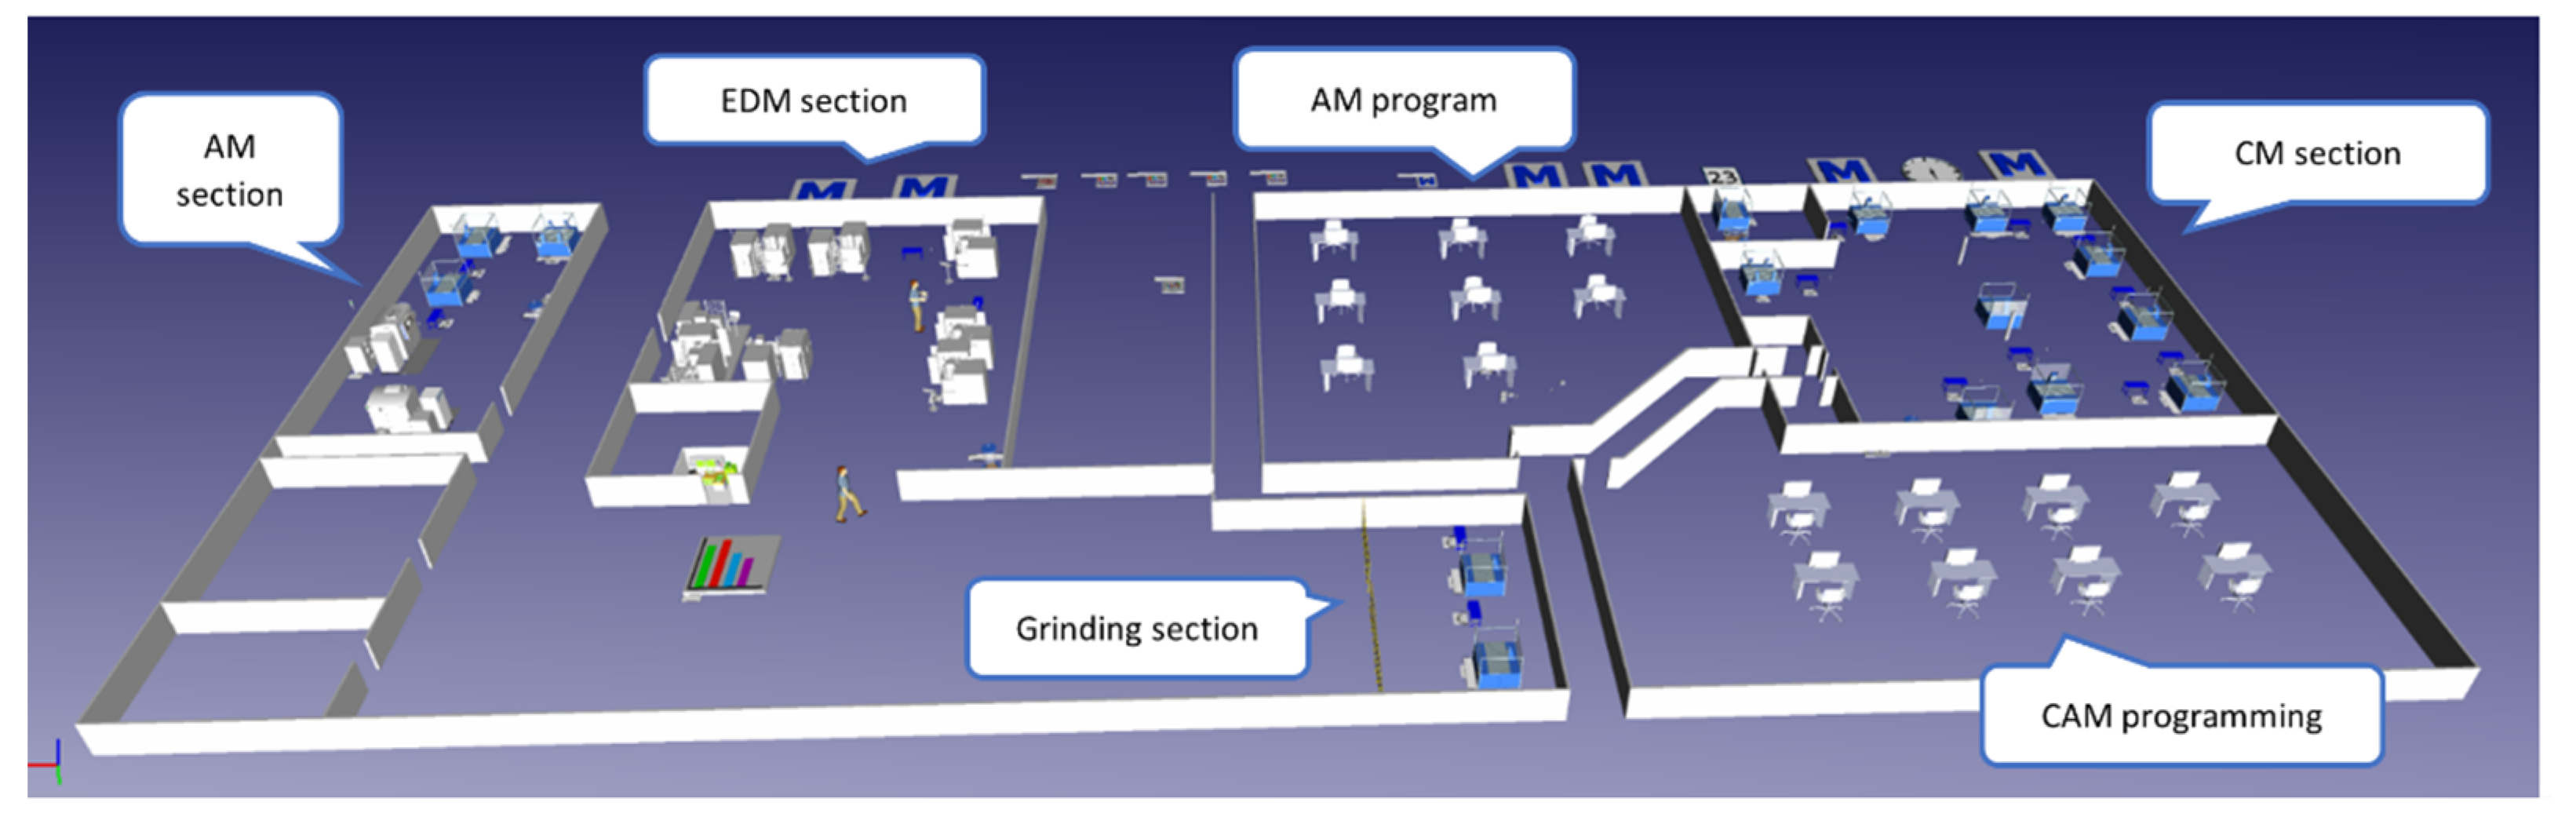
The setup of the simulation model used is presented schematically in
Figure 4, with a 3D view taken from Tecnomatix Plant Simulation. It consists of four main manufacturing areas: CM (three three-axis milling; four five-axis milling machines; and one laser engraver, UC, and QC), AM (two one-laser LPBF machines and one furnace), EDM (four wire cutters and four EDMs), and grinding (two grinding machines).
Three scenarios were considered to evaluate the impact on the production throughput of selecting AM or CM as the manufacturing method:
Scenario 1: one-to-one comparison of the AM and CM flow, with only one machine per type active and performing one step of the process chain;
Scenario 2: an AM-to-CM comparison that includes all of the machines available listed above in the model setup, in order to consider the full factory capabilities;
Scenario 3: focus on the AM process chain flow performance where a third newer machine is added, equipped with four lasers.
Each scenario was run to calculate the number of inserts manufactured in 1 year (considered as 250 days of active work), with the machine running 24 h a day, 7 days a week. A few assumptions were necessary to run the simulation, for example, the heat treatment is a parallel process to the printing and can fit eight inserts at the same time, while the UC can clean four parts at the same time.
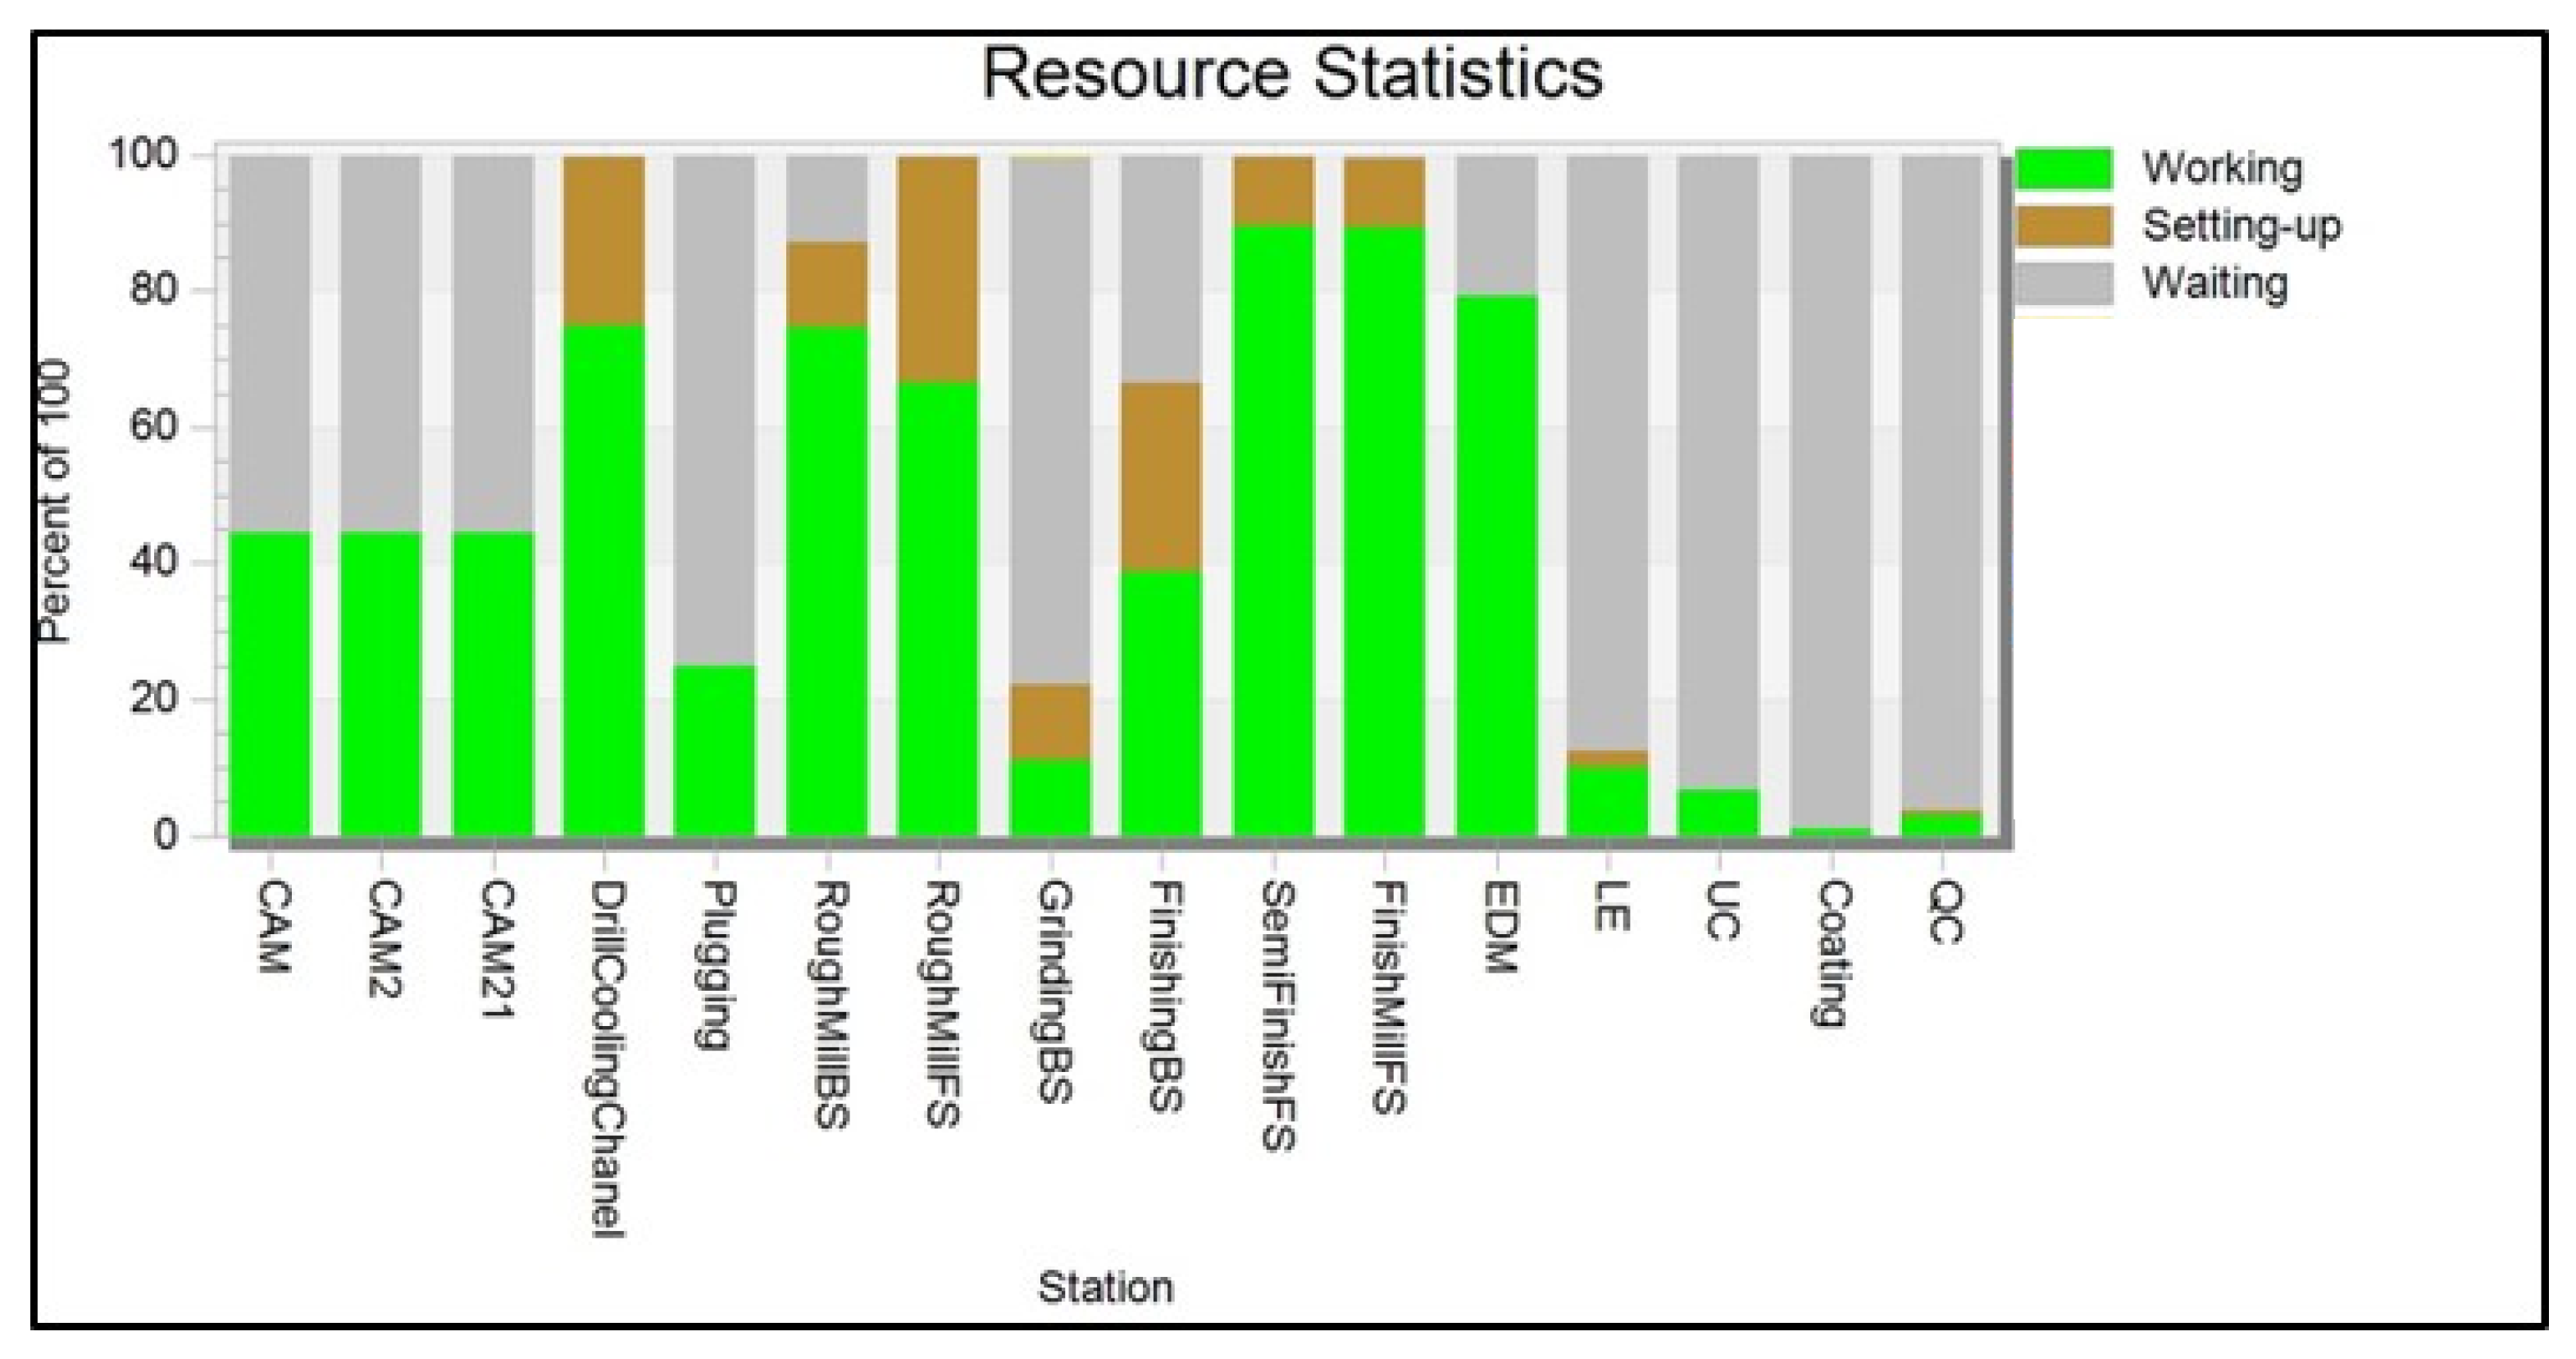
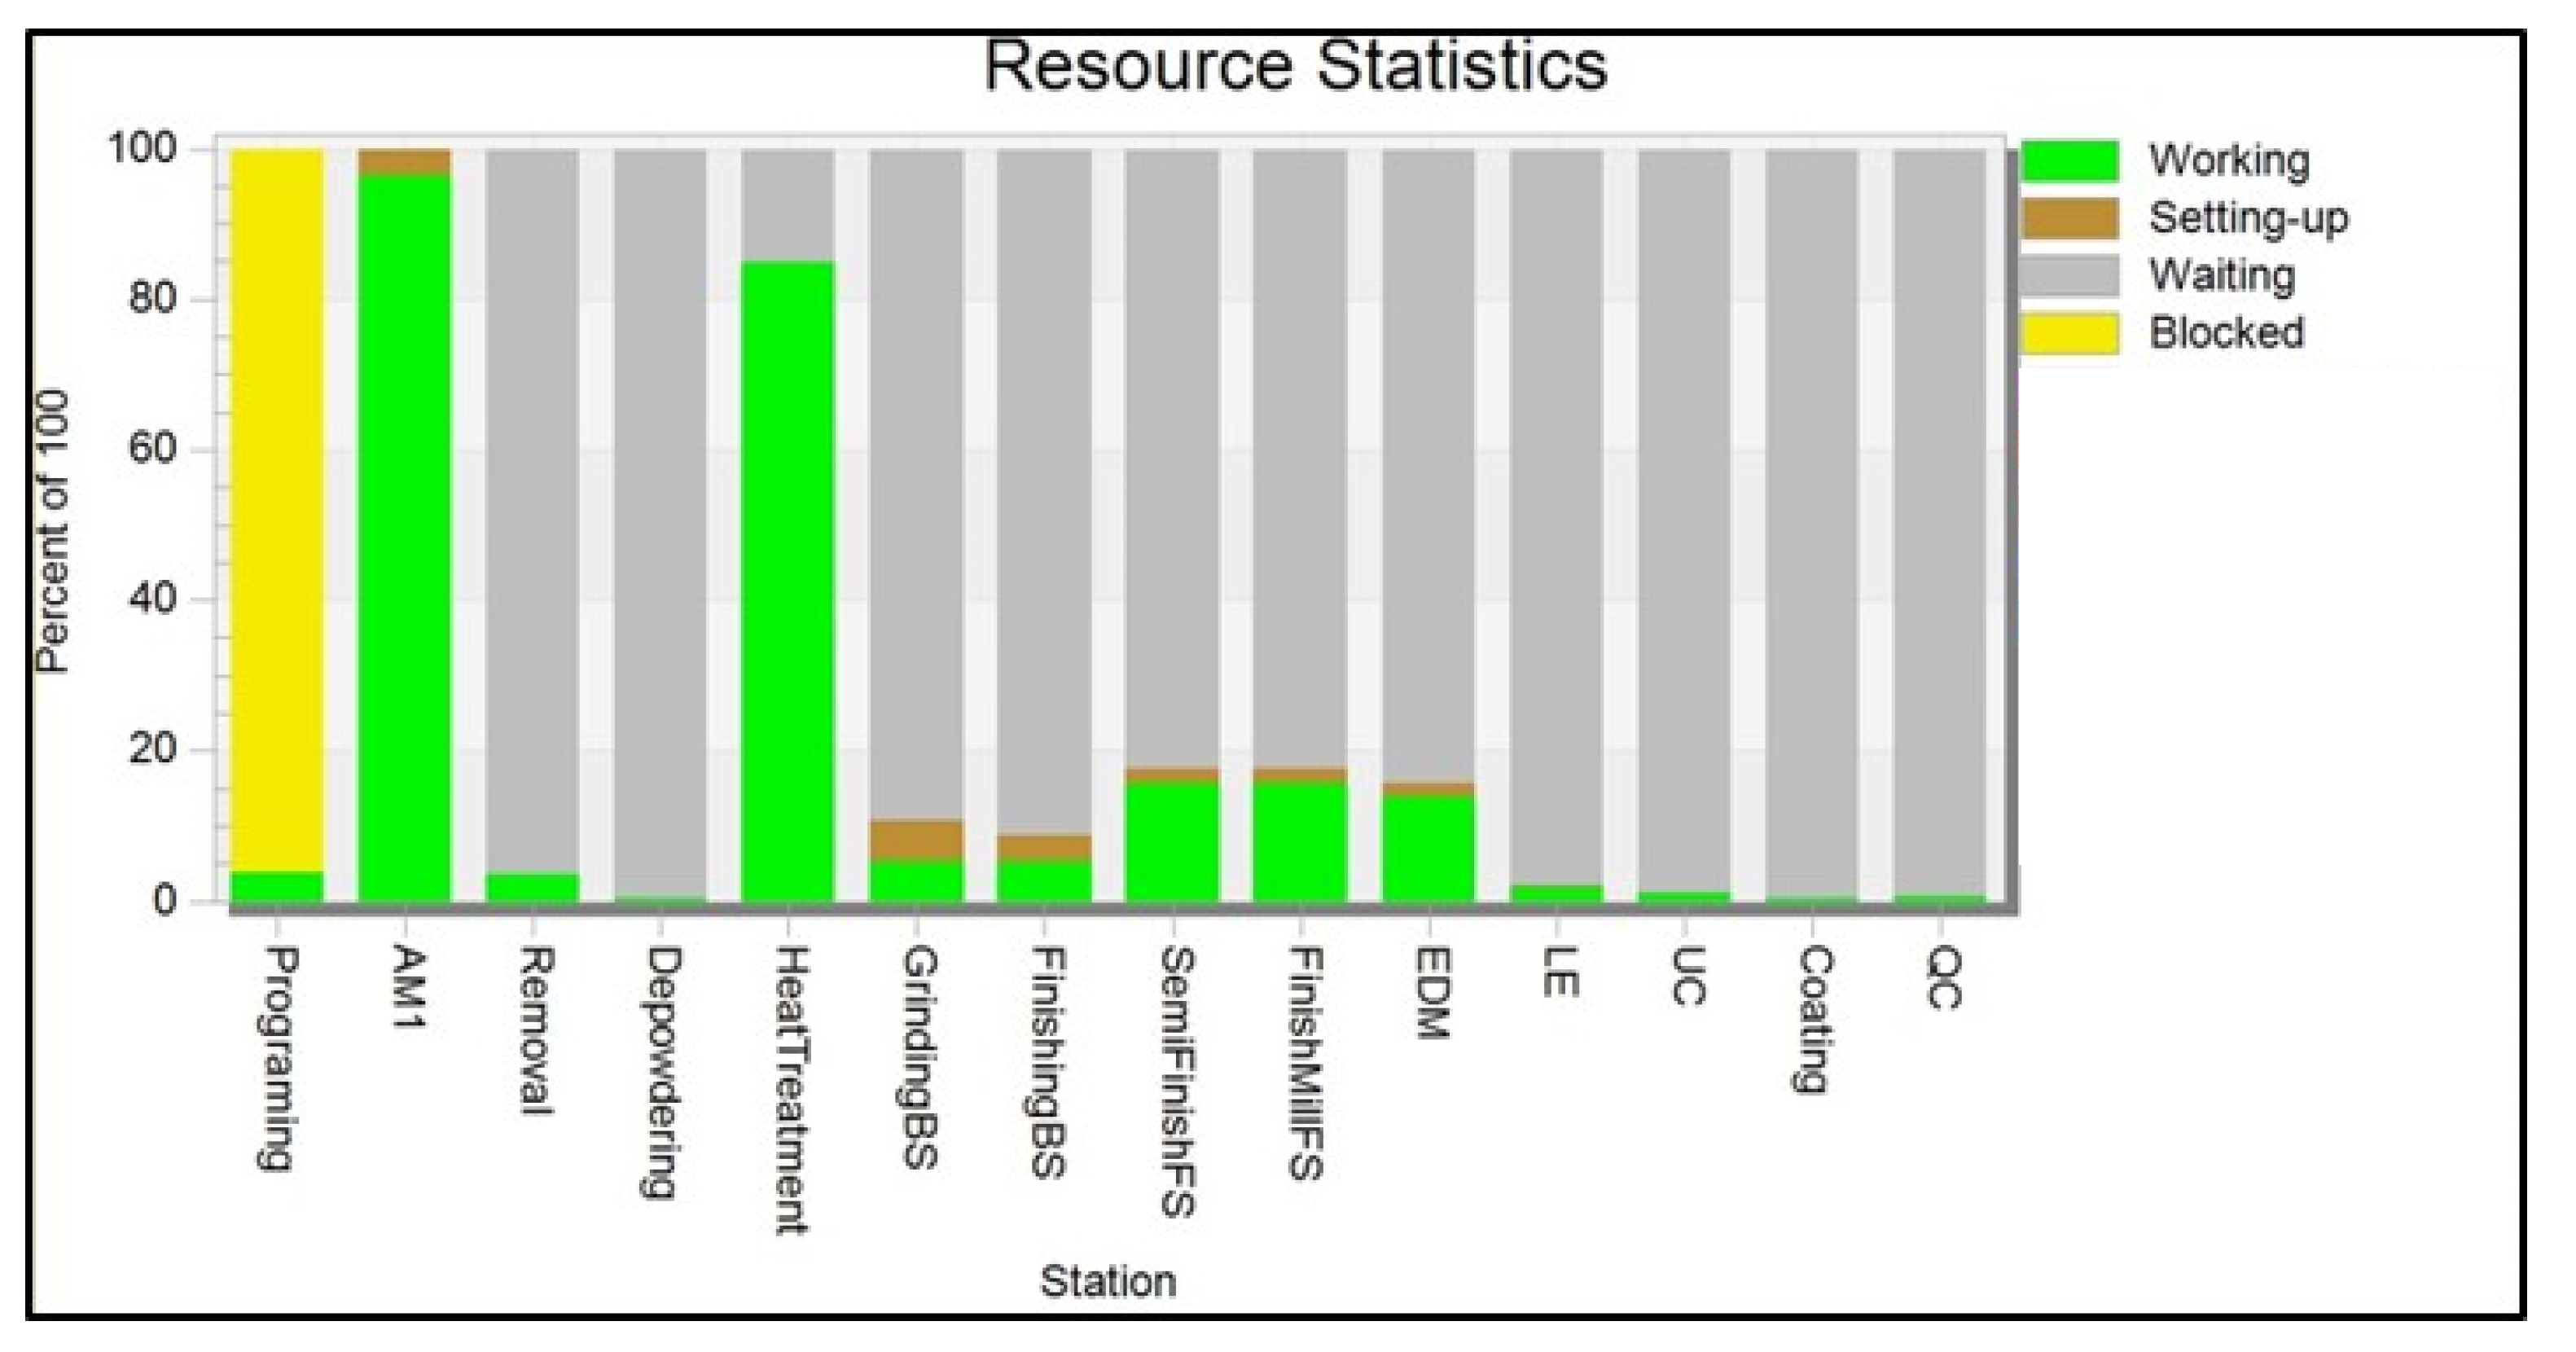
4.1. Scenario 1—AM-to-CM Comparison—One Machine per Type Active
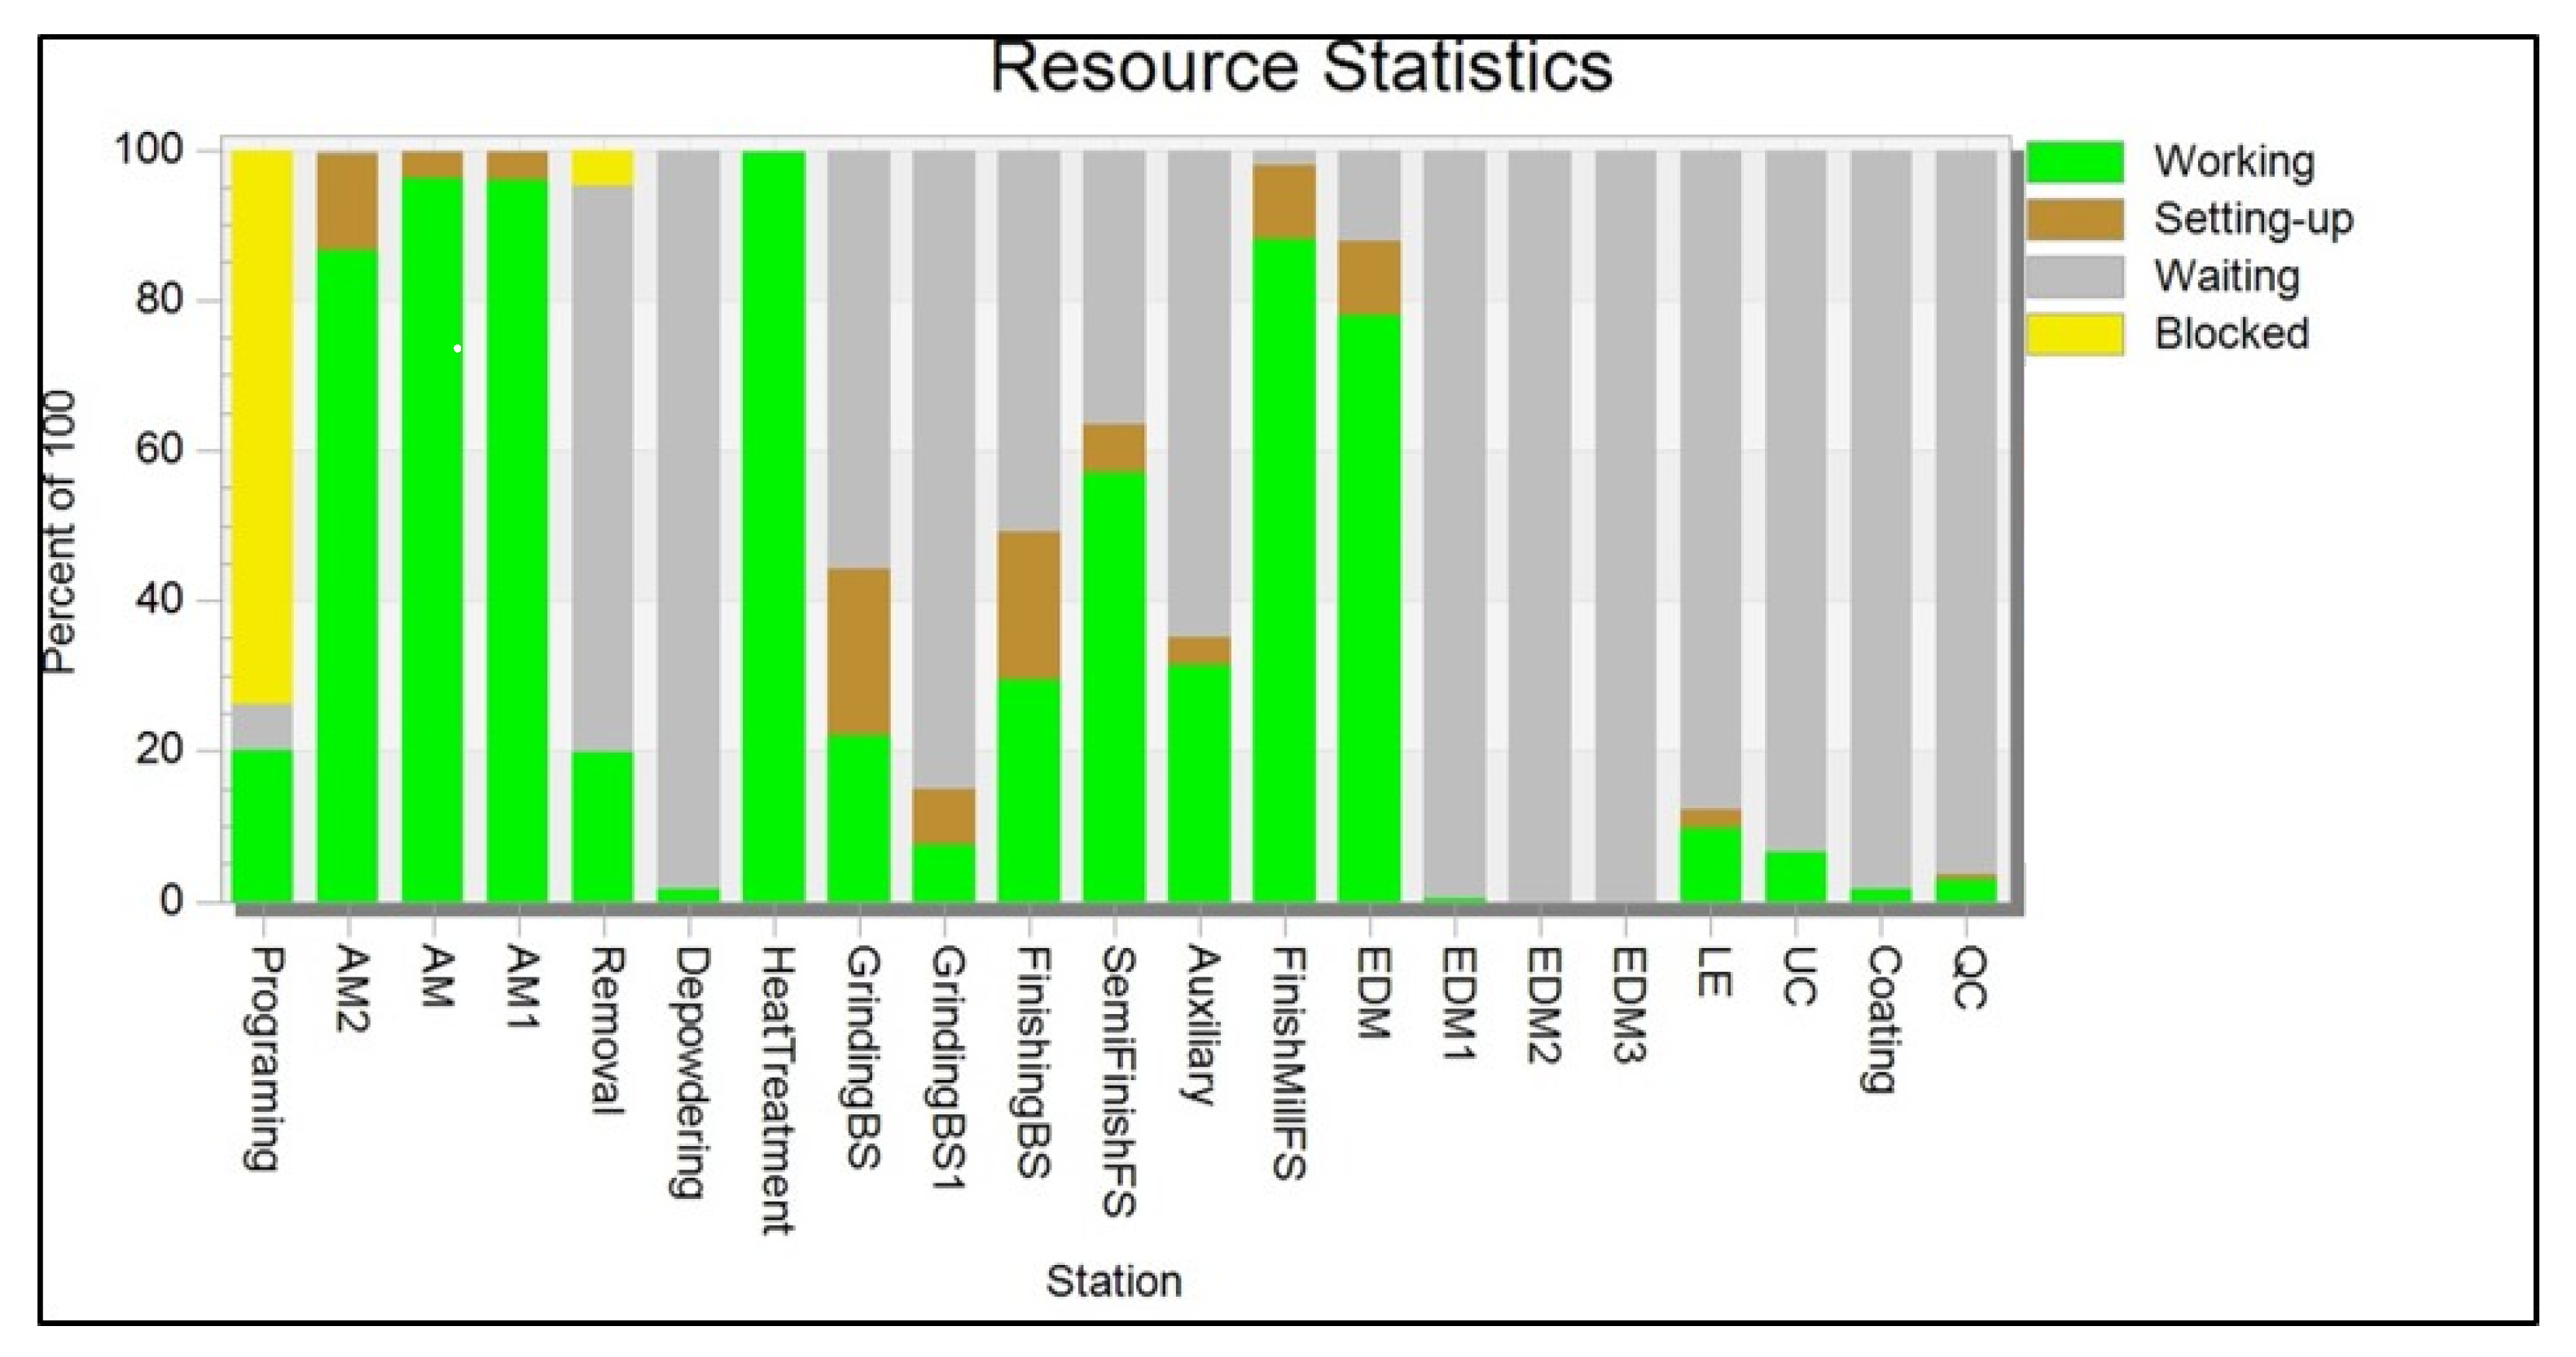
The results collected from running this production simulation for one year are presented in
Figure 5 and
Figure 6 for CM and AM respectively. In this comparison, with the CM workflow, 595 inserts can be produced in one year, while 105 inserts can be produced with the AM process chain. The analysis of the resource shows that the LPBF machine represents the process bottleneck, as this step takes up to 54 h. Hence, the AM machine waiting times block the workflow productivity.
4.2. Scenario 2—AM-CM Comparison—All Machines Active (Full Factory Capability)
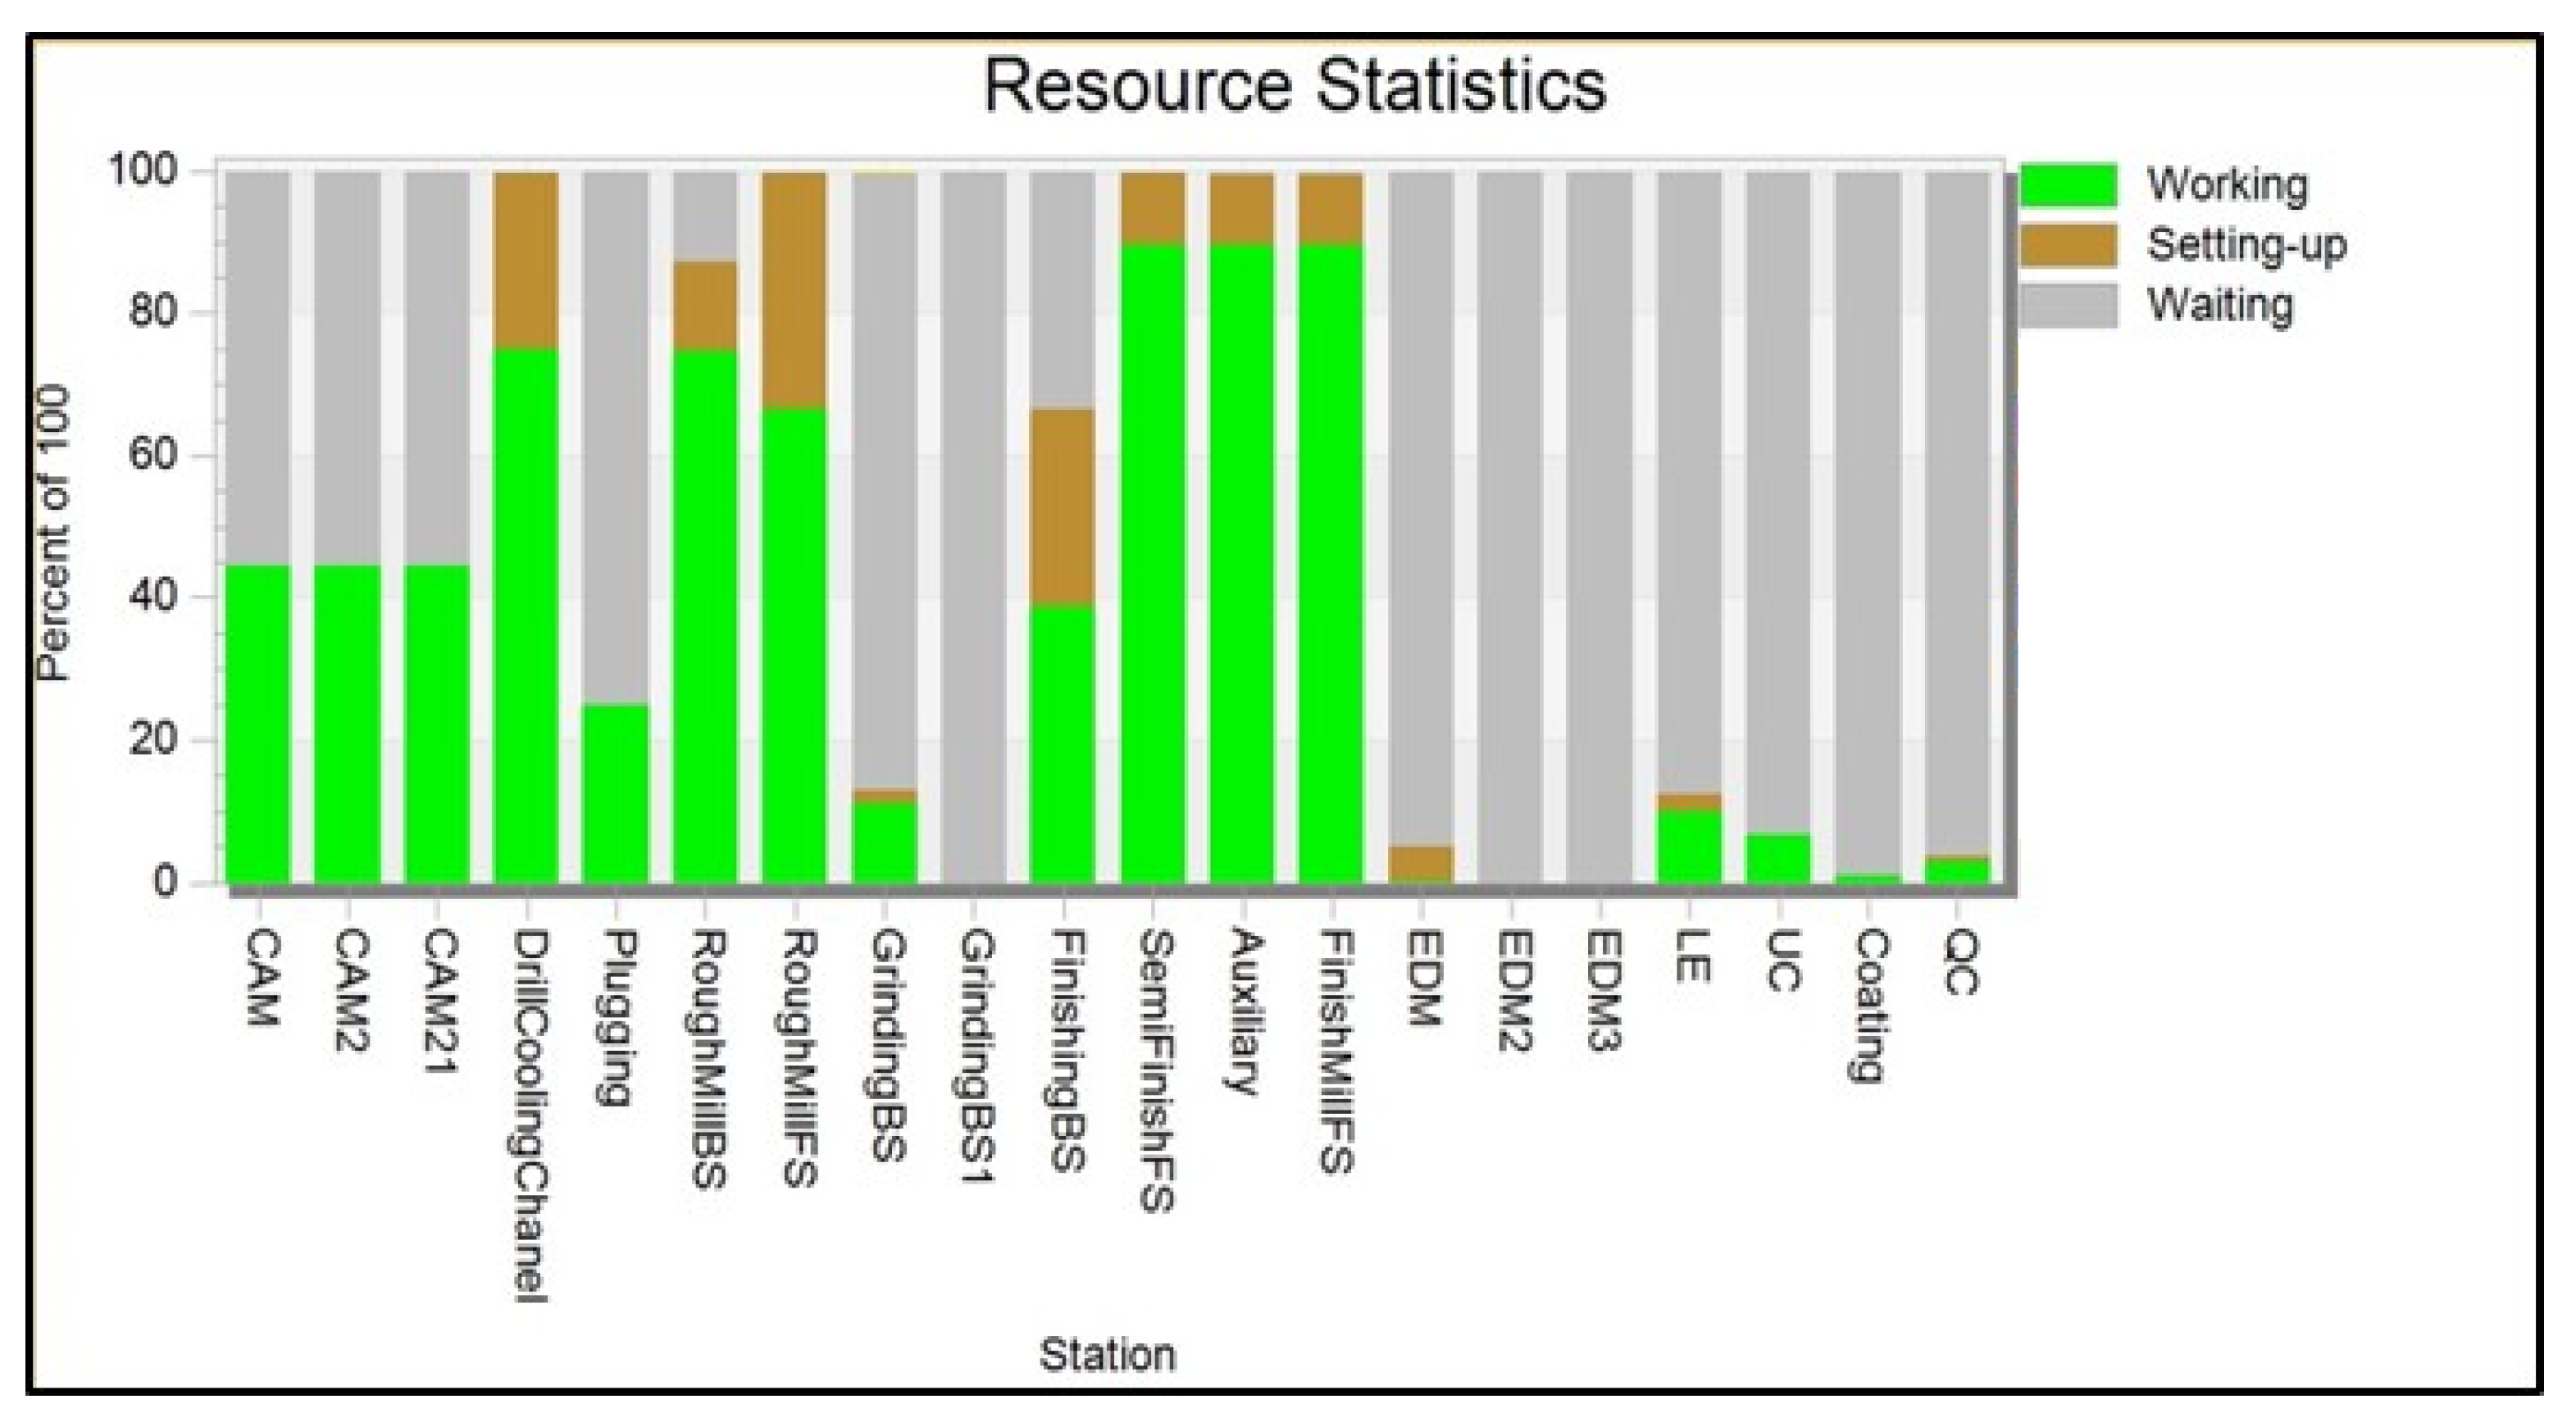
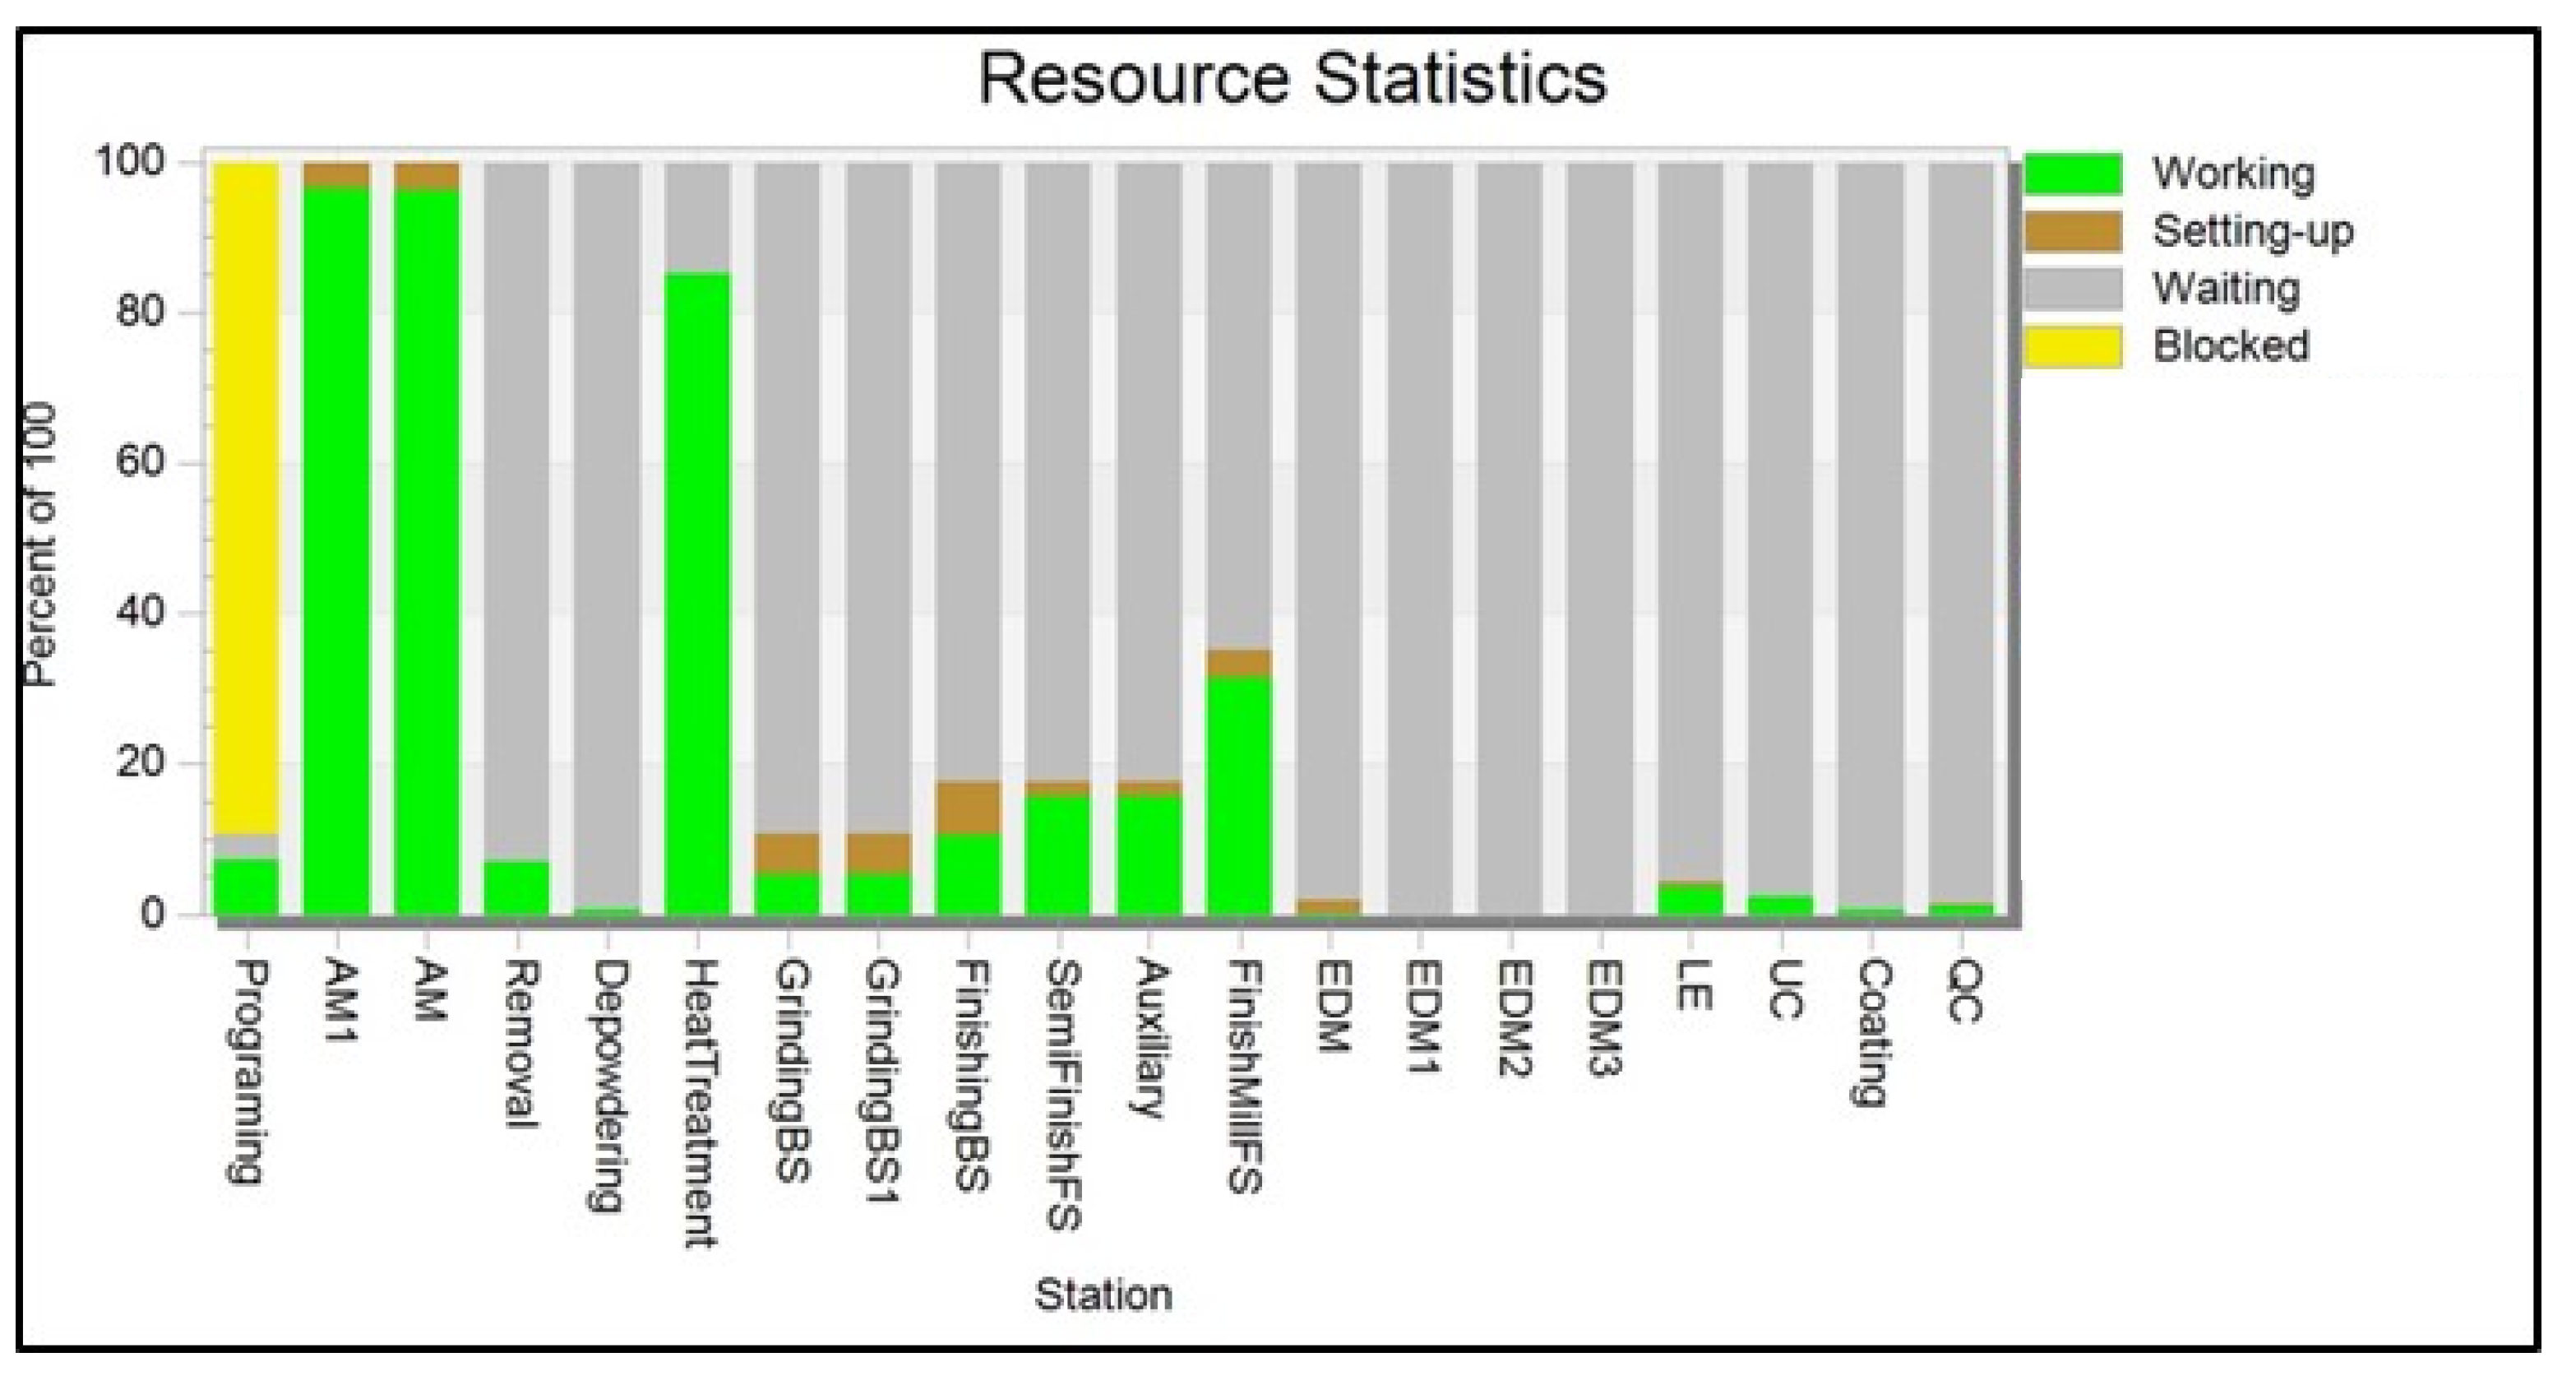
The results of the simulation for one year of production are presented in
Figure 7 and
Figure 8 for CM and AM respectively. The second scenario, in which all machines present at the production site are used, and thus two AM machines are employed, confirms the earlier conclusion that the printing step was the bottleneck; that is, its reduction by adding one extra AM machine almost doubles the throughput for AM (210 inserts). The productivity increase for CM is only marginal (two extra inserts produced compared with scenario 1, or a 0.3% increase). The AM step continues to be a bottleneck in this scenario too, as its occupancy is the highest, blocking the successive steps. An interesting aspect is that the next bottleneck in the flow can already be identified in the heat treatment because of the long time it takes and only one machine being available. One of the reasons that, in the CM manufacturing line, there is not such a big breakthrough compared with AM, despite the addition of an extra grinding and five-axis CNC, is that there are two consecutive bottlenecks: semi-finishing and finishing. These should be removed at the same time to further increase throughput.
4.3. Formatting of Mathematical Components
Only the AM workflow is considered in this scenario. One additional AM machine is included, this time equipped with four lasers, thus being considerably faster (
Figure 9). The bottleneck of the printing step is decreased further, creating a breakthrough in throughput, which rises to 589 inserts per year. As foreseen in the previous simulation, the bottleneck is now definitely represented by the heat treatment, which is working continuously. No more inserts can be produced without reducing the heat treatment procedure and/or purchasing more furnaces. The presence of bottlenecks at the beginning of the manufacturing process means that the laser engraving, UC, and QC equipment are very underutilized.
5. Economic Analysis
The aim of this section is to understand the financial impact of choosing CM or AM routes to tooling fabrications, which is done with a time and cost breakdown for labour and machines for each step. All of the data for each step presented in the previous
Figure 2 and
Figure 3 were collected.
All costs and prices refer to the Danish market. The labour rate is considered to be 650 DKK/h, so a round figure of 88 €/h is used (1 € = 7.4 DKK).
For cost calculation, the AM step is divided into four phases: preparation, setup, build, and removal.
The preparation phase includes the time required to prepare the CAD design and for job preparation, which takes an average of 2 h, depending on the complexity of the design. This phase is thus estimated to cost 176 €;
The setup costs include the machine preparation time, addition of powder, and other general manual preparation, which takes an average of 1 h. The machine then needs to start heating up the build plate and remove the oxygen from the chamber, which will also take approximately 1 h. The AM machine hourly rate needs to be considered for this step and, for a relatively old (≈10 years) and robust machine (including its depreciation), the final cost is of 55 €/h. Thus, the cost of this phase is 143 €;
The build phase needs 54 h for printing the test insert, at the same hourly rate calculated previously. The electricity consumption cost (based on Danish industrial electricity) is 0.0688 €/h, with machine consumption being 3.23 kWh. It is required now to consider the product: the mass of the geometry calculated from the volume of the insert and the density of the material (8100 kg/m3) is multiplied by the cost per kilo of the powder (88 €/kg). The final price of 3392 € is derived by multiplying and summing all of the costs involved;
The final removal phase includes cutting of the parts from the build plate, cleaning leftover powder, and the removal of supports. Overall, it takes approximately 2 h. The heat treatment takes 48 h. The furnace consumption is 15 kWh at the same energy cost. Summing all the activities and costs, the final price is 225 €.
All conventional processes also need to be considered for the CM flow, as well as for the finishing of the AM chain, which uses only five-axis CNC. The machine costs used here are approximations calculated from the external hourly rate for one hour of milling (approximately 101.35 €/h). It is important to consider the cutting tool costs, i.e., drill bits, required to manufacture the inserts. For the three-axis CNC, three tools are required, each costing 402 €, plus a drill bit set of 134 €. An important aspect to consider is how many times the tools are changed per insert produced. Mold makers prefer to change the tools as often as possible, in order to ensure the highest quality of the products. This means that a set of tools can be used to manufacture one or two inserts only. If each set of tools is used for two inserts, then the final figure for tools’ costs for three-axis manufacturing is 675.68 €. A similar calculation was performed for the five-axis machine operations, which require five tools that each cost 402 €, with the final price being 103,151 €. An extra cost of 402 € needs to be added for the CM manufacturing flow to take into account the price of the initial block of steel. Given the processing time reported in
Table 1, the final costs are 4193 € for the AM finishing steps and 8017 € for the full CM production stream.
The two products (made with the AM and CM process chain, respectively) converged at this point, and not relevant cost variation can be found for the last steps of the chain. The EDM steps cover both spark erosion, used to obtain the desired shape and surface of the cavity, and wire-cutting, employed to refine the holes in the insert. The EDM spark erosion also requires the design and manufacture of copper electrodes by milling that, together with CAM programming, takes around 5.5 h. The material cost is calculated considering between 8 and 10 electrodes per insert, with each block of copper costing 67 €, giving a total value of 608 €. The total cost associated with the EDM then becomes 3118 €.
Regarding the quality control step, again it is the same for both AM and CM. Roughly 5 min is necessary to manually prepare the products for the 3D scanner (machine cost of 34 €/h), which takes an average of 17 min to complete. Ultrasonic cleaning (machine cost of 40 €/h) takes 40 min. The machine costs are calculated by dividing the initial purchase price by the number of depreciation years multiplied by the number of working hours per year. In total, the cleaning and quality control phase costs 44 €.
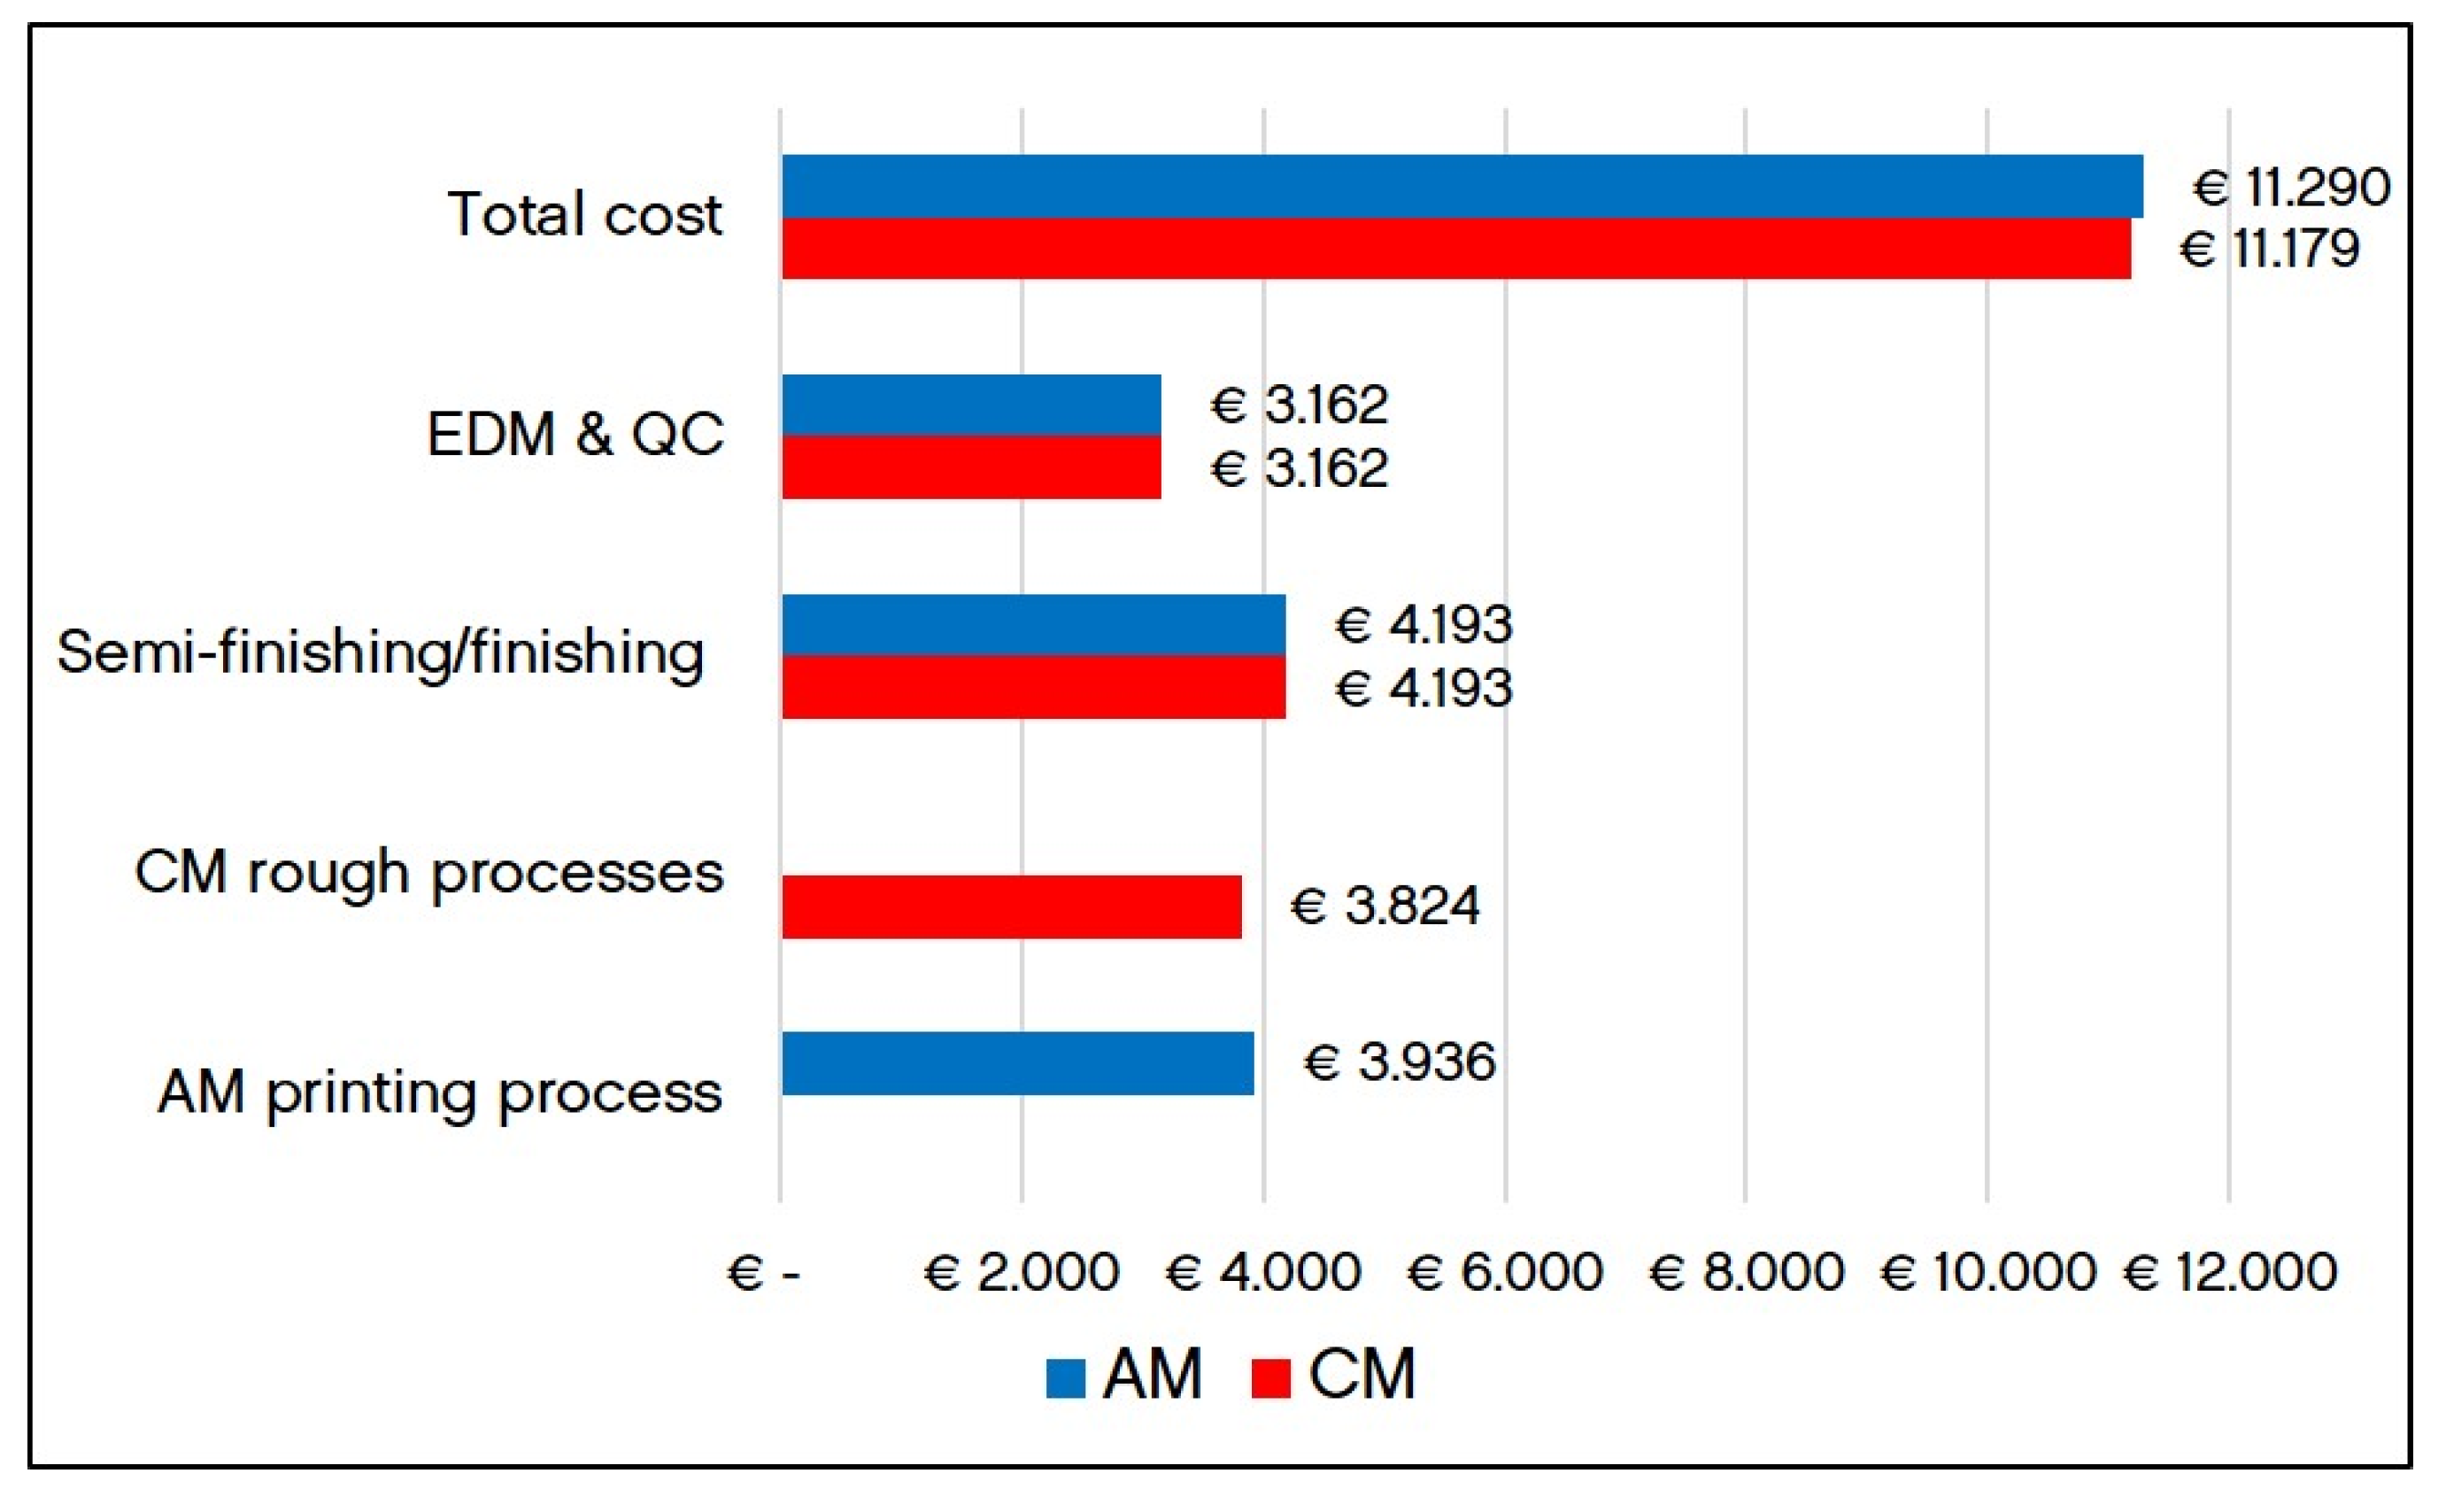
The total costs involved are summarized in
Table 2 and in the graph in
Figure 10.
6. Results and Discussion
The result is that the total costs for an insert made by AM and CM are comparable, while the common thinking is that AM products are more expensive to produce [
7]. The fact that they are comparable can be related to the cost associated with the cutting tools for the machining step, which represent a big proportion of the final price, and often their impact is either not included or considerably underestimated.
If we consider that cutting tools are changed for every insert, the calculation will actually show a total cost of 12,304 € for AM and 12,868 € for CM. In this case, the AM product is cheaper than the CM product, thanks to the production of a near-net shape component. It is, therefore, essential to strictly monitor the wear and the changeover of cutting tools to avoid unexpected costs.
Another consideration is the amount of time dedicated to labor and machine time for each stream. With a one-laser LPBF machine for AM, the total lead time is longer than CM (167 h against 88 h), but 89% of the AM time is taken by the machines working unsupervised. On the CM flow, only 68% is only machine time. Another consideration is the use of a newer LPBF machine for the AM chain, for example, equipped with four lasers, which would make the printing approximately 3.5 to 4 times faster.
It is important to consider that the final AM and CM product is not the same. AM allows to produce a mold insert that has double the number of cavities, and thus improves the performance in the injection molding phase. As a rough evaluation, it was known that the CM insert (16 cavities) has a cycle time of 9.1 s, while the AM insert (32 cavities) has a cycle time of 10.1 s. Considering an insert lifetime of 10 million shots, this corresponds to 117 continuous days for the AM insert and 105 days for the CM insert. With a difference 12 days, 160 million more molded elements can be produced with the AM insert. That also means that, during the same production time, e.g., 100 days, the AM and CM tool inserts will have potentially produced close to 27.4 and 15.2 million parts, respectively, with a potential productivity increase of 80.2% during the same production time of the AM inserts compared with the CM inserts.
7. Conclusions
This research presents an investigation into the process chains based on AM and CM manufacturing paths for the production of tooling, in particular multi-cavity mold inserts for plastic injection molding. A detailed technology and economic analysis was conducted to understand the impact of the choice.
One of the main conclusions of this project is the renewed highlighted importance of keeping a holistic vision of the complete process chains, in order to give an objective evaluation, potentially also including the performance of the manufactured tools in their intended final application. As demonstrated in this research, often (but not always), manufacturing a mold insert additively may incur higher production costs, but such a higher initial cost is completely paid back by the enhanced final performance, in this case represented by the productivity of the tool in terms of injection molded plastic components within the same production time.
The technological analysis demonstrated the production capabilities of the two streams, identifying the bottlenecks, and the results of the simulation showed how to potentially eliminate them (i.e., using newer AM machine with a higher number of lasers, adding more furnaces).
The aim of this study was not to recommend one technology path over the other, but rather to analyze in detail both process chains. The analysis helped to highlight the relatively high importance of costs that are often neglected (such as the change in the cost of cutting tools due to wear). Here, it was demonstrated that they play a considerable part in the final cost. However, a challenge faced during this exploration was in the data collection itself, as some of the data used in the comparison came from the literature or, alternatively, from user experience. The quality and truthfulness of the comparison, when looking at a real factory environment, will increase if only historical quantitative data are used. Still, the relevance of the data highly depends on the level of digitalization of the considered factory. Potential future research on this field could start from a work similar to [
32] to develop a tool specialized for mold components in order to (i) compare the CM and AM process chains, as well as to (ii) support the engineers in the selection of the best method for each tool component during the design of the injection mold.
As a next investigation, it would be worth analyzing more in depth the design process and programming phase, which are executed at the computer, for preparing the design and the machines’ programs to perform the job, as different types of software and skills level are required, and different levels of design complexities are involved for the two manufacturing flows. In the current work, the design approach for the AM and CM component was in fact the same. However, it has been demonstrated in previous research that, by adopting a design with the AM (DfAM) approach, a better trade-off between performance and manufacturing costs can be achieved [
33].
Lastly, a final observation should be made in regard to the process technology maturity and the product complexities, whose considerations also represented a challenge of this investigation. AM- and CM-based process chains were compared in this analysis as if they were producing the exact same product. This was, however, not the case, as demonstrated by the final performance. The AM design could have been even further improved, for example, by topology optimization, as investigated in a similar case study by Sinico et al. in [
34], to reduce weight and, consequently, the printing time. A similar investigation with a focus on the possible workflow to adopt for redesigning components to fully exploits the AM technology potential was conducted by Dalpadulo et al. in [
35]. In addition to topology optimization, another DfAM area that could be further investigated for application areas, such as injection molding, is the possibility of part consolidation. A design method to explore this area was proposed by Kim et al. in [
36].
The comparison was, despite the mentioned differences, carried out in the same way. The processes also compared CNC and LPBF, which have very different levels of technological advancement and industrial maturity. LPBF might reach the same level as CNC in the next decade, improving its performance further.
Author Contributions
Conceptualization, M.M., M.R., M.S. and G.T.; methodology, M.M., M.R., M.S., A.A.M. and A.B.; software, M.M., M.R., M.S. and A.A.M.; validation, M.M., M.R., M.S. and A.A.M.; investigation, M.M., M.R. and M.S.; resources, M.M.; data curation, M.M., M.R. and M.S.; writing—original draft preparation, M.M.; writing—review and editing, M.M., M.R., M.S., A.A.M., A.B. and G.T.; supervision, M.M., A.B. and G.T.; project administration, M.M.; funding acquisition, G.T. All authors have read and agreed to the published version of the manuscript.
Funding
The project received funding from the European Union’s Horizon 2020 Marie Sklodowska-Curie grant agreement No. 721383, for the Precision Additive Metal Manufacturing (PAM2) project (
https://pam2.eu/, accessed on 12/10/2022).
Institutional Review Board Statement
Not applicable.
Informed Consent Statement
Not applicable.
Data Availability Statement
Not applicable.
Acknowledgments
The authors are grateful to all of the people in the manufacturing company who supported this research by sharing their valuable experience and advice.
Conflicts of Interest
The authors declare no conflict of interest. The funders had no role in the design of the study; in the collection, analyses, or interpretation of data; in the writing of the manuscript; or in the decision to publish the results.
References
- Cicconi, P.; Mandolini, M.; Favi, C.; Campi, F.; Germani, M. Metal Additive Manufacturing for the Rapid Prototyping of Shaped Parts: A Case Study. Comput.-Aided Des. Appl. 2021, 18, 1061–1079. [Google Scholar] [CrossRef]
- Blakey-Milner, B.; Gradl, P.; Snedden, G.; Brooks, M.; Pitot, J.; Lopez, E.; Leary, M.; Berto, F.; Plessis, A. Metal additive manufacturing in aerospace: A review. Mater. Des. 2021, 209, 110008. [Google Scholar] [CrossRef]
- Altaf, K.; Abdul-Rani, A.-M.; Raghavan, V. Prototype production and experimental analysis for circular and profiled conformal cooling channels in aluminium filled epoxy injection mould tools. Rapid Prototyp. J. 2013, 19, 220–229. [Google Scholar] [CrossRef]
- Lindemann, C.; Jahnke, U.; Moi, M.; Koch, R. Analyzing product lifecycle costs for a better understanding of cost drivers in additive manufacturing. In Proceedings of the 23rd Annual Internatio Solid Freeform Fabrication Symposium—An Additive Manufacturing Conference, Austin, TX, USA, 6–8 August 2012; pp. 177–188. [Google Scholar]
- Diegel, O.; Nordin, A.; Motte, D. A Practical Guide to Design for Additive Manufacturing; Springer: Singapore, 2019. [Google Scholar] [CrossRef]
- Park, H.S.; Dang, X.P.; Nguyen, D.S.; Kumar, S. Design of advanced injection mold to increase cooling efficiency. Int. J. Precis. Eng. Manuf. 2020, 7, 319–328. [Google Scholar] [CrossRef]
- Quinlan, H.E.; Hasan, T.; Jaddou, J.; Hart, A.J. Industrial and Consumer Uses of Additive Manufacturing: A Discussion of Capabilities, Trajectories, and Challenges. J. Ind. Ecol. 2017, 21, 15–20. [Google Scholar] [CrossRef] [Green Version]
- Lolli, F.; Coruzzolo, A.M.; Peron, M.; Sgarbossa, F. Age-based preventive maintenance with multiple printing options. Int. J. Prod. Econ. 2022, 243, 108339. [Google Scholar] [CrossRef]
- Sgarbossa, F.; Peron, M.; Lolli, F.; Balugani, E. Conventional or additive manufacturing for spare parts management: An extensive comparison for Poisson demand. Int. J. Prod. Econ. 2021, 233, 107993. [Google Scholar] [CrossRef]
- Cantini, A.; Peron, M.; De Carlo, F.; Sgarbossa, F. A decision support system for configuring spare parts supply chains considering different manufacturing technologies. Int. J. Prod. Res. 2022, 1–21. [Google Scholar] [CrossRef]
- Kokareva, V.V.; Malyhin, A.N.; Smelov, V.G. Production Processes Management by Simulation in Tecnomatix Plant Simulation. Appl. Mech. Mater. 2015, 756, 604–609. [Google Scholar] [CrossRef]
- Arunkumar, Y.; Patil, R.; Mohankumar, S. Discrete Event Simulation for Increasing Productivity in Digital Manufacturing. SSRN Electron. J. 2012, 1, 36–40. [Google Scholar] [CrossRef] [Green Version]
- Siemens PLM. Tecnomatix. Available online: https://www.plm.automation.siemens.com/global/en/products/manufacturing-planning/plant-simulation-throughput-optimization.html (accessed on 13 July 2022).
- Kłos, S.; Trebuna, P. The impact of the availability of resources, the allocation of buffers and number of workers on the effectiveness of an assembly manufacturing system. Manag. Prod. Eng. Rev. 2017, 8, 40–49. [Google Scholar] [CrossRef] [Green Version]
- Pekarčíková, M.; Trebuňa, P.; Liaposhchenko, O.; Petrik, M. Increasing the efficiency of logistics flow in production system by the software tool tecnomatix process simulate. In Proceedings of the 3rd EAI International Conference on Management of Manufacturing Systems, Dubrovnik, Croatia, 6–8 November 2018. [Google Scholar] [CrossRef] [Green Version]
- Václav, Š.; Lecký, Š.; Senderská, K.; Mareš, A. Simulation as a support tool in assembly systems planning. MATEC Web Conf. 2017, 137, 04008. [Google Scholar] [CrossRef] [Green Version]
- Fedorko, G.; Honus, S.; Badiarová, S. Analysis of the utilization of machinery in the production process using computer simulation. MATEC Web Conf. 2017, 134, 00012. [Google Scholar] [CrossRef] [Green Version]
- Stoldt, J.; Schlegel, A.; Putz, M. Enhanced integration of energy-related considerations in discrete event simulation for manufacturing applications. J. Simul. 2016, 10, 113–122. [Google Scholar] [CrossRef]
- Kliment, M.; Popovič, R.; Janek, J. Analysis of the production process in the selected company and proposal a possible model optimization through PLM software module Tecnomatix Plant Simulation. Procedia Eng. 2014, 96, 221–226. [Google Scholar] [CrossRef] [Green Version]
- Trebuňa, P.; Kliment, M.; Edl, M.; Petrik, M. Creation of simulation model of expansion of production in manufacturing companies. Procedia Eng. 2014, 96, 477–482. [Google Scholar] [CrossRef] [Green Version]
- Kadir, A.Z.A.; Yusof, Y.; Saidin Wahab, M. Additive manufacturing cost estimation models—A classification review. Int. J. Adv. Manuf. Technol. 2020, 107, 4033–4053. [Google Scholar] [CrossRef]
- Moshiri, M.; Loaldi, D.; Zanini, F.; Sgaravato, D.; Carmignato, S.; Tosello, G. Analysis of an as-built metal additively manufactured tool cavity insert performance and advantages for plastic injection moulding. J. Manuf. Proc. 2021, 61, 369–382. [Google Scholar] [CrossRef]
- Fera, M.; Fruggiero, F.; Costabile, G.; Lambiase, A.; Pham, D.T. A new mixed production cost allocation model for additive manufacturing (MiProCAMAM). Int. J. Adv. Manuf. Technol. 2017, 92, 4275–4291. [Google Scholar] [CrossRef]
- Baldinger, M.; Levy, G.; Schönsleben, P.; Wandfluh, M. Additive manufacturing cost estimation for buy scenarios. Rapid Prototyp. J. 2016, 22, 871–877. [Google Scholar] [CrossRef]
- Savolainen, J.; Collan, M. How Additive Manufacturing Technology Changes Business Models?—Review of Literature. Addit. Manuf. 2020, 32, 101070. [Google Scholar] [CrossRef]
- Sinico, M.; Ranjan, R.; Moshiri, M.; Ayas, C.; Langelaar, M.; Witvrouw, A.; van Keulen, F.; Dewulf, W. A mold insert case study on Topology Optimized design for Additive Manufacturing. In Proceedings of the 30th Annual International Solid Freeform Fabrication Symposium—An Additive Manufacturing Conference, Austin, TX, USA, 12–14 August 2019. [Google Scholar]
- Bangsow, S. Tecnomatix Plant Simulation; Springer International Publishing: Cham, Switzerland, 2016. [Google Scholar] [CrossRef]
- Dennis, P. Lean Production Simplified: A Plain Language Guide to the World’s Most Powerful Production System; Productivity Press: New York, NY, USA, 2002. [Google Scholar]
- Nash, M.A.; Poling, S.R. Mapping the Total Value Stream; Productivity Press: New York, NY, USA, 2008. [Google Scholar] [CrossRef]
- Borris, S. Total Productive Maintenance; McGraw-Hill: New York, NY, USA, 2006. [Google Scholar]
- Agustiady, T.K.; Cudney, E.A. Total Productive Maintenance: Strategies and Implementation Guide; CRC Press Taylor & Francis Group: Boca Raton, FL, USA, 2015. [Google Scholar]
- Westerweel, B.; Basten, R.J.; van Houtum, G.J. Traditional or additive manufacturing? Assessing component design options through lifecycle cost analysis. Eur. J. Oper. Res. 2018, 270, 570–585. [Google Scholar] [CrossRef] [Green Version]
- Sbrugnera Sotomayor, N.A.; Caiazzo, F.; Alfieri, V. Enhancing Design for Additive Manufacturing Workflow: Optimization, Design and Simulation Tools. Appl. Sci. 2021, 11, 6628. [Google Scholar] [CrossRef]
- Sinico, M.; Ranjan, R.; Moshiri, M.; Ayas, C.; Langelaar, M.; van Keulen, F.; Dewulf, W.; Witvrouw, A. Improving the manufacturability of metal AM parts. Mikroniek 2019, 5, 23–28. [Google Scholar]
- Dalpadulo, E.; Gherardini, F.; Pini, F.; Leali, F. Integration of Topology Optimisation and Design Variants Selection for Additive Manufacturing-Based Systematic Product Redesign. Appl. Sci. 2020, 10, 7841. [Google Scholar] [CrossRef]
- Kim, S.; Moon, S.K. A Part Consolidation Design Method for Additive Manufacturing based on Product Disassembly Complexity. Appl. Sci. 2020, 10, 1100. [Google Scholar] [CrossRef]
| Publisher’s Note: MDPI stays neutral with regard to jurisdictional claims in published maps and institutional affiliations. |
© 2022 by the authors. Licensee MDPI, Basel, Switzerland. This article is an open access article distributed under the terms and conditions of the Creative Commons Attribution (CC BY) license (https://creativecommons.org/licenses/by/4.0/).


 ,
, 


