
Simulation Study on Crack Initiation and Energy Mechanisms of Rock-like Samples with Non-Parallel Overlapping Flaws under Uniaxial Compression
Abstract
:1. Introduction
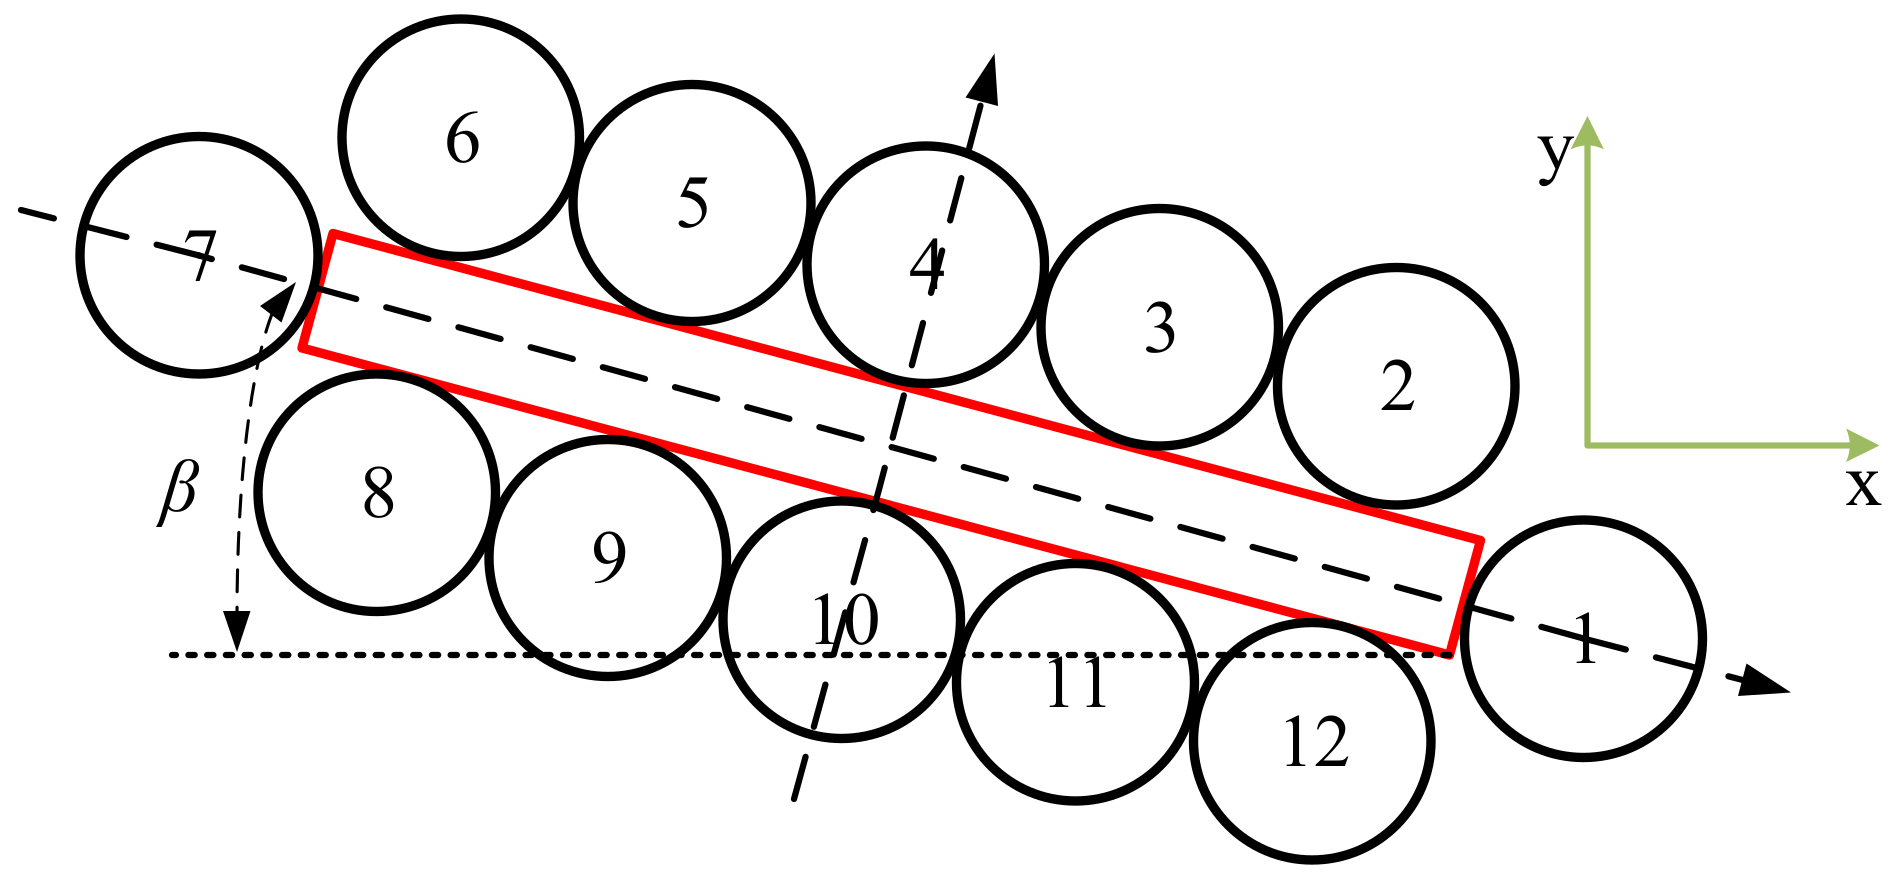
2. Establishment of Numerical Model with Non-Parallel Overlapping Flaws
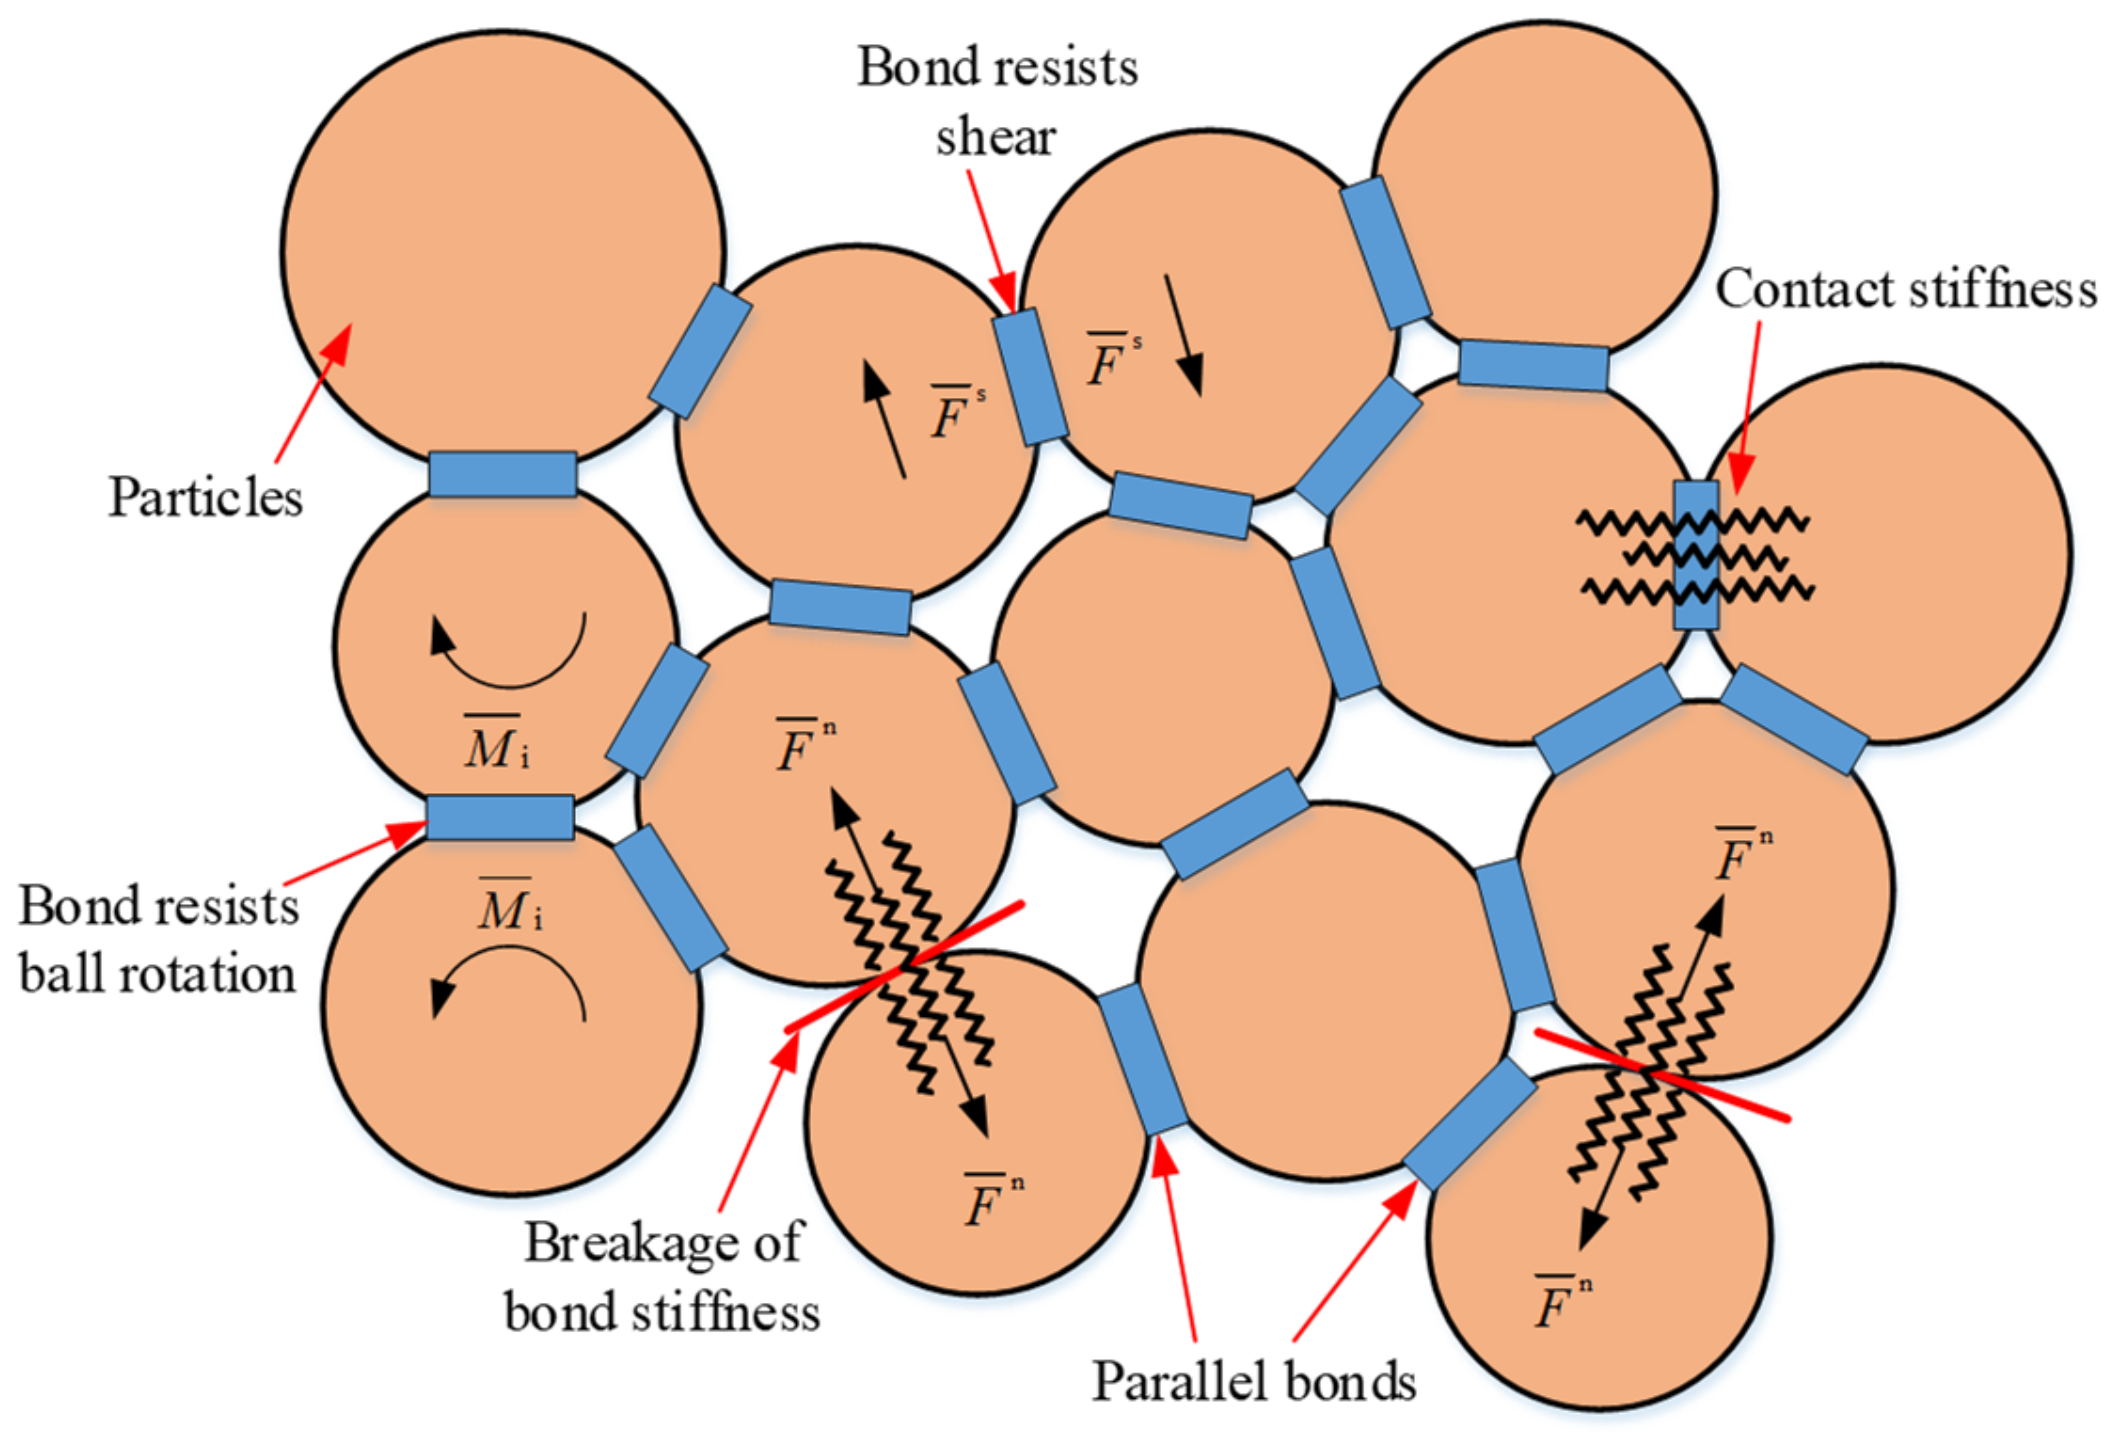
2.1. Selection of Contact Model
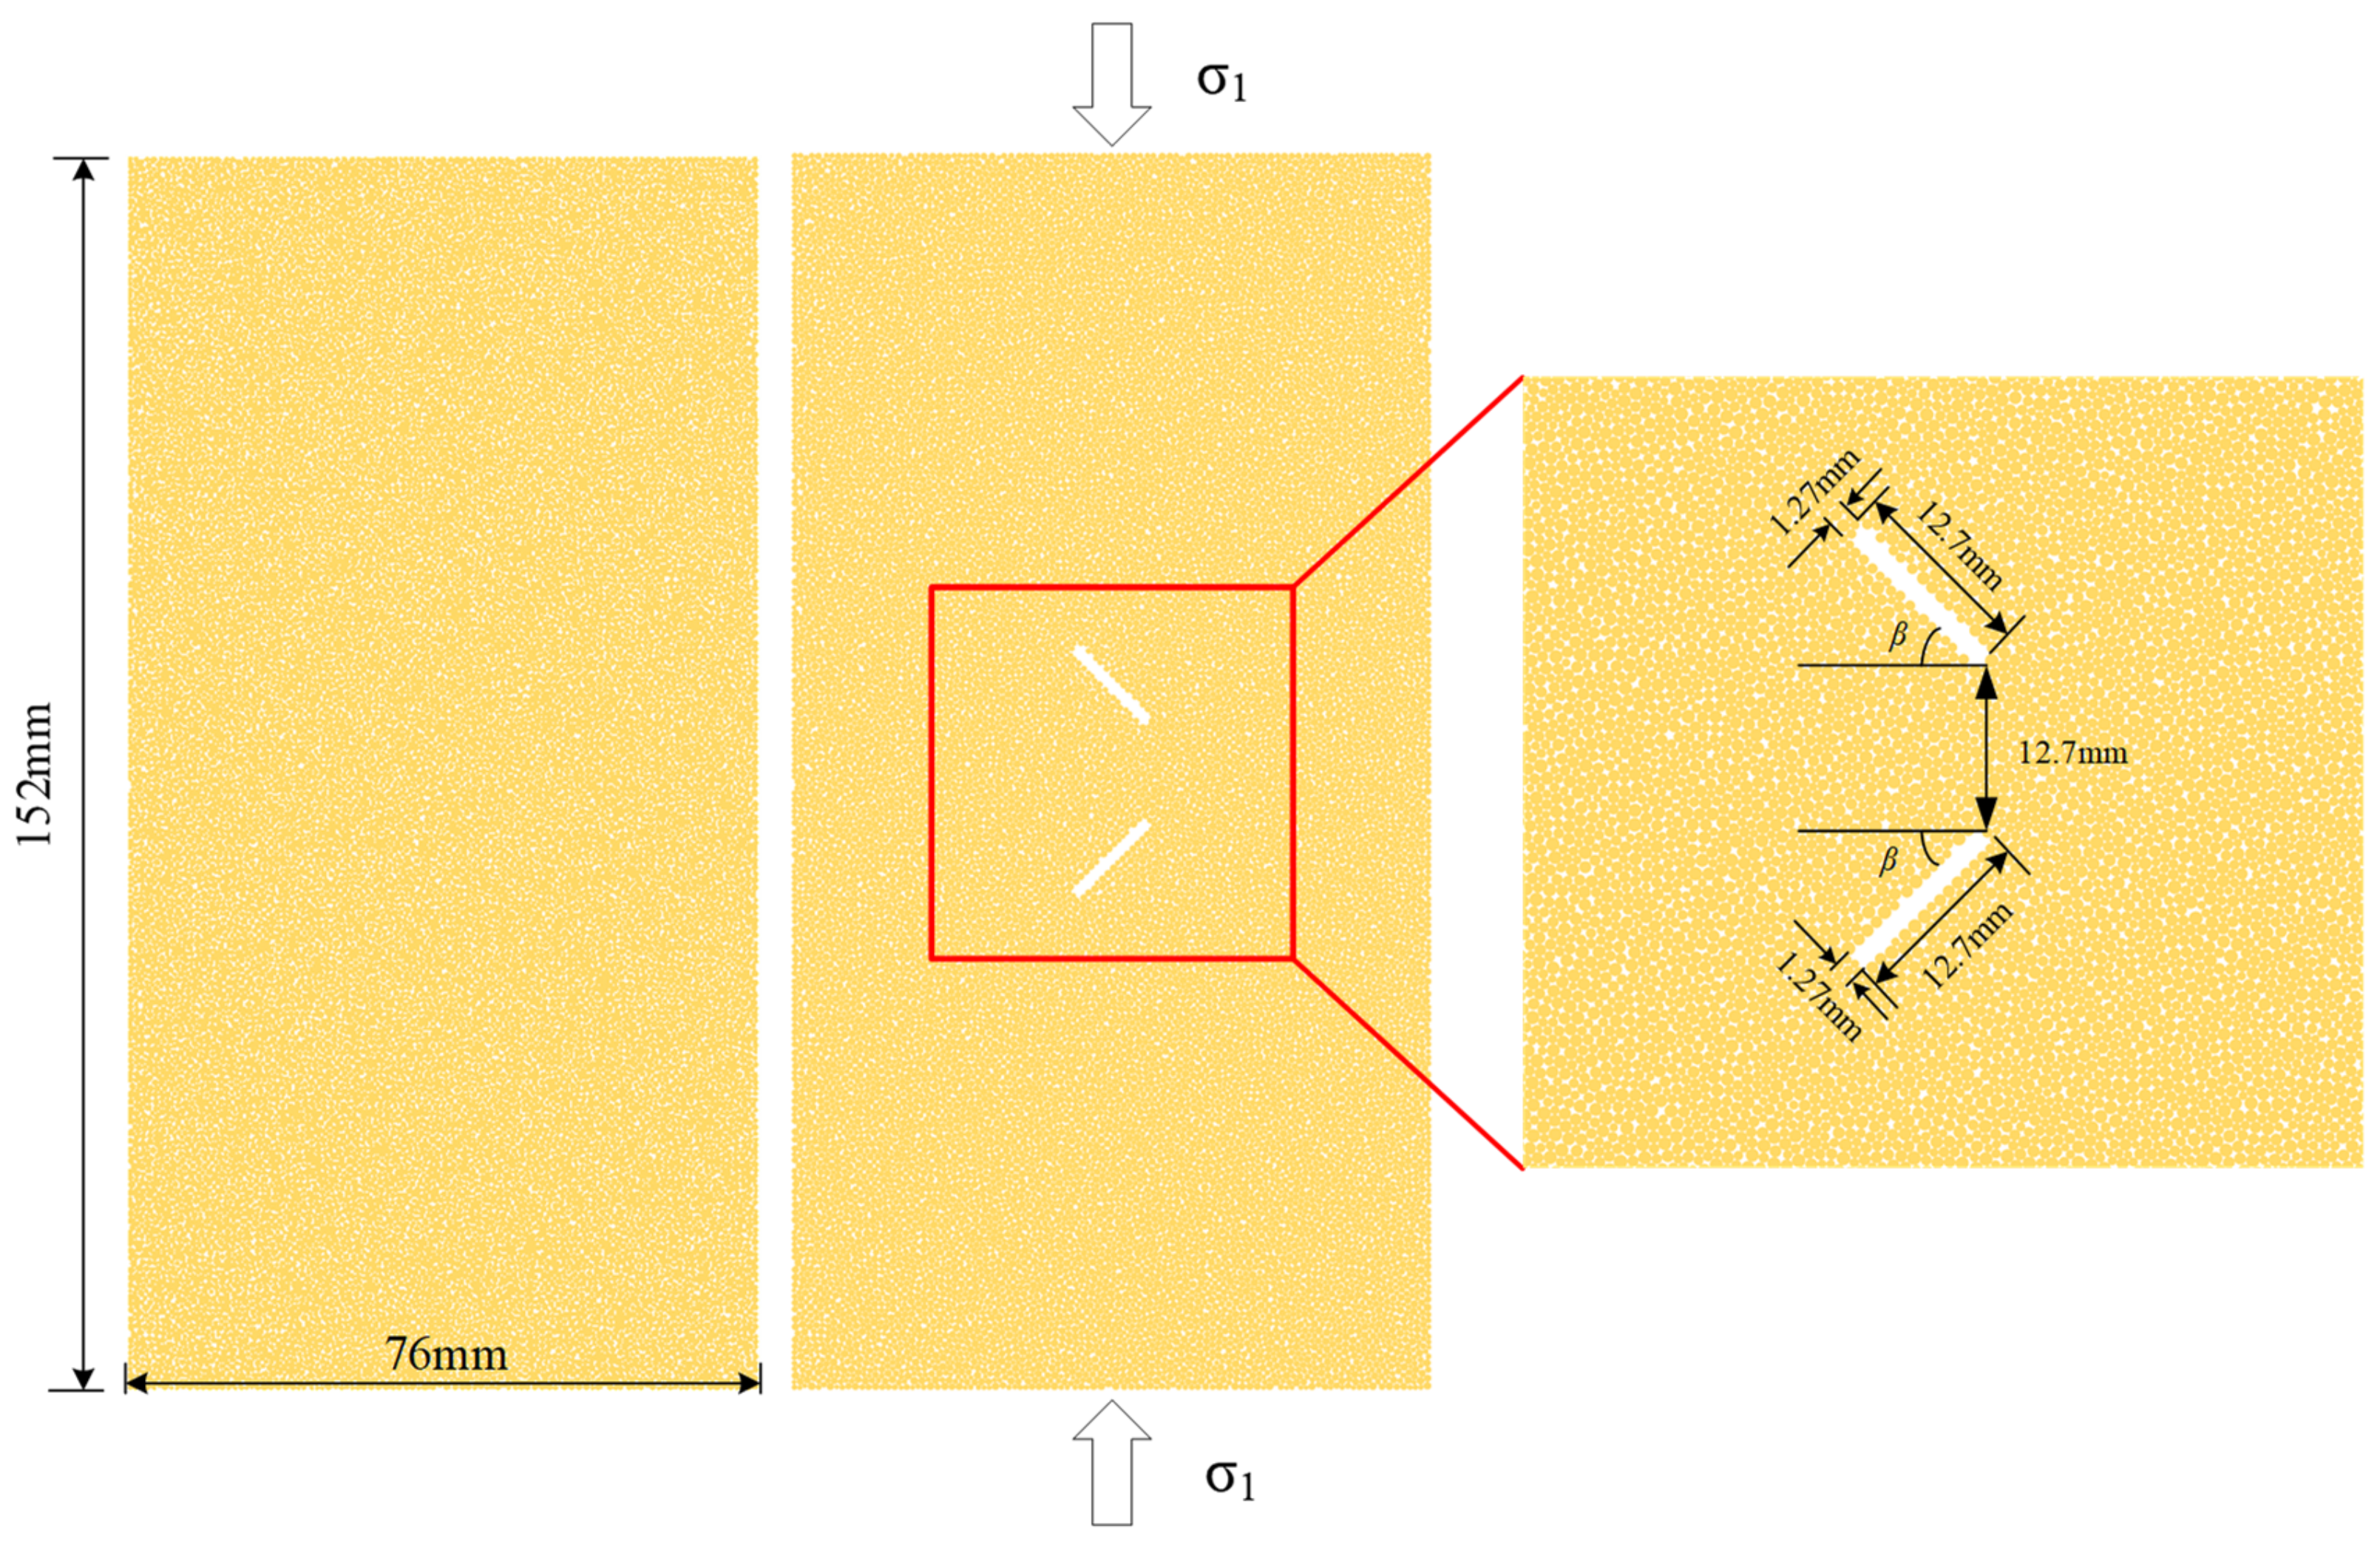
2.2. Model Generation and Verification
3. Simulation Results and Analysis
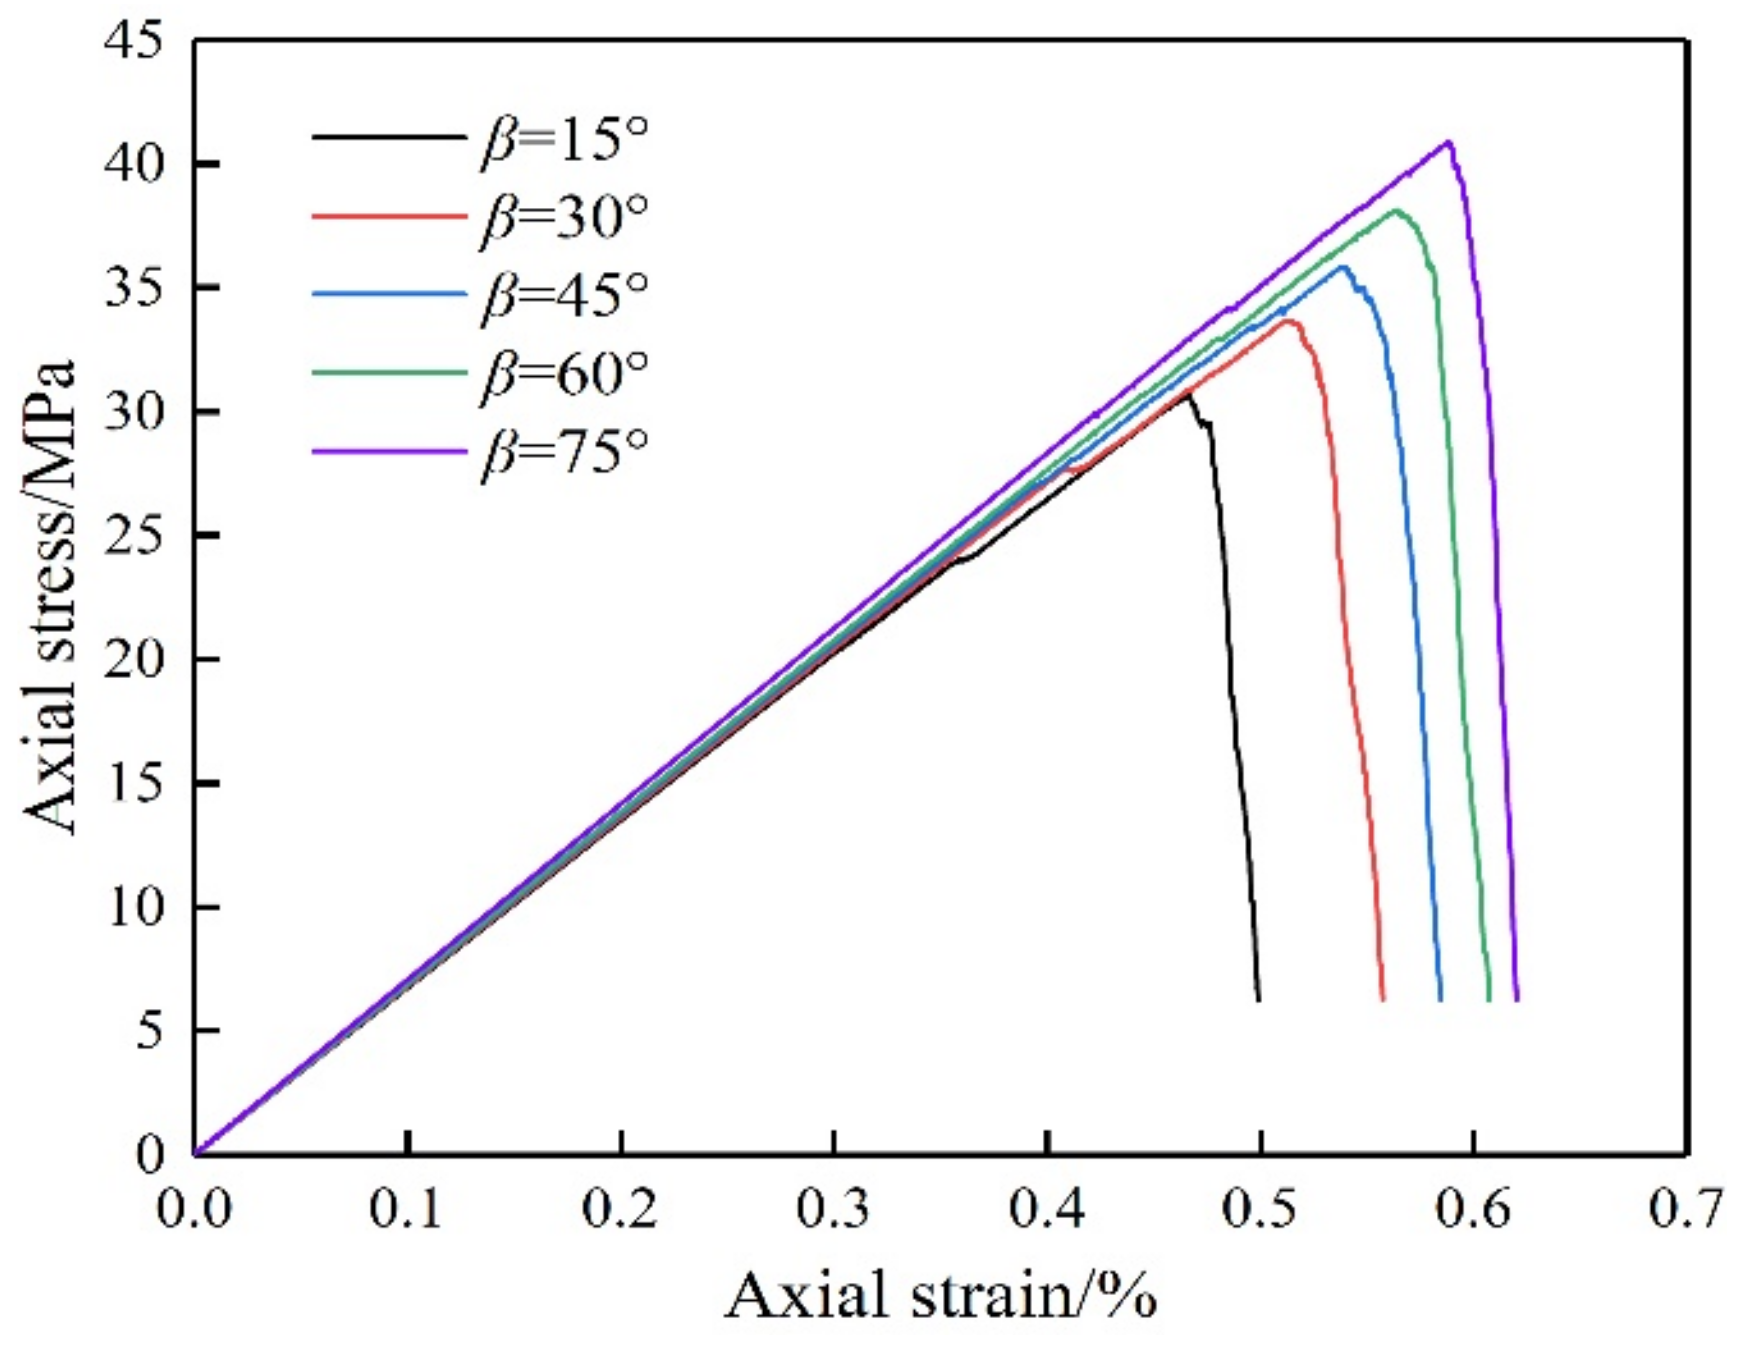
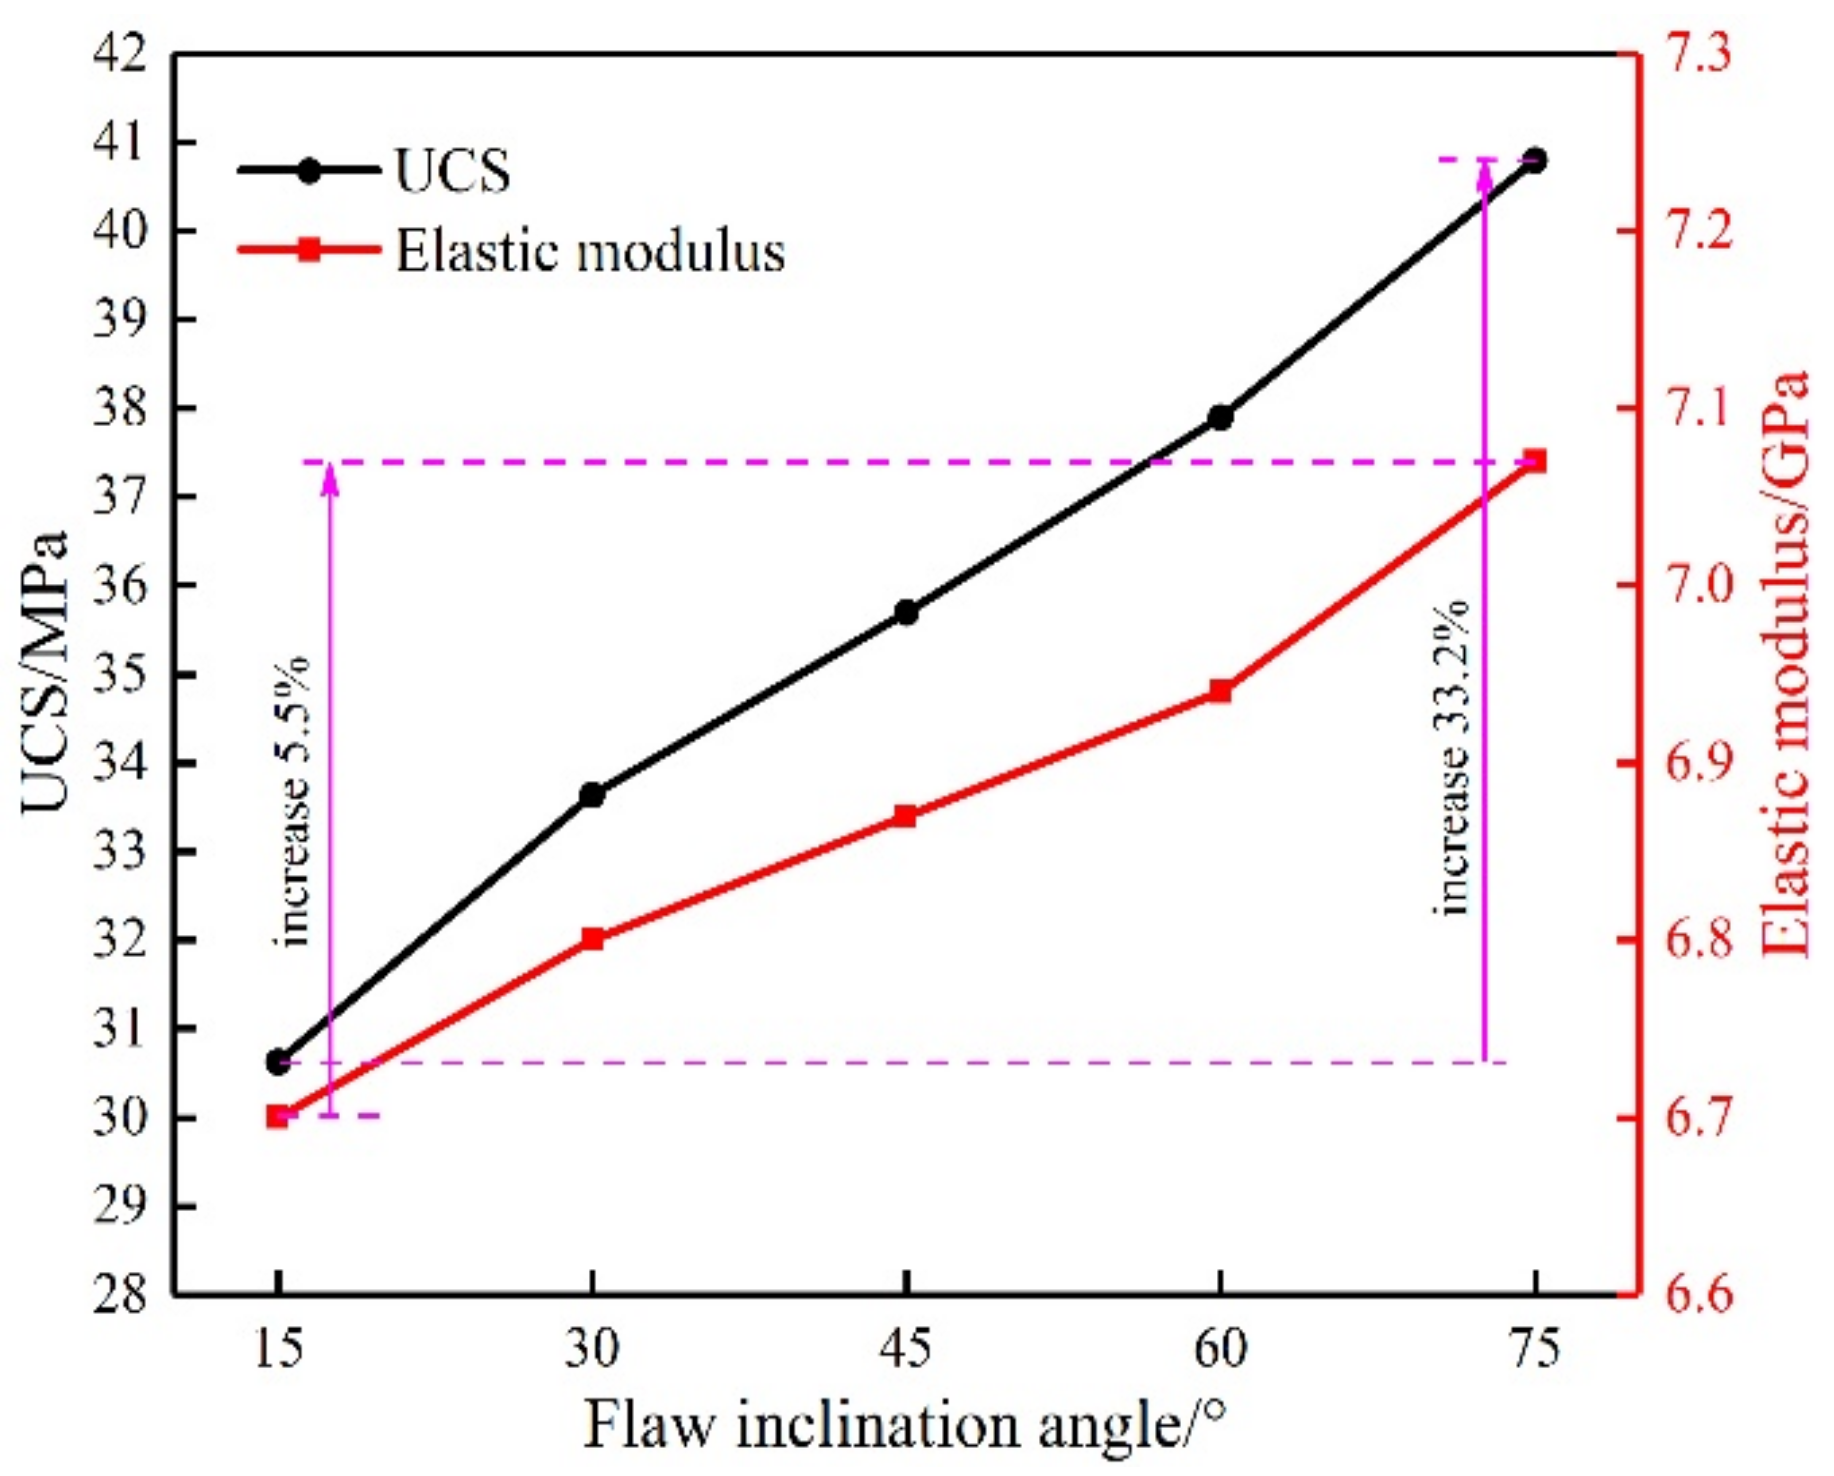
3.1. Strength and Deformation Characteristics of Rock-like Samples
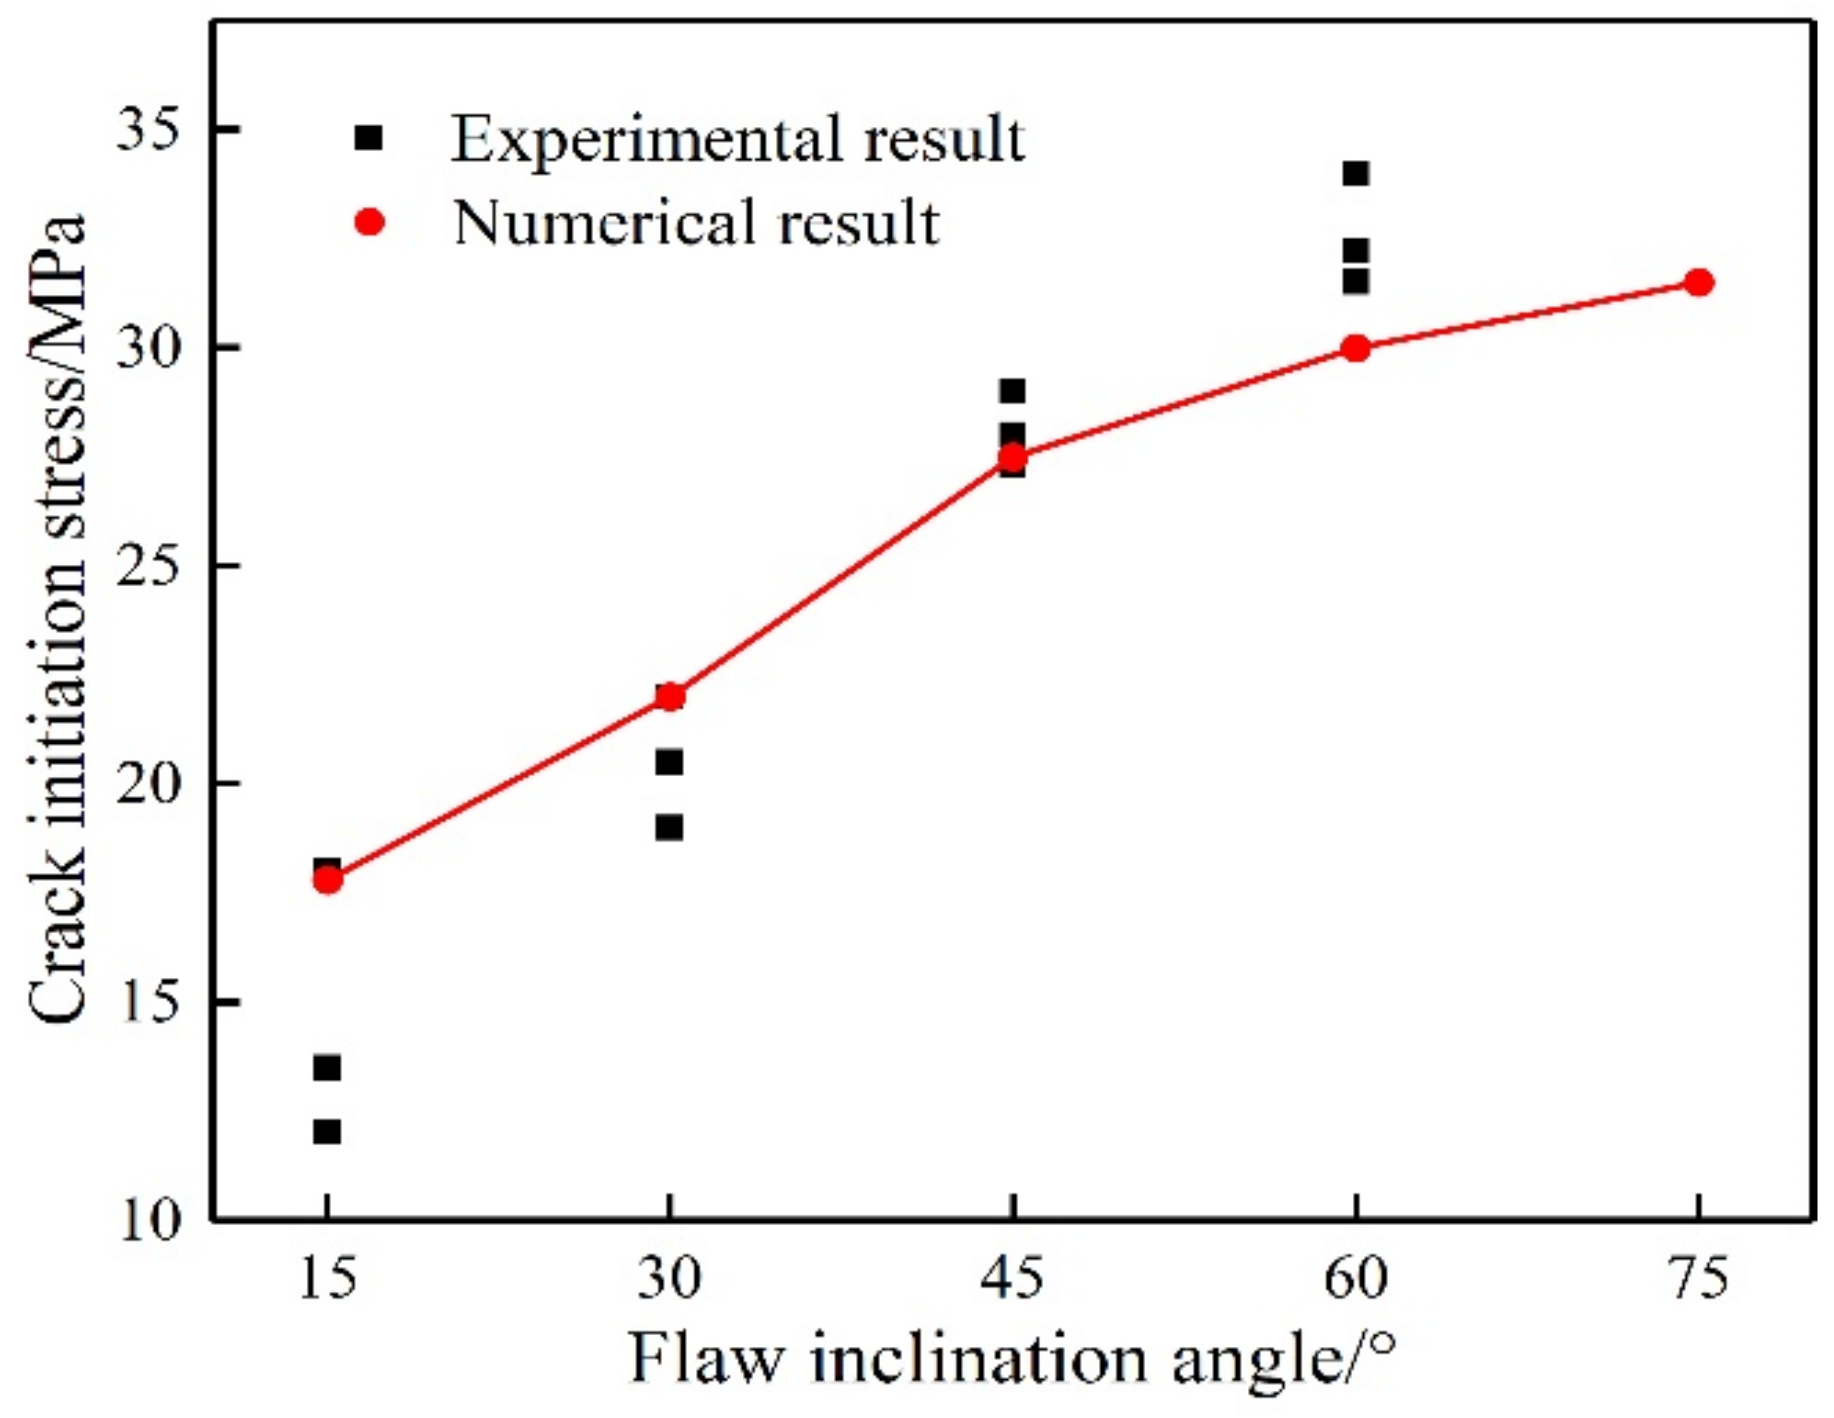
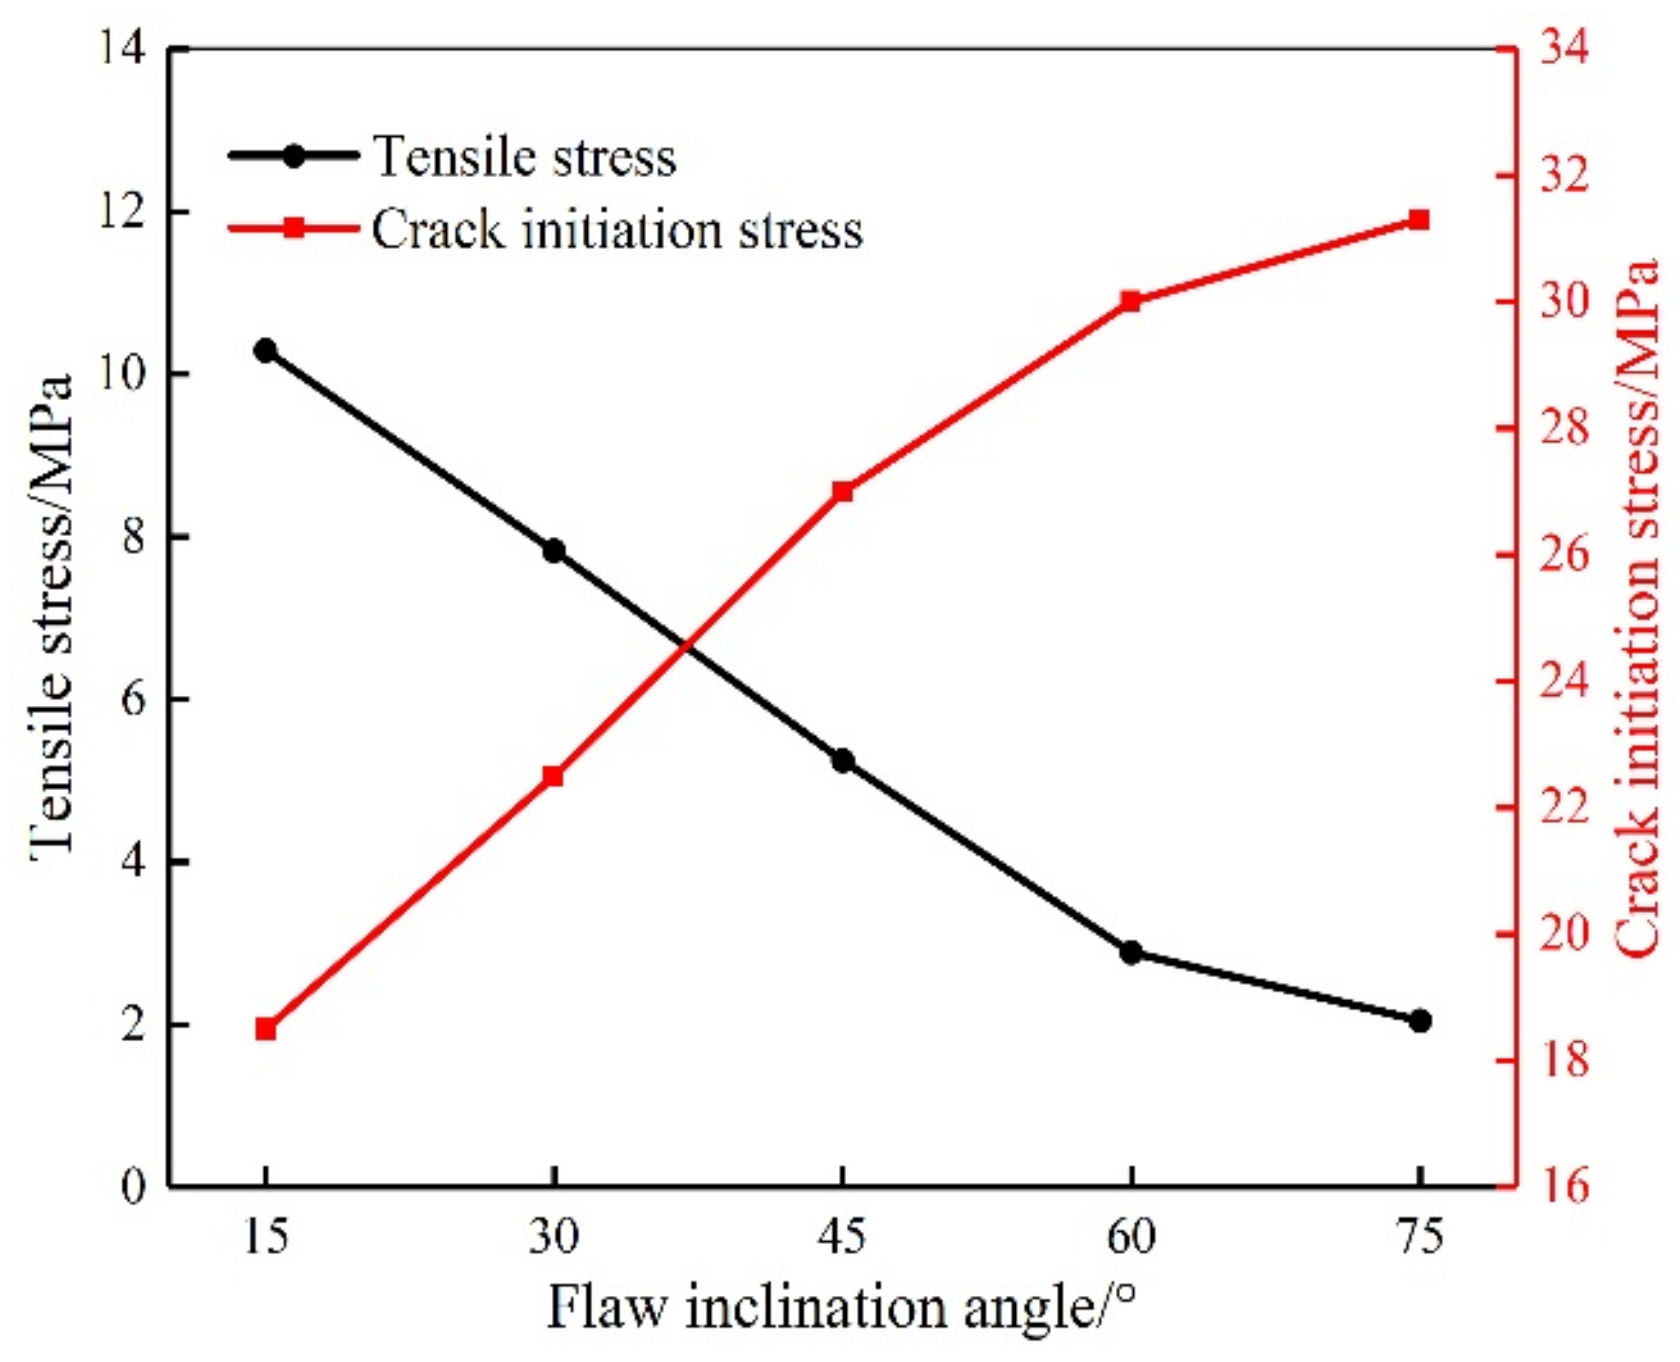
3.2. Crack Initiation Stress of Rock-like Samples
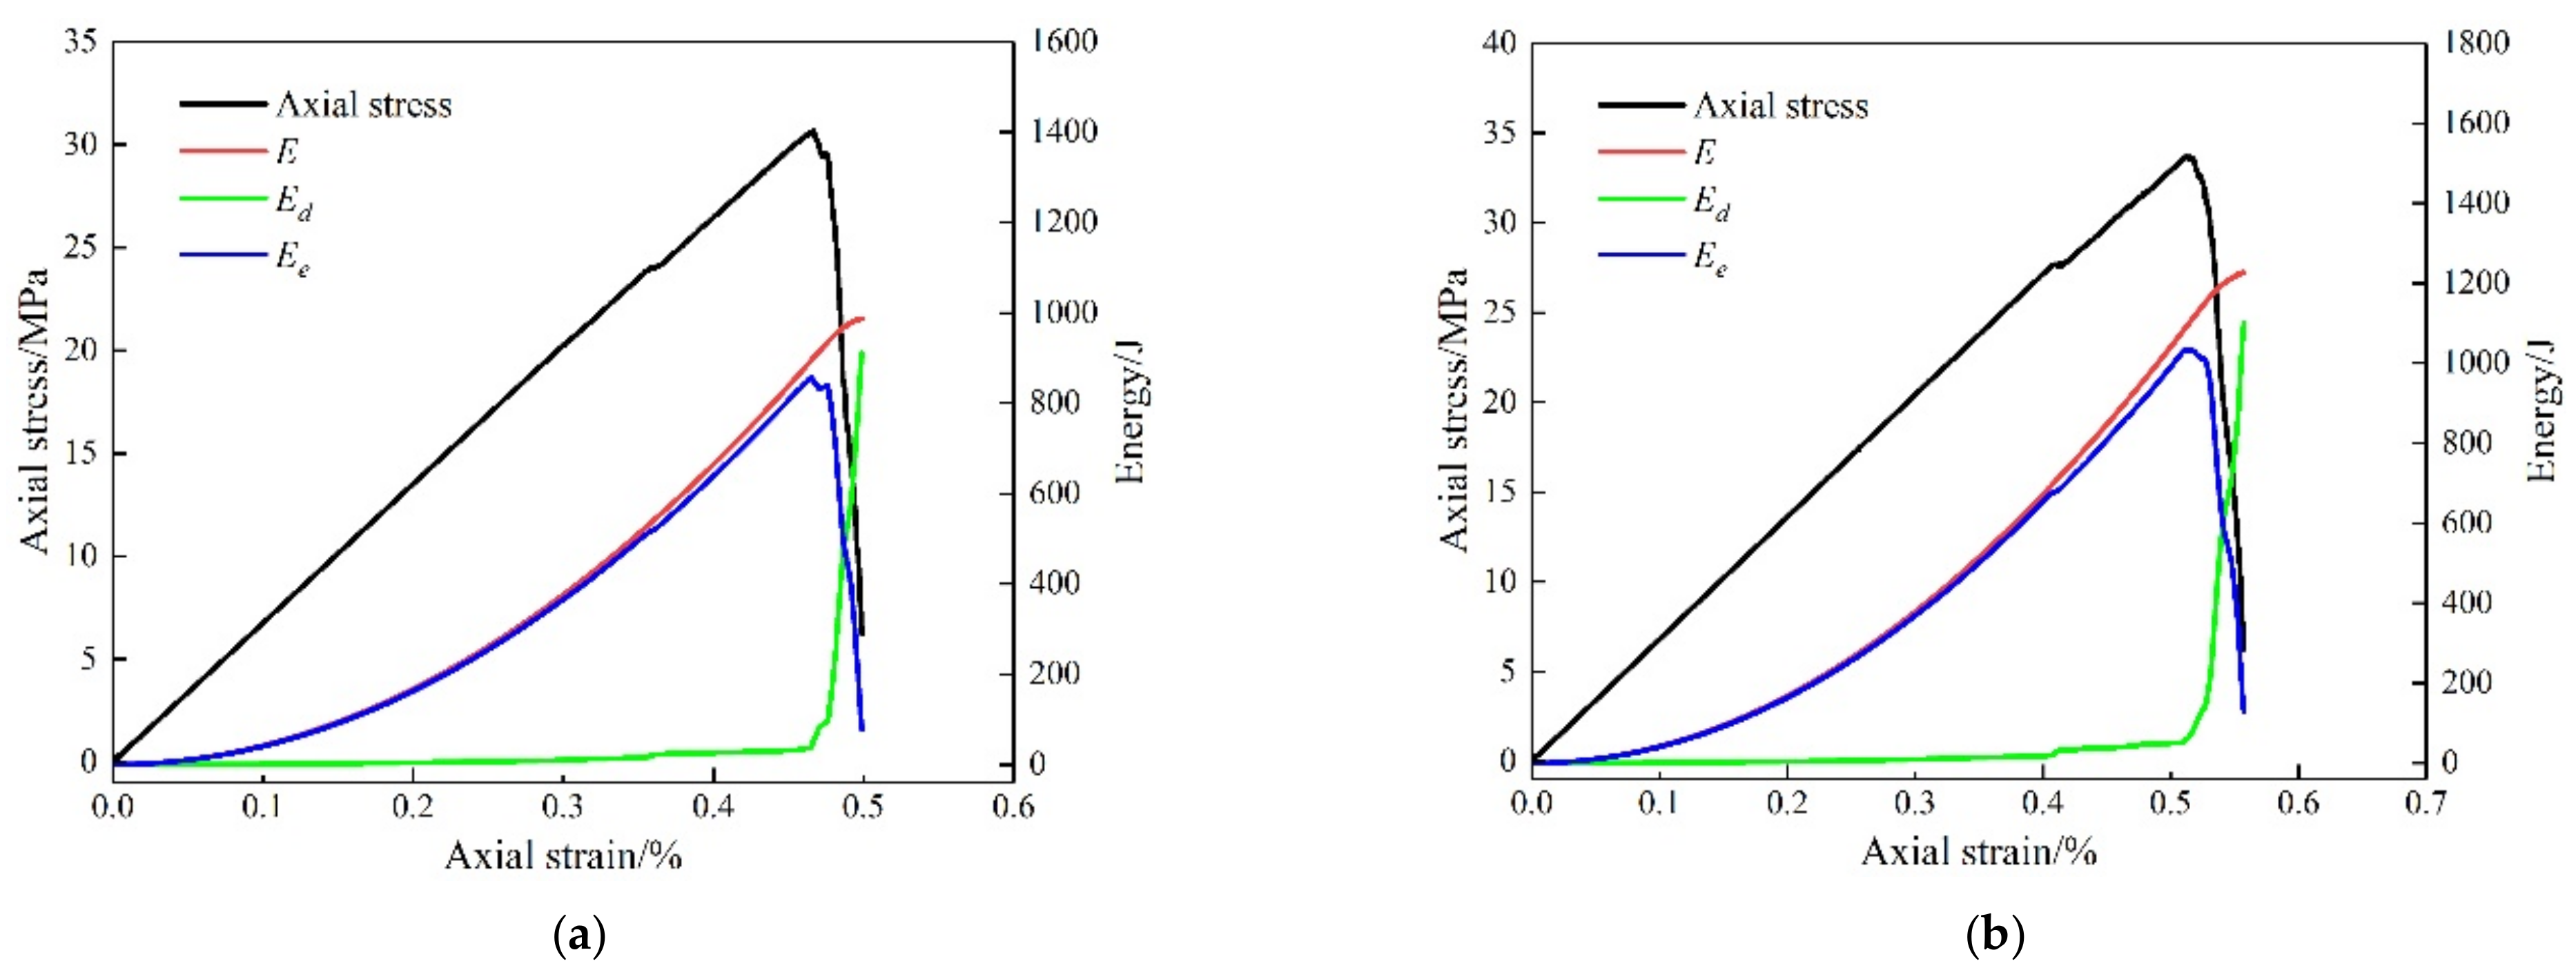
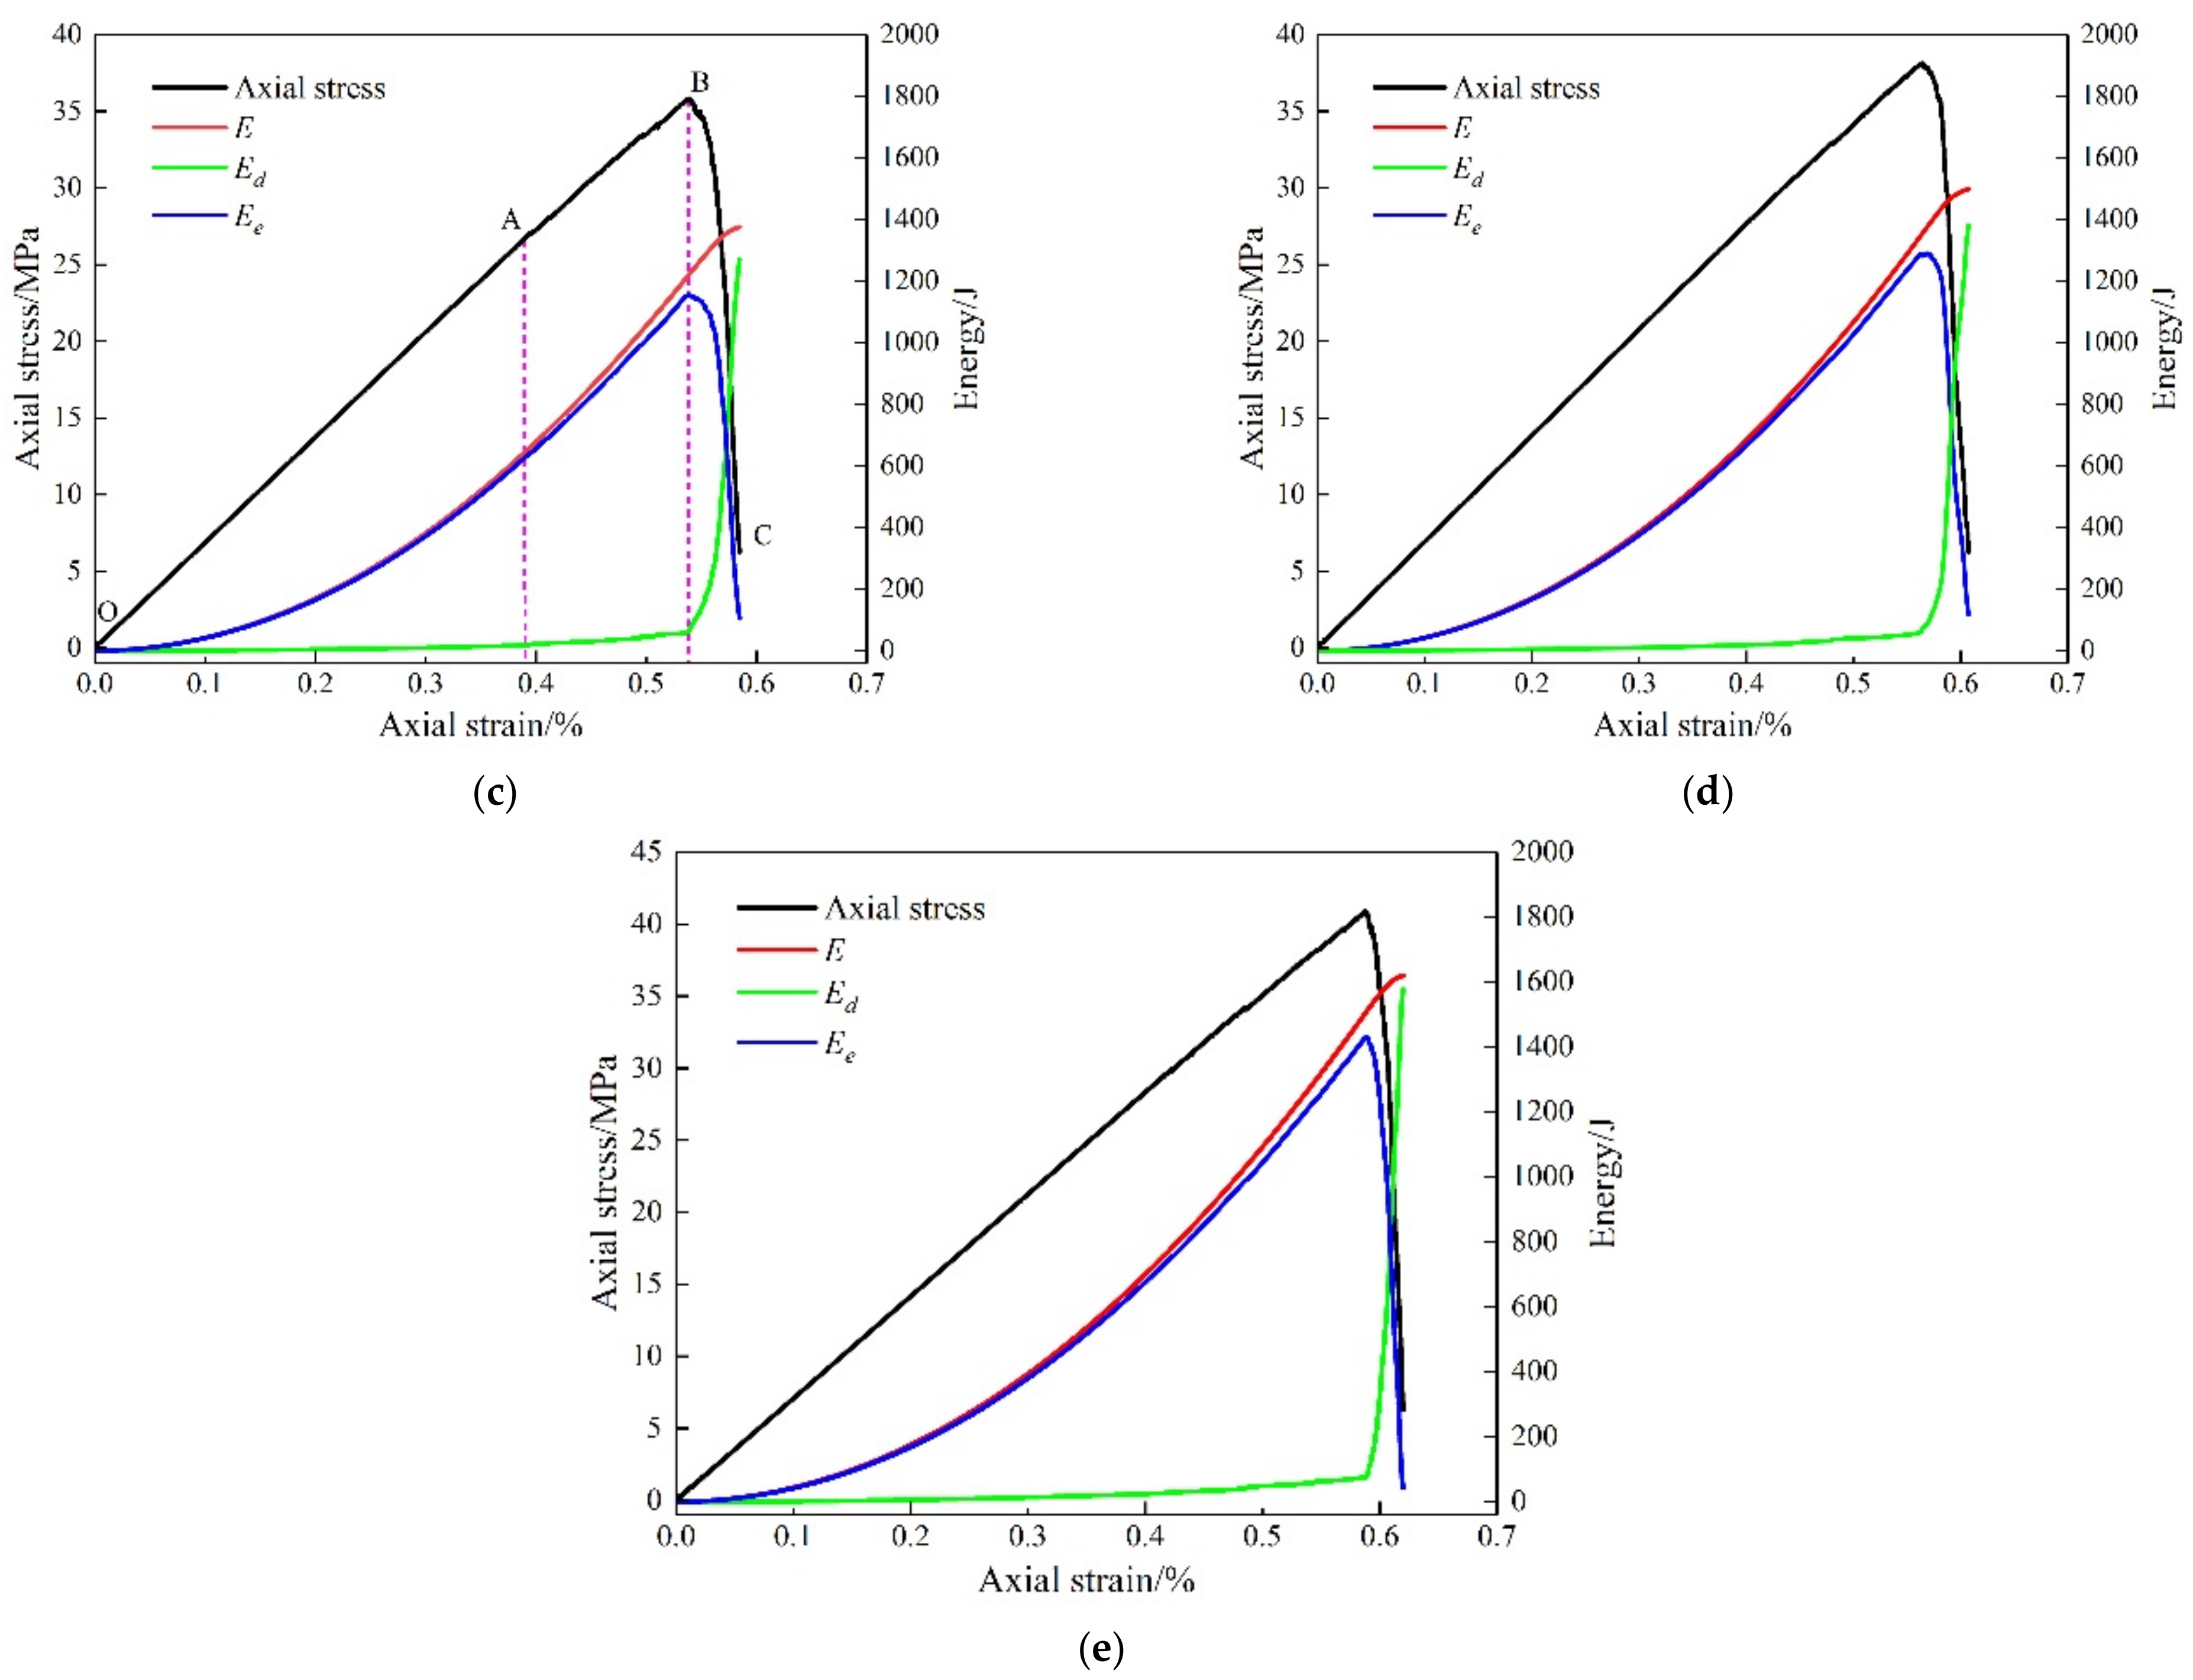
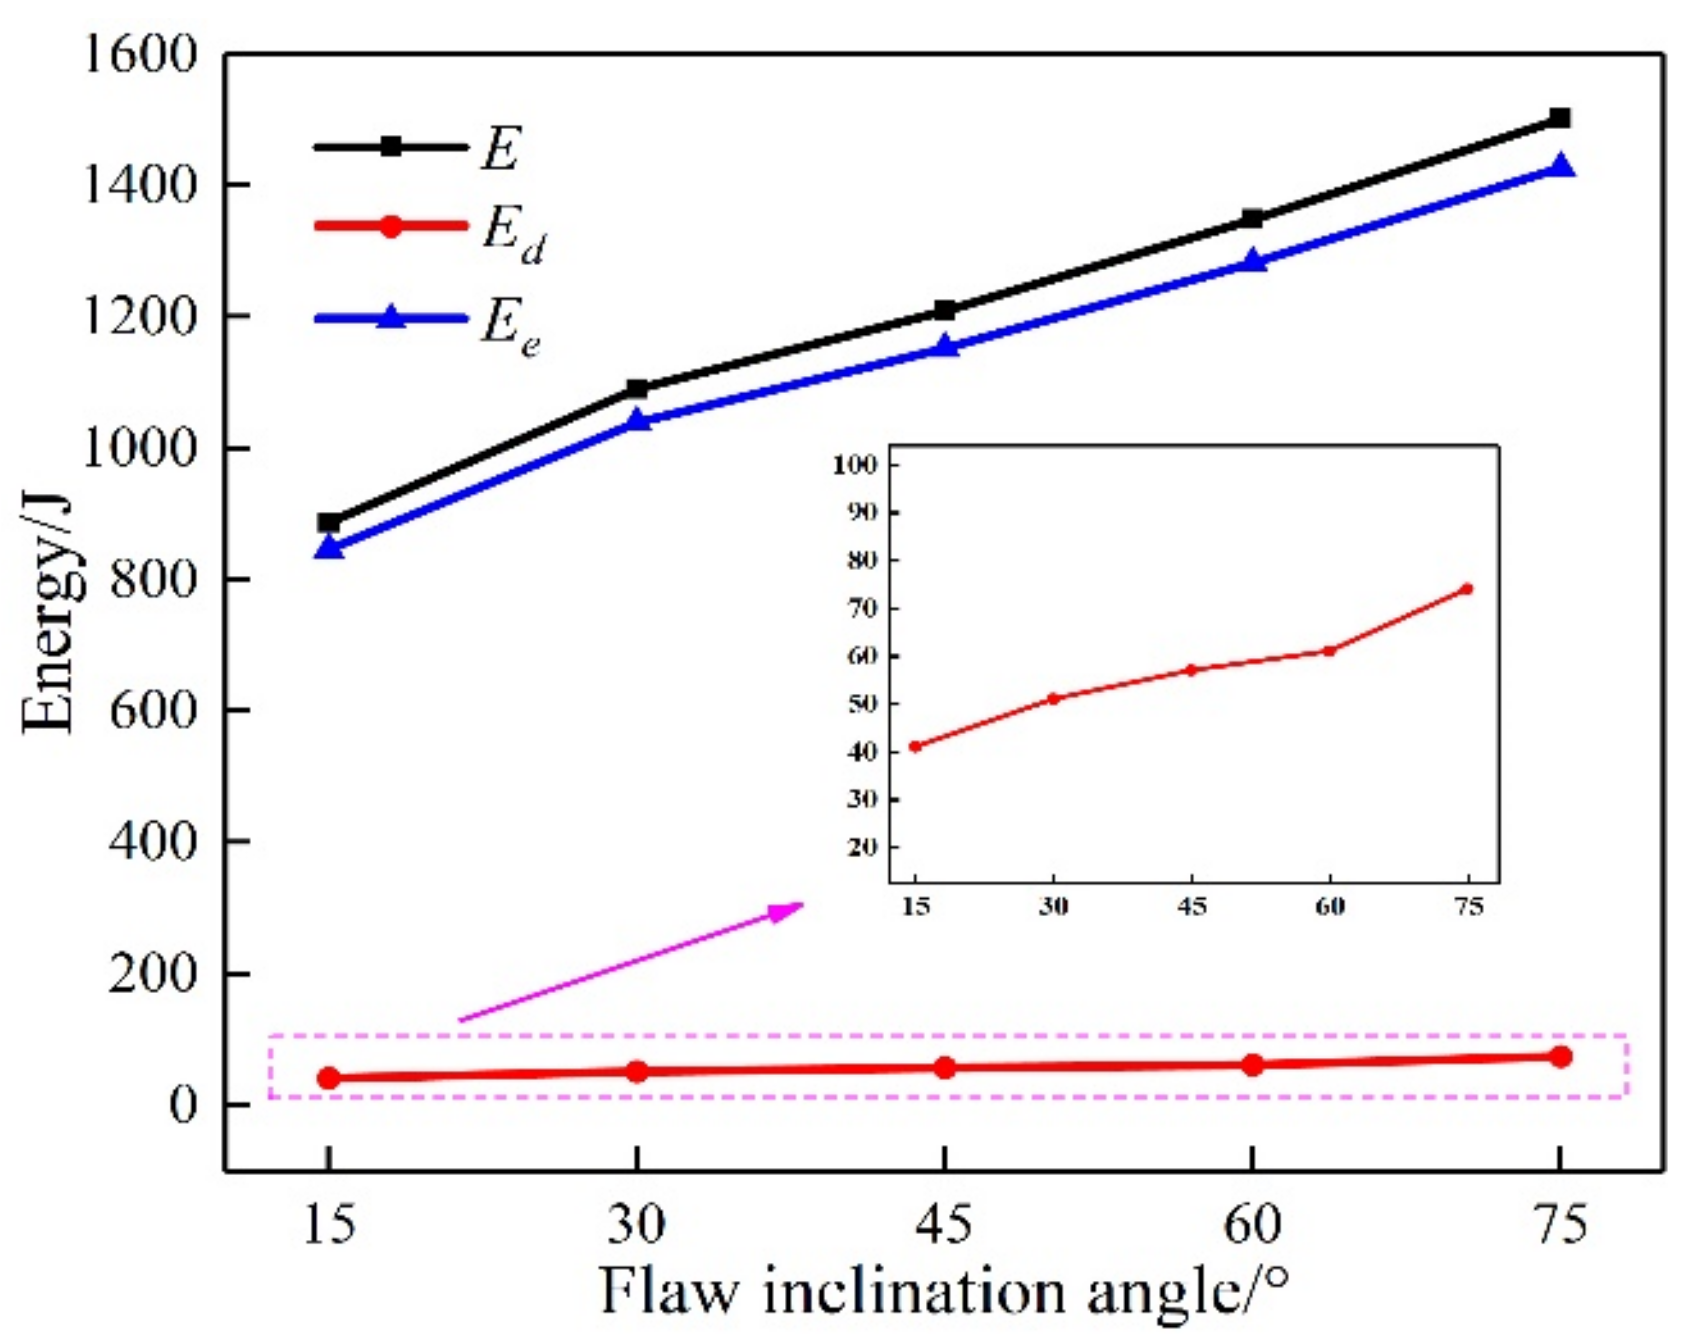
3.3. Energy Characteristics of Rock-like Samples
4. Discussion
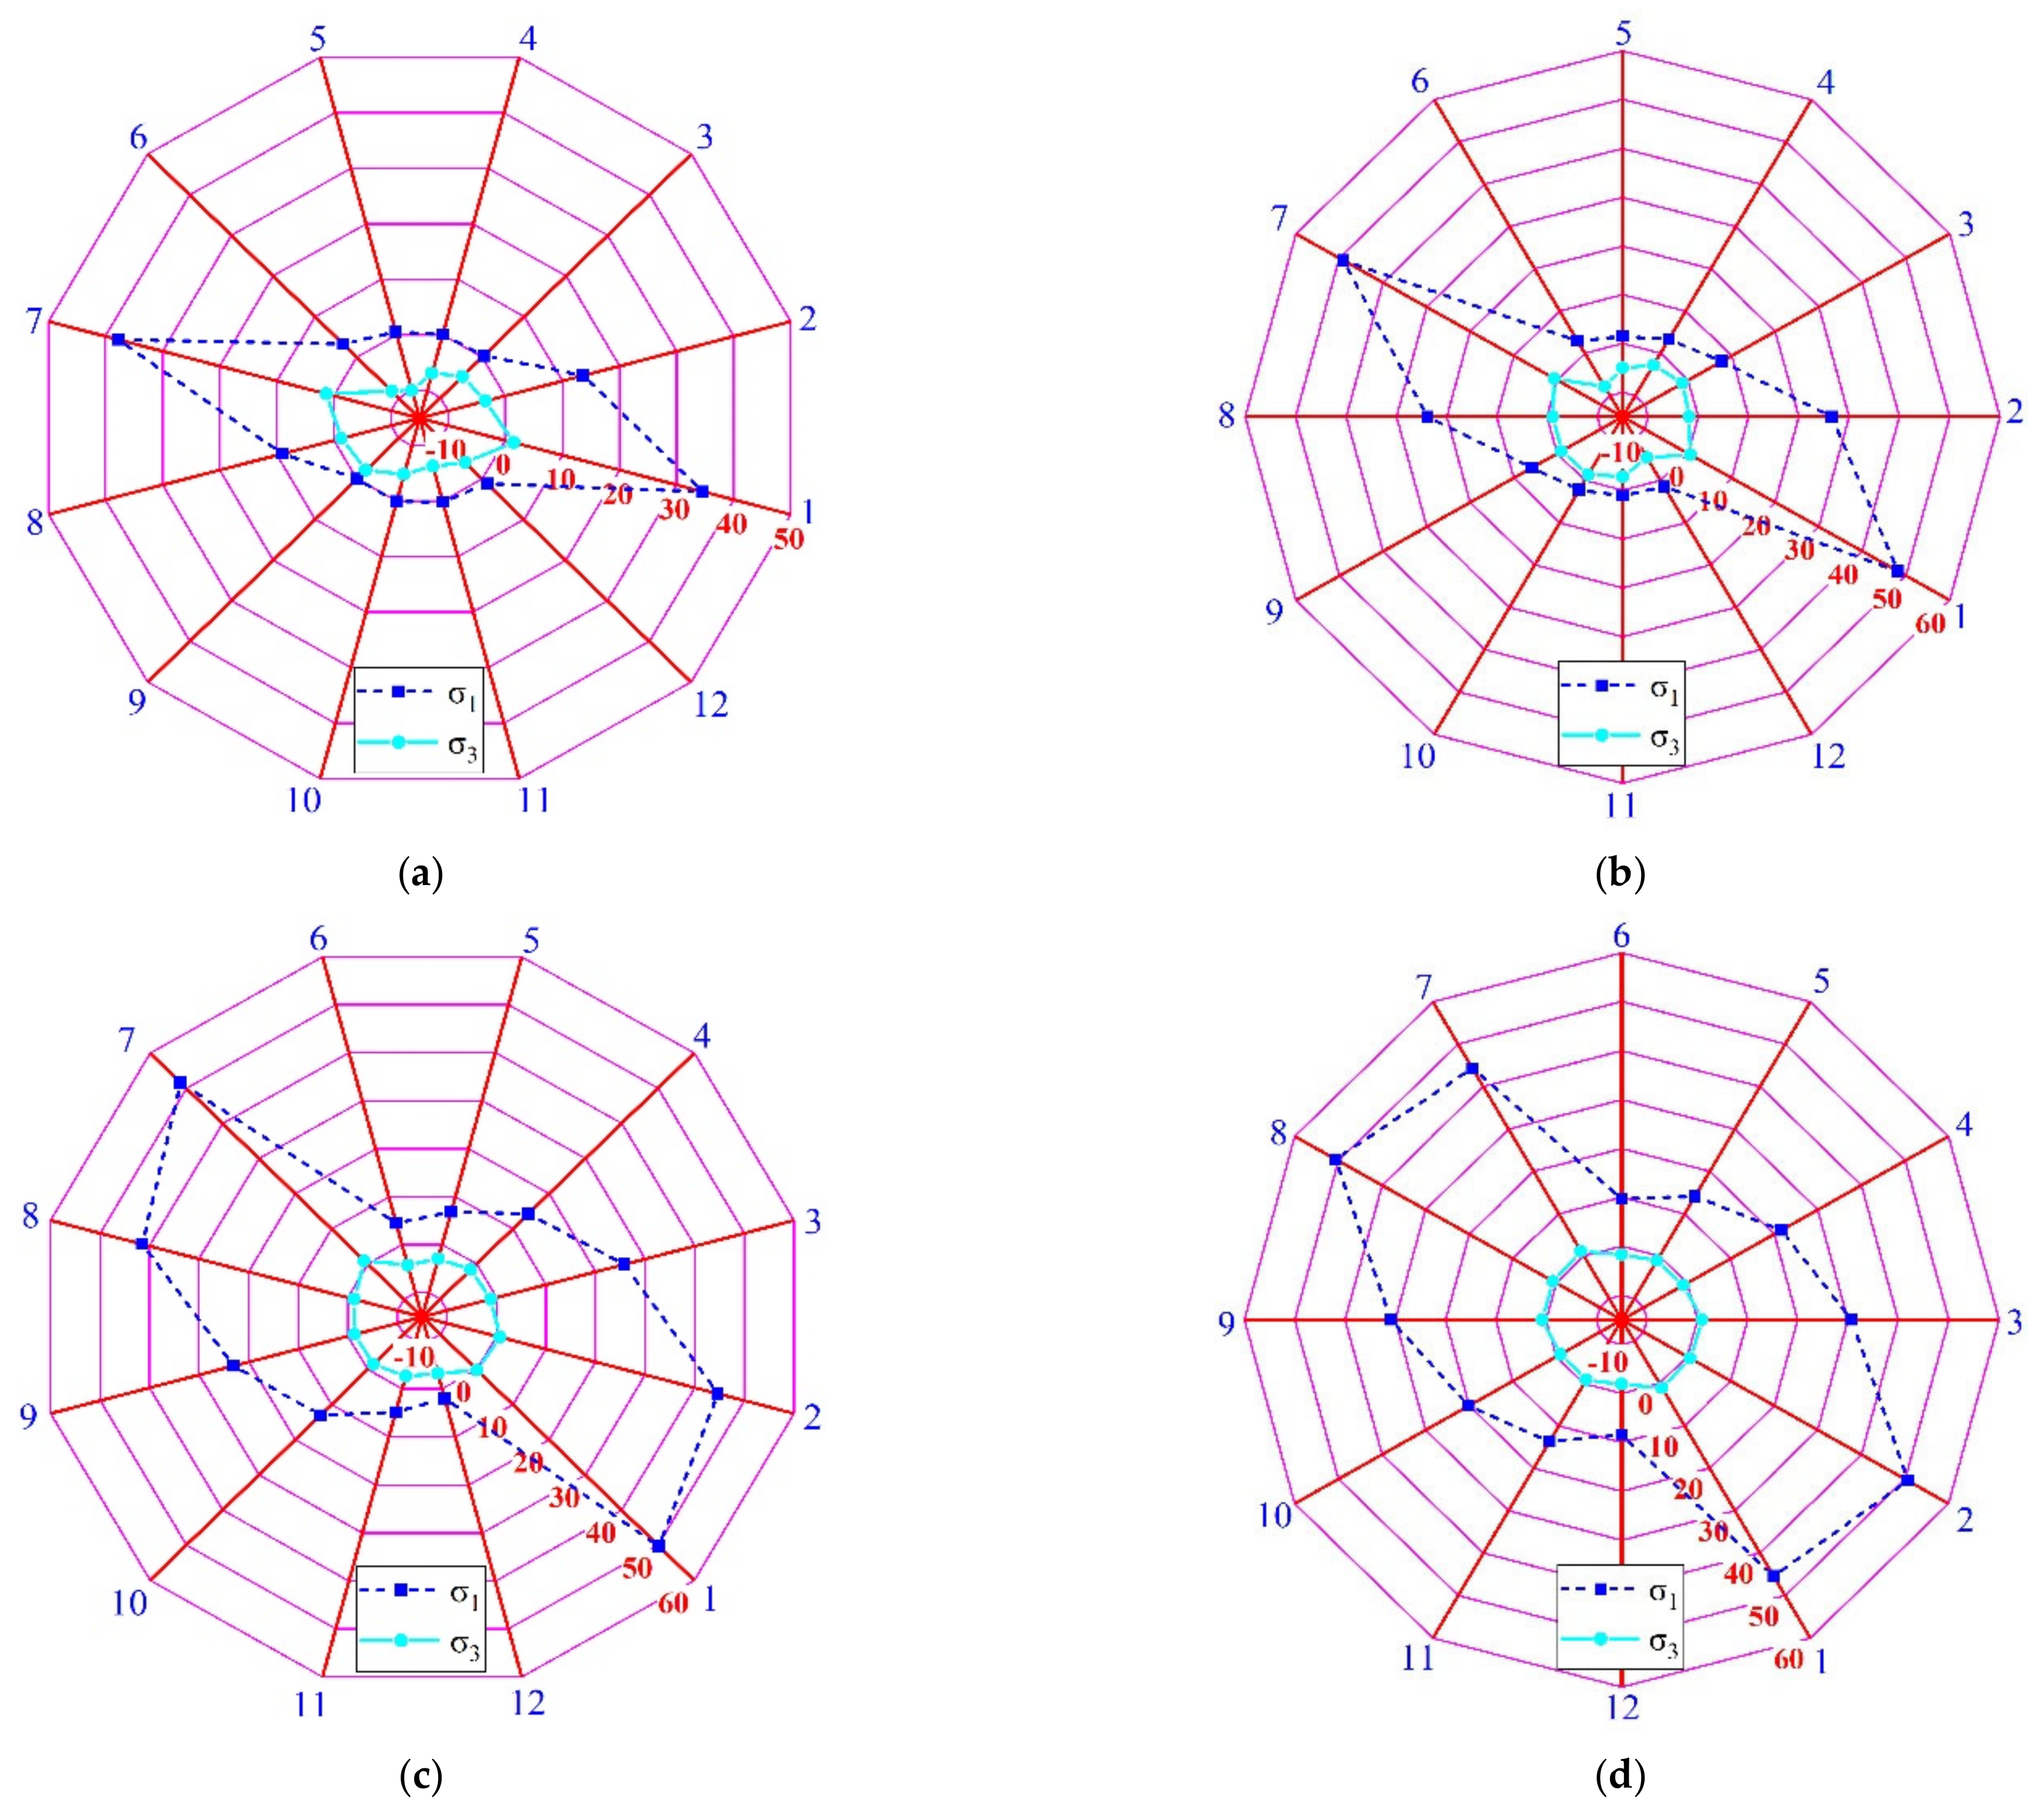
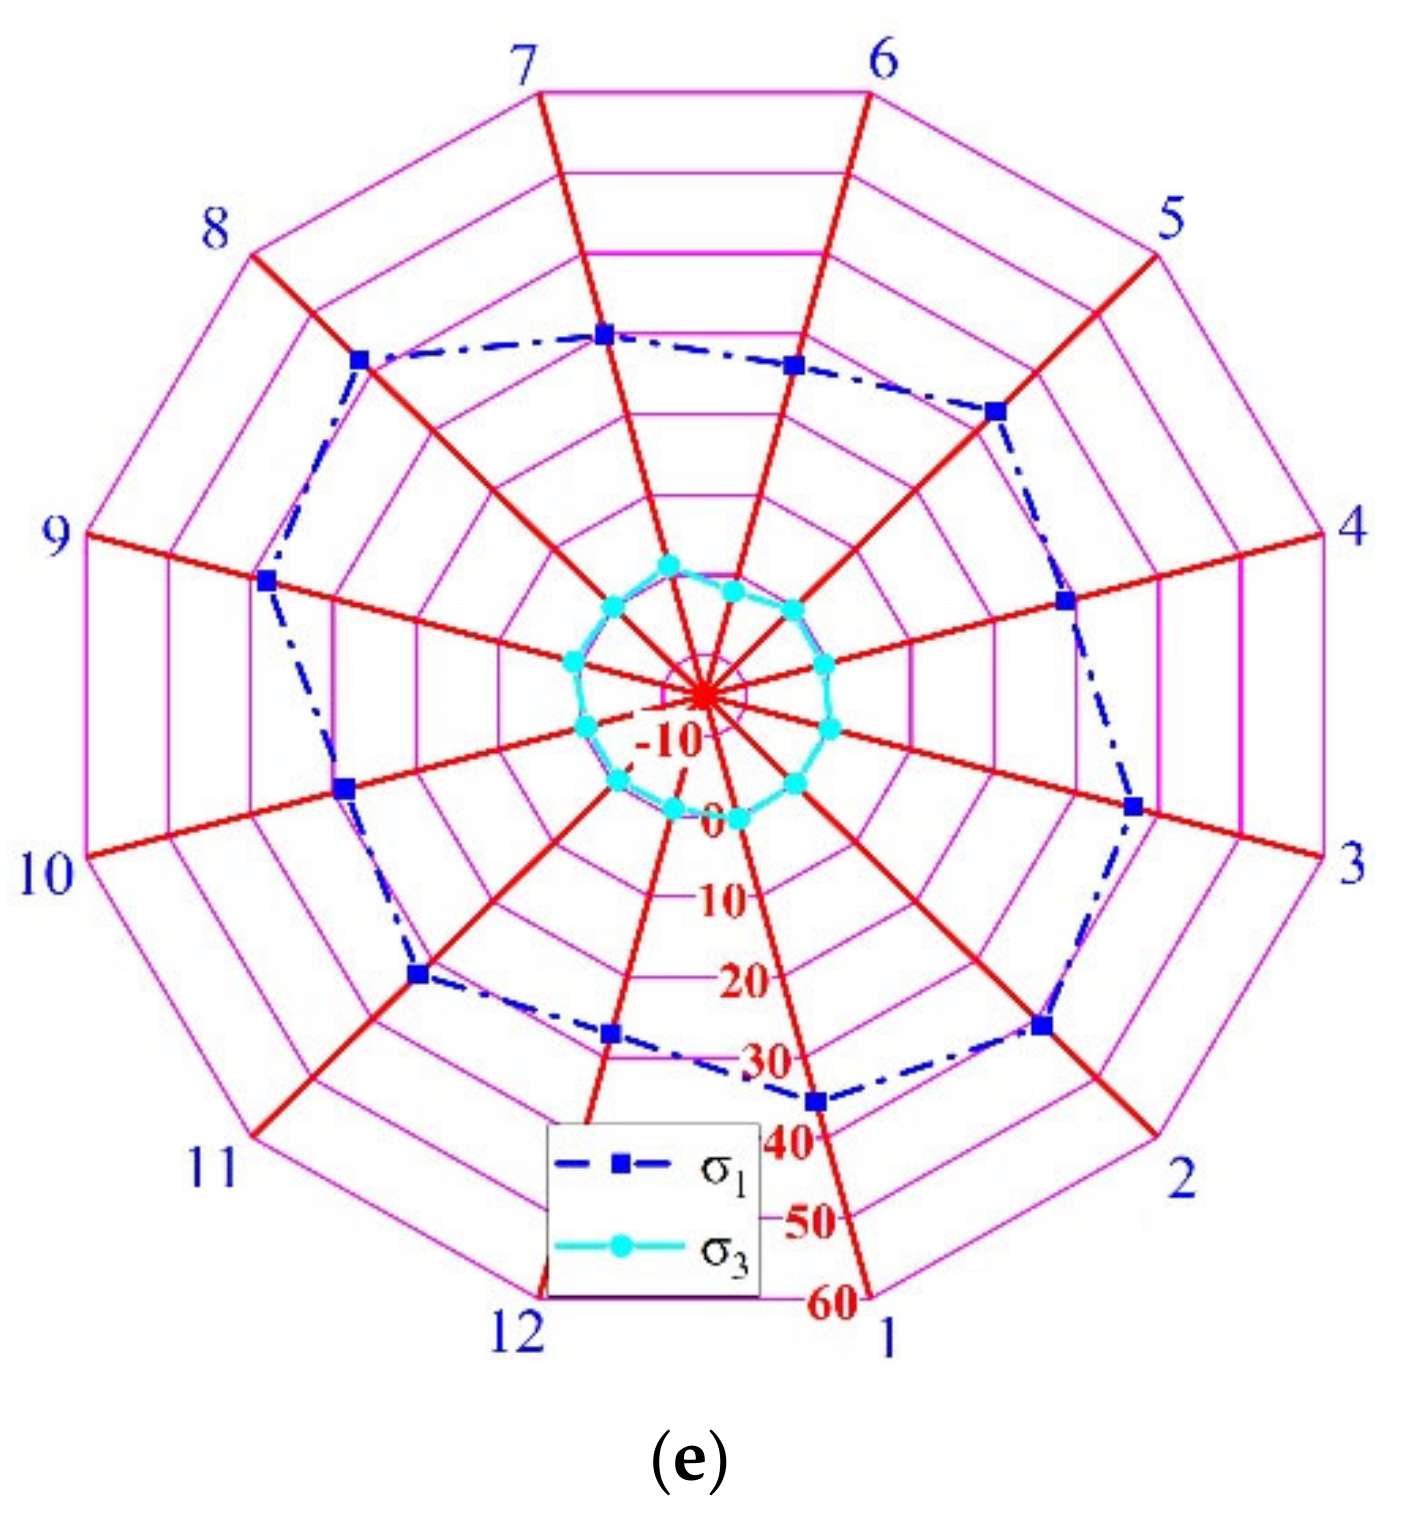
4.1. Local Stress Characteristics under Crack Initiation Stress
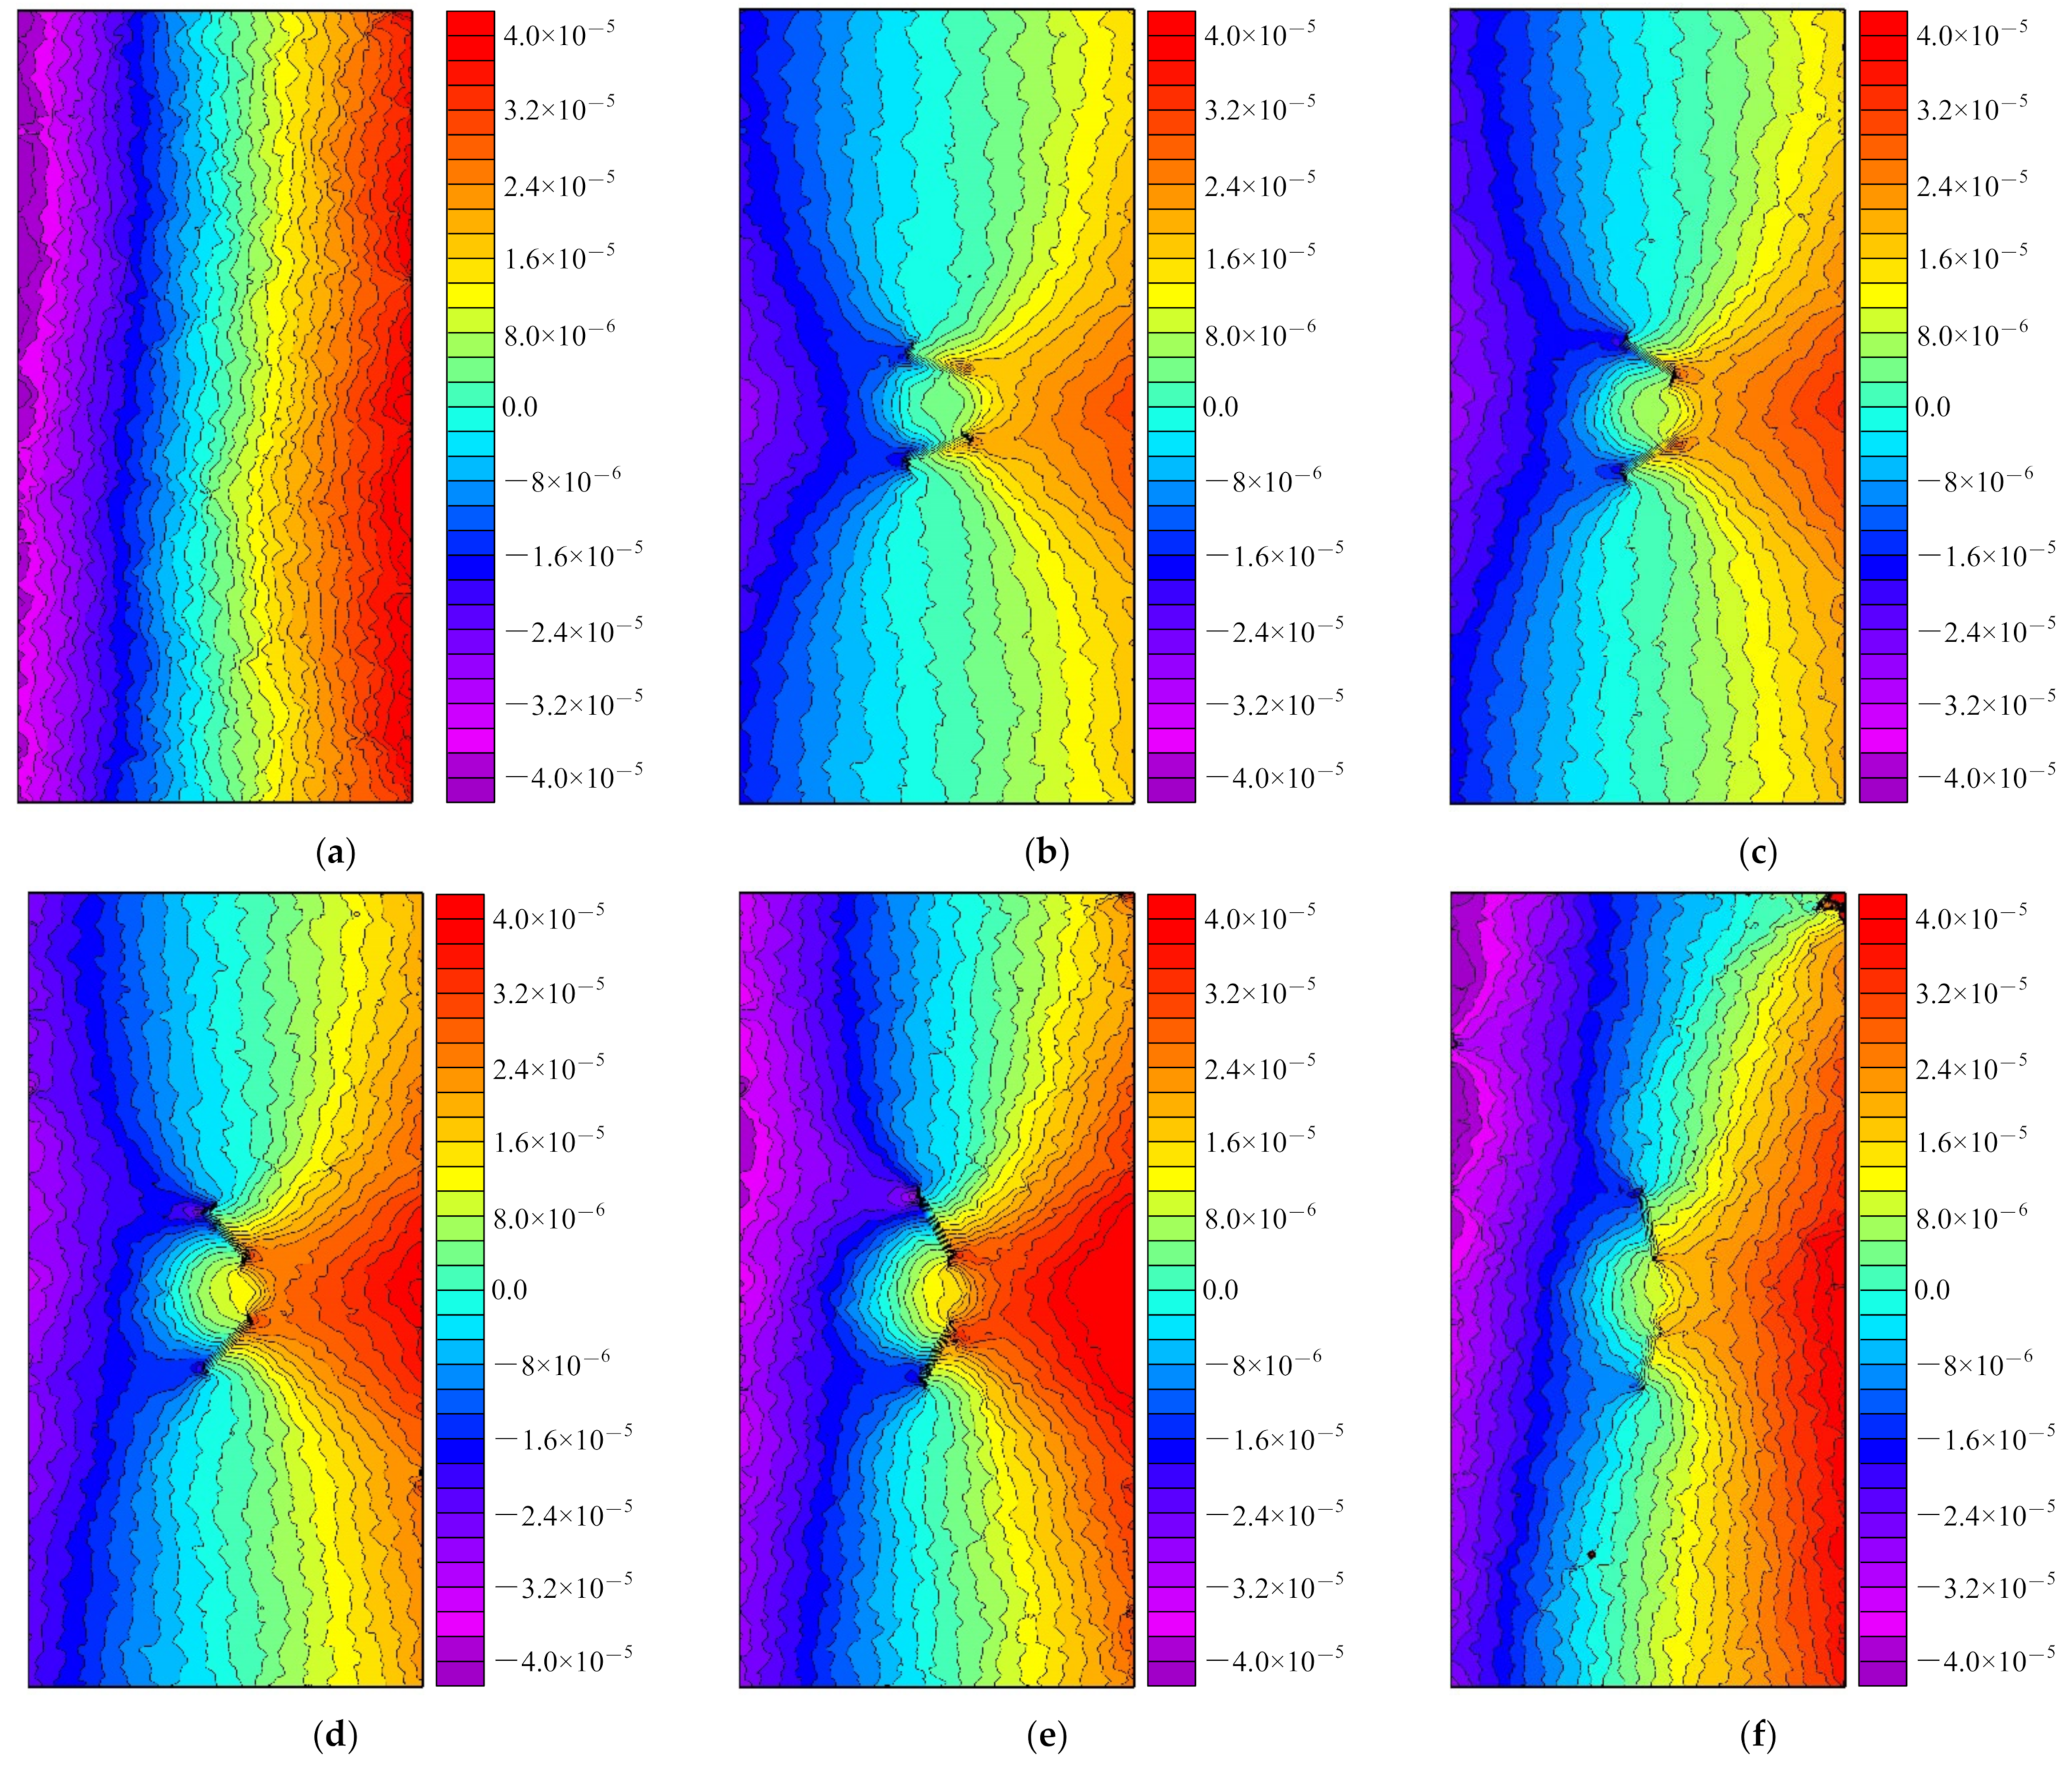
4.2. Lateral Displacement Characteristics under Crack Initiation Stress
5. Conclusions
Author Contributions
Funding
Institutional Review Board Statement
Informed Consent Statement
Data Availability Statement
Conflicts of Interest
References
- Hebblewhite, B. Fracturing, caving propagation and influence of mining on groundwater above longwall panels–a review of predictive models. Int. J. Min. Sci. Technol. 2020, 30, 49–54. [Google Scholar] [CrossRef]
- Li, X.; Li, Q.; Hu, Y. Evolution Characteristics of Mining Fissures in Overlying Strata of Stope after Converting from Open-Pit to Underground. Arab. J. Geosci. 2021, 14, 2795. [Google Scholar] [CrossRef]
- Tian, J.; Xu, D.; Liu, T. An experimental investigation of the fracturing behaviour of rock-like materials containing two V-shaped parallelogram flaws. Int. J. Min. Sci. Technol. 2020, 30, 777–783. [Google Scholar] [CrossRef]
- Guo, S.; Qi, S.; Ming, C. Influence of tunnel wall roughness and localized stress concentrations on the initiation of brittle spalling. Bull. Eng. Geol. Environ. 2015, 75, 1597–1607. [Google Scholar] [CrossRef]
- Chen, Z.; Li, X.; Weng, L.; Wang, S.; Dong, L.; Perera, M.S.A. Influence of Flaw Inclination Angle on Unloading Responses of Brittle Rock in Deep Underground. Geofluids 2019, 2019, 1–16. [Google Scholar] [CrossRef] [Green Version]
- Figueiredo, B.; Tsang, C.F.; Rutqvist, J.; Niemi, A. The effects of nearby fractures on hydraulically induced fracture propagation and permeability changes. Eng. Geol. 2017, 228, 197–213. [Google Scholar] [CrossRef] [Green Version]
- Da Silva, B.G.; Einstein, H. Physical processes involved in the laboratory hydraulic fracturing of granite: Visual observations and interpretation. Eng. Fract. Mech. 2018, 191, 125–142. [Google Scholar] [CrossRef]
- Chen, Y.; Cui, H.; Pu, H.; Wu, P.; Chen, L.; Zhang, K. Study on Mechanical Properties and Cracking Mode of Coal Samples under Compression-Shear Coupled Load Considering the Effect of Loading Rate. Appl. Sci. 2020, 10, 7082. [Google Scholar] [CrossRef]
- Fan, X.; Kulatilake, P.H.S.W.; Chen, X. Mechanical behavior of rock-like jointed blocks with multi-non-persistent joints under uniaxial loading: A particle mechanics approach. Eng. Geol. 2015, 190, 17–32. [Google Scholar] [CrossRef]
- Cao, R.-H.; Cao, P.; Fan, X.; Xiong, X.; Lin, H. An Experimental and Numerical Study on Mechanical Behavior of Ubiquitous-Joint Brittle Rock-Like Specimens Under Uniaxial Compression. Rock Mech. Rock Eng. 2016, 49, 4319–4338. [Google Scholar] [CrossRef]
- Cheng, X. Damage and failure characteristics of rock similar materials with pre-existing cracks. Int. J. Coal Sci. Technol. 2019, 6, 505–517. [Google Scholar] [CrossRef] [Green Version]
- Xu, Y.; Dai, F.; Zhao, T.; Xu, N.; Liu, Y. Fracture Toughness Determination of Cracked Chevron Notched Brazilian Disc Rock Specimen via Griffith Energy Criterion Incorporating Realistic Fracture Profiles. Rock Mech. Rock Eng. 2016, 49, 3083–3093. [Google Scholar] [CrossRef]
- Dai, F.; Xu, Y.; Zhao, T.; Xu, N.; Liu, Y. Loading-rate-dependent progressive fracturing of cracked chevron-notched Brazilian disc specimens in split Hopkinson pressure bar tests. Int. J. Rock Mech. Min. Sci. 2016, 88, 49–60. [Google Scholar] [CrossRef]
- Yang, S.Q.; Jing, H.W. Strength failure and crack coalescence behavior of brittle sandstone samples containing a single fissure under uniaxial compression. Int. J. Fract. 2011, 168, 227–250. [Google Scholar] [CrossRef]
- Zhang, X.; Zhang, Q.; Wu, S. Acoustic emission characteristics of the rock-like material containing a single flaw under different compressive loading rates. Comput. Geotech. 2017, 83, 83–97. [Google Scholar] [CrossRef]
- Wong, L.N.Y.; Xiong, Q. A Method for Multiscale Interpretation of Fracture Processes in Carrara Marble Specimen Containing a Single Flaw Under Uniaxial Compression. J. Geophys. Res. Solid Earth 2018, 123, 6459–6490. [Google Scholar] [CrossRef]
- Zhao, Y.; Gao, Y.; Wu, S. Influence of different concealment conditions of parallel double flaws on mechanical properties and failure characteristics of brittle rock under uniaxial compression. Theor. Appl. Fract. Mech. 2020, 109, 102751. [Google Scholar] [CrossRef]
- Yin, P.; Wong, R.H.C.; Chau, K.T. Coalescence of two parallel pre-existing surface cracks in granite. Int. J. Rock Mech. Min. Sci. 2014, 68, 66–84. [Google Scholar] [CrossRef]
- Morgan, S.P.; Johnson, C.A.; Einstein, H.H. Cracking processes in Barre granite: Fracture process zones and crack coalescence. Int. J. Fract. 2013, 180, 177–204. [Google Scholar] [CrossRef] [Green Version]
- Hu, J.; Wen, G.; Lin, Q.; Cao, P.; Li, S. Mechanical properties and crack evolution of double-layer composite rock-like specimens with two parallel fissures under uniaxial compression. Theor. Appl. Fract. Mech. 2020, 108, 102610. [Google Scholar] [CrossRef]
- Pan, W.; Wang, X.; Liu, Q.; Yuan, Y.; Zuo, B. Non-parallel double-crack propagation in rock-like materials under uniaxial compression. Int. J. Coal Sci. Technol. 2019, 6, 372–387. [Google Scholar] [CrossRef] [Green Version]
- Afolagboye, L.O.; He, J.; Wang, S. Experimental study on cracking behaviour of moulded gypsum containing two non-parallel overlapping flaws under uniaxial compression. Acta Mech. Sin. 2017, 33, 394–405. [Google Scholar] [CrossRef]
- Yang, S.Q.; Liu, X.; Jing, H. Experimental investigation on fracture coalescence behavior of red sandstone containing two unparallel fissures under uniaxial compression. Int. J. Rock Mech. Min. Sci. 2013, 63, 82–92. [Google Scholar] [CrossRef]
- Zhao, Y.; Wang, Y.; Wang, W.; Tang, L.; Liu, Q.; Cheng, G. Modeling of rheological fracture behavior of rock cracks subjected to hydraulic pressure and far field stresses. Theor. Appl. Fract. Mech. 2019, 101, 59–66. [Google Scholar] [CrossRef]
- Cao, R.-H.; Cao, P.; Lin, H.; Fan, X.; Zhang, C.; Liu, T. Crack Initiation, Propagation, and Failure Characteristics of Jointed Rock or Rock-Like Specimens: A Review. Adv. Civ. Eng. 2019, 2019, 1–31. [Google Scholar] [CrossRef]
- Sagong, M.; Bobet, A. Coalescence of multiple flaws in a rock-model material in uniaxial compression. Int. J. Rock Mech. Min. Sci. 2002, 39, 229–241. [Google Scholar] [CrossRef]
- Wong, L.N.Y.; Einstein, H.H. Systematic evaluation of cracking behavior in specimens containing single flaws under uniaxial compression. Int. J. Rock Mech. Min. Sci. 2009, 46, 239–249. [Google Scholar] [CrossRef]
- Zhang, X.; Liu, Q.; Wu, S.; Tang, X. Crack coalescence between two non-parallel flaws in rock-like material under uniaxial compression. Eng. Geol. 2015, 199, 74–90. [Google Scholar] [CrossRef]
- Lee, H.; Jeon, S. An experimental and numerical study of fracture coalescence in pre-cracked specimens under uniaxial compression. Int. J. Solids Struct. 2011, 48, 979–999. [Google Scholar] [CrossRef] [Green Version]
- Cundall, P.A.; Strack, O.D.L. A discrete numerical model for granular assemblies. Géotechnique 1979, 29, 47–65. [Google Scholar] [CrossRef]
- Peng, F.; Wei, M.; Feng, D.; Ran, T.; Qiu, H.; Gong, J. DEM investigation on the mechanical behaviors of flawed specimens subjected to coupled static-dynamic loads. Soil Dyn. Earthq. Eng. 2020, 135, 106220. [Google Scholar]
- Cundall, P.A.; Potyondy, D.O. A bonded-particle model for rock. Int. J. Rock Mech. Min. Sci. 2004, 41, 1329–1364. [Google Scholar]
- Liu, Y.; Dai, F.; Zhao, T.; Xu, N. Numerical investigation of the dynamic properties of intermittent jointed rock models subjected to cyclic uniaxial compression. Rock Mech. Rock Eng. 2017, 50, 89–112. [Google Scholar] [CrossRef]
- Du, H.; Dai, F.; Xu, Y.; Liu, Y.; Xu, H. Numerical investigation on the dynamic strength and failure behavior of rocks under hydrostatic confinement in SHPB testing. Int. J. Rock Mech. Min. Sci. 2018, 108, 43–57. [Google Scholar] [CrossRef]
- Yang, S.Q.; Huang, Y.H.; Jing, H.W.; Liu, X.R. Discrete element modeling on fracture coalescence behavior of red sandstone containing two unparallel fissures under uniaxial compression. Eng. Geol. 2014, 178, 28–48. [Google Scholar] [CrossRef]
- Pan, H.; Yin, D.; Jiang, N.; Xia, Z.; Kong, H. Crack Initiation Behaviors of Granite Specimens Containing Crossing-Double-Flaws with Different Lengths under Uniaxial Loading. Adv. Civ. Eng. 2020, 2020, 8871335. [Google Scholar] [CrossRef]
- Shen, J.; Zhan, S.; Karakus, M.; Zuo, J. Effects of flaw width on cracking behavior of single-flawed rock specimens. Bull. Eng. Geol. Environ. 2021, 80, 1701–1711. [Google Scholar] [CrossRef]
- Shi, H.; Song, L.; Chen, W.; Zhang, H.; Wang, G.; Yuan, G.; Zhang, W.; Chen, G.; Wang, Y.; Lin, G. New non-destructive method for testing the strength of cement mortar material based on vibration frequency of steel bar: Theory and experiment. Constr. Build. Mater. 2020, 262, 120931. [Google Scholar] [CrossRef]
- Zhang, J.; Zhou, X.; Zhu, J.; Xian, C.; Wang, Y. Quasi-static fracturing in double-flawed specimens under uniaxial loading: The role of strain rate. Int. J. Fract. 2018, 211, 75–102. [Google Scholar] [CrossRef]
- Castro-Filgueira, U.; Alejano, L.R.; Arzúa, J.; Ivars, D.M. Sensitivity Analysis of the Micro-Parameters Used in a PFC Analysis Towards the Mechanical Properties of Rocks. Procedia Eng. 2017, 191, 488–495. [Google Scholar] [CrossRef]
- Xie, H.P.; Peng, R.D.; Ju, Y.; Zhou, H.W. On energy analysis of rock failure. J. Rock Mech. Eng. 2005, 24, 2603–2608. [Google Scholar]
- Xie, H.P.; Peng, R.D.; Ju, Y. Energy disspation of rock deformation and fracture. J. Rock Mech. Eng. 2004, 23, 3565–3570. [Google Scholar]
- Jin, J.; Cao, P.; Chen, Y.; Pu, C.; Mao, D.; Fan, X. Influence of single flaw on the failure process and energy mechanics of rock-like material. Comput. Geotech. 2017, 86150–86162. [Google Scholar] [CrossRef]
- Zhang, Y.; Wang, G.; Jiang, Y.; Wang, S.; Zhao, H.; Jing, W. Acoustic Emission Characteristics and Failure Mechanism of Fractured Rock under Different Loading Rates. Shock. Vib. 2017, 2017, 5387459. [Google Scholar] [CrossRef]
- Huang, Y.; Yang, S.; Zeng, W. Experimental and numerical study on loading rate effects of rock-like material specimens containing two unparallel fissures. J. Cent. South Univ. 2016, 23, 1474–1485. [Google Scholar] [CrossRef]
- Li, D.; Han, Z.; Sun, X.; Zhou, T.; Li, X. Dynamic Mechanical Properties and Fracturing Behavior of Marble Specimens Containing Single and Double Flaws in SHPB Tests. Rock Mech. Rock Eng. 2019, 52, 1623–1643. [Google Scholar] [CrossRef]
- Zheng, L.; Huang, D.; Li, X.; Hu, X.; Tang, Y. Numerical Analysis of Fracture Behaviour on Marble Samples Containing Two Flaws. Adv. Civ. Eng. 2020, 2020, 1–15. [Google Scholar] [CrossRef]
- Cho, N.; Martin, C.D.; Sego, D.C. A clumped particle model for rock. Int. J. Rock Mech. Min. Sci. 2007, 44, 997–1010. [Google Scholar] [CrossRef]
- Shi, H.; Zhang, H.; Song, L.; Yang, Z.; Yuan, G.; Xue, X.; Wang, Y. Failure characteristics of sandstone specimens with randomly distributed pre-cracks under uniaxial compression. Environ. Earth Sci. 2020, 79, 1–21. [Google Scholar] [CrossRef]
- Yang, S.; Tian, W.; Huang, Y.; Ranjith, P.G.; Ju, Y. An Experimental and Numerical Study on Cracking Behavior of Brittle Sandstone Containing Two Non-coplanar Fissures Under Uniaxial Compression. Rock Mech. Rock Eng. 2016, 49, 1497–1515. [Google Scholar] [CrossRef]
- Liu, T.; Lin, B.; Yang, W.; Zou, Q.; Kong, J.; Yan, F. Cracking Process and Stress Field Evolution in Specimen Containing Combined Flaw Under Uniaxial Compression. Rock Mech. Rock Eng. 2016, 49, 3095–3113. [Google Scholar] [CrossRef]
- Donzé, F.V.; Richefeu, V.; Magnier, S. Advances in discrete element method applied to soil rock and concrete mechanics. Electron. J. Geol. Eng. 2009, 8, 1–44. [Google Scholar]
- Fan, X.; Li, K.; Lai, H.; Xie, Y.; Cao, R.; Zheng, J. Internal stress distribution and cracking around flaws and openings of rock block under uniaxial compression: A particle mechanics approach. Comput. Geotech. 2018, 102, 28–38. [Google Scholar] [CrossRef]


| Parameters | Value | Remark |
|---|---|---|
| Contact bond stiffness ratio | 1.2 | |
| Contact bond modulus (GPa) | 3.76 | |
| Friction coefficient | 0.35 | |
| Parallel bond stiffness ratio | 1.2 | |
| Parallel bond modulus (GPa) | 3.76 | |
| Parallel bond tension strength, mean (MPa) | 17.2 | Normal distribution |
| Parallel bond tension strength, standard deviation (MPa) | 2.06 | |
| Parallel bond cohesion, mean (MPa) | 28.0 | Normal distribution |
| Parallel bond cohesion, standard deviation (MPa) | 3.36 | |
| Parallel bond friction angle (°) | 30 |
| Type | Density ρ/(g/cm3) | Young’s Modulus E/GPa | Uniaxial Compressive Strength σc/MPa |
|---|---|---|---|
| Experimental results | 2.2 | 7.50 | 46.35 |
| Simulation results | 2.2 | 7.47 | 46.32 |
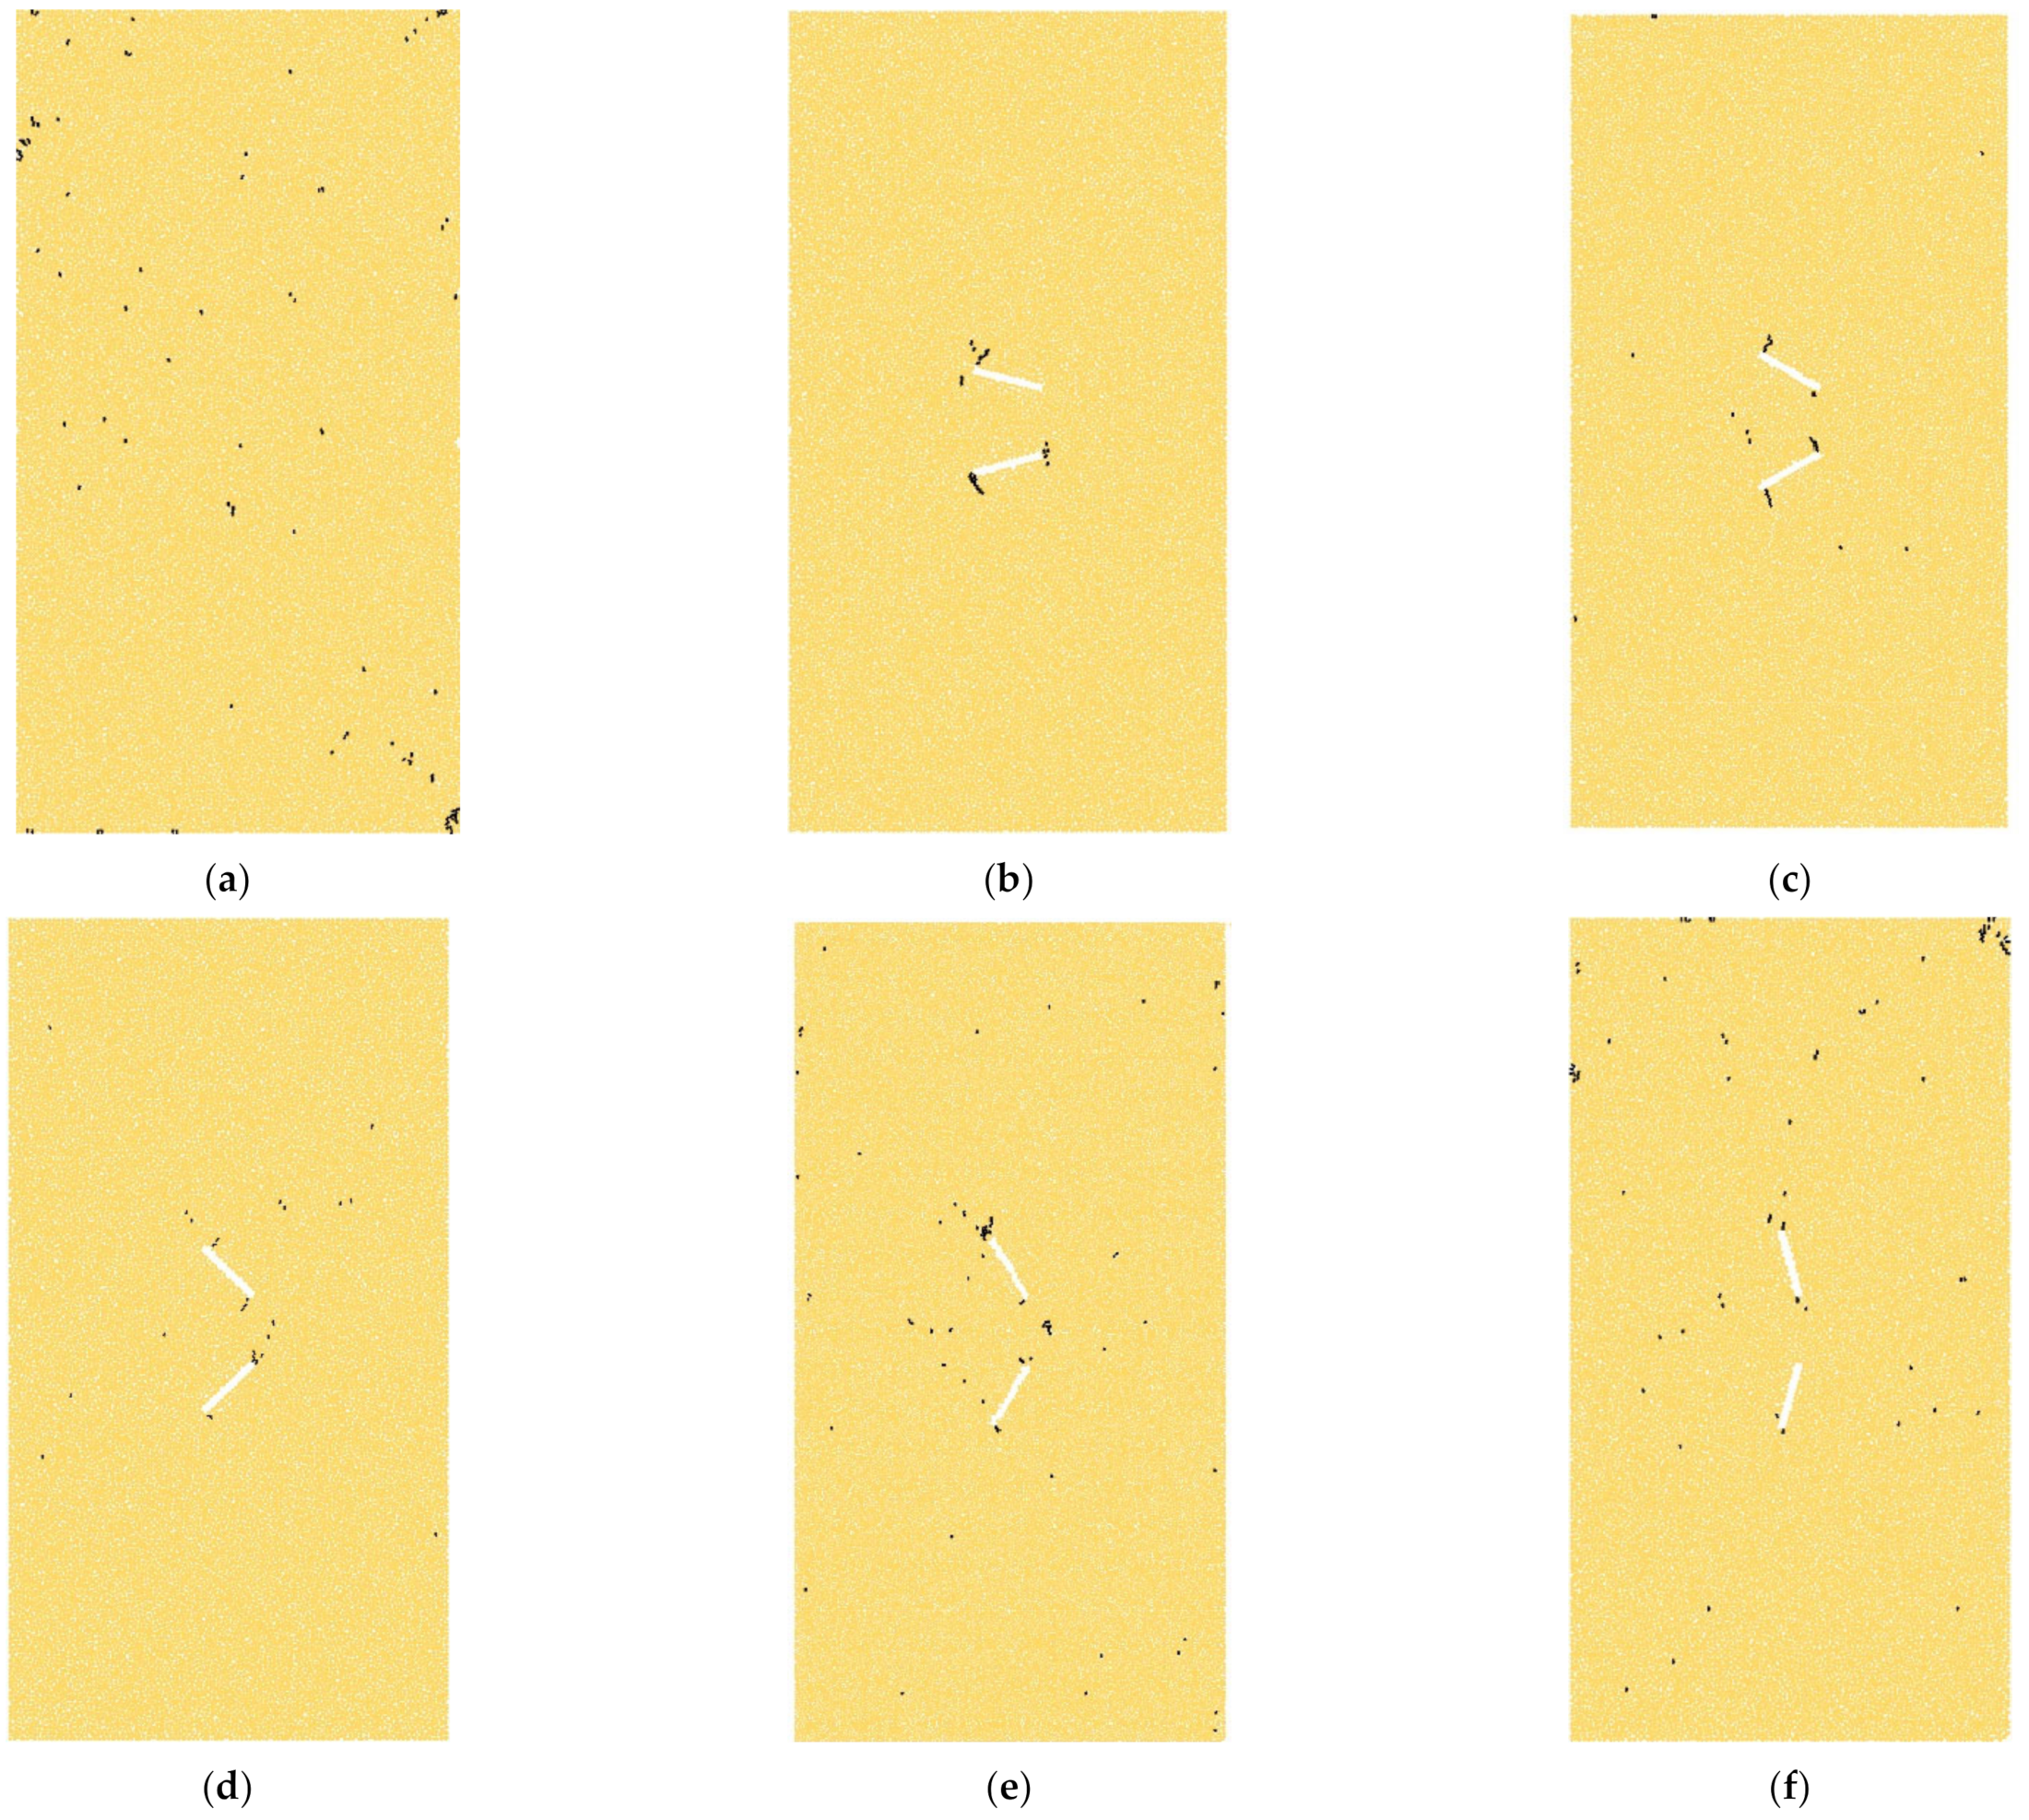
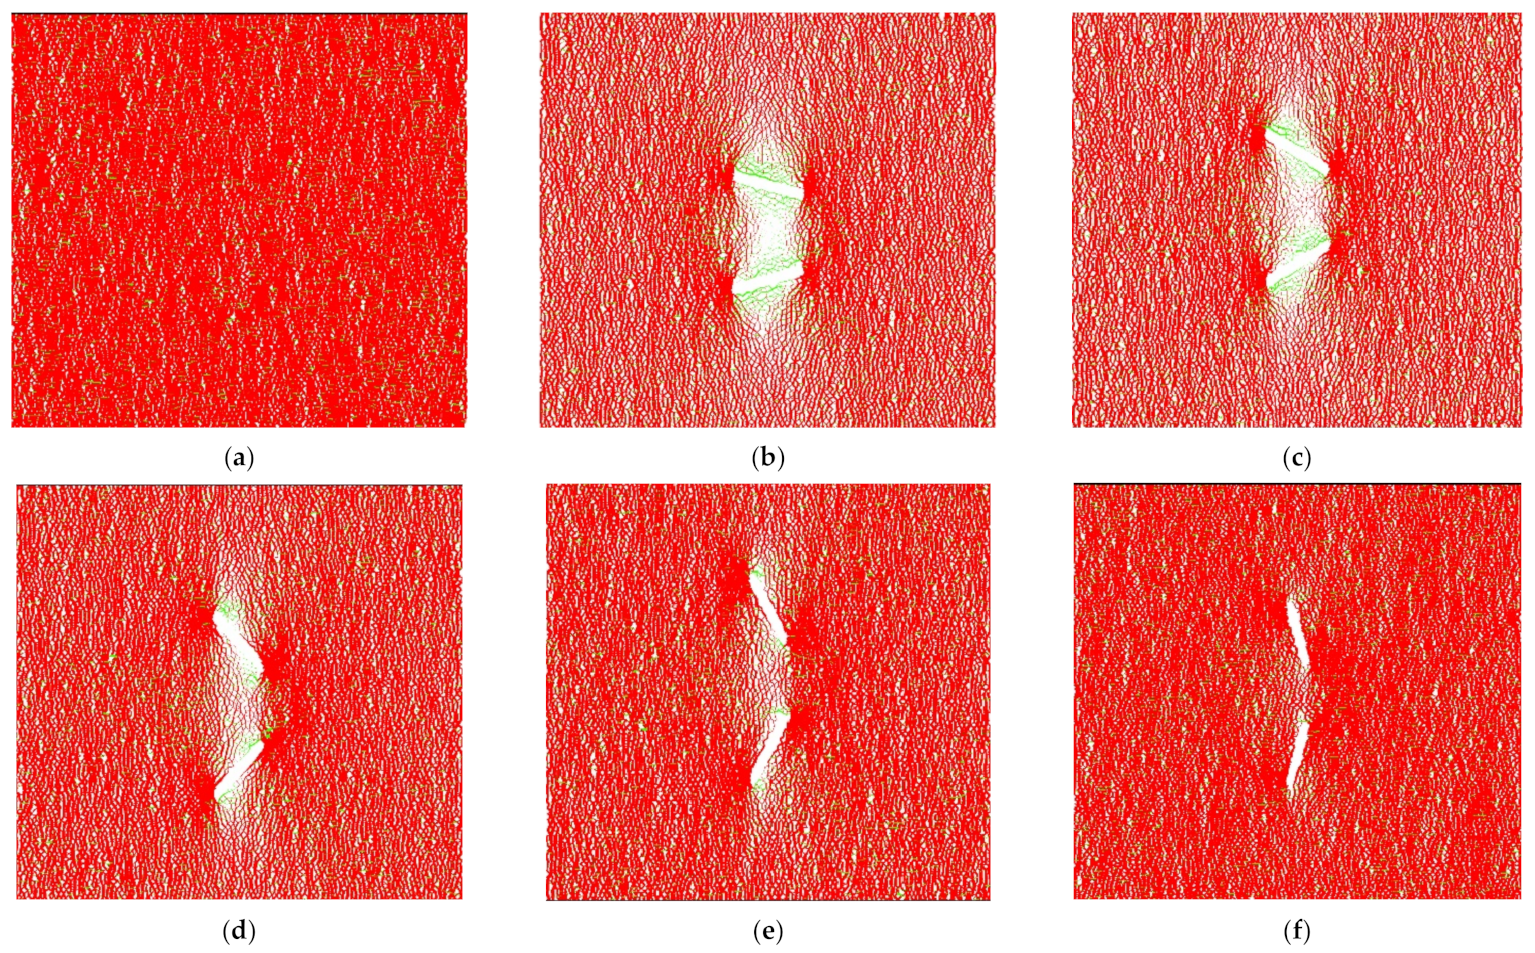
| Flaw Inclination Angle/(°) | Diagram of Crack Propagation in Physical Experiments | Diagram of Simulation Results |
|---|---|---|
| 15 |  |  |
| 30 |  |  |
| 45 |  |  |
| 60 |  |  |
| Flaw Inclination Angle/° | E/J | Ee/J | Ed/J | Ee/E | Ed/E |
|---|---|---|---|---|---|
| 15 | 887 | 846 | 41 | 95.38% | 4.62% |
| 30 | 1090 | 1034 | 51 | 94.86% | 5.14% |
| 45 | 1209 | 1152 | 57 | 95.29% | 4.71% |
| 60 | 1348 | 1282 | 61 | 95.10% | 4.90% |
| 75 | 1501 | 1427 | 74 | 95.07% | 4.93% |
Publisher’s Note: MDPI stays neutral with regard to jurisdictional claims in published maps and institutional affiliations. |
© 2022 by the authors. Licensee MDPI, Basel, Switzerland. This article is an open access article distributed under the terms and conditions of the Creative Commons Attribution (CC BY) license (https://creativecommons.org/licenses/by/4.0/).
Share and Cite
Wu, P.; Chen, Y.; Li, Q.; Mao, X.; Zhang, L.; Li, M.; Chen, L.; Zhao, Z. Simulation Study on Crack Initiation and Energy Mechanisms of Rock-like Samples with Non-Parallel Overlapping Flaws under Uniaxial Compression. Appl. Sci. 2022, 12, 10367. https://doi.org/10.3390/app122010367
Wu P, Chen Y, Li Q, Mao X, Zhang L, Li M, Chen L, Zhao Z. Simulation Study on Crack Initiation and Energy Mechanisms of Rock-like Samples with Non-Parallel Overlapping Flaws under Uniaxial Compression. Applied Sciences. 2022; 12(20):10367. https://doi.org/10.3390/app122010367
Chicago/Turabian StyleWu, Peng, Yanlong Chen, Qiang Li, Xianbiao Mao, Lianying Zhang, Ming Li, Liang Chen, and Zhong Zhao. 2022. "Simulation Study on Crack Initiation and Energy Mechanisms of Rock-like Samples with Non-Parallel Overlapping Flaws under Uniaxial Compression" Applied Sciences 12, no. 20: 10367. https://doi.org/10.3390/app122010367