1. Introduction
Glioma, comprising around 50% of all intracranial primary tumors, is the most common brain tumor. This condition can induce a variety of neurological symptoms, primarily reflecting the function of the tumor site in the brain. This can result in motor dysfunction, cognitive problems, and change in personality. It is important to note that Motor dysfunction relates to schizophrenia, with a preceding clinical symptom in recent longitudinal investigations. The increased occurrence of involuntary motions that are evident from childhood and reflect subcortical brain disorders is of special interest. Cure is now uncommon, and any treatment aims for minimizing the symptoms delay the progression of disease and maximise the length of time of survival with the highest possible quality of life.
The fact that glioma exhibits a wide range of clinical behavior suggests that our present concept of high-grade glioma as a stand-alone disease entity is oversimplified. In addition to host characteristics, such as age and gender, biological variables, including MGMT promoter methylation status, 1p/19q deletion, and IDH1 gene mutation status, were demonstrated to explain some of the observed variance. This also can be highlighted by the fact that molecular subtyping is used to separate.
Gliomas have a dismal prognosis, with recurrence or progression being unavoidable. Its progression patterns can have a wide range of phenotypes, which could alter the treatment approach and clinical result. The inability of current therapeutic choices (chemotherapy, radiation, and surgical resection) to prevent disease development (known as relapse/recurrence) is responsible for bad prognosis. Gliomas infiltrate the underlying brain parenchyma and go far beyond the radiological or surgical brain tumor barrier on a microscopic level. There exist differences in the regional patterns of progression in gliomas, as well as differences in ‘overall survival’ or ‘progression-free-survival’ (PFS) on a clinical level. Such a diverse landscape of these tumors suggests the need to develop imaging-based markers that are prognostic of patient outcome at the initial presentation of the disease to assist in building patient-centric treatment plans [
1,
2].
Several old analyses show the usefulness of MRI features obtained from different compartments of the gliomas in survival prediction in gliomas [
3,
4,
5]. Macyzyn et al. [
6]. extracted intensity, volumetric, and shape features from various subregions of gliomas and applied traditional machine learning models for prediction of OS. Baid et al. [
7] also used radiomic features extracted from several MR images to predict disease prognosis, thus providing useful knowledge for personalized care. This work uses FLAIR and T1CE data to extract intensity-based length, first-order textural radiomic, shape-based and characteristics. The region of interest (ROI) is then decomposed using a stationary wavelet transform (WT) with low-pass (LP) and high-pass (HP) filtering. Furthermore, radiomic characteristics are recovered from these deconstructed pictures, assisting in the gathering of directional information. The proposed approach was evaluated using brain tumor segmentation (BraTS) challenge training, validation, and test datasets, providing 0.695, 0.571, and 0.558 on training, validation, and test datasets, respectively. Sun et al. [
8] in their survial prediction study, extracted 4524 radiomic features which are segmented from tumor regions, the important features are selected using cross validation and decision tree. Finally, they used the random forest model to achieve 61% classification success in prediction of short verssu long-term survivors. Recently, the deep learning methods have been utilized for survival prediction. Zhao et al. [
9] proposed a deep learning architecture, named segmentation then prediction, which was based on 3D U-Net. The proposed architecture comprised a segmentation component, which delineates the tumor into the three main subregions (i.e., whole tumor, enhancing tumor and tumor core), and a feature extractor, by computing features from (i) whole tumor only, and (ii) from final layer of segmentation component. Global and local features were used together to predict survival in gliomas, yielding the validation accuracy of 65.5%. In yet another study on survival prediction of gliomas by Asma et al. [
10], authors used multi-regional radiomics analysis by employing the three-subregions radiomics, six-subregions radiomics and twenty one-subregions radiomics model. The top performance was obtained using 3-subregions radiomics model with (mean AUC = 0.73). Wankhede et al. [
11] proposed a model that is multilevel layer and dynamic architecture in a faster R-CNN (MLL-CNN) approach. This model utilizes the relative description model based on feature weight factor to build selected features to predict glioblastoma survival. Some researchers also show the effectiveness of combining traditional features extracted from MRI images and the deep learning features extracted by the deep learning models. Hunag et al. [
12] extracted intensity, wavelet, texture, shape along with radiological features taken from tumor area, and a CNN network based deep features. They used the random forest regression model for prediction of OS in gliomas and reported a root mean square error of 311.5. Suter [
2], used 4 MR images (T1, T2, T1c and FLAIR), extracted an initial set of 1353 features. They used deep learning CNN1 and CNN2 strategies. Their method performed well, but they used only radiomics sets and their characteristics and features.
Some researchers used pathology features obtained from the regions demarcated on pathology images [
13] Iftikhar et al. [
13] trained a deep neural network on 663 pathology images acquired from TCIA to estimate parameters of microvascular proliferation, nuclear atypia, mitotic activity and the presence of necrosis, and eventually predict OS. They reported a c-statistic of 0.82 (
p-value = 4.8 × 10
−5) between overall survival and risk scores of proposed deep learning model. Rathore et al. [
14] also confirmed these findings using the same dataset. Similarly, Mobadersany et al. [
15] used a survival neural network on 769 pathology images acquired from TCIA to predict OS in gliomas. They reported a c-statistic of 0.77 between OS deep learning model with risk score.
Despite the various studies showing the potential of MRI and pathology images alone in the prediction of OS, the previous studies lack in exploiting the integrated potential of radiology and pathology images, which provide diagnostically relevant information. In these prioir studies, only radiology or pathology images commonly employed, in contrast to synergistically to combine both imaging modalities to build more robust predictive and most powerful model.
To overcome shortcomings, we analyze and integrate entirety of pathology and radiology data and leverage the power of advanced pattern analysis methods to achieve better prognosis of gliomas. We hypothesise in this study that the integration of MRI and digital pathology images can be utilized for better prognosis of gliomas compared to that achieved with either of these imaging modalities. The proposed method utilizes the MRI images, as well as digital pathology images, as input data, and the combination thereof to achieve better prognosis of gliomas. The anticipated technique was assessed on a diverse set of glioma patients, including low-grade gliomas (LGG) and high-grade gliomas (HGG). Ensemble regression models are opted to predict patients’ survival outcome owing to the better performance that ensembles offer over traditional weak learners.
The main contributions of our study are:
Exploit the rich phenotypic information present in radiology and histology images through multivariate pattern analysis methods for prediction survival in gliomas.
Perform robust statistical analysis on individual radiology and pathology features and their combinations via multiple permuted iterations.
Validate the model on a diverse multi-institutional cohort of images by using a complete glioma dataset and also individual cancer grades.
The remining paper is divided in following parts: material and method is described in
Section 2. The results are detailed in
Section 3, discussion in
Section 4, and
Section 5 concludes the paper.
2. Materials and Methods
2.1. Dataset
The dataset utilized in this study comprises 171 glioma patients (gender: 91 male and 80 female, tumor grade: 96 LGG and 75 HGG) collected from The Cancer Image Archive (TCIA) and The Cancer Genomic Atlas (TCGA) repository. The data comprised (1) preoperative MRI images, including T1 post contrast gadolinium (T1-GD), T1-wegihted (T1), T2-wegihted (T2), and T2-weighted fluid-attenuated inversion recovery (T2-FLAIR), (2) digital pathology images collected from paraffin-embedded H&E-stained tissue sections, and (3) survival information. Survival outcome was collected from medical records and was defined as the time from the initial presentation of the disease to death or last follow-up time, whatever happened earlier. In our study, some patients’ data was censored because the last follow-up interval preceded the end of the study as well as the death. As such, the survival time can be stated conclusively and is just known to be longer than the latest follow-up.
Table 1 provides more details on the dataset.
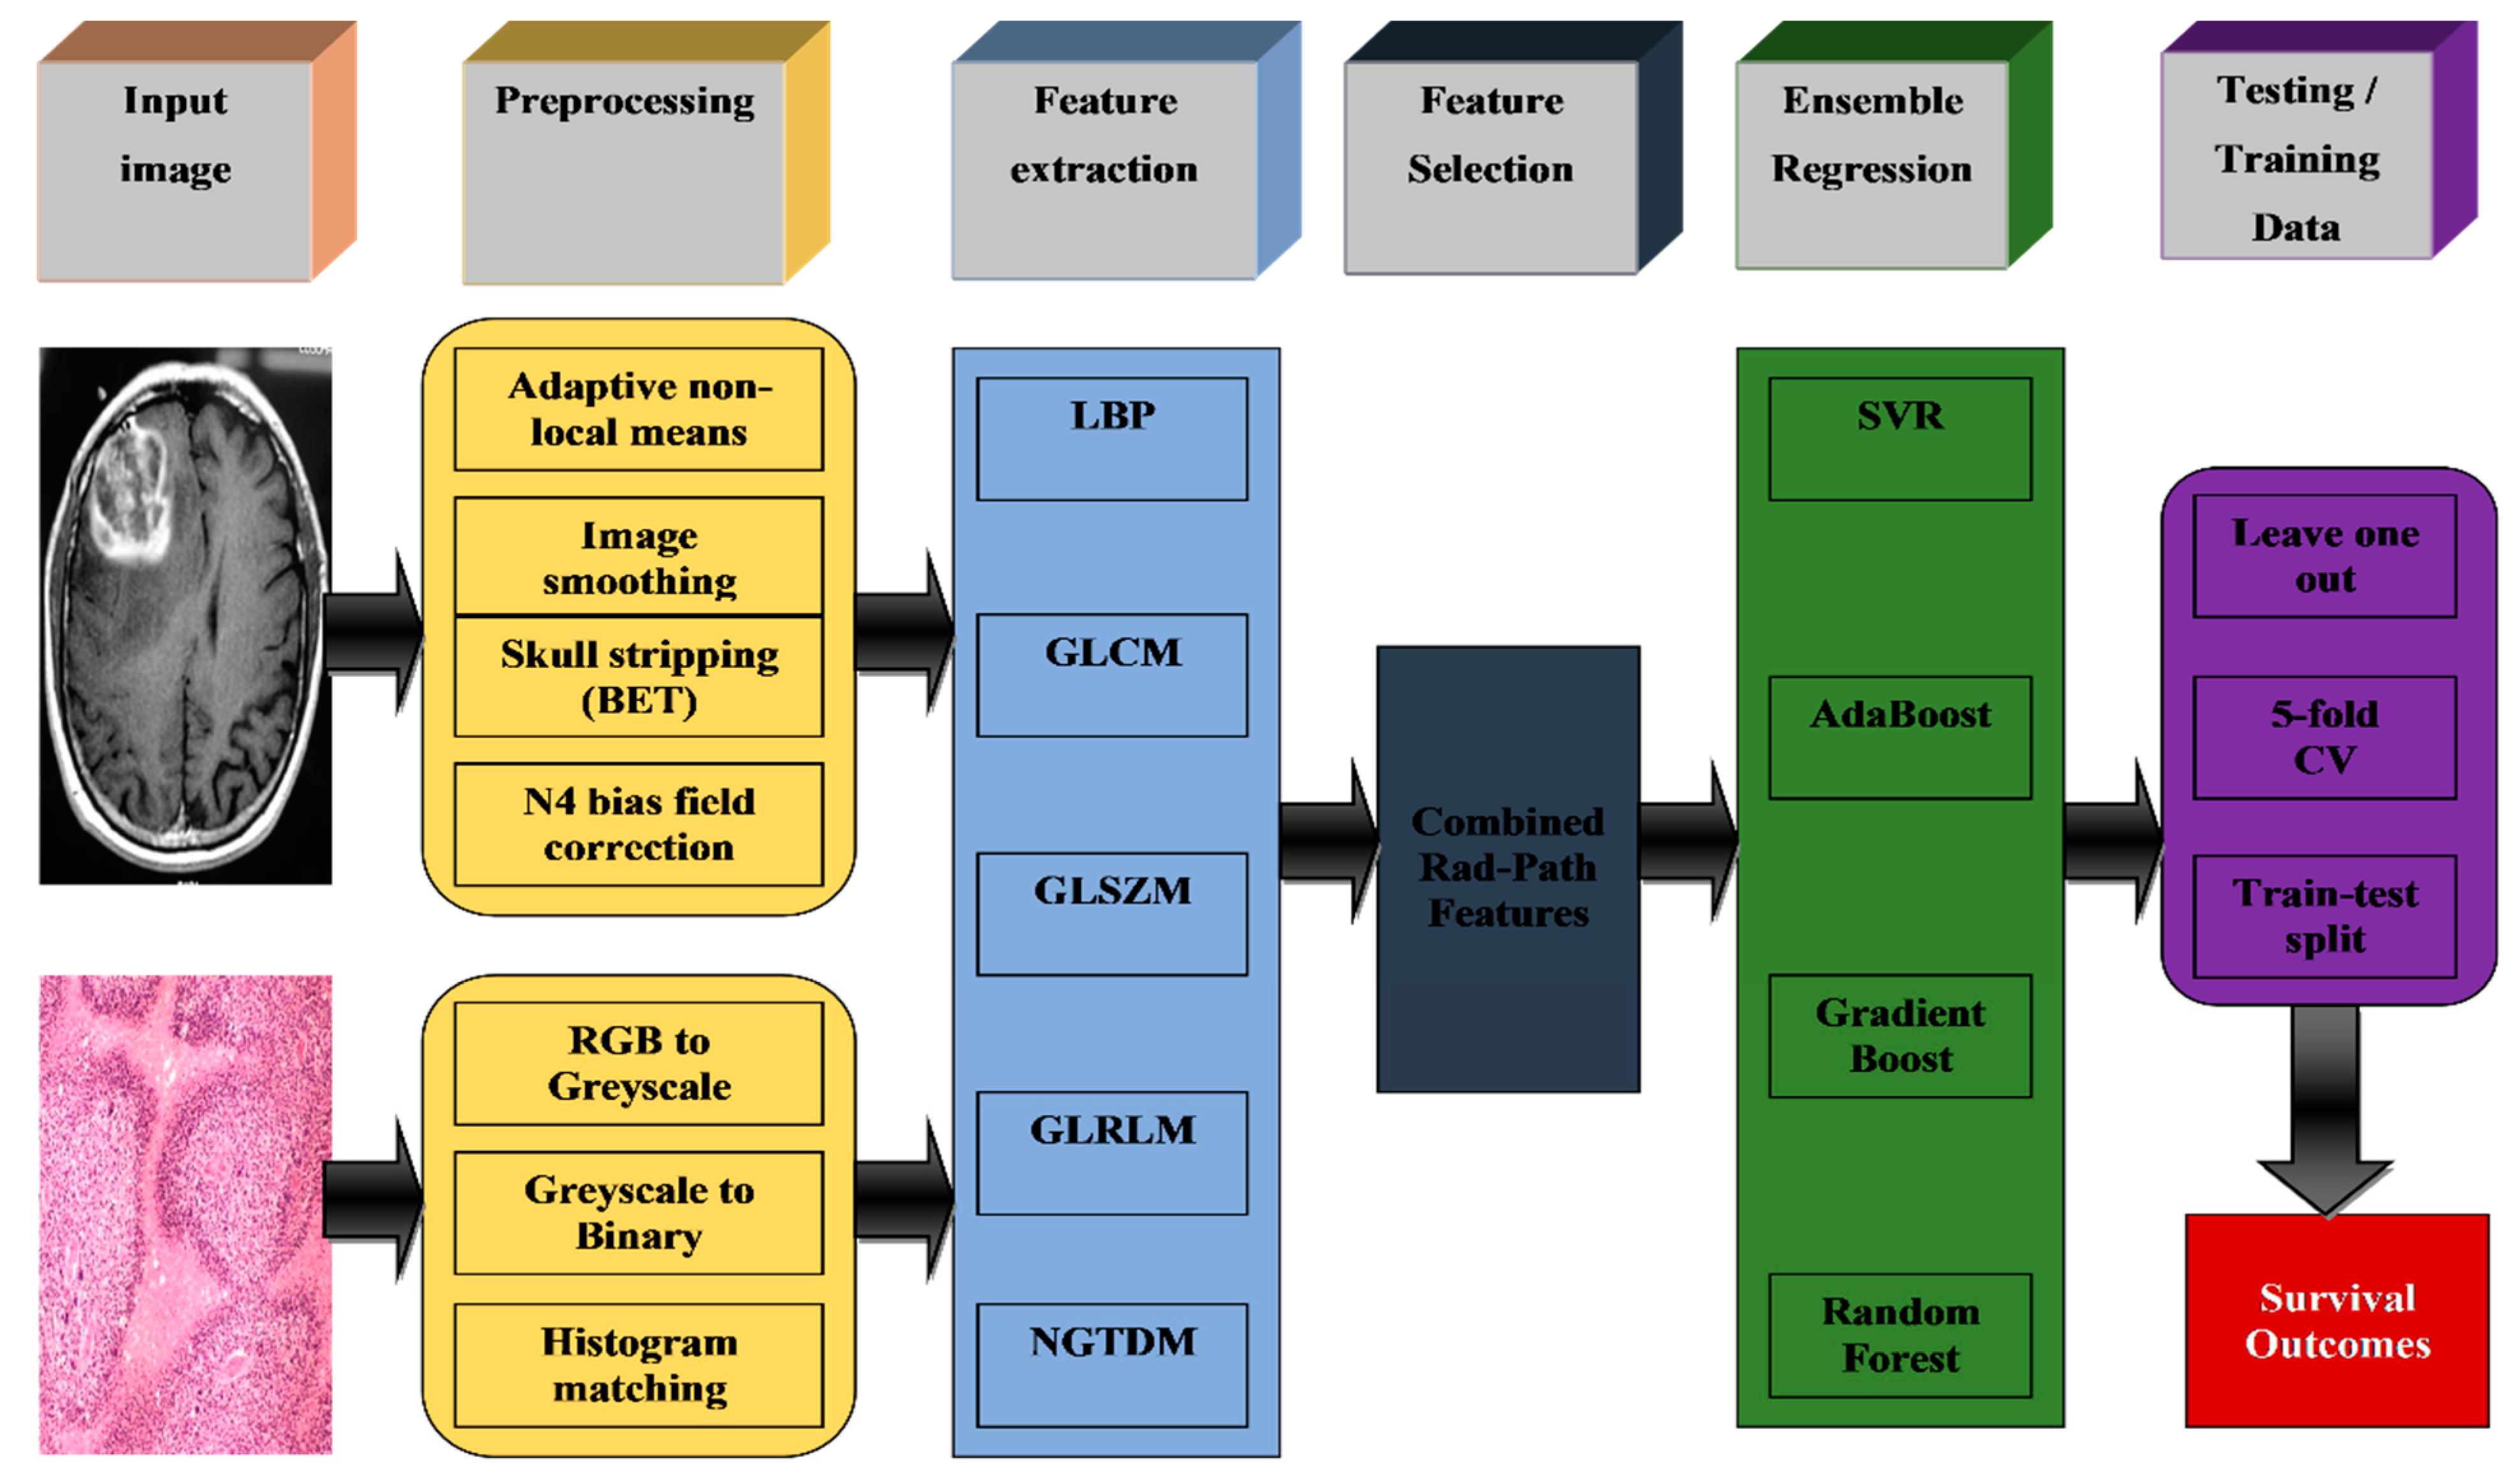
Figure 1 provides a schematic overview of the proposed ensemble regression-based survival prediction method. Several pre-processing steps are applied both on MRI and digital pathology images. The MRI images were smoothed using the adaptive nonlocal means algorithm [
7,
8,
9] followed by the registration of T1, T2, and T2-FALIR images to T1-CE images using the FLIRT registration method [
10], and brain extraction tool was used using skull stripping. The N4 biased field correction method [
11] was also applied on the images to remove intensity inhomogeneities happening because of image acquisition. The digital pathology images were converted to grayscale and were calibrated to a reference digital pathology image to correct for color inconsistencies in images acquired across multiple institutions. Feature extraction methods were then applied on the pre-processed images to quantify the imaging profiles of these glioma patients into meaningful quantitative measures. In this study, features extracting techniques, such as GLCM, GLSZM, GLRLM, LBP, and NGTDM, are used to extract relevant information from rad and path images. The final step of the pipeline involves an ensemble of various regression techniques to predict survival outcome of glioma patients. These features were given as input to the final step of the pipeline, which is an ensemble of various regression techniques, including support vector regression (SVR), SVR with RBF kernel and linear kernel, AdaBoost, gradient boost, and random forest, for prediction of survival outcome of glioma patients.
The
Table 1 presents the Glioma patients’ characteristics with clinical information of complete set, training and test group along with the
p-Value.
2.2. Feature Extraction
This is an important step to develop a conventional machine learning model is to extract features and to select the most relevant features based on the type of the problem at hand. Features play an important role in image processing. Extracted features provide a convenient way in converting an input image to a set of quantitative values [
12]. Different features have special supremacy over diagnosis criterion [
13]. In this study, we employed different texture feature extraction methods, such as neighbourhood gray-tone difference matrix features, gray length size zone matrix, gray-level co-occurrence matrix (GLCM), and gray-level run-length matrix (GLRM), in order to extract appropriate and relevant information from an input set of images. These features are shown to be very effective in the past in differentiating between the cancerous and healthy cases [
16] and predicting survival outcome not only in the pathology domain, but also in MRI images [
4,
17,
18].
Local binary pattern (LBP) features: The original LBP [
19] was proposed by the University of Oulu’s computer vision group in Finland. It was initially used to classify texture images and since gained popularity in the domains of computer vision and pattern recognition. The original LBP was defined in a 3 × 3 rectangular region, which significantly constrained texture information extraction and made it impossible to produce rotation invariant features. As a result, Ref. [
20] transformed LBP’s rectangular neighbourhood structure into a circular neighbourhood structure and used uniform sampling of
p neighbourhood points in a circular local structure with radius R. However, the size of LBP characteristics grows exponentially with the number of neighbourhoods, severely limiting computation performance and storage space.
Neighbourhood grey-tone difference matrix (NGTDM) features: texture features obtained from an NGTDM neighbourhood gray-tone difference matrix to classify cancerous nodules in a patient could be used as predictors; the value of those texture features expressed the intensity variations between a voxel and its neighbouring voxels, according to the definition of those NGTDM textural features [
21].
Grey level size-zone matrix (GLSZM) features: A standardized texture is made up of vast regions with the same intensity, rather than smaller groupings of pixels or segments in any given direction. To account for this feature, the size of each region containing pixels of the same intensity level has to be taken into account in a matrix. This matrix was created using run length matrix principle: value of the matrix’s
square equals the number of regions of size s and grey level
[
22]. Grey level run length matrix (GLRLM) features: The grey level run length matrix is a statistical texture characterisation technique [
23]. This approach involves to count pixel segments number with same strength in a particular direction and then displaying the results in a matrix [
22]. The grey level run length matrix (GLRLM) is a matrix that may be used to extract texture characteristics for texture analysis [
24]. The GLRLM approach is a technique applied to obtained the higher order statistical texture characteristics. A grey level run is defined as a line of pixels with the same intensity value that runs in a certain direction [
24]. The grey level run length is defined by number of such pixels, and number of occurrences is referred to as run length value. In this context, a run length is defined as number of neighbouring pixels with same grey intensity in a certain direction. Grey level co-occurrence matrix (GLCM) features: GLCMs are often referred to as spatial grey level dependence matrices. It is a popular second-order statistical method for extracting texture information from images. The GLCM functions are utilized to determine an image’s texture features by computing pixel occurrence with certain values and in a specific spatial relationship. GLCM may be created in four different directions
[
24]. This method is old and most effective statistical texture representation methods [
22].
2.3. Ensemble Regression
Regression [
25] methods, analogous to machine learning (ML), are not only used for forecasting and prediction, but are also employed to determine the causal relationships between the variables in particular instances [
26]. Regression analysis determines value of dependent y variable based on range of independent variable values ‘
’ [
27]. Linear regression [
28] is a frequently used mathematical research approach in which the projected effects may be measured and modelled against various input variables. Ensemble regression combines a group of weak learner models and data used to train these learners. By aggregating predictions from its weak learners, it can anticipate ensemble responses for new data. In this study, we trained several individual weak learners, the survival outcomes of which were averaged to calculate the final survival outcome of each test patient. We used the following weak learners:
Support vector regression (SVR): The SVR [
29] models are employed to solve nonlinear regression problems of estimation. SVR demonstrated great performance in nonlinear regression analysis, the research on using SVR to solve reliability prediction issues is still restricted.
AdaBoost: AdaBoost algorithm was proposed by Freund and Schapire [
30] was first practical boosting algorithm which is now most widely used in many applications. Schapire [
31] defines dignified indulgent of nature of learning at its core. It is a decision tree algorithm by generating a forest of stumps (i.e., simple trees with one node and two leaves). Stumps having ineffective regressors are poor learners. Each created stump has its own vote; whereas, the votes are distributed based on the error of various vote weights
[
32].
Gradient boost: A machine learning method which is used for both classification and regression problems. A basic parameterized function is used by building the additive regression model to current “pseudo”-residuals using least squares. The pseudo-residuals are gradient of loss function that is being minimised in relation to model values at each training data point assessed in current phase [
33].
Random forest (RF): In 2001, Breiman introduced a random forest technique to categorise machine learning [
34]. The random forest approach had a substantial influence on artificial intelligence, computer development and machine learning [
35].
3. Results
The statistical analysis was performed using R version 3.2.4 developed by R Foundation for Statistical Computing, Vienna, Austria. In this section, the obtained results and discussions of ensemble regression methods are presented for the prediction of survival of glioma patients. The results gained from extracted features LBP, GLCM, GLSZM, GLRLM, and NGTDM from radiology (rad) images, pathology (path) images, and combination (ad-path) images are processed through the ensemble regression machine learning method, comprising support vector regression (SVR), AdaBoost, gradient boost, random forest (RF).
To confirm the robustness of the method, while avoiding overfitting on the same patient sets, we evaluated the ensemble regression method in all 171 patients using leave-one-out (LOO) cross-validation (configuration-I), repeated 5-fold cross-validation (configuration-II), and repeated the split-train-test (3:2 ratio) (configuration-III). In all the configurations, rad, path, and rad-path features were separately used to evaluate the performance on all the cancer grades (i.e., HGGs + LGGs, HGGs, and LGGs). The outputs of the models were compared against the actual survival to calculate the performance in terms of Pearson’s correlation coefficient (PCC). The value of PCC ranges from −1 to +1, where values lower and higher than zero, respectively, show negative and positive correlation, with −1 and +1 being the highest values of correlation. Performance is also summarized in terms of mean absolute error.
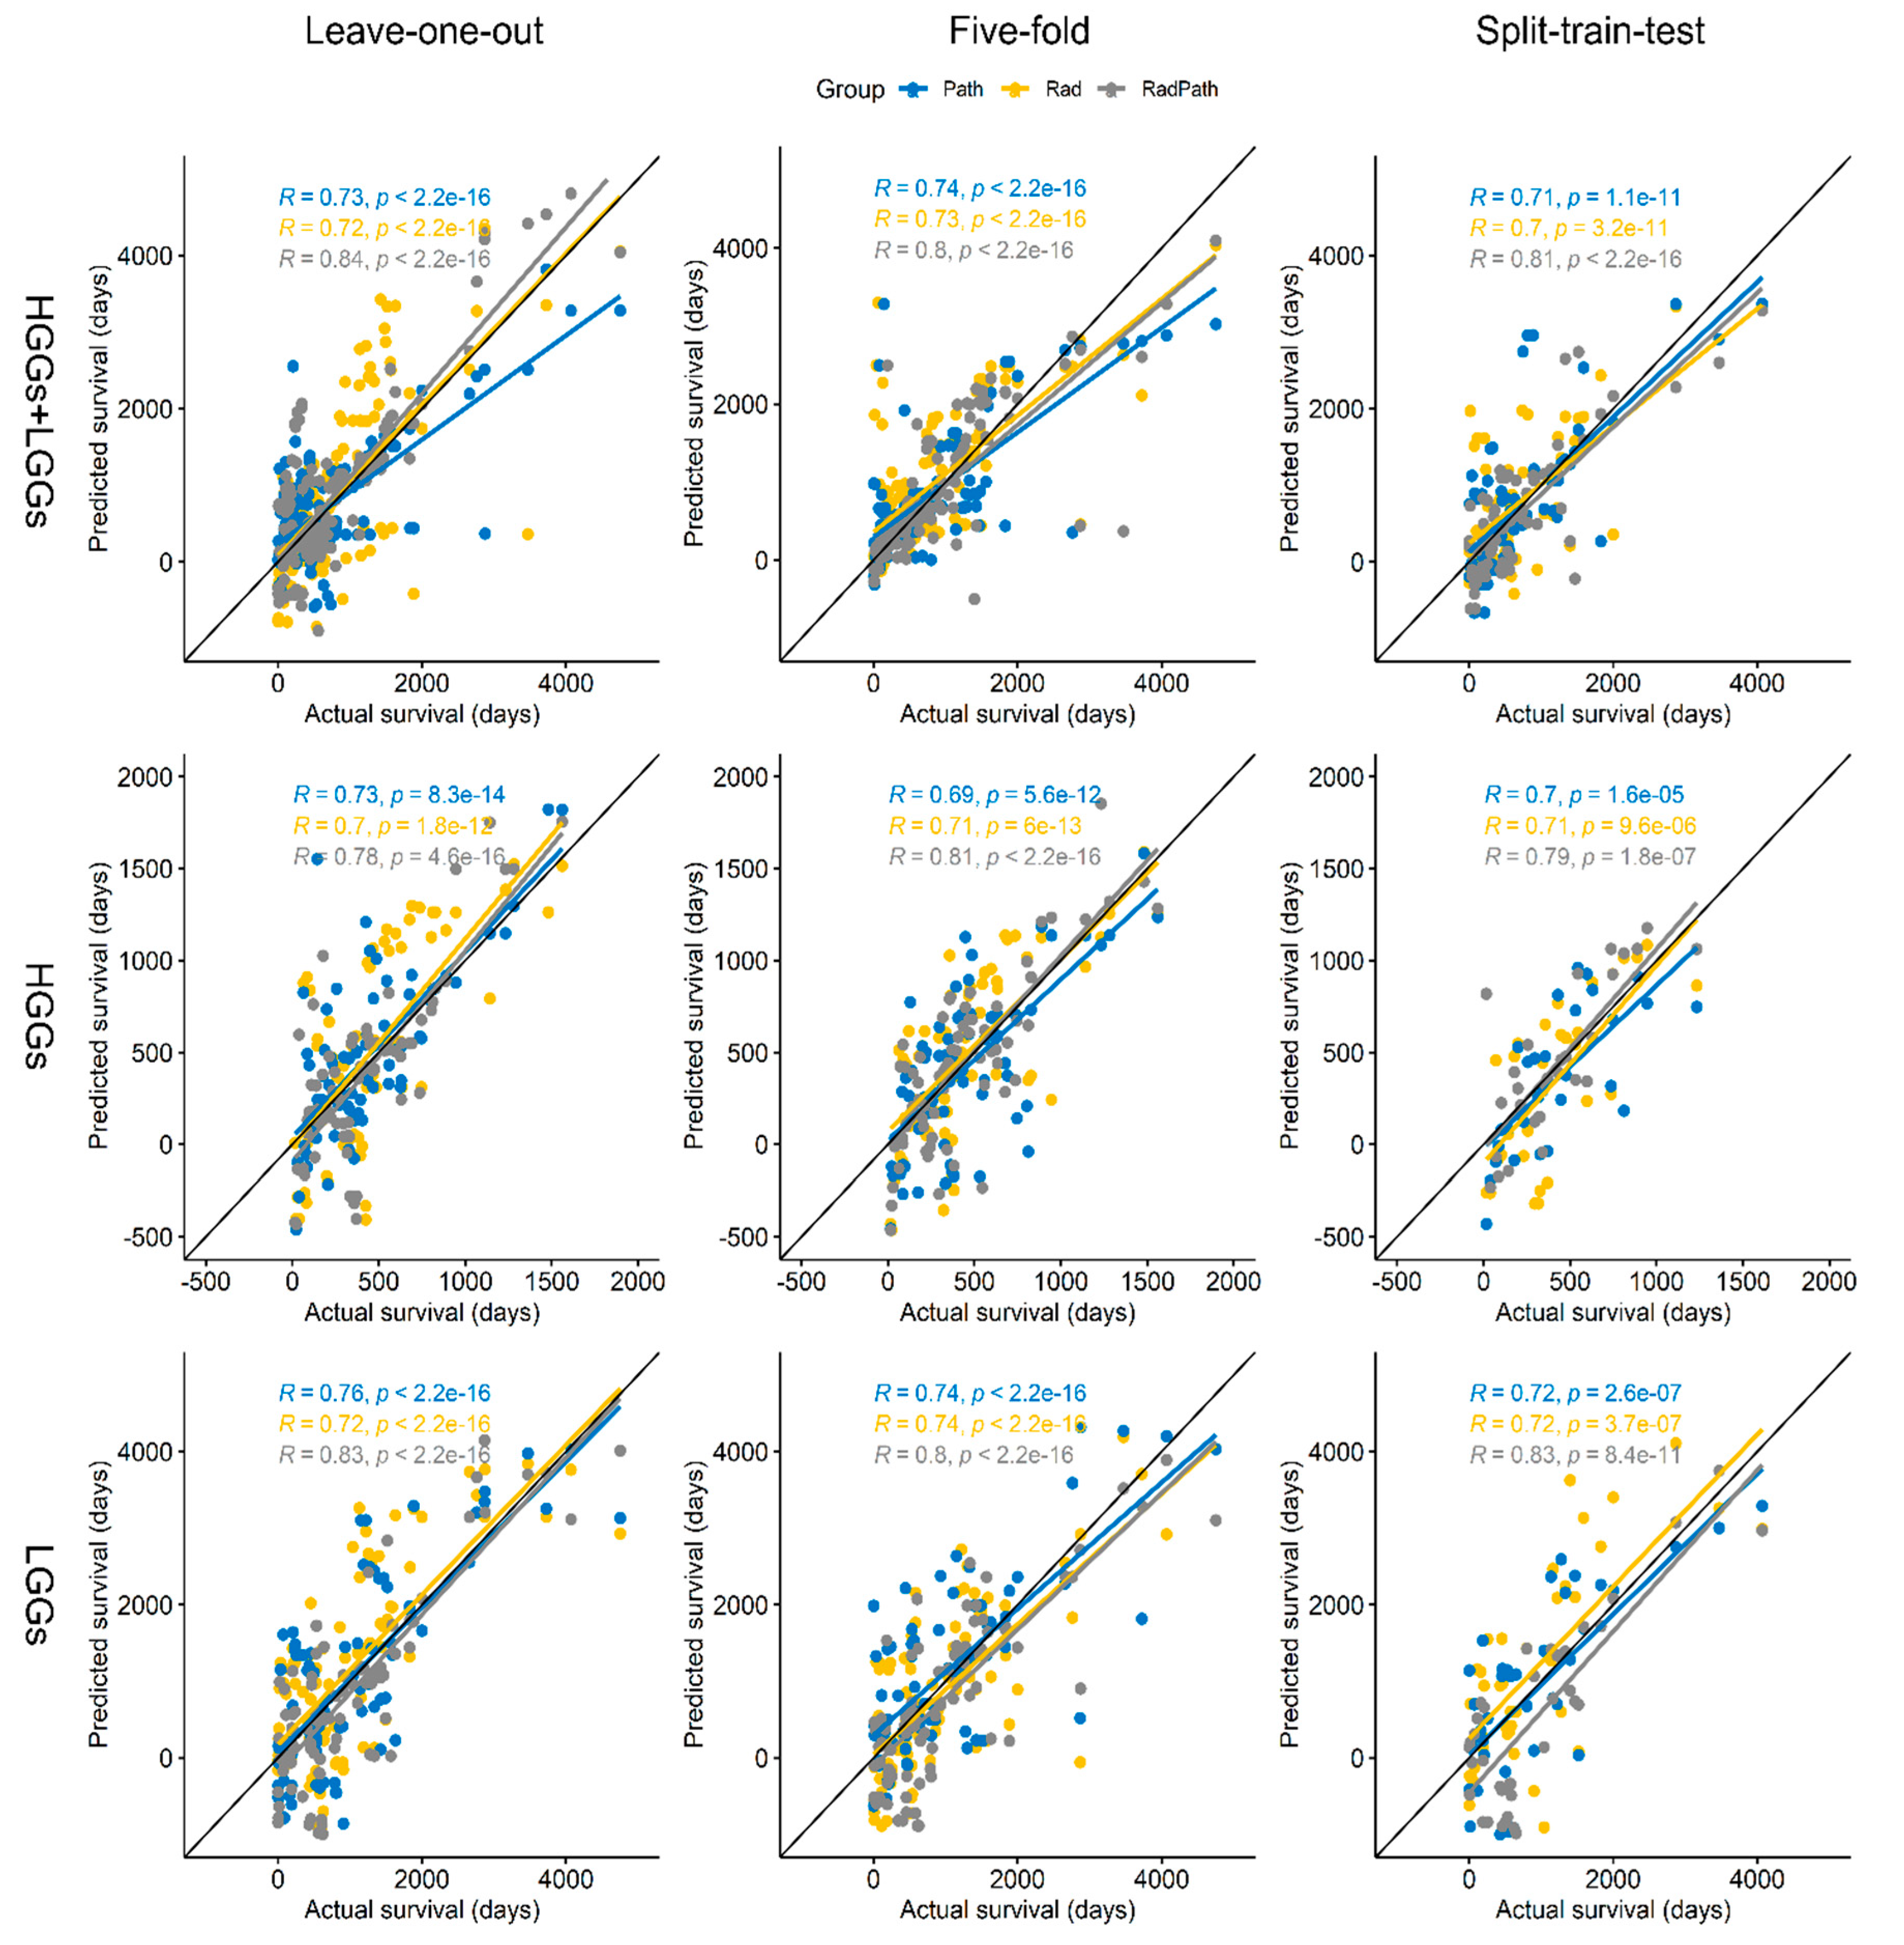
Survival prediction results of the proposed method are given in
Figure 2, where the x-axis shows the actual survival of the patients and the y-axis shows the predicted survival in terms of the number of days. In split-train-test configuration, the proposed method yielded robust performance, as shown by the calculated Pearson’s correlation coefficients for rad-path.
followed by pathology (path) images with
and radiology (Rad) images
. The survival prediction of HGGs patients (second row) yielded with test-train split validation for rad-path images, producing PCC of
followed by pathology (path) images with
and radiology (rad) images
. The survival prediction combined sample LGGs and HGGs (first row) patients se yielded with test-train split validation for rad-path images producing PCC of
followed by pathology (path) images with
and radiology (rad) images with
.
The second column in
Figure 2 presents the results of 5-fold cross-validation, the survival prediction of sample LGGs patients set (third row) yielded with 5-fold cross-validation for rad-path images producing PCC of
followed by pathology (path) images with
and radiology (rad) images
. The survival prediction of the sample HGGs patient’s dataset (second row) yielded with 5-fold cross-validation for rad-path images producing PCC of
followed by pathology (path) images with
and radiology (rad) images
. The survival prediction of the sample LGGs and HGGs patients combined dataset first row) yielded with 5-fold cross-validation for rad-path images producing Pearson’s correlation coefficient of
followed by pathology (path.) images with
and radiology (rad.) images
.
The first column in
Figure 2 presents LOO configuration, the survival prediction of sample LGGs patient’s dataset (third row) yielded with leave-one-out cross-validation for rad-path images producing PCC of
followed by pathology (path) images with
and radiology (rad) images
. The survival prediction sample HGGs patient’s dataset (second row) yielded with leave-one-out cross-validation for rad-path images producing PCC of
followed by pathology (path) images with
and radiology (rad.) images
. The survival prediction of sample the LGGs and HGGs patients combined dataset (first row) yielded with leave-one-out cross-validation for rad-path images producing PCC of
followed by pathology (path) images with
and radiology (rad) images
.
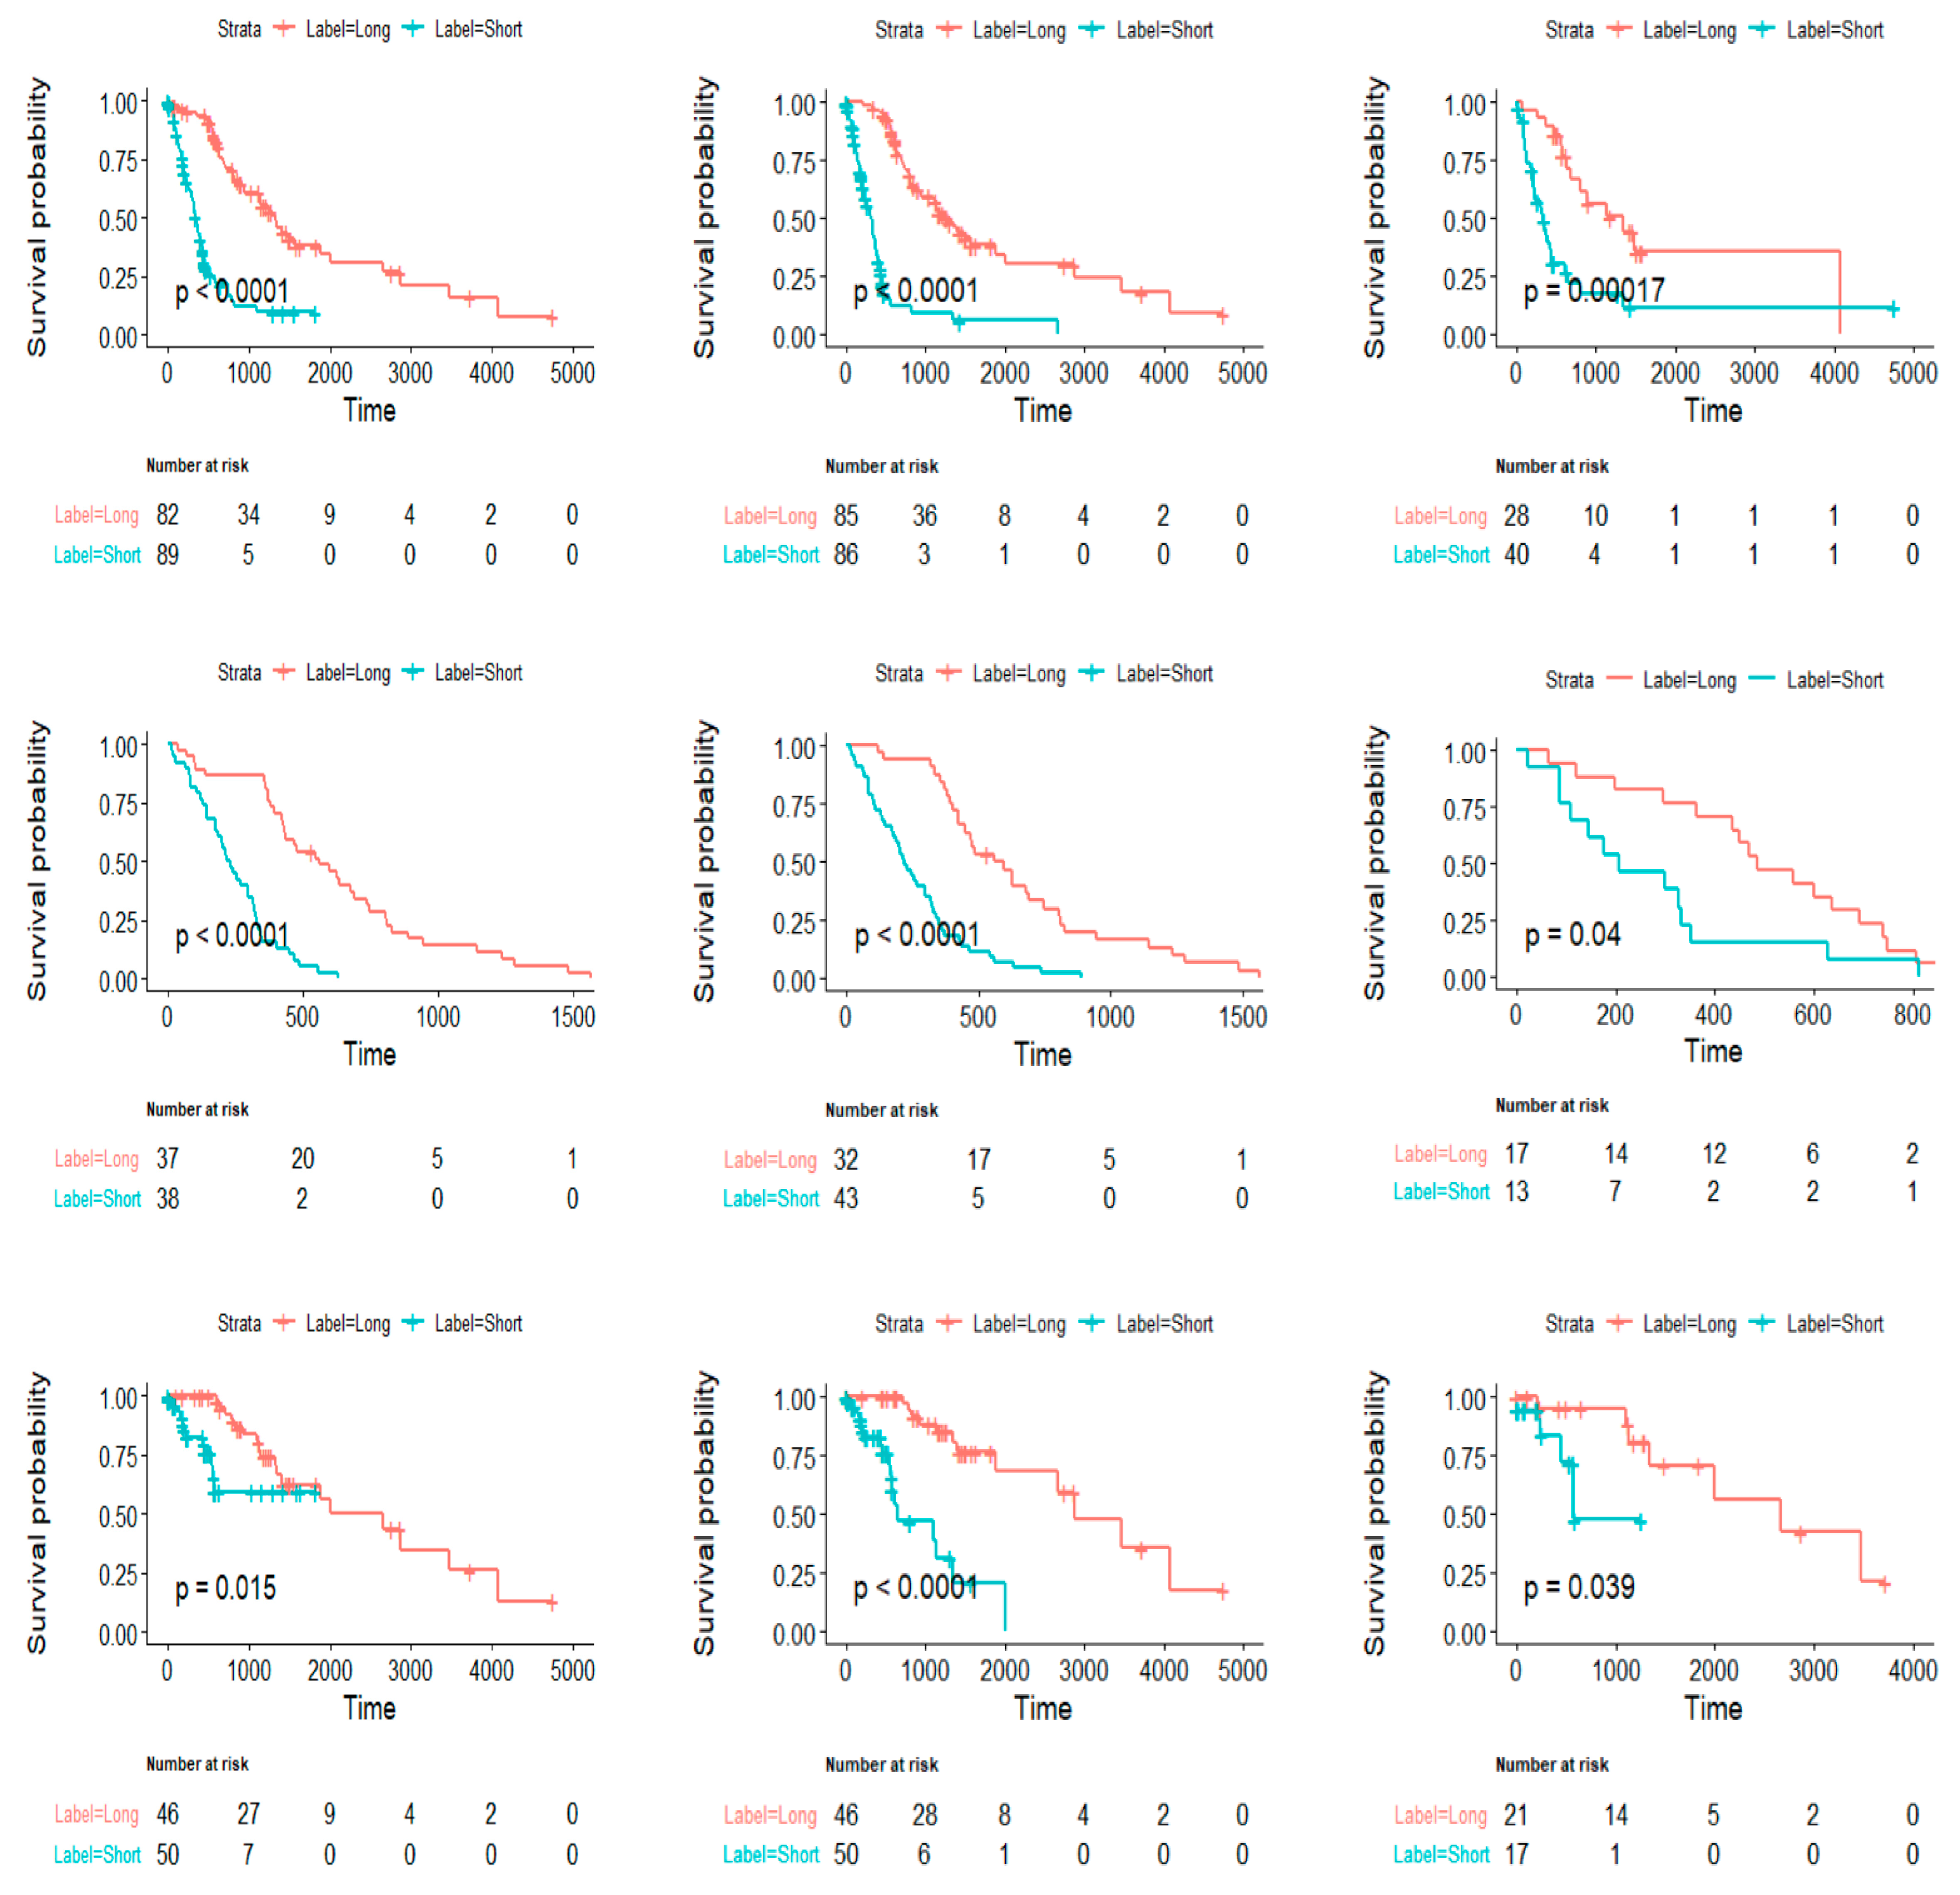
Survival Analysis
Based on the predictions of the proposed models by utilizing Kaplan–Meier survival curves, the predictions were computed for both short and long term survival. The performance was also computed in entire and validation data. The model accurately predict the long and short survivors, higher and lower actual survivors respectively. The trained models were applied on the test dataset set, and the scores predicted by the regression model were noted. A cutoff that maximized the survival difference was developed on the scores of training data to identify the relatively long and short survivors. This cutoff was then applied on the scores of the test dataset to determine long and short survivor groups and overall survival was then compared between the predicted long and short survivor groups using the log-rank test. Hazard ratios (HR) with 95% confidence intervals (CI) and Kaplan–Meier curves on the predicted groups were calculated with level of statistical significance for a two-sided comparison set at . The x-axis shows actual in days and y-axis shows predictions generated by proposed model.
The model trained on rad-path features divided the patients of the replication set (configuration-III) into long and short survivor groups (HGGs + LGGs: ; HGGs: ; LGGs: ]). Patients were also stratified into long and short survivor groups in configuration-I (HGGs + LGGs: ; HGGs: ; LGGs: and configuration-II (HGGs + LGGs: ; HGGs: ; LGGs: ).
Ensemble methods supply significant amounts of information, when the combination of both datasets and both joint rad-path groups are gathered collectively. Applying LOO cross-validation yielded a best correlation coefficient score of
on rad-path features, which is highest performance achieved in this work and is also consistent with very low
in this experiment. While discussing the situation in which another LOOCV performed robustness for LGGs dataset includes only path images holding the highest value
and other minimum value that is
, the rad images utilized form LGGs dataset obtains the highest value
and minimum
while performing 5-fold cross-validation as reflected in
Figure 3. The alone HGGs dataset did not perform well throughout the work. The individual features are not sustainable enough for better results. The average performance is shown to increase using a LGGs and HGGs combined dataset for all of three groups: (i) radiology rad images (ii) pathology Path images, and (iii) rad-path images.
The model evaluations in terms of MAE to predict survival is reflected in
Table 2.
4. Discussion
The powerful and robust ensemble machine learning methods, such as support vector regression (SVR), SVR with linear kernel, SVR with RBF kernel, AdaBoost adaptive algorithm, gradient boost boosting method, and random forest approaches, are employed in this research study. These are used to obtain maximum accuracy and significance for finding the better prediction of survival outcomes of glioma patients. Different high-resolution images show higher complexity and nonlinear dynamics. These require multi-dimensional feature extraction techniques for prediction from an image due to large variations in shape and size required in multi-dimension feature extraction techniques to effectively and significantly performance. Therefore, the feature extracting strategies, such as LBP, GLCM, GLSZM, GLRLM, and NGTDM, are employed to overcome the hurdles faced by the prediction problems. To achieve robustness in survival prediction, the novel ensemble regression machine learning methodologies, such as SVR, SVR (with various kernels), AdaBoost, gradient boost, and random forest approaches are developed in Python version 3.9.5. The ensemble regression methods were applied in different configurations, including split-train-test validation, 5-fold cross-validation, and leave-one-out cross-validation to evaluate the generalizability of the model. Pearson’s correlation coefficient was used as a performance measure to evaluate the performance of the model.
The datasets involved in this work are a low-grade glioma LGGS dataset, high-grade glioma dataset, and are grouped by combining both these LGGs and HGGs datasets. The radiology (rad) images, digital pathology (path) images, and the combination of image sets, namely rad-path images, are utilized for better performance and to obtain salient features for better prognoses of glioma patients. In past research works, the working is upon either the radiographic images or upon digital pathology images for the survival prediction. However, in this study, the obtained results reportedly show that the current feature extraction strategies (LBP, GLCM, GLSZM, GLRLM, and NGTDM) deliver the most promising results. The novelty in this study is that the combining of both types of images of radiology and pathology domains outbursts the results by employing ensemble machine learning regression approaches. The results are more effective and can play a very important and more significant role by predicting more accurately and can be helpful in clinical diagnosis and treatments.
In previous work, authors suggested that T1-Gd intensity is a measure of breakdown of blood–brain barrier and serves as an important predictor of overall survival in gliomas. In our regression survival model, patients predicted with higher score, and lower volumes of enhancing tumor, higher intensities in FLAIR and T2 images, reflecting reduced cell density and increased concentration of fluid. The entropy and homogeneity are other vital features, which quantify randomness in an image. The invasion and diffused nature of the tumor were measured in terms of volume and shape features. Consistent with previous studies, we observed irregular and larger edema in the high-risk group. Moreover, low-risk tumors were found mostly in the left temporal and frontal lobes.
4.1. Performance Comparison with Existing Methods
This section provides a performance overview of the proposed method with existing literature. It is worth mentioning that most of the existing methods used either radiology, pathology, or genetic data for the prediction of survival in gliomas, however, in the proposed method, we innovatively combined the features extracted from pathology and radiology images for the prediction of survival in gliomas. Due to the lack of literature or existing methods in the field of radiopathomics, we provided a comparison and performance overview of our method in the light of other existing radiology, pathology, or genomics-based methods. It is also important to note that different papers differ significantly in terms of the type and the size of the dataset and reported performance of the models in terms of different performance metrics; however, the table below provides a rough estimate of the performance of our method compared to existing literature.
The results are compared with existing studies as reflected in
Table 3.
4.2. Strengths and Limitations
The main strength of the proposed rad-path model is that it provides a way for radiologists and pathologists to create coherent, correlated, and integrated diagnostic summaries. The rich set of radiology/pathology characteristics, as well as the machine learning signatures produced from them, will improve our understanding of gliomas, and can help with precision diagnoses.
There are several important limitations to this study. The most important is that the pathology images were outlined in a semiautomatic fashion, which is a user-dependent and laborious task. Delineation of the region of interest in a full-automated fashion would facilitate automation of the analysis, reduce user bias, and empower larger-scale analysis. Another important limitation is that a retrospective dataset was used in this study, whereas the comparison of our methods to clinically measure OS by using a prospective dataset would further validate our models.
5. Conclusions and Future Directions
In summary, we developed a radiopathomic signature to predict overall survival and stratification of patients with glioma. This signature proves enhanced performance in comparison to radiology and pathology-based features. Several possible future directions this study could take include evaluation of the methods in larger cohorts, and evaluation of sophisticated deep learning methods for prediction of overall survival, though such methods need considerably larger datasets. Even though the texture features used here provided strong survival predictions, future experiments would benefit from incorporating more advanced radiomic and shape features extracted in the vicinity of the tumor to emphasize the biologic nature of the gliomas. Along these lines, using machine learning methods to perform both a supervised and unsupervised selection of features may help the models to account for a possibly complex and nonlinear relation between radiographic and histopathologic features. This work may be further expanded upon by utilising numerous strategies, by using advance deep learning methodologies, by utilizing the combination of both imaging characteristics, and by using most discriminative histology and radiology features through employing histology and pathology correlation analysis. Various other features of both imaging sequences, which are not the part of this study, can be used with other machine learning techniques for optimum predictions. Neural networks can also use morphological, textural, and density of pixels-based features for the same prediction purpose. We also plan to use the machine learning models specifically developed for survival data in the future.
Author Contributions
F.A.R. Conceptualization, methodology, software, validation, formal analysis, investigation, writing—original draft preparation, data curation, writing—review and editing, H.S.K. formal analysis, investigation, writing—review and editing. H.M.A. formal analysis, writing—review and editing. M.O. formal analysis, investigation, writing—review and editing. S.R. formal analysis, writing—review and editing. L.H. Conceptualization, methodology, software, validation, investigation, writing—original draft preparation, writing—review and editing. Z.H.K. Conceptualization, methodology, validation, investigation. M.K.N. formal analysis, investigation, writing—review and editing. A.M. (Abdullah Mohamed) formal analysis, writing—review and editing. A.M. (Abdelwahed Motwakel) formal analysis, writing—review and editing. All authors have read and agreed to the published version of the manuscript.
Funding
Princess Nourah bint Abdulrahman University Researchers Supporting Project number (PNURSP2022R203), Princess Nourah bint Abdulrahman University, Riyadh, Saudi Arabia. The authors would like to thank the Deanship of Scientific Research at Umm Al-Qura University for supporting this work by Grant Code: (22UQU4310373DSR40).
Institutional Review Board Statement
Not applicable.
Informed Consent Statement
Not applicable.
Data Availability Statement
The data is publicly available at The Cancer Image Archive (TCIA) and The Cancer Genomic Atlas (TCGA) repository.
Conflicts of Interest
The authors declare no conflict of interest.
References
- Tewarie, I.A.; Senders, J.T.; Kremer, S.; Devi, S.; Gormley, W.B.; Arnaout, O.; Smith, T.R.; Broekman, M.L.D. Survival prediction of glioblastoma patients—are we there yet? A systematic review of prognostic modeling for glioblastoma and its clinical potential. Neurosurg. Rev. 2020, 44, 2047–2057. [Google Scholar] [CrossRef] [PubMed]
- Nejatishahidin, N.; Fayyazsanavi, P.; Kosecka, J. Object pose estimation using mid-level visual representations. arXiv 2022, arXiv:220301449. [Google Scholar]
- Chaddad, A.; Daniel, P.; Zhang, M.; Rathore, S.; Sargos, P.; Desrosiers, C.; Niazi, T. Deep radiomic signature with immune cell markers predicts the survival of glioma patients. Neurocomputing 2022, 469, 366–375. [Google Scholar] [CrossRef]
- Rathore, S.; Chaddad, A.; Iftikhar, M.A.; Bilello, M.; Abdulkadir, A. Combining MRI and Histologic Imaging Features for Predicting Overall Survival in Patients with Glioma. Radiol. Imaging Cancer 2021, 3, e200108. [Google Scholar] [CrossRef] [PubMed]
- Rathore, S.; Bakas, S.; Akbari, H.; Shukla, G.; Rozycki, M.; Davatzikos, C. Deriving stable multi-parametric MRI radiomic signatures in the presence of inter-scanner variations: Survival prediction of glioblastoma via imaging pattern analysis and machine learning techniques. In Proceedings of the Medical Imaging 2018: Computer-Aided Diagnosis, SPIE, Houston, TX, USA, 27 February 2018; pp. 52–58. [Google Scholar]
- Macyszyn, L.; Akbari, H.; Pisapia, J.M.; Da, X.; Attiah, M.; Pigrish, V.; Bi, Y.; Pal, S.; Davuluri, R.V.; Roccograndi, L.; et al. Imaging patterns predict patient survival and molecular subtype in glioblastoma via machine learning techniques. Neuro Oncol. 2016, 18, 417–425. [Google Scholar] [CrossRef] [Green Version]
- Baid, U.; Rane, S.U.; Talbar, S.; Gupta, S.; Thakur, M.H.; Moiyadi, A.; Mahajan, A. Overall Survival Prediction in Glioblastoma With Radiomic Features Using Machine Learning. Front. Comput. Neurosci. 2020, 14, 1–9. [Google Scholar] [CrossRef]
- Sun, L.; Zhang, S.; Chen, H.; Luo, L. Brain tumor segmentation and survival prediction using multimodal MRI scans with deep learning. Front. Neurosci. 2019, 13, 810. [Google Scholar] [CrossRef] [Green Version]
- Zhao, G.; Jiang, B.; Zhang, J.; Xia, Y. Segmentation then prediction: A multi-task solution to brain tumor segmentation and survival prediction. In International MICCAI Brainlesion Workshop; Springer: Berlin/Heidelberg, Germany, 2020; pp. 492–502. [Google Scholar]
- Shaheen, A.; Bukhari, S.T.; Nadeem, M.; Burigat, S.; Bagci, U.; Mohy-ud-Din, H. Overall Survival Prediction of Glioma Patients With Multiregional Radiomics. Front. Neurosci. 2022, 16, 911065. [Google Scholar] [CrossRef]
- Wankhede, D.S.; Rangasamy, S. Dynamic architecture based deep learning approach for glioblastoma brain tumor survival prediction. Neurosci. Inform. 2022, 2, 100062. [Google Scholar] [CrossRef]
- Huang, H.; Zhang, W.; Fang, Y.; Hong, J.; Su, S.; Lai, X. Overall Survival Prediction for Gliomas Using a Novel Compound Approach. Front. Oncol. 2021, 11, 724191. [Google Scholar] [CrossRef]
- Iftikhar, M.A.; Rathore, S.; Nasrallah, M. Analysis of microscopic images via deep neural networks can predict outcome and IDH and 1p/19q codeletion status in gliomas. J. Neuropathol. Exp. Neurol. 2019, 78, 553. [Google Scholar]
- Rathore, S.; Iftikhar, M.A.; Gurcan, M.N.; Mourelatos, Z. Radiopathomics: Integration of radiographic and histologic characteristics for prognostication in glioblastoma. arXiv 2019, arXiv:1909.07581. [Google Scholar] [CrossRef]
- Mobadersany, P.; Yousefi, S.; Amgad, M.; Cooper, L.A.D. Predicting cancer outcomes from histology and genomics using convolutional networks. Proc. Natl. Acad. Sci. USA 2018, 115, E2970–E2979. [Google Scholar] [CrossRef] [PubMed] [Green Version]
- Rathore, S.; Hussain, M.; Iftikhar, M.A.; Jalil, A. Novel structural descriptors for automated colon cancer detection and grading. Comput. Methods Programs Biomed. 2015, 121, 92–108. [Google Scholar] [CrossRef] [PubMed]
- Mazurowski, M.A.; Desjardins, A.; Malof, J.M. Imaging descriptors improve the predictive power of survival models for glioblastoma patients. Neuro-Oncology 2013, 15, 1389–1394. [Google Scholar] [CrossRef] [PubMed] [Green Version]
- Rathore, S.; Akbari, H.; Rozycki, M.; Abdullah, K.G.; Nasrallah, M.P.; Binder, Z.A.; Davuluri, R.V.; Lustig, R.A.; Dahmane, N.; Bilello, M.; et al. Radiomic MRI signature reveals three distinct subtypes of glioblastoma with different clinical and molecular characteristics, offering prognostic value beyond IDH1. Sci. Rep. 2018, 8, 5087. [Google Scholar] [CrossRef] [Green Version]
- Ojala, T.; Pietikäinen, M.; Harwood, D. A comparative study of texture measures with classification based on featured distributions. Pattern Recognit. 1996, 29, 51–59. [Google Scholar] [CrossRef]
- Ojala, T.; Pietikäinen, M.; Mäenpää, T. Multiresolution gray-scale and rotation invariant texture classification with local binary patterns. IEEE Trans. Pattern Anal. Mach. Intell. 2002, 24, 971–987. [Google Scholar] [CrossRef]
- Lin, H.; Zhong, W.Z.; Yang, X.N.; Zhang, X.C.; Yang, J.J.; Zhou, Q.; Yan, H.H.; Liao, R.Q.; Nie, Q.; Dong, S.; et al. A clinical model to estimate the pretest probability of lung cancer, based on 1198 pedigrees in China. J. Thorac. Oncol. 2012, 7, 1534–1540. [Google Scholar] [CrossRef] [Green Version]
- Thibault, G.; Fertil, B.; Navarro, C.; Pereira, S.; Cau, P.; Levy, N.; Sequeira, J.; Mari, J.-L. Texture Indexes and Gray Level Size Zone Matrix Application to Cell Nuclei Classification. In Proceedings of the 10th International Conference on Pattern Recognition and Information Processing, Lisbon, Portugal, 7 February 2009; pp. 140–145. [Google Scholar]
- Chu, A.; Sehgal, C.M.; Greenleaf, J.F. Use of gray value distribution of run lengths for texture analysis. Pattern Recognit. Lett. 1990, 11, 415–419. [Google Scholar] [CrossRef]
- Kairuddin, W.N.H.W.; Mahmud, W.M.H.W. Texture Feature Analysis for Different Resolution Level of Kidney Ultrasound Images. In IOP Conference Series: Materials Science and Engineering; Institute of Physics Publishing: Bristol, UK, 2017; Volume 226. [Google Scholar]
- Wu, J.; Liu, C.; Cui, W.; Zhang, Y. Personalized Collaborative Filtering Recommendation Algorithm based on Linear Regression. In Proceedings of the 2019 IEEE International Conference on Power Data Science (ICPDS), Taizhou, China, 22–24 November 2019; pp. 139–142. [Google Scholar] [CrossRef]
- Roopa, H.; Asha, T. A Linear Model Based on Principal Component Analysis for Disease Prediction. IEEE Access 2019, 7, 105314–105318. [Google Scholar] [CrossRef]
- Linear Regression Analysis-George A. F. Seber, Alan J. Lee-Google Books. Available online: https://books.google.com.pk/books?hl=en&lr=&id=X2Y6OkXl8ysC&oi=fnd&pg=PR5&dq=G.+A.+Seber+and+A.+J.+Lee,+Linear+regression+analysis+vol.+329:+John+Wiley+%26+Sons,+2012.&ots=sekOy3nPpw&sig=M5wJ9R0tRZ4VuIikX6aFZsWR1dY&redir_esc=y#v=onepage&q&f=false (accessed on 20 November 2021).
- Lim, H.I. A linear regression approach to modeling software characteristics for classifying similar software. In Proceedings of the 2019 IEEE 43rd Annual Computer Software and Applications Conference (COMPSAC), Milwaukee, WI, USA, 15–19 July 2019; Volume 1, pp. 942–943. [Google Scholar]
- Vapnik, V.; Golowich, S.; Smola, A. Support Vector Method for Function Approximation, Regression Estimation and Signal Processing. Adv. Neural Inf. Process. Syst. 1996, 9, 281–287. [Google Scholar]
- Freund, Y.; Schapire, R.E. A Decision-Theoretic Generalization of On-Line Learning and an Application to Boosting. J. Comput. Syst. Sci. 1997, 55, 119–139. [Google Scholar] [CrossRef] [Green Version]
- Schapire, R.E. Explaining adaboost. Empirical Inference: Festschrift in Honor of Vladimir N. Vapnik; Springer Science & Business Media: Berlin, Germany, 2013; pp. 37–52. [Google Scholar] [CrossRef]
- Omer, Z.M.; Shareef, H. Adaptive boosting and bootstrapped aggregation based ensemble machine learning methods for photovoltaic systems output current prediction. In Proceedings of the 2019 29th Australasian Universities Power Engineering Conference (AUPEC), Nadi, Fiji, 26–29 November 2019; Institute of Electrical and Electronics Engineers Inc.: Piscataway, NJ, USA, 2019. [Google Scholar] [CrossRef]
- Friedman, J.H. Stochastic gradient boosting. Comput. Stat. Data Anal. 2002, 38, 367–378. [Google Scholar] [CrossRef]
- Breiman, L. Random forests. Mach. Learn. 2001, 45, 5–32. [Google Scholar] [CrossRef] [Green Version]
- Victoriano, J.M.; Santos, M.L.C.; Vinluan, A.A.; Carpio, J.T. Predicting Pollution Level Using Random Forest: A Case Study of Marilao River in Bulacan Province, Philippines. Int. J. Comput. Sci. Res. 2019, 3, 151–162. [Google Scholar] [CrossRef]
- Suter, Y.; Jungo, A.; Rebsamen, M.; Knecht, U.; Herrmann, E.; Wiest, R.; Reyes, M. Deep learning versus classical regression for brain tumor patient survival prediction. In Lecture Notes in Computer Science, Proceedings of the International MICCAI Brainlesion Workshop, Granada, Spain, 16 September 2018; Springer: Berlin/Heidelberg, Germany, 2019; Volume 11384, pp. 429–440. [Google Scholar]
- Wijethilake, N.; Meedeniya, D.; Chitraranjan, C.; Perera, I. Survival prediction and risk estimation of Glioma patients using mRNA expressions. In Proceedings of the 2020 IEEE 20th International Conference on Bioinformatics and Bioengineering (BIBE), Cincinnati, OH, USA, 26–28 October 2020; pp. 35–42. [Google Scholar]
| Publisher’s Note: MDPI stays neutral with regard to jurisdictional claims in published maps and institutional affiliations. |
© 2022 by the authors. Licensee MDPI, Basel, Switzerland. This article is an open access article distributed under the terms and conditions of the Creative Commons Attribution (CC BY) license (https://creativecommons.org/licenses/by/4.0/).

 ,
, 


