Article

Experimental Investigation of the Fatigue Life of a Bridge Crane Girder Using S-N Method

1
Department of Applied Mechanics and Mechanical Engineering, Technical University of Košice, Letná 1/9, 042 00 Košice, Slovakia
2
Department of Engineering for Design of Machines and Transport Equipment, Technical University of Košice, Letná 1/9, 042 00 Košice, Slovakia
*
Author to whom correspondence should be addressed.
Appl. Sci. 2022, 12(20), 10319; https://doi.org/10.3390/app122010319
Submission received: 12 September 2022 / Revised: 8 October 2022 / Accepted: 10 October 2022 / Published: 13 October 2022
(This article belongs to the Special Issue Fatigue and Fracture Mechanics: Applications and Trends)

Abstract

:
Experimental measurement methods used in operational mode provide valuable information about the behavior of mechanical parts of equipment that cannot be determined in advance by analytical calculations or numerical modeling. The strain gauge method, which is often used to investigate the stresses in the load-bearing members of steel structures under operational conditions, was used. The advantage is the fast and accurate acquisition of stress values at critical locations selected based on analytical computations or numerical modeling. In the present paper, the residual operating life of two main girders of a bridge crane was assessed by an analytical-experimental approach. The input parameters for the assessment were obtained from the evaluated stress time records and using the Rainflow Counting method. Experimental measurements identified an almost 50% decrease in the residual life of one of the girders. It was caused by non-compliance with the technological procedures for the regular replacement of the rails, where the rail was welded to the top flange on one of the girders. Considering realistic operating conditions, predicting the effect of welded rail on fatigue damage accumulation, performed by other than experimental procedures, is almost impossible for such complex structures. This paper not only documents the importance of experimental measurements but also highlights the significance of selecting measurement locations with consideration of the current technical state of the structure.

1. Introduction

Nowadays, equipment that has been operated for more than 20 years is still available in many companies. Such equipment includes bridge cranes and the railways on which they move. After so many years, it is necessary to determine whether their operation is still safe. The operator of such equipment has two options. The first option is the equipment replacement with a new one at the end of period for which it was designated. The second option allows the operator to test the existing equipment and its mechanisms based on the available methods and decide on its further use according to the results obtained. If the equipment complies with the safety and operating regulations, it is kept in operation. However, in that case, the number of preventive maintenance operations for such structures and machinery will increase.
We can distinguish two types of crane failures. The first type is associated with the control system of individual crane mechanisms, which can be eliminated by a relatively simple replacement of a defective part. The second is mechanical damage to the steel structure associated with the formation of cracks, which in most cases is directly related to fatigue damage of the material. Nowadays, due to the variety of influencing factors caused by the complexity of loading, fatigue analysis and lifespan assessment is still a very challenging problem. Systematic and detailed research has been carried out for many years in the field of theory and testing of different crane constructions. In addition, various fatigue life assessment methods have been summarized. Overall, they can be divided into three fatigue life assessment approaches based on S-N curve and fracture mechanics [1,2], probability and statistics [3,4] and information technology [5]. Kadirgama et al. [5] developed the tool life prediction model for P20 tool steel with the aid of the statistical method, using a coated-carbide cutting tool under various cutting conditions. This prediction model was then compared with the results obtained experimentally. In general, the results obtained from the mathematical model were in good agreement with those obtained from the experiment’s data. According to the relationship between fatigue life and evaluation parameters, fatigue life assessment approaches based on S-N curve can be divided into nominal stress method [6], structural hot spot stress method [7], local stress and strain method [8] and equilibrium-equivalent structural stress method [9]. The nominal stress method is often used to assess the fatigue life of the bridge crane structure in operation and the accidental load is treated by the Rainflow Counting method. The cumulative fatigue damage of the crane metal structure is calculated by the Palmgren–Miner (or Corten–Dolan, Heibach, etc.) model to obtain the fatigue life prediction results. The complex influence of multiple factors that include geometrical characteristics, loading conditions, operating characteristics and failure mechanism will affect the safety of the bridge crane structure. The evaluation of bridge crane structure safety by real-time fatigue life prediction method based on a digital twin is described in [10]. The computational model is enhanced by the analytical model and information transfer, and subsequently, the main factors affecting the fatigue life of the bridge crane structure are determined. Ávila et al. [11] point out that the most frequent failures in these structures are related to fatigue in the welded joints. They conclude that the S-N method combined with finite element analysis proves to be an effective technique for determining the most critical damage at the joints of a structure. Fatigue damage studies of crane girders have led to significant improvements in design, eliminating premature fatigue failures. Some focus on crack formation [12,13], others on determining remaining life as mentioned in [14,15]. Tong et al. [13] performed finite element analyses to investigate the stress concentrations at the girder ends of the crane runway (two types). The analytical results agree well with the data measured. Kuľka et al. [14] describe a procedure for determining the residual life of the casting crane girders, which determines whether it is worthwhile to make any structural modifications to improve the crane’s operational characteristics. Frankovský et al. [
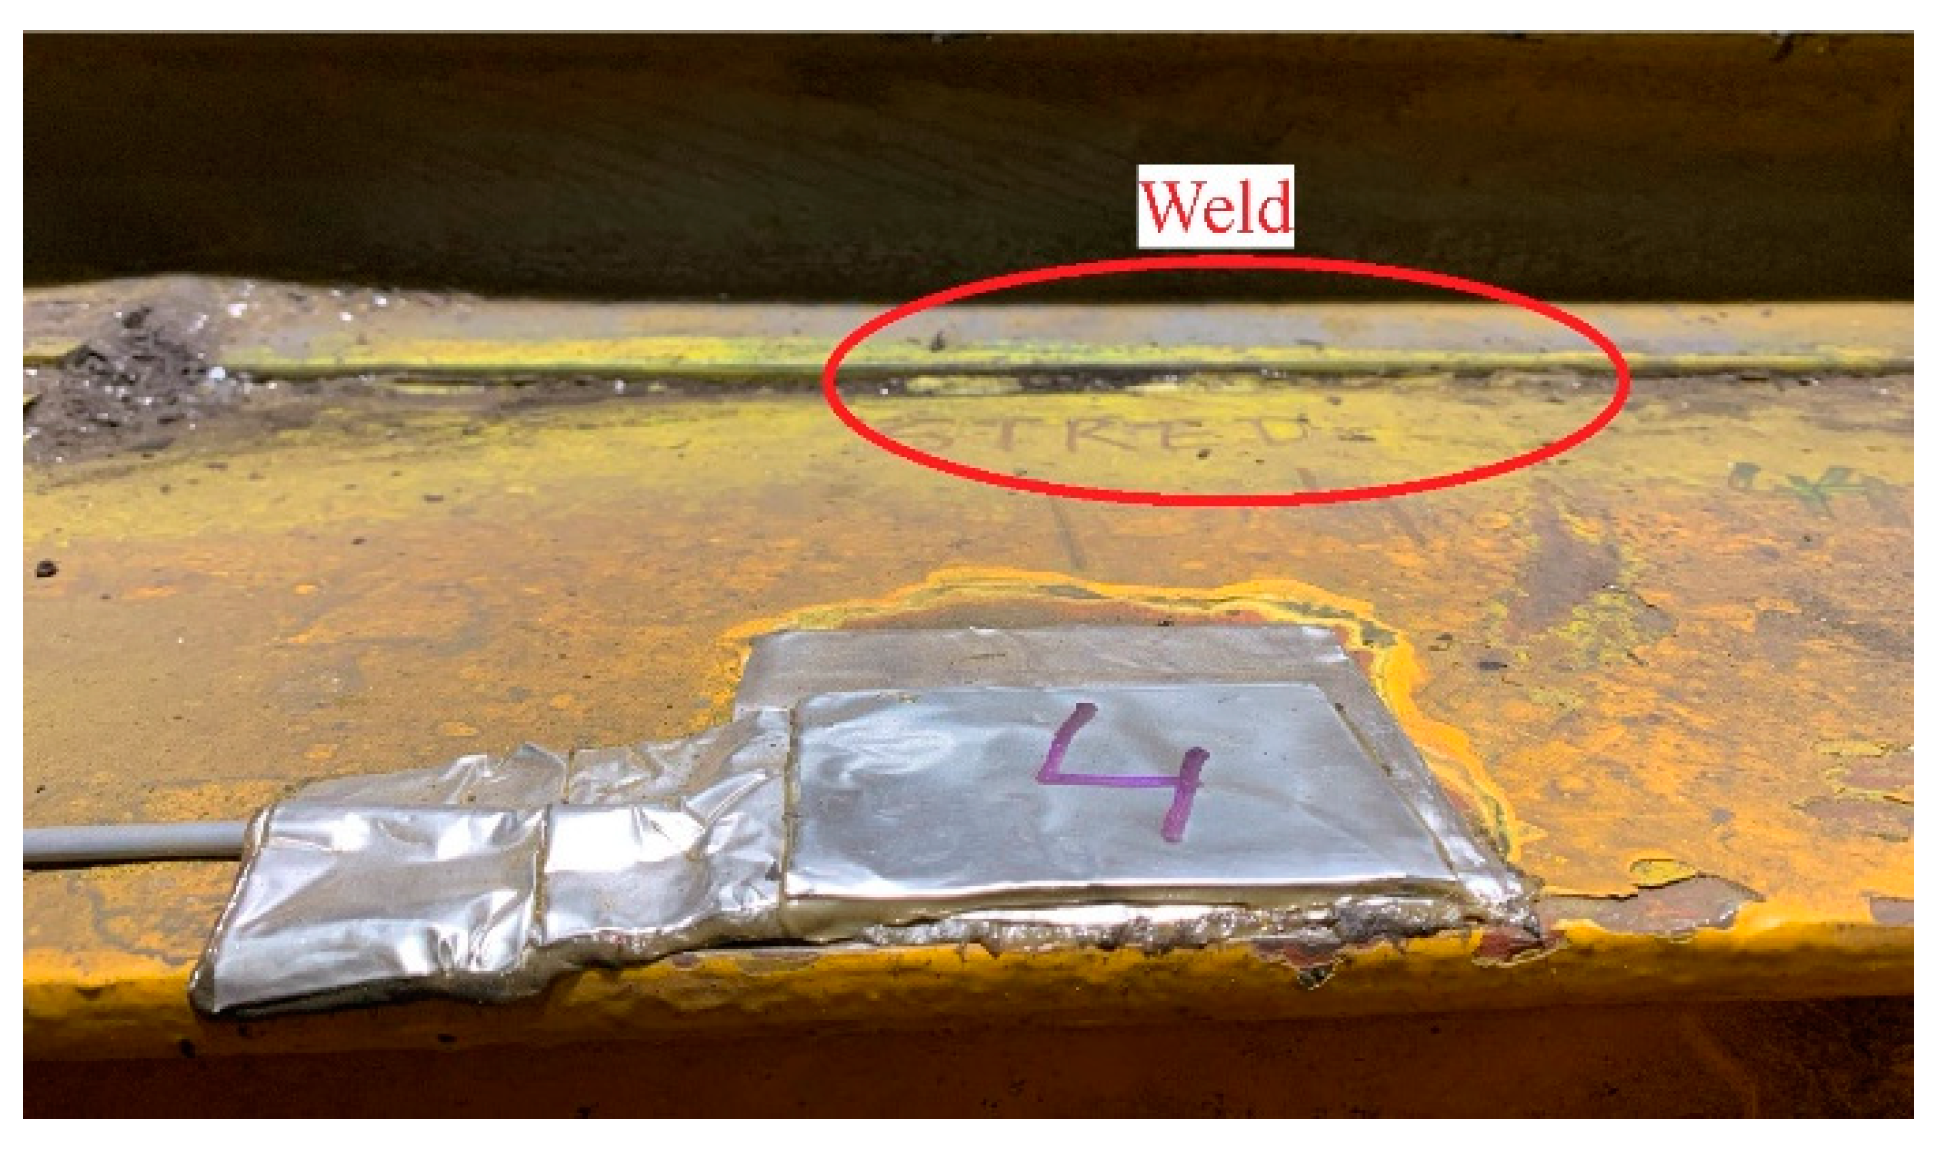
16] deal with the repair of an already damaged beam. The longitudinal fillet welds between the top flange and girder web on the rail side of the 200 t trolley were damaged due to specific stresses after its long-term operation. Consequently, the girder’s cross-section opened, substantially reducing its strength and stiffness. Bomas et al. [17], Darisuren et al. [18], and Trebuňa et al. [19] discuss how fatigue damage can affect structural elements and nodes of load-bearing structures due to inappropriate design in manufacturing or inappropriate retrofitting, e.g., major overhaul (design factors), infringement of technological discipline in the manufacture or repair of equipment (manufacturing technology factors) and intentional or unintentional use of equipment in a manner inconsistent with its intended use. The influence of these factors then makes the actual nature of the stresses much more unfavorable than expected in the structure design, often resulting in a change of the direction, gradient, magnitude or redistribution of stress. In such affected areas, structural elements and nodes, there is a higher risk of fatigue damage (failure) [20,21]. Liu et al. [22] identified the dangerous locations of crane girders using the finite element method. They performed fatigue life tests on a simplified model considering welding details. By the fatigue test results of the specimen, they quantitatively described the actual fatigue life of the welded structures of the bridge crane girder. By transferring the data into the equation, the S-N curves of the bridge crane girder included the specific materials, stress ratio, welding process and structure.
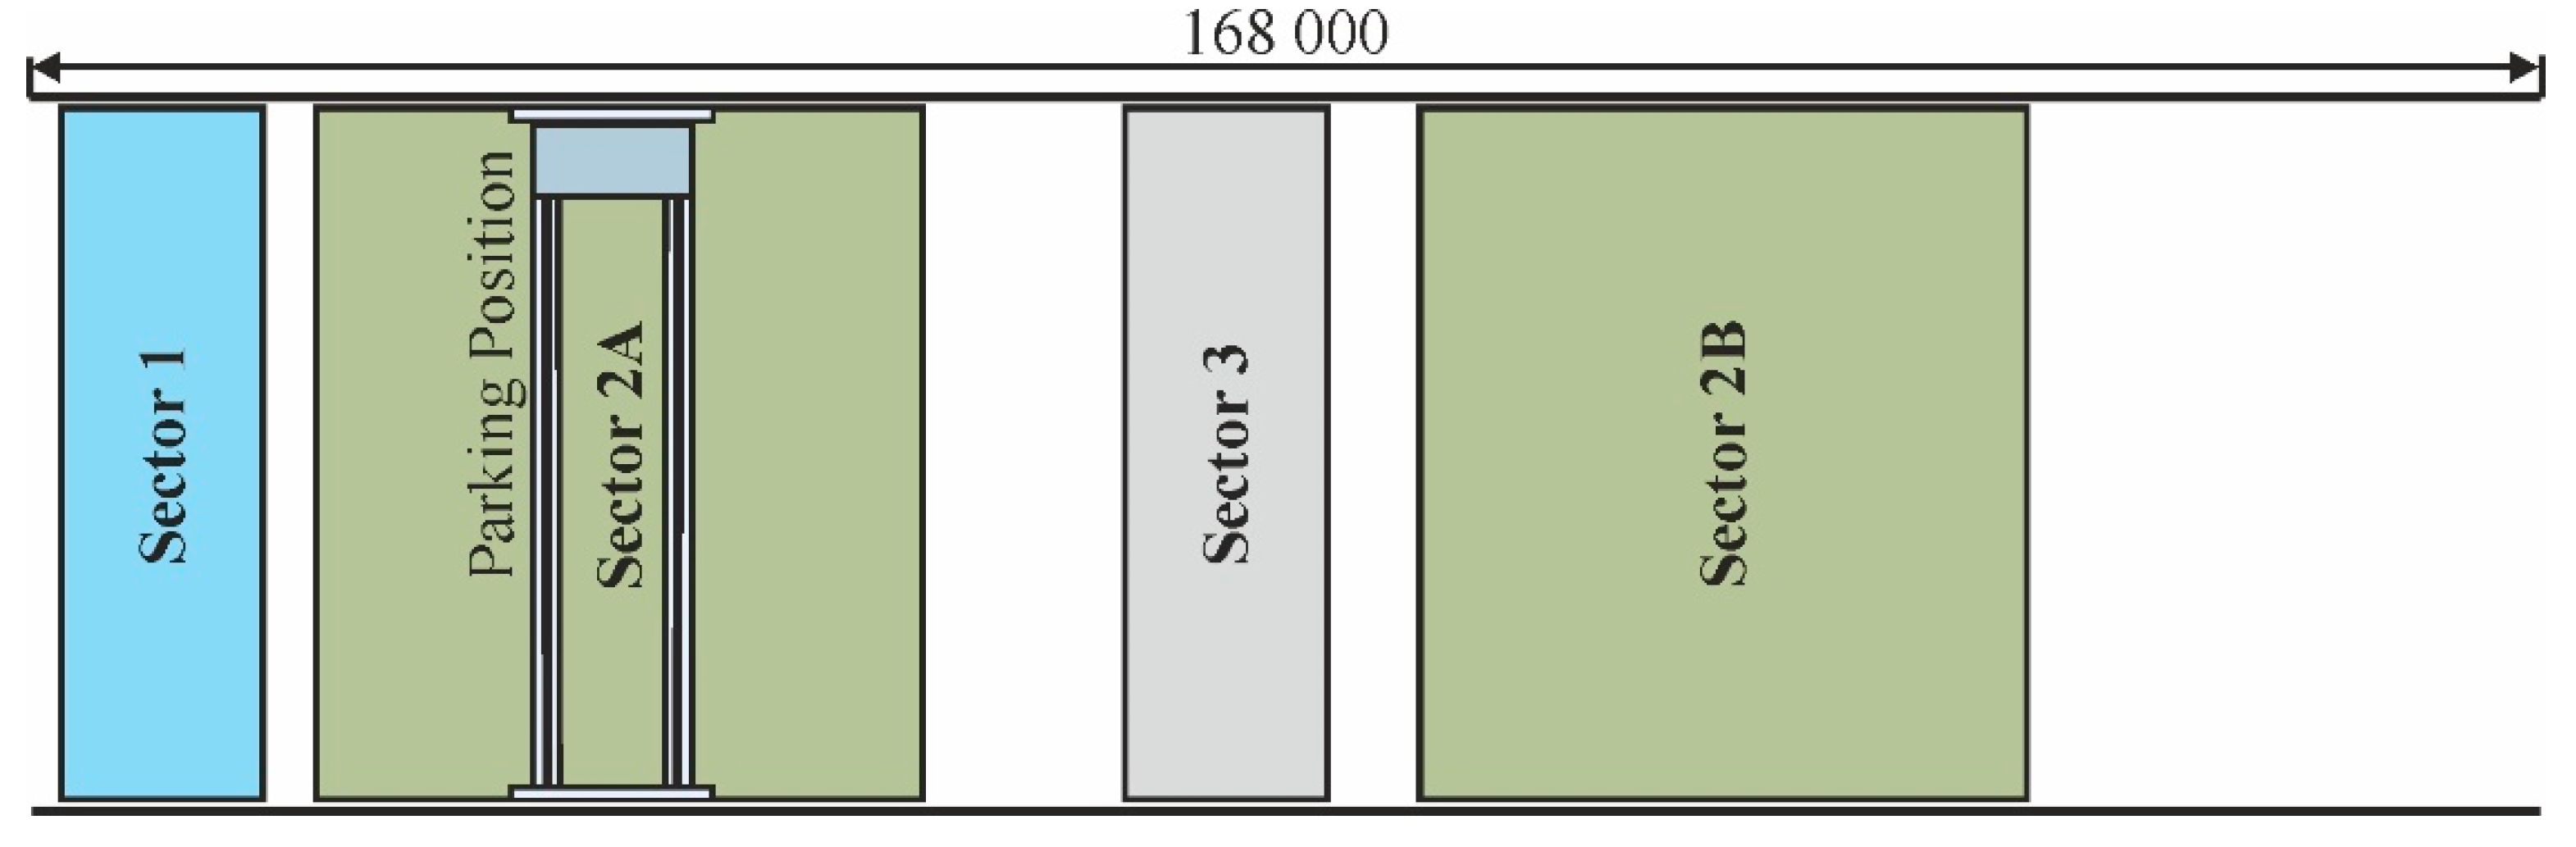
Most of the scientific articles published in the field of experimental-numerical analyses of bridge cranes are devoted to analyses performed immediately after the equipment reaches a state of failure. The present paper deals with the problem of reducing the fatigue resistance of the girder cross-section associated with periodic maintenance of the equipment. The bridge crane’s remaining service life was assessed at the request of its operator, who registered the limiting values of the height difference deviations of the rails’ top edge. Since the analyzed crane has been in operation for more than 50 years, it was necessary to use an analytical-experimental assessment of its safe operation, considering actual operating conditions. The performed analysis has shown that improper (non-professional) intervention in the crane structure can significantly deteriorate the technical state of an already significantly stressed structure, which will only accelerate its degradation, as confirmed and described in the experimental-analytical parts of this paper.

2. Materials and Methods

2.1. Analyzed Bridge Crane’s Description

The electric bridge crane described in this paper was put into operation in 1970. With 20/5 t–28.5 m capacity, it is used mainly for handling sheet metal coils from which pipes are made. After its assessment and static recalculation in 1983, it was retyped to 22/5 t–28.5 m capacity. The load-bearing structure of the crane, with a span of 28 500 mm, is a welded box structure. The crane crab with 2200 mm track has main and auxiliary lift of 22/5 t with 10 m lifting height (see Table 1).
The analyzed crane classification was done according to the currently valid standard STN 270103 “Design of steel structures of cranes” [23] as mentioned in Table 2.
In accordance with the safety instructions, regular maintenance had been carried out on the investigated bridge crane. In 2005 and 2019, the limit values of height course of the crab’s trajectory (measured at the top edge of the rails) set by the relevant standard [24] were registered. Following the request from the bridge crane operator, and considering the previous loading and height course of the crab’s trajectory history, it was necessary to verify its safe and reliable operation. Both bridge crane girders were visually inspected. According to the operator’s data, the rails were replaced after about 10 years of operation. Visual inspection showed that the rail on girder B was replaced using incorrect technological procedure (i.e., attaching the rail to the girder in some places with welds instead of clamps).
The fatigue lifespan of the bridge crane was assessed using an experimental-analytical approach. The methodology based on the strain/stress states obtained by experimental measurements realized under operational loads, was used. It considers actual influences such as the shape of the girders, constraints, friction, conditions of the moving parts of the mechanisms, etc. Subsequently, strain gauge measurements were performed to reflect the technical state of the load-bearing crane parts after more than 50 years of operation.

2.2. Strain Gauge Measurement

The strain gauge measurement aimed to determine the principal stresses in the most stressed cross-section, i.e., the center of the bridge crane girders. The principal stresses were (considering the drawing documentation) determined at locations A1, A2, B3, B4 (Figure 1), and B7, A8, located at 300 mm from the center of the girders towards the right side (R). This was due to a reinforcing rib located in the mentioned distance at the cross-section top part (approximately at 1/4 of the height). Only one location on each girder was chosen, i.e., B5 and A6 (at mid-height of the cross-section at a distance of 350 mm from R) to determine the shear stress. A schematic view of the strain gauge locations is shown in Figure 1. The choice of measurement locations was based on a theoretical stress state analysis.
Resistance strain gauges 1-XY91-10/120 and 1-XY21-10/120 (HBM, Darmstadt, Germany) with an ohmic value of 120 Ω and a strain sensitivity factor of 2.01 and 2.04, respectively, were used. Temperature compensation was carried out using the perpendicular branch of the strain gauge cross. The application of strain gauge transducers was performed with a two-component X60 adhesive. The transducers were protected with ABM75 protective coating (Figure 1). Shielded cables were used to connect the strain gauges to the measuring apparatus. The measuring chain consisted of a Quantum MX-840 data acquisition system (HBM, Darmstadt, Germany) and a laptop. Catman Easy software (HBM, Darmstadt, Germany) was used for measurement control, data processing and evaluation.

2.3. Description of Operating Modes

The investigated bridge crane handles steel coils of various weights, the heaviest weighing approximately 21 t. The bridge crane moves on a 168 m long traveling track. When it is out of use, it is placed in a parking position (see Figure 2). The beginning of the production hall is in Sector 1, where the steel coils are unladen from the railway wagons. Subsequently, they are moved from Sector 1 to Sectors 2A and 2B, respectively, for further storage. The coils are transferred from Sectors 2A/2B to Sector 3 for final processing (pipes production).
In the set-up of the experimental measurement, various modes that occur in the actual operation of the bridge crane were selected. Mode 1 and Mode 2 were performed near the parking station of the bridge crane. Mode 1 was performed first, where the crab moved without a load from the outlaying position on the left side (L) to the outlaying position on the right side (R) and then returned to the outlaying position L (see Figure 1). This cycle was repeated twice. In Mode 2, the bridge crane was in Sector 2A, and the crab was in the outlaying position L. In this position, the lifting of the loads (sequentially 1, 2 and 3, respectively) was carried out. Subsequently, the crab was moved to the outlaying position R, then returned to the starting position L, and finally, the lowering of the load was performed.
Mode 3 represented a single operating cycle, i.e., lifting the load from Sectors 2A (coils 1, 2 and 3, respectively, were used) and 2B (coils 4, 5 and 6, respectively, were used), and moving the steel coil to Sector 3 was done. During this mode, the crab on the bridge crane and the crane itself moved continuously along the track. The movement along the track was carried out on a path approximately 35 m long. The details of the coils transferred during the strain gauge measurements are given in Table 3.
The last Mode, 4, was performed to determine the dynamic lift coefficient experimentally. In this mode, the crab was placed in the center of the bridge crane. The lifting of the load was carried out at different levels of speed. This measurement took into account the natural operating conditions, i.e., the actual technical state of the bridge crane’s mechanical parts.

3. Results

3.1. Normal and Shear Stresses Calculated at Individual Operating Modes

From the strains measured during the individual operating modes (Modes 1 to 3) and the individual loading conditions, the values of the normal stresses at locations A1, A2, B3, B4, B7 and A8 and the shear stress at location A6 (see Figure 1) were calculated. During the operational measurements, the strain gauge transducer wiring for shear stress measurement (B5) was damaged. As it was necessary to evaluate the principal stresses to assess the fatigue life, the operational measurement was continued with the remaining strain gauge transducers. Modes 1 to 3 described in Section 2.2 are documented in Figure 3, Figure 4 and Figure 5. Figure 3a, Figure 4a and Figure 5a show the time courses of the normal stresses occurring at measurement points A1, A2, B3, B4, B7 and A8 and the shear stresses occurring at point A6. The details of the time courses corresponding to the passing of the crab through the center of girders are depicted in Figure 3b, Figure 4b and Figure 5b. Figure 3 represents the manipulation of the crab without load, i.e., Mode 1 with the cycle repeated twice. Figure 4 shows the manipulation of coils 1, 2 and 3 corresponding to Mode 2. From the series of measurements performed for Mode 3, Figure 5 presents the manipulation with a load of 20,930 kg (coil 6, Sector 2B).
A phenomenon that could not be assessed during measurements was identified for each time record presented for the modes above. It was because of different characteristics of the strains’ time records registered at locations A1 and A2 versus B3 and B4 by passing the crab through the center of girders. As the crane was normally used by the operator before application of the strain gauges, the experimental measurement continued. The cause of this phenomenon, i.e., welding of the rail to the top flange, was only discovered by subsequent analysis of the measured data. Therefore, the fatigue life at all measured locations was assessed.
Table 4 shows the maximum values of the normal stresses that occurred at locations A1, A2, B3, B4, B7 and A8 and the shear stress that occurred at location A6 obtained when handling a load of 20,930 kg in Mode 3. The mentioned case corresponds to an actual operation, as it considers the crab weight, the load and the dynamic effects from the lift of the load, the crab travel and the bridge crane acting on the weight of the load and the crab. The maximum measured normal stress is compressive and takes an absolute value of approximately 71 MPa (Figure 5a, time 422 s). The values given in Table 4 were read during the same period. It should be noted that this state corresponds to the specific position of both the crab and the bridge crane. From the time courses of the normal stresses (Figure 3, Figure 4 and Figure 5), it is evident that in the operating mode, there are also differences in the stress values (on the order of units of MPa) obtained at locations A1 and A2. Different values of B3 and B4 identify a slight twisting of the girder cross-section.

3.2. Calculation of Maximum Stresses Taking into Account the Validity of STN 270103

According to STN 270103 standard “Design of steel structures of cranes”, the calculation for fatigue resistance is described in Part VIII [23]. According to STN 270103 standard and Appendix II, the analyzed crane can be classified under number 1.1.5/4. For this classification, the lifting class is H3, the type of operation is D2, the stress spectrum is S2, and the working group is J5. The coefficients resulting from STN 270103 for the equipment mentioned above are [23]:
  • load factor from self-weight
γ g = 1.1 ;
  • load factor from the rated load for D2
γ 0 = 1.3 ;
  • dynamic lift coefficient for H3
δ h = 1.37 .
The other coefficients are not shown because they are not necessary for the assessment or are reflected in the measured strain courses and the corresponding stress courses calculated from the operational measurements (Figure 3, Figure 4 and Figure 5). Table 4 shows that the maximum normal stress of 71 MPa considers the weight of the load (20,930 kg), the crab weight and the dynamic effects of the operation. However, the mentioned maximum stress does not take into account the stresses from the self-weights of the permanent loads, i.e., from the self-weight of the bridge crane girders and the permanent loads stored on them. These loads were determined based on the operator’s data as a distributed load of constant intensity:
q = 4.94 kNm−1.
For the bridge span of 28,500 mm, the maximum bending moment M max from the self-weight is:
M max = q 2 8 = 4.94 28.5 2 8 = 501.6   kNm .
Figure 6 gives a view of the cross-sections of the girders at mid-span. Figure 6a shows the cross-section at mid-span without the reinforcing rib. Figure 6b shows the cross-section at a 300 mm distance from the girder center, with the reinforcing rib welded approximately at 1/4 of the cross-section height. For the cross-section depicted in Figure 6a, the values of the cross-sectional characteristics are:
  • for the upper fibers
W z = 14,71,606   mm 3 ;
  • for the lower fibers
W z + = 13,831,936   mm 3 .
Due to the difference in thickness of the top (12 mm) and bottom (10 mm) flanges, the cross-sectional characteristics for the compressed (−) and tensioned (+) branches are different in the ratio
c = W z W z + = 1.068 1.07 .
The maximum normal stress (in the lower fibers) from the self-weight with γ g = 1.1 is equal to:
σ g max = γ g M max W z + = 1.1 501.6 10 6 13.83 10 6 40   MPa .
The resulting maximum normal stress (in the lower fibers) for the weight of load 20,930 kg is:
σ max = σ g max + c 71 = 40 + 1.07 71 116   MPa .
Considering the coefficient γ 0 = 1.3 , , the maximum stress cannot exceed the value of:
σ MAX = σ g max + γ 0 c 71 = 40 + 1.3 1.07 71 139   MPa .
The mentioned values of stresses are valid for girder’s material 11 373 (yield strength σ Y min = 210   MPa [25]) with a safety factor from 1.51 to 1.80 depending on the calculation value.

3.3. Assessment of the Dynamic Lift Coefficient

A strain gauge measurement (Mode 4) was carried out with a 20,930 kg load weight to assess the dynamic lift coefficient. The crab’s position was in the center of the bridge crane girders. Four different speed stages were considered when lifting the load. Figure 7 shows a time course of the normal stresses calculated at two measured locations A1 (girder A) and B3 (girder B), obtained at different lifting speeds of the load placed in the center of the bridge crane. The measurement was carried out for the following speed stages (Figure 7):
  • Lifting speed controlled by the crane operator;
  • Speed stage 2;
  • Speed stage 3;
  • Speed stage 4 (maximum lifting speed 10.79 m/min).
The dynamic lift coefficient determined from the courses shown in Figure 7 ranges from 1.13 to 1.27. According to STN 270103 standard [23], the coefficient δ h = 1.37 , which is higher than the measured value, is considered for lifting class H3.

3.4. Assessment of Fatigue Life and Strength According to STN 270103

When the crane is classified according to STN 270103 in stress spectrum S2 and operating group J5, according to Table 13 of the standard, the number of cycles N per technical lifetime is:
N = 6 10 5 to 2 10 6 ,
When considering notch group K3 (strong notch effect), for welded structure 333, according to Table 25 of the standard mentioned above, the fundamental calculated fatigue strength is R fat ( 1 )
R fat ( 1 ) = 63.6   MPa .
According to Figure 8, the following applies:
R fat ,   t ( 0 ) = 5 3 R fat ,   t ( 1 ) = 5 3 63.6 = 106   MPa .
The calculated fatigue strength for the ultimate stress ratio χ 0.35 is according to Table 17 of STN 270103:
R fat ( 0.35 ) = R fat ,   t ( 0 ) 1 ( 1 R fat ,   t ( 0 ) 0.75 σ U ) χ = 106 1 ( 1 106 0.75 370 ) 0.35 = 135   MPa
where σ U = 370   MPa is the ultimate strength of the material.
According to paragraph 58 of STN 270103:
( σ max R fat ( χ ) ) 2 = ( 116 135 ) 2 = 0.74 1.1 .
This verification realized according to STN 270103 confirms sufficient fatigue strength reserve at the number of cycles N = 6 10 5 to 2 10 6 .

3.5. Experimental-Computational Verification of the Possible Accumulation of Fatigue Damage of the Bridge Crane

Based on the analysis of the time courses of the normal stresses for Modes 1, 2 and 3, as well as by comparing the stress levels obtained at the individual measurement locations, locations B3 and B4 were selected for the experimental-computational verification of the possible fatigue damage accumulation of the bridge crane girders. The maximum ranges of normal stresses were registered at these locations during all investigated operational modes. From the time courses of the normal stresses, the spectra of stress amplitudes were evaluated by the Rainflow Counting method. Figure 9, Figure 10 and Figure 11 show the stress spectra evaluated at the measurement location B3 for Modes 1, 2, and 3.
Assessment of the fatigue damage accumulation for the measured normal stress time courses (Figure 3, Figure 4 and Figure 5) and the stress amplitude spectra evaluated from them was performed according to the Palmgren–Miner fatigue damage accumulation hypothesis following Eurocode 3, Part 9 [26]. The input to the hypothesis, in addition to the stress amplitude spectra, are the parameters of the Wöhler curve of the welded detail corresponding to the notch group K3 (STN 270103). The fatigue limit for the above welded detail is according to Table 14 of STN 270103 σ c = 45   MPa for alternating symmetrical stresses, where the following applies:
χ = σ min σ max = 1 .
In the described case, it is an alternating stress with χ = 0.35 and mean stress:
σ m = σ max + σ g max 2 = 116 + 40 2 = 78   MPa .
According to the Smith diagram, the fatigue limit σ c   ( m ) 36   MPa was determined considering the calculated mean stress σ m . The parameters entering into the fatigue damage accumulation hypotheses are σ c   ( m ) = 36   MPa ,   N c = 2 10 6 cycles and the Wöhler curve given by the relation σ a m N = const . for the slope m = 3 ,   5 . The total number of cycles to failure H PM for the stress range corresponding to Modes 2 and 3 evaluated according to the Palmgren–Miner hypothesis, transformed from Figure 10 and Figure 11, is given in Table 5. The damage, according to the Palmgren–Miner hypothesis assuming σ m = const . , is determined by the relation
D PM = i = 1 p n i N i
where n i is the number of cycles with constant amplitude σ ai in the spectrum, N i is number of cycles to failure at constant amplitude σ ai > σ c (above the fatigue limit) and p is the number of levels of the distribution of the fundamental spectrum.
The number of cycles to failure with constant amplitude σ ai > σ c is determined from the relation:
N i = ( σ c σ ai ) w N c
where σ c is the fatigue limit of the material (MPa), σ ai is spectrum amplitude (MPa), N c is the number of cycles at fatigue limit and w is the exponent of the fatigue curve.
The total number of cycles to failure according to the Palmgren–Miner hypothesis is given by:
H PM = i = 1 p n i D PM = i = 1 p n i i = 1 p n i N i .
It can be seen in Table 5 that the total number of cycles to failure according to the Palmgren–Miner hypothesis is the lowest on girder B at the measured locations B3 and B4. Compared to the corresponding cross-section on girder A (locations A1 and A2), it decreases by more than 50%.
It was found that the number of cycles to failure at location B7 (i.e., 300 mm away from locations B3 and B4), was similar to that on girder A. This was due to the welded joint connecting the rail to the girder B top flange located precisely at the placement of the applied strain gauge transducers B3 and B4 (Figure 12). Figure 13 compares the calculated values of the normal stresses on girder A (Figure 13a) and on girder B (Figure 13b). From the course depicted in Figure 13a, it is evident that the distance of 300 mm between the measuring points for a total girder’s length of 28,500 mm does not play a significant role. From the measurements performed on girders A and B, it can be stated that the stress values at locations A1, A2, A8 and B7 are very similar in character. At locations B3 and B4, the measured local values are sometimes higher by more than 50%.

3.6. Analysis of the Cycles Operated

To assess the actual loading history, the information about the processing of approx. 2480 coils per year was provided to the authors. Each coil is transferred twice, so the total number considered will be 4960 coils per year, whereby the weight of loads transferred can be classified as follows:
  • 50% from 17 t to 21 t (steel coil + C-hook);
  • 25% from 14 t to 17 t (steel coil + C-hook);
  • 25% from 11 t to 14 t (steel coil + C-hook).
Based on the operator’s data, 4960 cycles are manipulated in 1 year, i.e., on the whole 252,960 operating cycles in 51 years.
The assessment considered the worst operating case, i.e., handling only coils with a maximum weight ( 252,960 19.6   t = 4,958,016   t ) . In this case, it would be the most aggressive fatigue damage accumulation at the maximum weight of load ( 21   t   =   19.6   t + 1.4   t ) , which corresponds to the spectrum of amplitudes evaluated in Table 4 for Mode 3. A smaller amount of tons of steel has been processed since the start of production, i.e., the real fatigue damage to the girders of the bridge crane is minor.

3.7. Comparasion of Fatique Life

According to STN 270103, the number of cycles N per technical lifetime is:
N = 6 10 5 to 2 10 6 .
According to the experimental-computational procedure, the number of cycles per technical lifetime is:
H A = 886,978 8.9 10 5 —for girder A without any welded rail,
H B = 417,921 4.2 10 5 —for girder B with the welded rail.
Number of cycles ( N o p ) operated in 51 years of operation
N o p = 2.53 10 5 .
The number of cycles operated so far meets both of the above conditions
N o p = 2.53 10 5 < N = 6 10 5 to 2 10 6 N o p = 2.53 10 5 < H B = 4.2 10 5
thus the girders still have a sufficient fatigue life reserve.

4. Discussion

The assessment of the girders of the bridge crane 22/5 t–28.5 m manufactured in 1970 consisted of inspection of the structure, strain gauge measurement, stress state assessment, and assessment of fatigue damage accumulation.
  • Inspection of parts of the steel support structure revealed that the welded joints (accessible from the footbridge) did not show any flags of damage and were without significant corrosion. The auxiliary steel elements on the bridge and the crab, footbridge and protective railing were intact. It could be concluded that the visual inspection did not reveal any corrosion.
  • Strain gauge measurements showed that the stress increments and the stresses from self-weight and other effects did not exceed the allowable stress values. The experimentally determined dynamic lift coefficient was less than that specified in STN 270103 standard. Based on the strain gauge measurements analysis, it could be concluded that the girders of the bridge crane were satisfactory in terms of strength.
  • The assessment of the fatigue damage accumulation showed that under the operating modes considered, the current technical state of the crane’s steel structure had a sufficient fatigue life reserve.
  • The differences in the values of the normal stresses determined from the strain gauge measurements at the center of the girders A (location A1) and B (location B3) of the bridge crane were, in some cases, greater than 50%. This phenomenon occurs regularly when the crab passes through the center of the girder. It is due to the attachment of the rails to the girders. Although on girder B, the rail near locations B3 and B4 was welded to the top flange, even at these stress levels, girder B was satisfactory in terms of both strength and fatigue life. Since there was a significantly higher level of damage in the areas around the welded rail, the authors recommended that the rail attachment to the girders be carefully checked when the rails were replaced.
  • The effect of welding the rail to the top flange of the girder was evident from a comparison of the measured normal stresses on girders A and B (Figure 13). This welding significantly increased the damage level in the corresponding cross-section, i.e., reduced the fatigue life of girder B.
  • The stress values at locations A1 and A2 on girder A and at locations B3 and B4 on girder B were different during all operational measurements, although their nature was the same. This fact confirmed the deformation (twisting) of the girders’ cross-section and the crab’s associated slope, i.e., the height difference of the girders. For this reason, it was also recommended to check the wear of the crab wheels.

5. Conclusions

Based on the experimental measurements evaluation, analysis of the obtained results, visual inspection, and experimental-computational verification of the possible accumulation of fatigue damage of the crane, it could be concluded that the girders of the bridge crane were satisfactory for further operation. However, maintenance of the motion gear and the rail connection to the girders was required. By analyzing the results of the strain gauge measurements, the influence of the height course of the crab’s trajectory (comparison of different stress levels at locations A1/A2 and B3/B4, respectively) in combination with the attachment of the rails to the girders on the stress state at the analyzed locations was confirmed. For this reason, the authors recommended checking the rail to girder attachment or replacing welded joints with clamps. Based on the analysis of the strain gauge measurements and more than 50 years of continuous operation, we recommended checking the welds of the steel structure of the bridge crane girders along their entire lengths and the state of the crane’s track.
In the analyzed case, the fatigue life of the bridge crane girders was not outspent mainly because the crane had worked at a low number of operating cycles, i.e., 18 cycles per 24 h. The duration of one cycle is about 5 min, i.e., the total operating time for one working day is about 1.5 h. In the case of the same operating load but with a higher number of cycles (e.g., a trans-shipment station), the effect of the detected welding of the rail to the girder would very likely lead to fatigue damage and consequently to a failure of the bridge crane.

Author Contributions

Conceptualization, M.P. and J.K.; methodology, M.P. and J.K.; software, M.P. and M.H.; validation, M.P, P.L. and M.H.; formal analysis, M.P. and J.K.; investigation, M.P. and P.L.; resources, J.K.; data curation, P.L. and M.H.; writing—original draft preparation, M.P., P.L. and M.H.; writing—review and editing, M.P., P.L., M.H. and J.K.; visualization, P.L. and M.H.; supervision, M.P.; project administration, M.P.; funding acquisition, M.P. All authors have read and agreed to the published version of the manuscript.

Funding

This work was supported by the Slovak Research and Development Agency under the contract APVV 15-0435 and by the Ministry of Education, Science, Research and Sport of the Slovak Republic under the contracts VEGA 1/0516/22 and VEGA 1/0500/20.

Institutional Review Board Statement

Not applicable.

Informed Consent Statement

Not applicable.

Data Availability Statement

Not applicable.

Conflicts of Interest

The authors declare no conflict of interest.

References

  1. Klemenc, J.; Fajdiga, M. Estimating S–N curves and their scatter using a differential ant-stigmergy algorithm. Int. J. Fatigue 2012, 43, 90–97. [Google Scholar] [CrossRef]
  2. Xu, Y.L.; Zhang, K.; Han, L.; Li, M.F. Analyses of p-S-N curve and fracture morphology of die-casting magnesium alloy AZ91D containing mischmetal. Appl. Mech. Mat. 2013, 467, 103–107. [Google Scholar] [CrossRef]
  3. Geiger, M.; Falk, B. Prediction of service life and failure probability of cold forging tools. CIRP Ann. 2001, 50, 173–176. [Google Scholar] [CrossRef]
  4. Kadirgama, K.; Abou-El-Hossein, K.; Mohammad, B.; Noor, M.M.; Sapuan, S.M. Prediction of tool life by statistic method in end-milling operation. Sci. Res. Essay 2008, 3, 180–186. [Google Scholar]
  5. Aggarwal, M.L.; Agrawal, V.P.; Khan, R.A. A stress approach model for predictions of fatigue life by shot peening of EN45A spring steel. Int. J. Fatigue 2006, 28, 1845–1853. [Google Scholar] [CrossRef]
  6. Tian, B.J.; Xiong, J.J.; Liu, J.Z. A new approach for evaluating fatigue lives of multi-fastener mechanical joints based on a nominal stress concept and minimal datasets. Int. J. Fatigue 2015, 80, 257–265. [Google Scholar] [CrossRef]
  7. Deng, C.; Liu, Y.; Gong, B.; Wang, D. Numerical implementation for fatigue assessment of butt joint improved by high frequency mechanical impact treatment: A structural hot spot stress approach. Int. J. Fatigue 2016, 92, 211–219. [Google Scholar] [CrossRef]
  8. Lang, R.; Lener, G. Application and comparison of deterministic and stochastic methods for the evaluation of welded components’ fatigue lifetime based on real notch stresses. Int. J. Fatigue 2016, 93, 184–193. [Google Scholar] [CrossRef]
  9. Kyuba, H.; Dong, P. Equilibrium-equivalent structural stress approach to fatigue analysis of a rectangular hollow section joint. Int. J. Fatigue 2005, 27, 85–94. [Google Scholar] [CrossRef]
  10. Dong, Q.; He, B.; Qi, Q.; Xu, G. Real-time prediction method of fatigue life of bridge crane structure based on digital twin. Fatigue Fract. Eng. Mater. Struct. 2021, 44, 2280–2306. [Google Scholar] [CrossRef]
  11. Ávila, G.; Palma, E.; De Paula, R. Crane girder fatigue life determination using SN and LEFM methods. Eng. Fail. Anal. 2017, 79, 812–819. [Google Scholar] [CrossRef]
  12. Caglayan, O.; Kadir, O.; Ovunc, T.; Uzgider, E. Fatigue life prediction of existing crane runway girders. J. Constr. Steel Res. 2010, 66, 1164–1173. [Google Scholar] [CrossRef]
  13. Tong, X.; Tuan, C.Y.; Yang, J.; Zhang, J.; Yue, Q. Fatigue strength of end-coped crane runway girders. J. Struct. Eng. 2007, 133, 1783–1791. [Google Scholar] [CrossRef]
  14. Kuľka, J.; Mantič, M.; Kopas, M.; Faltinová, E. Assessing the need for rope replacement in crane lifting equipment after change of crane operational parameters. Adv. Sci. Tech. Res. J. 2017, 11, 226–230. [Google Scholar] [CrossRef] [Green Version]
  15. Faltinová, E.; Mantič, M.; Kuľka, J.; Kopas, M. Reliability analysis of crane lifting mechanism. Sci. J. Sil. Univ. Technol. Ser. Transp. 2018, 58, 15–26. [Google Scholar] [CrossRef]
  16. Frankovský, P.; Delyová, I.; Sivák, P.; Kurylo, P.; Pivarčiová, E.; Neumann, V. Experimental assessment of time-limited operation and rectification of a bridge crane. Materials 2020, 13, 2708. [Google Scholar] [CrossRef] [PubMed]
  17. Bomas, H.; Mayr, P. Crack density and fatigue lifetime of metals under variable amplitude loading. In Advances in Fatigue Lifetime Predictive Techniques, 2nd ed.; ASTM International: West Conshohocken, PA, USA, 1993. [Google Scholar]
  18. Darisuren, S.; Park, J.H.; Pyun, Y.S.; Amanov, A. A Study on the Improvement of the Fatigue Life of Bearings by Ultrasonic Nanocrystal Surface Modification Technology. Metals 2019, 9, 1114. [Google Scholar] [CrossRef] [Green Version]
  19. Trebuňa, F.; Šimčák, F.; Bocko, J.; Pástor, M. Analysis of causes of casting pedestal failures and the measures for increasing its residual lifetime. Eng. Fail. Anal. 2013, 29, 27–37. [Google Scholar] [CrossRef]
  20. Kopas, P.; Sága, M.; Handrik, M.; Vaško, M.; Jakubovičová, L. Fatigue characteristics of welded high strength steel in the low cycle region of loading. In Proceedings of the XXIII Polish-Slovak Scientific Conference on Machine Modelling and Simulations (MMS 2018), Rydzyna, Poland, 4–7 September 2018. [Google Scholar]
  21. Hensel, J.; Eslami, H.; Nitschke-Pagel, T.; Dilger, K. Fatigue strength enhancement of butt welds by means of shot peening and clean blasting. Metals 2019, 9, 744. [Google Scholar] [CrossRef]
  22. Liu, N.; Xiang, D.; Mou, P.; Ren, Y.; Xie, N. Fatigue research on welding joint of the main girder in bridge crane. Adv. Mat. Res. 2013, 711, 323–326. [Google Scholar]
  23. STN 27 0103 Design of Steel Structures of Cranes. Calculation According to Limit States. Available online: https://standards.iteh.ai/catalog/standards/cen/50114fff-8da7-4b24-bc51-ed57b81a452f/en-13001-3-1-2012a2-2018 (accessed on 20 June 2022). (In English).
  24. STN EN 1090-2 (2018) Execution of Steel Structures and Aluminium Structures-Part 2: Technical Requirements for Steel Structures. Available online: https://standards.iteh.ai/catalog/standards/cen/dace6bce-f81f-496e-9d3e-fc539c2dd8b6/en-1090-2-2018 (accessed on 15 July 2022).
  25. Furbacher, I.; Macek, K.; Steidl, J. Lexicon of Technical Materials; Verlag Dashöfer: Prague, Czech Republic, 2005. [Google Scholar]
  26. EN 1993-1-9 (2005): Eurocode 3: Design of Steel Structures-Part 1-9: Fatigue. Available online: https://standards.iteh.ai/catalog/standards/cen/886bde8e-f737-4e33-ab90-4c73883f6d22/en-1993-1-9-2005 (accessed on 10 August 2022).
Figure 1. Schematic view of strain gauge locations.
Applsci 12 10319 g001
Figure 2. View of the travelling track of the bridge crane and the steel coil handling locations.
Applsci 12 10319 g002
Figure 3. Time courses of stresses, Mode 1; movement of the crab without load: (a) full record, (b) detail record for the crab passing through the center of the girders.
Applsci 12 10319 g003
Figure 4. Time courses of stresses, Mode 2; manipulation of coils 1, 2 and 3: (a) full record, (b) detail record for the crab passing through the center of the girders.
Applsci 12 10319 g004
Figure 5. Time courses of stresses, Mode 3; coil 6: (a) full record, (b) detail record for the crab passing through the center of the girders.
Applsci 12 10319 g005
Figure 6. The cross-section of girder: (a) at the center of the bridge crane (location of the maximum bending moment), (b) at 300 mm distance from the center of the bridge crane.
Applsci 12 10319 g006
Figure 7. Experimental determination of the dynamic lift coefficient—time courses of calculated normal stresses and visualization of their mean values.
Applsci 12 10319 g007
Figure 8. Dependence between the calculated fatigue strengths Rfat (−1) and Rfat (χ). Note: σU—ultimate strength, σY—yield strength, σmax—maximum stress, σmin—minimum stress, σfat, t—fatigue strength by tensile loading, σfat, c—fatigue strength by compression.
Applsci 12 10319 g008
Figure 9. Spectrum of stress amplitudes, Mode 1.
Applsci 12 10319 g009
Figure 10. Spectrum of stress amplitudes, Mode 2.
Applsci 12 10319 g010
Figure 11. Spectrum of stress amplitudes, Mode 3.
Applsci 12 10319 g011
Figure 12. View of the rail welded to girder B.
Applsci 12 10319 g012
Figure 13. Comparison of the normal stress courses obtained at the same instant of time when the crab passed through the center of the girders: (a) girder A (locations 1, 2, 8), (b) girder B (locations 3, 4, 7).
Applsci 12 10319 g013
Table 1. Technical parameters of the bridge crane.
ParameterValue
capacity22,000/5000 kg
lifting height10 m
span28.5 m
controlfrom the cab
drive typeElectric
main lift10.79 m/min
auxiliary lift25 m/min
crab travel0.833 m/s, (50 m/min)
crane travel1.667 m/s, (100 m/min)–4 speed levels
length168 m
height level11 m
Table 2. The classification of the analyzed crane according to standard STN 270103.
ParameterGroup
lifting classH3
type of operationD2
stress spectrumS2
operational groupJ5
Table 3. Data on weights of transferred loads.
Coil Group/SectorCoil NumberTotal Weight of Load (kg) 1
I/Sector 2A113,400
219,120
320,950
II/Sector 2B113,610
219,300
320,930
1 The total weight of the load consists of the steel coil unladen and the crane hook used.
Table 4. Maximum stress values measured when handling steel coil 6 in Mode 3.
StressMeasured LocationNormal/Shear Stress at Load 20,930 kg (MPa)Absolute Difference (MPa)
NormalA1−54.30.1
A1−54.2
B3−70.84.6
B4−66.2
B7−46.47.3
A8−53.7
ShearB5-
A616.0
Table 5. Number of cycles to failure according to the Palmgren–Miner hypothesis.
ModeNumber of Cycles to Failure HPM at Strain Gauge Locations
A1A2B3B4B7A8
21,042,204926,605527,273594,307877,733912,436
3905,820886,978417,921482,169857,737888,170
Publisher’s Note: MDPI stays neutral with regard to jurisdictional claims in published maps and institutional affiliations.

