Article

Comparative Study on the Application of Different Slug Test Models for Determining the Permeability Coefficients of Rock Mass in Long-Distance Deep Buried Tunnel Projects

School of Earth Sciences and Engineering, Hohai University, Nanjing 210098, China
*
Author to whom correspondence should be addressed.
Appl. Sci. 2022, 12(20), 10235; https://doi.org/10.3390/app122010235
Submission received: 29 September 2022 / Revised: 6 October 2022 / Accepted: 8 October 2022 / Published: 11 October 2022
(This article belongs to the Special Issue Engineering Groundwater and Groundwater Engineering)

Abstract

:
In large-scale water diversion projects, especially in the central and western regions of China, long-distance deep buried tunnels are generally involved. Therefore, it is essential to carry out field tests to obtain the permeability of the rock mass through which tunnels pass. However, the test holes of large-scale water diversion projects are basically located in mountain areas with complex hydrogeological conditions. Meanwhile, the test holes are far apart and large in depth. As a result, traditional pumping tests cannot meet the requirements. Therefore, the slug test was chosen as the main test method, and the calculation results of the water injection test, the water pressure test and the slug test are analyzed and compared. The calculation results of the three test methods are basically consistent. However, the water injection test and the water pressure test are difficult to implement at a large scale due to many environmental constraints, complex test equipment, long test periods and other factors. Furthermore, the Kipp model, the CBP model and the proposed HWS model, considering the effect of the finite thickness well-skin layer for the first time, were used to analyze and process the slug test data, respectively. The curve fitting effect of the Kipp model was the best, but the calculations were generally larger. The difference between the CBP model and the proposed HWS model is smaller in the calculation results; however, the curve fitting effect of the CBP model is the worst, and the CBP model needs to be further improved. The curve fitting effect of the proposed HWS model was between that of the Kipp model and the CBP model, and the proposed HWS model can be applied to the parameter calculations of the slug test with well-skin. In general, with reference to the criteria for the damping coefficient of the aquifer in the Kipp model, the Kipp model was applicable to the slug test for test holes without well-skin and an aquifer damping coefficient between 0.1 and 5.0. The CBP model was applicable to the slug test under the conditions of no well-skin and an aquifer damping coefficient greater than 2.0. The novel proposed HWS model was applicable to the slug test when the aquifer damping coefficient was greater than 1.0 under the conditions of no well-skin, positive well-skin and negative well-skin.

1. Introduction

The permeability coefficient of rock mass is a very important hydrogeological parameter in groundwater movement, especially for large-scale water diversion projects with deep buried tunnels. The permeability of the rock mass through which tunnels pass directly affects the construction safety and project cost. Meanwhile, the tunnel construction will disturb the surrounding groundwater environment and affect the drinking groundwater resources for residents in the surrounding mountain areas. Therefore, it is necessary to determine the permeability coefficient of rock mass in the study area during the preliminary investigation. Traditional test methods for determining the permeability coefficients include the pumping test, water pressure test, water injection test, etc. The traditional test methods have obvious disadvantages in practical application. For large-scale water diversion projects, test holes are often arranged in mountain areas with varying topographical conditions. The span between test holes is large, and the hydrogeological conditions are significantly different among them. The pumping test is time-consuming and laborious; meanwhile, it often requires multiple observation wells for auxiliary observation. Furthermore, the pumping test cannot be carried out in test holes of deeply buried rock mass with low permeability. Therefore, it is difficult to apply the pumping test in mountainous areas with complex hydrogeological conditions. Although the water pressure test can be carried out in a single hole, the equipment of the water pressure test is complicated. Meanwhile, it is difficult for the water pressure test to achieve the effects of water sealing and water pressure in broken rock mass, and it easily causes the test hole wall to collapse during the test. The water pressure test obtains a Lugeon value of the water permeability, which needs to be converted into the permeability coefficient according to empirical formulas. Meanwhile, the water pressure test requires a large number of water resources, and in many mountain areas, it is difficult to meet the water requirements, so the water pressure test also has obvious limitations. The water injection test is easy to operate and requires relatively little manpower and few material resources; however, the theory of the water injection test is relatively imperfect and is greatly influenced by the structure of the test well. Meanwhile, the rock mass with high permeability is suitable for the constant water head water injection test; it requires a large number of water resources. The rock mass with low permeability is suitable for the variable water head water injection test, which has a longer test period. Therefore, it is necessary to choose the slug test method proposed in recent years to carry out an investigation of the hydrogeological parameters of the rock mass of long-distance deep buried tunnels.
Compared to traditional tests such as the pumping test, water pressure test, water injection test, etc., the slug test is a relatively novel technical method. The slug test method can obtain the permeability coefficient of the aquifer in a small range around the test holes, which is based on the principle of increasing or decreasing the small amount of water in the test hole instantaneously in order to cause the water level to rise or drop. Then, the law of the water level change over time is studied, and the hydrogeological parameters of the aquifer are calculated [1]. Hvorslev [2] first proposed the slug test method to determine the permeability coefficient of an aquifer and then obtained the permeability coefficient of the site soil by observing the time lag of the water level response in a test hole. As a novel test method for the rapid determination of hydrogeological parameters in the field, the slug test has a research history of 70 years since its successful application. Domestic and foreign scholars have devoted their attention to the research of the slug test method and the improvement of the solution model, and there are more than 50 kinds of solution models for the slug test at present [3]. According to the different water flow equations in the test hole, the slug test can be divided into conductive and oscillatory slug tests. Among them, the CBP model (the abbreviation of Cooper-Bredehoeft-Papadopulos model) proposed by Cooper [4] is a typical conductive slug test theory, and the permeability coefficient can be obtained by making the measured dimensionless water level change curve fit the semi-log standard curve. Kipp [5] derived differential equations characterizing water level variations in a test hole based on the unsteady flow control equation in an aquifer, the mass conservation equation of the water between the test hole and the aquifer and the momentum balance equation of the water motion in the test hole. Meanwhile, Kipp [5] used dimensionless variables and parameters to transform the equation into a dimensionless form and obtained the solution of the equation by Laplace transform and inverse Laplace transform to establish a set of standard curves covering all response ranges of water motion from underdamped to overdamped, which further improved the curve type of the water level variation with time in the slug test. The Kipp model is a typical oscillatory slug test theory. Furthermore, slug test analysis theory can be further divided into two major categories according to whether the well-skin effect of the test hole is considered. Sageev [6] presented the water head response of an aquifer to a slug test in a fully penetrating well with wellbore storage and skin. Zenner [7] developed a general non-linear model for the analysis of the slug test, which included well-skin effects, non-linear head losses due to fluid friction, minor losses originating at radius changes and inertial effects of the water columns. Malama [8] accounted for inertial effects in source and observation wells and demonstrated the applicability of the semi-analytical model to multi-well and multi-level pneumatic slug tests. Sahin [9] introduced two new estimation approaches for the slug test, the time shift method (TSM) and the arc-length matching method (AMM). The skin effect was also implemented to evaluate its impact on the estimation performance of the suggested approaches. Quinn [10] and Hommersen [11] reported that it was important to account for frictional and inertial losses in order to obtain permeability parameters from the slug tests and presented a new method to apply to underdamped slug tests observed in fractured rock. The new method avoided errors caused by inertia and friction effects. The inertia frictional area was well studied and explained by Bouchaala et al. [12,13].
At present, the commonly used calculation theory basically does not consider the well-skin effect. Hyder [14] found in his study that when positive well-skin effects are present, the Bouwer and Rice model produced errors of more than two orders of magnitude in the estimation of the permeability coefficient. Yeh [15] proposed a new semi-analytical solution for the slug test in a partially penetrating confined aquifer considering well-skin effects. This method can be used to prove the influence of skin type or skin thickness on the well water level and estimate the hydraulic parameters of the well-skin layer and aquifer by using the least-squares method. Liang [16] proposed an analytical solution for the slug test conducted in a partially penetrating well in an unconfined aquifer influenced by unsaturated zones, considering well-skin effects and underdamped environments. Morozov [17] developed a semi-analytical and approximate analytical solution of the slug test in a partially penetrating well in a confined or unconfined anisotropic aquifer under the premise of considering the anisotropy of hydraulic conductivity and the well-skin effect.
The slug test has the characteristics of a perfect theory, a short test period (several hours or even tens of seconds), simple equipment, little manpower, few material resources and accurate results. However, it has a high requirement regarding the quality of the test hole, such as the collapse of the test hole wall, mud wall protection, excessive well flushing and so on, which will have a certain effect on the test results. Therefore, this paper proposes a novel HWS model (HHU Well-Skin model, abbreviated as the HWS model) and a calculation method of the parameter solution of the slug test, considering the influence of the finite thickness well-skin layer. Meanwhile, the Kipp model, CBP model and HWS model are used to compare and analyze the slug test data obtained in the test hole of the rock mass through which the long-distance deep buried tunnels of two large-scale water diversion projects pass. The two large-scale water diversion projects are, respectively, the Central Yunnan Water Diversion Project and the Water Diversion Project from the Three Gorges Reservoir to Hanjiang River. The advantages, disadvantages and applicability of the three models of the slug test are discussed by comparing and verifying the results of the slug test, water pressure test and water injection test.

2. Theories and Methods

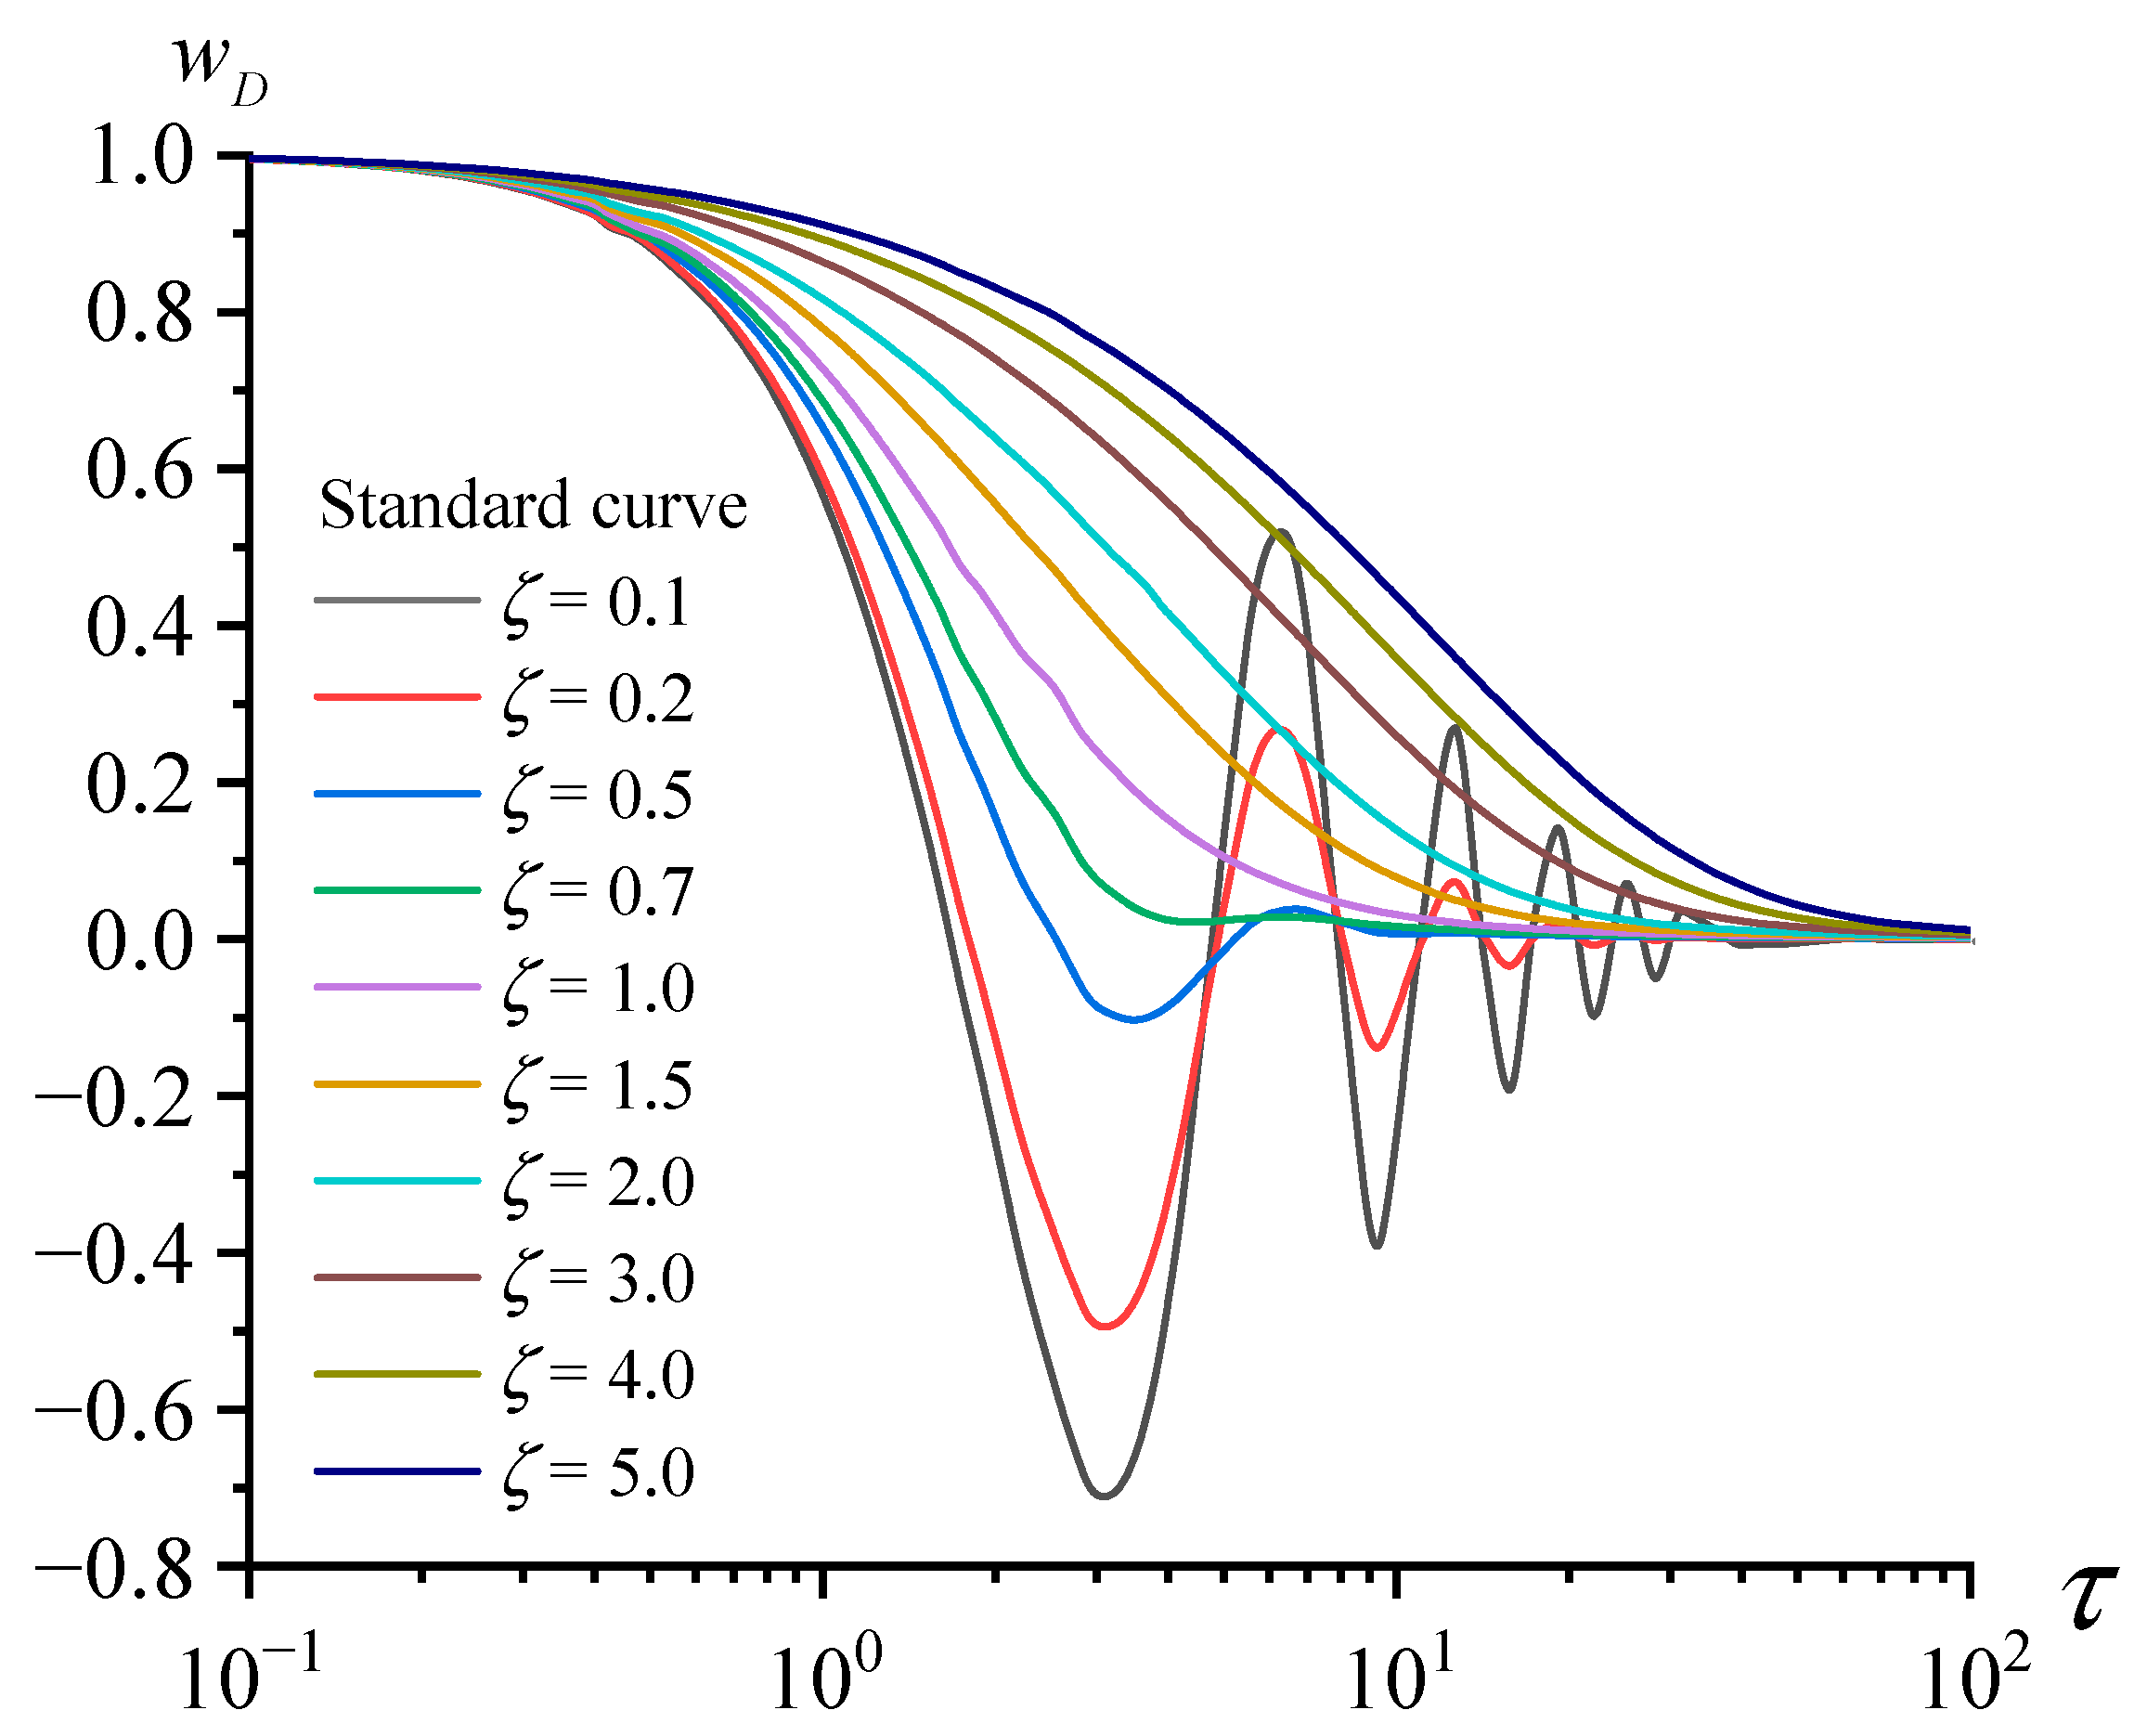
2.1. Fundamentals of the Kipp Model

Kipp [5] derived differential equations characterizing water level variations in the test hole based on the unsteady flow control equation in the aquifer, the mass conservation equation of water between the test hole and aquifer and the momentum balance equation of water motion in the test hole. The solution of the equation was obtained by Laplace transform and its inverse, and then the hydrogeological parameters were determined by fitting the standard curve.
The groundwater continuity equation in the aquifer is as follows:
S T h t = 1 r r ( r h r )
According to the flow rate balance, the change in the flow in the well caused by oscillation is equal to the radial flow of the aquifer around the well wall:
π r c 2 d w d t = 2 π r w T h r | r = r w
The differential equation of the oscillation of water flow in the test hole based on the mass conservation and momentum balance is as follows:
d 2 w d t 2 + ( g L e ) w = g ( h w h 0 ) L e
where L e is the effective water column length, L e = L + ( r c 2 r w 2 ) ( B 2 ) ;
With initial conditions: when t = 0 , h = h 0 , w = w 0 , d w d t = w 0 , h w = L = h 0 ;
With boundary conditions: when r , h h 0 .
These equations can be converted to a dimensionless form by the dimensionless variables and parameters and solved by the application of Laplace transform and inverse transform. Then, a set of w D ~ τ standard curves can be obtained, as shown in Figure 1.
The aquifer permeability coefficient is calculated as follows:
K = r c 2 τ ln β 16 ζ t B
The w t measured curve can be plotted according to the slug test data. Keep the vertical coordinate axis of the measured curve and the standard curve aligned at the same horizontal height. Then, the measured curve is shifted along the horizontal axis to make the measured curve fit the standard curve, and the corresponding ζ and β values of the fitted standard curve are recorded. At the same time, select any matching point and record the corresponding coordinate values ( [ τ ] and [ t ] ) of the standard curve and the measured curve. Thus, the aquifer permeability coefficient can be obtained by Equation (4).
Among them, h is the aquifer water level variation ( m ) ; t is the time ( s ) ; τ is the dimensionless time; S is the storage coefficient; T is the hydraulic conductivity coefficient ( m 2 / s ) ; K is the permeability coefficient ( m / s ) ; r c is the radius of the well casing ( m ) ; r w is the radius of the well screen ( m ) ; w is the well water level variation ( m ) ; w 0 is the initial well water level variation ( m ) ; L is the static water column length above the top of the aquifer ( m ) ; B is the aquifer thickness ( m ) ; h w is the water head of the screen ( m ) ; ζ is the dimensionless damping parameter; β is the dimensionless inertial parameter, obtained by iterative calculation; w D is the dimensionless water level variation of the standard curve; w is the dimensionless water level variation of the measured curve.

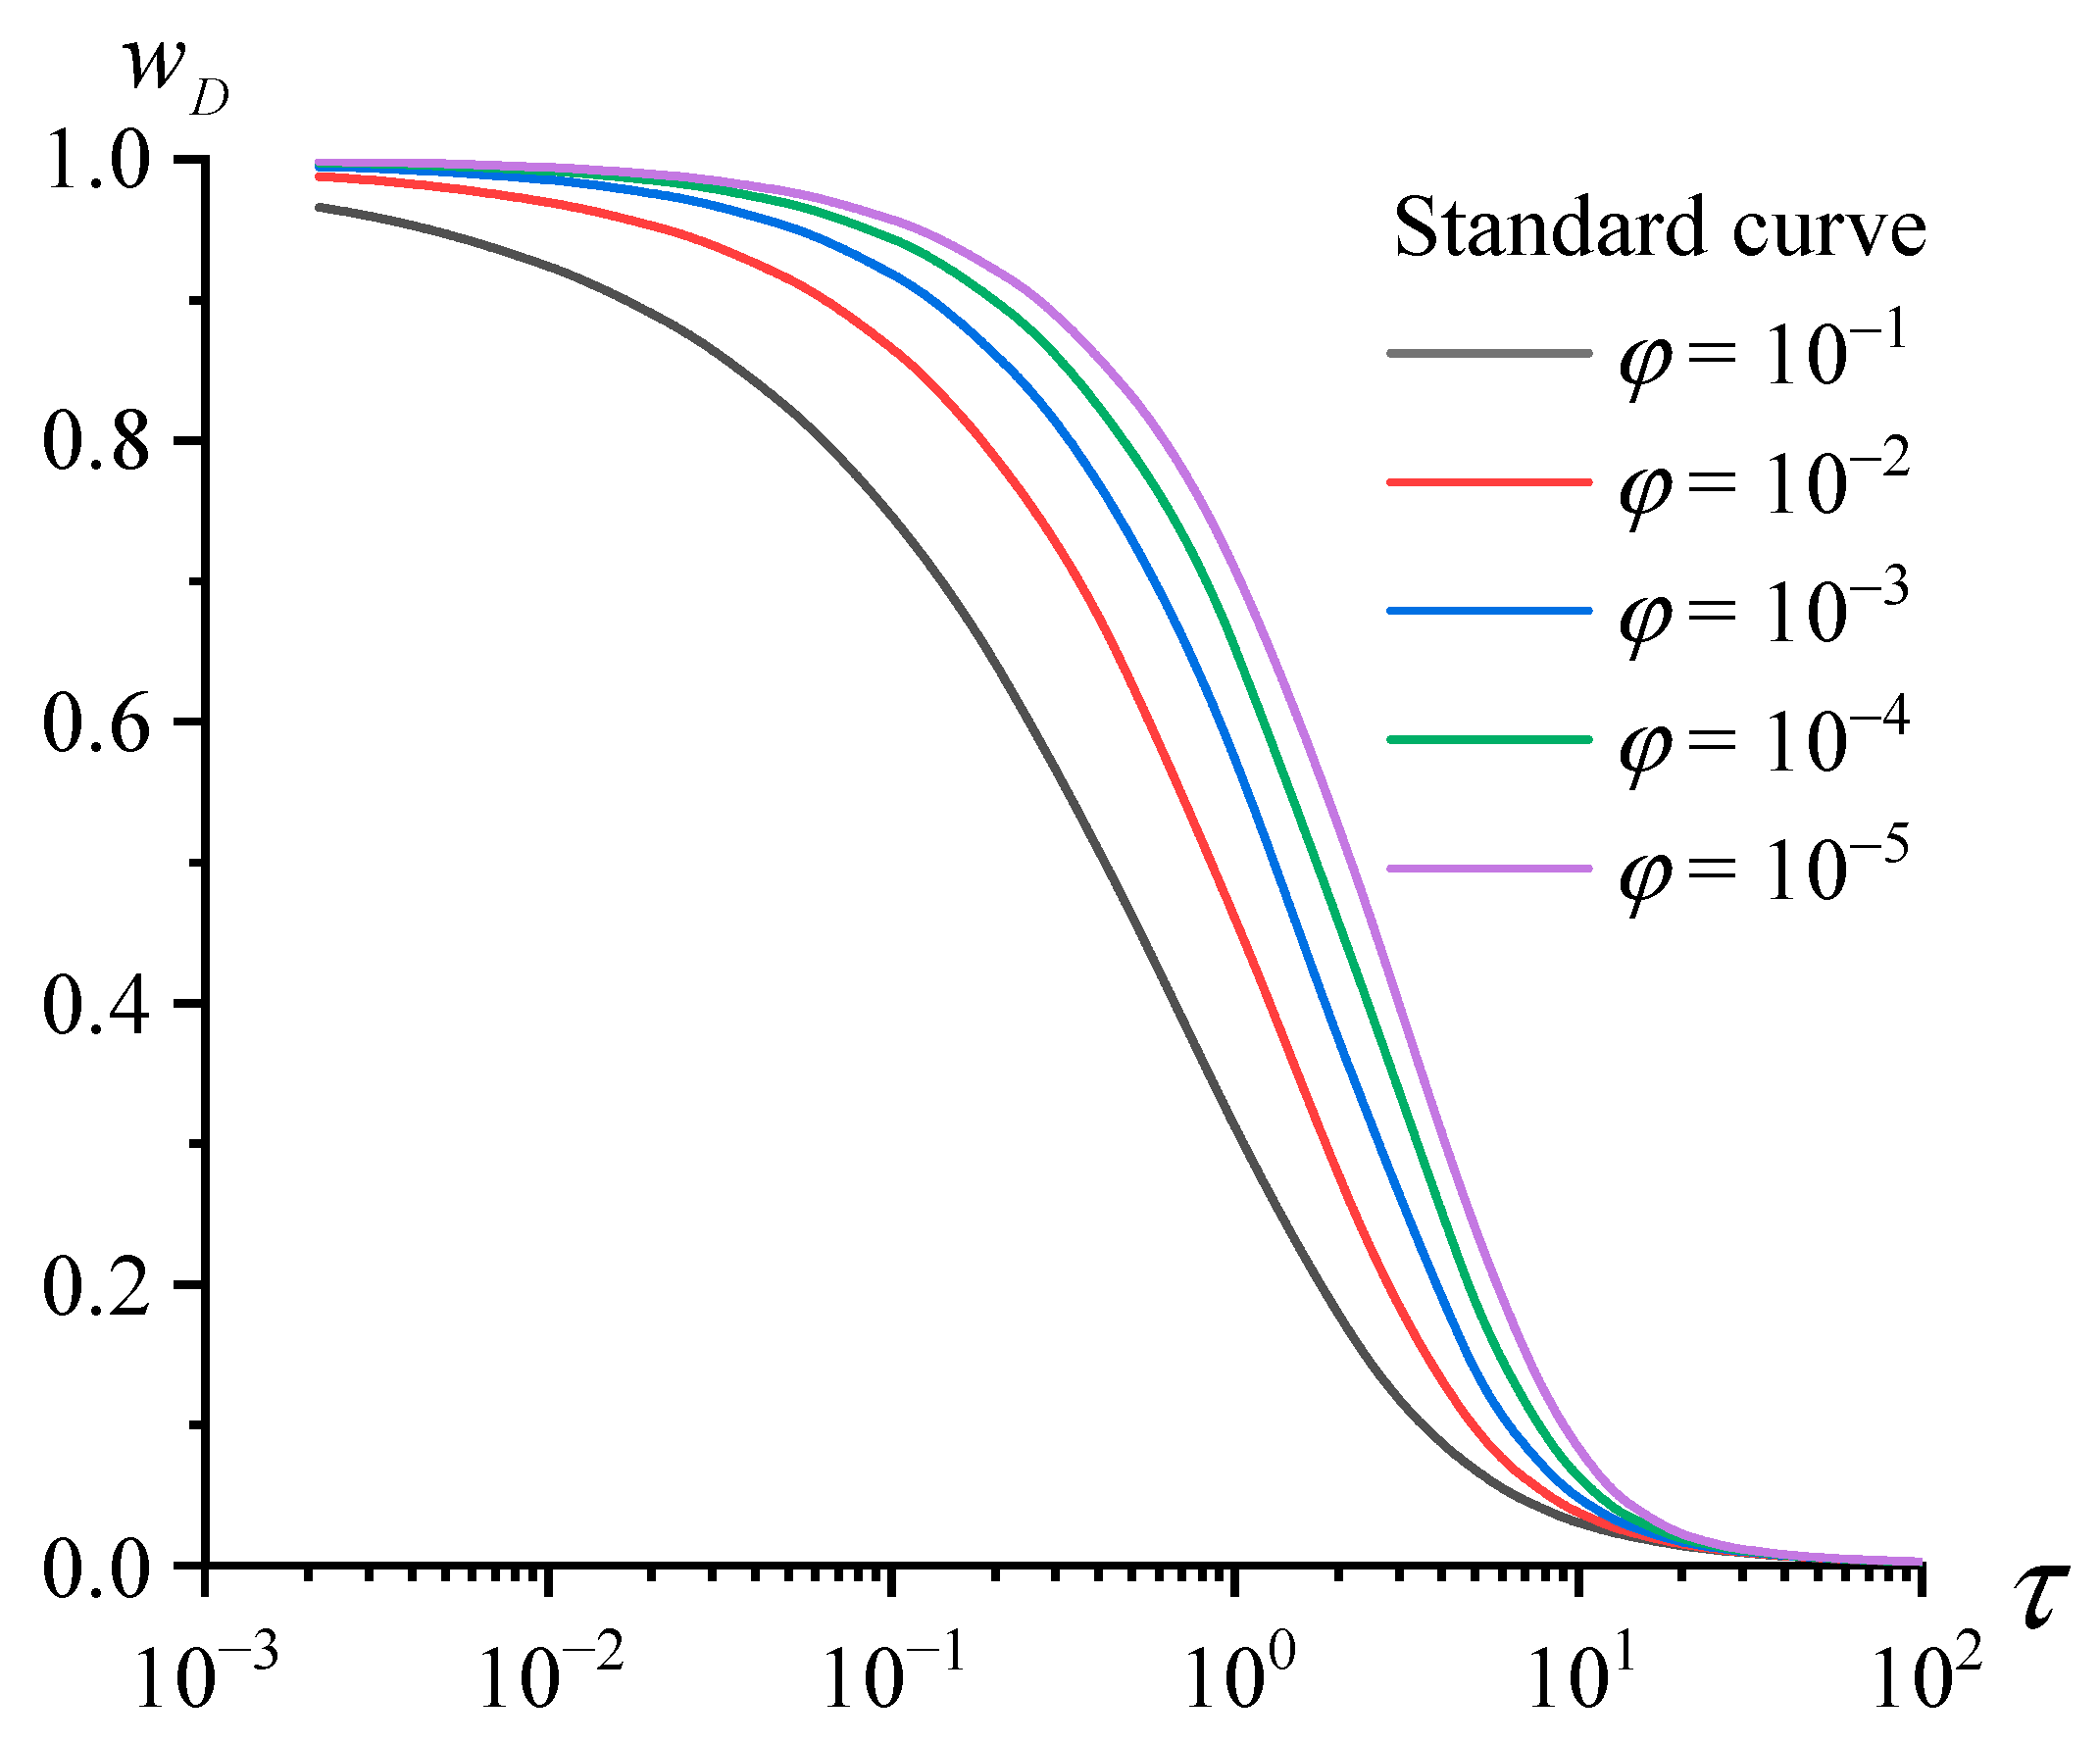
2.2. Fundamentals of the CBP Model

The CBP model is a typical conductive slug test theory whose purpose is to obtain the permeability coefficient by fitting a standard curve with a semi-log plot of the water level variation after being dimensionless in the test hole with time [4]. The groundwater continuity equation in the aquifer is the same as Equation (1).
Cooper derived the water head variation relationship as follows:
w = w 0 F ( φ , τ )
Among them,   w D = w w 0 ; F ( φ , τ ) = 8 φ π 2 0 e x p ( β u 2 / φ ) u f ( u , φ ) d u ; u = r 2 S 4 T t ; f ( u , φ ) = [ u I 0 ( u ) 2 α I 1 ( u ) ] 2 + [ u K 0 ( u ) 2 u K 1 ( u ) ] 2 .
A set of w D τ standard curves can be obtained, as shown in Figure 2.
The aquifer permeability coefficient is calculated as follows:
K = τ r c 2 t B
The w t measured curve can be plotted according to the slug test data. Keep the vertical coordinate axis of the measured curve and the standard curve aligned at the same horizontal height. Then, the measured curve is shifted along the horizontal axis to fit the standard curve. At the same time, select any matching point and record the corresponding coordinate values ( [ τ ] and [ t ] ). Thus, the aquifer permeability coefficient can be obtained by Equation (6).
Among them, φ is the dimensionless storage coefficient; I 0 ( u ) and K 0 ( u )   are the first- and second-type modified Bessel functions of the zero order; I 1 ( u ) and K 1 ( u )   are the first- and second-type modified Bessel functions of the order 1; the rest of the symbols have the same meaning as they do above.

2.3. Fundamentals of the HWS Model

A novel HWS model (HHU Well-Skin model, abbreviated as the HWS model) is proposed by us for the first time. Meanwhile, a parameter calculation method of the slug test considering the influence of the finite thickness well-skin layer based on the HWS model is proposed.
The groundwater continuity equation is established between the confined aquifer and the finite thickness well-skin layer. The water balance equation is established in the contact surface between the confined aquifer and the finite thickness well-skin layer and between the finite thickness well-skin layer and the well. The theoretical model of the slug test under the influence of the well-skin is shown in Figure 3.
(1)
Establishment of the theoretical model
The governing equation of the groundwater radial flow in a well-skin layer and a confined aquifer is as follows:
2 h 1 r 2 + 1 r h 1 r = S 1 T 1 h 1 t , r w r r s
2 h 2 r 2 + 1 r h 2 r = S 2 T 2 h 2 t , r s r
A water balance equation is established in the contact surface between the confined aquifer and the well-skin layer of finite thickness as follows:
K 1 h 1 ( r s , t ) r = K 2 h 2 ( r s , t ) r , t > 0
A water balance equation is established in the contact surface between the well-skin layer of finite thickness and the well as follows:
π r c 2 d w ( t ) d t = 2 π r w K 1 B h 1 ( r w , t ) r , t > 0
Among them, subscripts 1 and 2 represent the well-skin layer and the confined aquifer parameters, respectively, r s is the distance from the center of the well to the outer boundary of the well-skin layer ( m ) and the rest of the symbols have the same meaning as they do above.
(2)
Solution of the theoretical model
First, these equations can be converted to a dimensionless form by the following dimensionless variables and parameters:
h 1 D = h 1 w 0 , h 2 D = h 2 w 0 , ρ = r r w , ρ s = r s r w , ρ w = 1 , τ = K 2 t S 2 r w 2 , α = K 2 K 1 , β = S 1 K 2 S 2 K 1 , γ = r c 2 2 S 2 B r w 2
Then, Laplace transform is used to solve the set of Equations (7)–(10) in turn, as follows:
2 h 1 D ¯ ρ 2 + 1 ρ h 1 D ¯ ρ β 2 p h 1 D ¯ = 0 ,   1 ρ ρ s  
2 h 2 D ¯ ρ 2 + 1 ρ h 2 D ¯ ρ p h 2 D ¯ = 0 ,   ρ s ρ  
h 1 D ¯ ρ ( ρ s , p ) = α h 2 D ¯ ρ ( ρ s , p ) ,   p > 0
α γ ( p w D ¯ 1 ) = h 1 D ¯ ( 1 , p ) ρ
According to the general solution of the modified Bessel equation of the order 0, the solutions of Equations (12) and (13) are obtained as follows:
h 1 D ¯ ( ρ , p ) = C 1 K 0 ( β ρ p ) + C 2 I 0 ( β ρ p )
h 2 D ¯ ( ρ , p ) = C 3 K 0 ( ρ p ) + C 4 I 0 ( ρ p )
Among them, C 1 and C 2   , C 3 and C 4 are constants determined by boundary conditions in the well-skin layer and the aquifer, respectively.
By substituting C 1 , C 2   , C 3 and C 4 into Equations (16) and (17), respectively, the solutions of Equations (12) and (13) can be obtained as follows:
h 1 D ¯ ( ρ , p ) = α γ [ c 1 K 0 ( β ρ p ) + c 2 I 0 ( β ρ p ) ] a 1 c 2 + a 2 c 1
h 2 D ¯ ( ρ , p ) = α γ [ c 1 K 0 ( β ρ s p ) + c 2 I 0 ( β ρ s p ) ] K 0 ( ρ p ) ( a 1 c 2 + a 2 c 1 ) K 0 ( ρ s p )
The final solution in the Laplace transform domain is obtained as follows:
w D ¯ ( p ) = α γ [ c 1 K 0 ( β p ) + c 2 I 0 ( β p ) ] a 1 c 2 + a 2 c 1
The analytical solution of the model in the Laplace transform domain is obtained by using the AWG (Azari–Wooden–Gaver) algorithm [18,19] in the inverse Laplace transform in Equation (20), as follows:
w D ( τ ) = l n 2 τ i = 1 N V i w D ¯ ( l n 2 τ i )
V i = ( 1 ) N 2 + i k = [ i + 1 2 ] M i n ( i , N 2 ) k N 2 ( 2 k + 1 ) ! ( N 2 k + 1 ) ! k ! ( k + 1 ) ! ( i k + 1 ) ! ( 2 k i + 1 ) !
Among them, w D ( τ ) is the dimensionless water level variation; w D ¯ ( p ) is the dimensionless water level variation in the Laplace transform domain; N is the number of summation terms; the rest of the symbols have the same meaning as they do above.
According to Equations (20) and (21), the standard curve data corresponding to different γ values when the well-skin factor is α = 1 , β = 1 , ρ s = 1 are calculated. Then, a set of w D ~ τ standard curves without the influence of the well-skin effect can be obtained by plotting the curve data, as shown in Figure 4. In the same way, the standard curve data corresponding to different α values when β = 50 ,   γ = 1000 and ρ s = 3 are calculated. Then, a set of w D ~ τ standard curves under the influence of the well-skin effect can be obtained by plotting the curve data, as shown in Figure 5.
The aquifer permeability coefficient is calculated as follows:
K 2 = [ τ ] [ t ] r c 2 2 γ B
Similarly, the w t measured curve can be plotted according to the slug test data. Keep the vertical coordinate axis of the measured curve and the standard curve aligned at the same horizontal height. Then, the measured curve is shifted along the horizontal axis to fit the standard curve, and the corresponding α , β and γ values of the fitted standard curve are recorded. At the same time, select any matching point, and record the corresponding coordinate values ( [ τ ] and [ t ] ). Thus, the aquifer permeability coefficient can be obtained by Equation (23).

2.4. Fundamentals of the Water Injection Test

According to the Chinese “Code of water injection test for water resources and hydropower engineering” (SL 345-2007) [20], when carrying out the variable water head water injection test in the test hole, it is necessary to first seal the water at the top and bottom of the test section. Then, inject a certain amount of water into the casing in order to make the water level in the casing higher than the groundwater level by a certain height, and, finally, record the change in water level in the casing with time. Draw the relation curve between the water head ratio and the time on semi-logarithmic coordinate paper. When the relationship between the water head ratio and the time is not linear, it should be checked and retested. The test can be ended when the water head of the test hole drops to 0.3 times the initial water head. The variable water head water injection test is applicable to the silt, cohesive soil or rock mass with a low permeability coefficient below the groundwater level.
The aquifer permeability coefficient is calculated as follows:
K 2 = 0.0523 r c 2 A T 0
Among them, T 0 is the characteristic time of the water injection test ( s ) , the value of t corresponding to H t / H 0 = 0.37 . It can be determined on the ln ( H t / H 0 ) t curve. H t is the water head value when the time is t   ( m ) . H 0 is the initial water head value of the water injection test ( m ) . r c is the inner radius of the well casing ( m ) . A is the shape factor ( m ) .

2.5. Fundamentals of the Conventional Water Pressure Test

According to the Chinese “Specification for the Water Pressure Test in the Borehole of Hydropower Projects” (NB/T 35113-2018) [21], generally, a conventional water pressure test [22,23] is always carried out with five phases ( P 1 P 2 P 3 P 4 ( = P 2 ) P 5 ( = P 1 ) ,   P 1 < P 2 < P 3 ) and three pressure stages,   P 1 , P 2 and P 3 , which are 0.3   MPa , 0.6   MPa and 1   MPa , respectively. The water permeability of the test section is calculated by the pressure value ( P 3 ) and flow rate ( Q 3 ) of the third pressure stage in Equation (25) [24].
q = Q 3 L P 3
Among them,   q is the water permeability of the test section ( Lu   or   L / min / m ); L is the length of the test section ( m ); Q 3 is the flow rate of the third pressure stage ( L / min ); P 3 is the test section pressure of the third pressure stage ( MPa ).

3. Engineering Applications

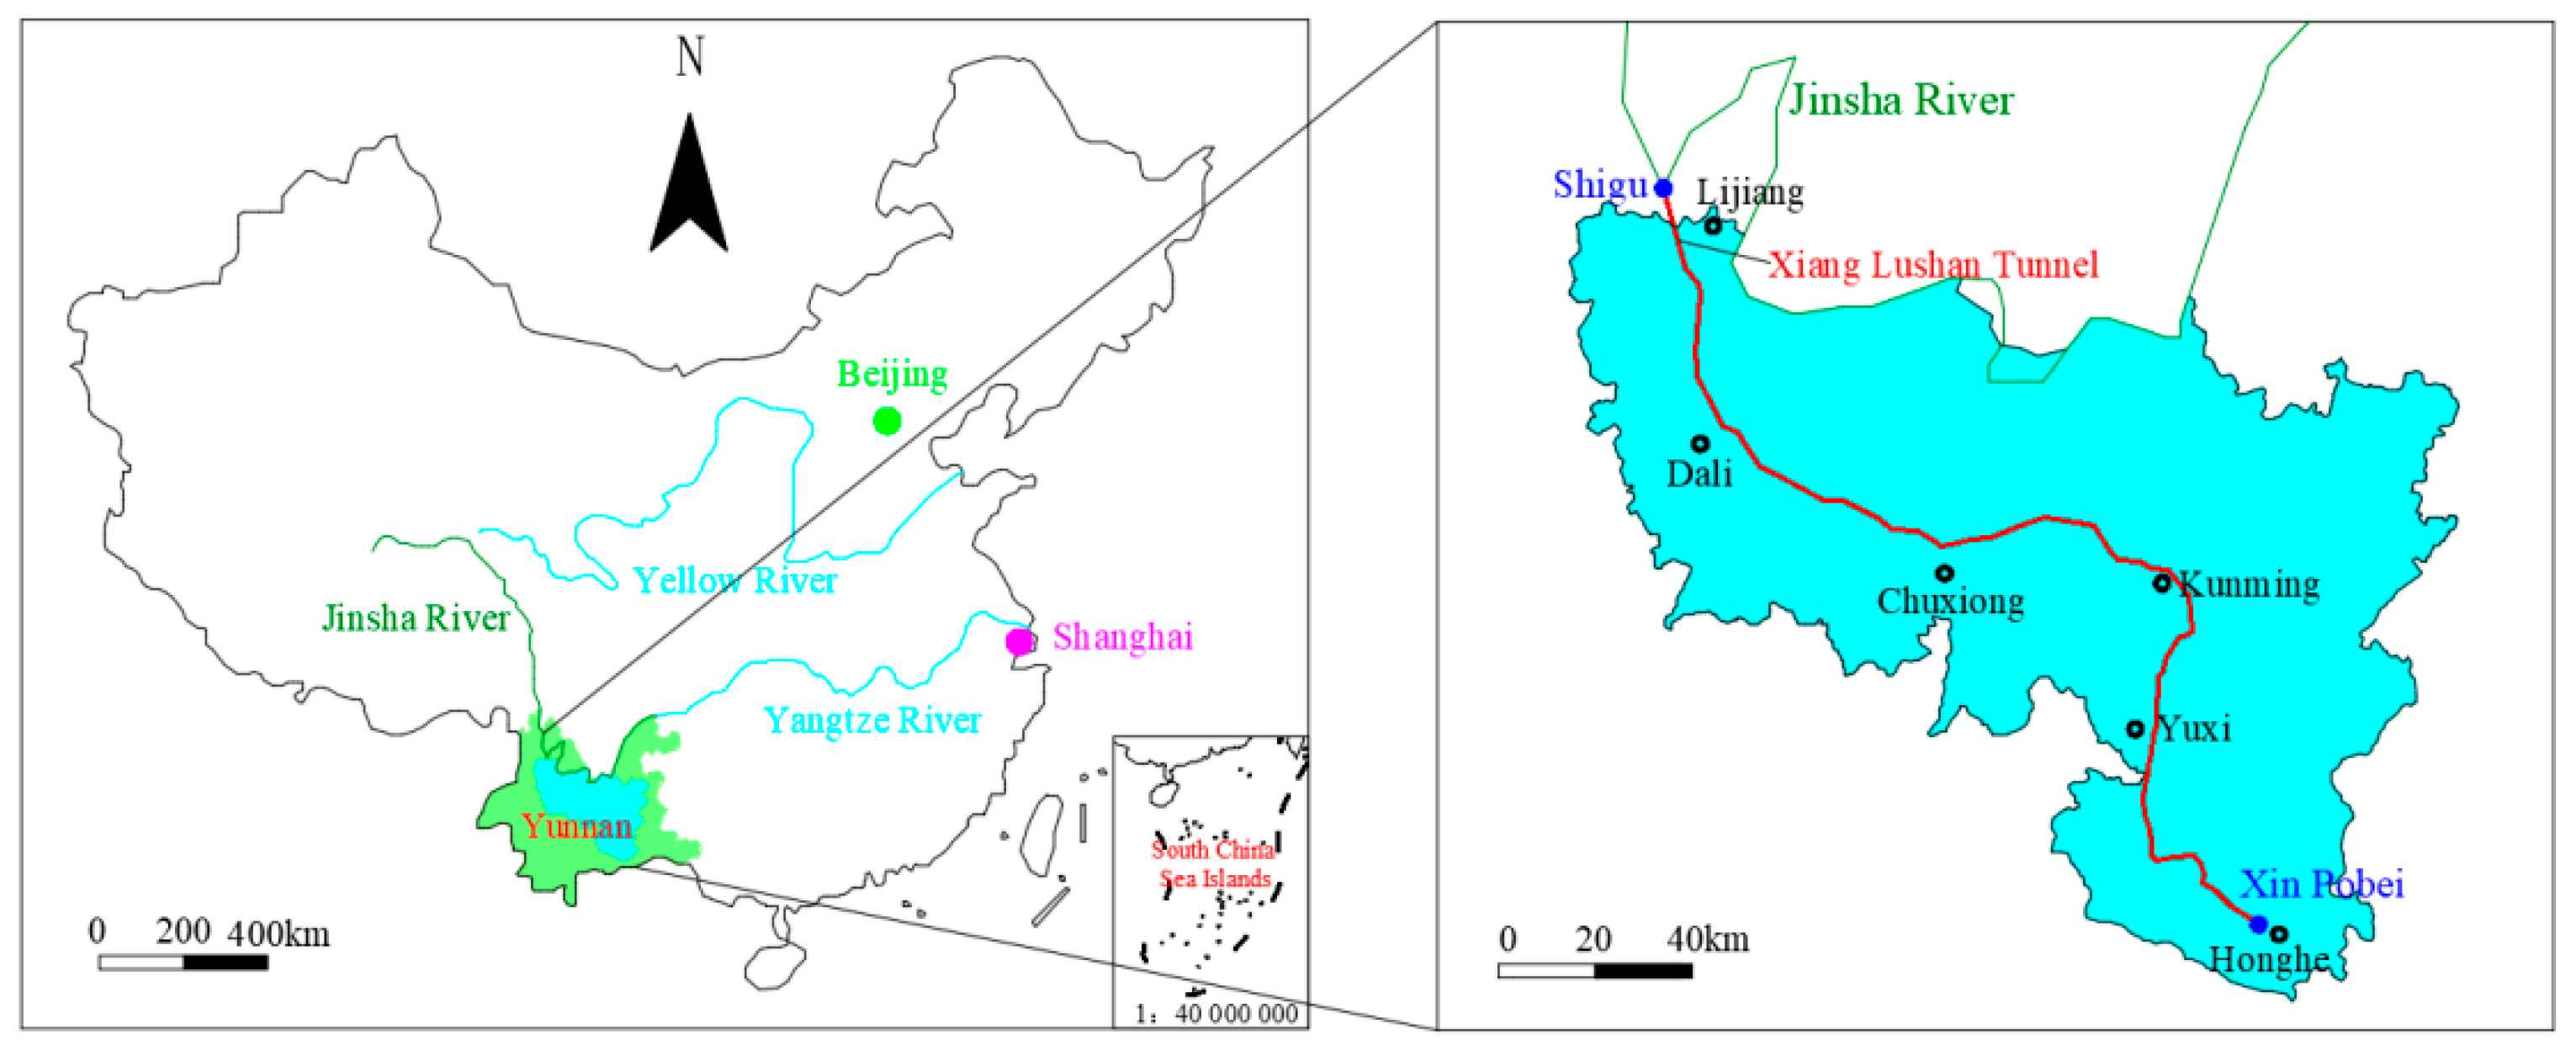
3.1. Central Yunnan Water Diversion Project

3.1.1. Central Yunnan Water Diversion Project Profile

The central Yunnan water diversion project is the largest and most invested water resources allocation project in Southwest China. The total length of the main water diversion channel is about 661 km, and there are 63 main tunnels with a total length of about 610 km. The underground tunnels account for more than 90% of the total length of the total route length [25]. The water diversion route comprises the following sections: Dali I, Dali II, Chuxiong, Kunming, Yuxi and Honghe. The location and water delivery route of the central Yunnan water diversion project are shown in Figure 6. It passes through some active faults of Holocene and Late-Pleistocene, and the impact of these active faults on the diversion route during the construction—especially the groundwater environment—cannot be ignored [26]. Among them, the Xianglushan tunnel is the control project of the central Yunnan water diversion project, located at the head of Dali I. It is the longest deep-buried tunnel of the project, with a total length of about 63 km and a maximum buried depth of 1512 m. Meanwhile, it is a large-slope inclined shaft tunnel with the most difficult construction and complex hydrogeological conditions along the whole line. The tunnel construction has problems such as water inrush and mud inrush, a high external water pressure, crossing active faults, a large buried depth, a difficult construction and groundwater treatment [27,28]. After the completion of the project, water can be diverted from the main stream of Jinsha River, with relatively abundant water, to central Yunnan, which will solve severe water shortages in the central Yunnan region, improve the ecological and environmental conditions of rivers and lakes in the region and effectively promote the sustainable economic and social development of Yunnan [29,30].

3.1.2. Slug Test of the Central Yunnan Water Diversion Project

As the central Yunnan water diversion project is located in a mountainous area with complex geological conditions, there are many difficulties in conducting hydrogeological tests in this area. For example, it is difficult to adopt the traditional pumping test for investigation, and the water pressure test is also limited by the site and equipment. A lot of field test work has been carried out in order to seek the theory and method applicable to the field test of the rock mass hydrogeological parameters in deep test hole. Among them, the borehole CYWD-1 is specially selected to conduct sectional comparative tests. With top-pressure plug water sealing, seven groups of sectional slug tests and variable water head water injection tests are carried out every 5–25 m according to the drilling progress and are numbered CYWD-1-1, CYWD-1-2, CYWD-1-3, CYWD-1-4, CYWD-1 CYWD-1-5, CYWD-1-6 and CYWD-1-7. Among them, the first test section is located in the borehole depth of 130–135 m; the second test section is located in the borehole depth of 135–143 m; the third test section is located in the borehole depth of 143–161 m; the fourth test section is located in the borehole depth of 161–173 m; the fifth test section is located in the borehole depth of 173–182 m; the sixth test section is located in the borehole depth of 182–196 m; and the seventh test section is located in the borehole depth of 182–196 m. The test data are respectively calculated and analyzed with the variable water head injection test and three theoretical methods of the slug test. The slug test data are fitted with the standard curves of three slug test models according to the Kipp model, CBP model and HWS model. The fitted standard curves are shown in Figure 7.
As shown in Figure 7, the standard curve shape of the three models is basically consistent. When the water level recovery rate gets faster, the CBP model will at first be poorly fitted. As the rate is further accelerated, especially when the aquifer damping parameter is less than 1, the HWS model will also appear to be unable to completely fit in the part of the beginning and end. Since the Kipp model has a large variation in the shape of the standard curve, it can match the measured curves at different water level recovery rates to the greatest extent, so the Kipp model has the best fit in the matching process, and the HWS model has the second best fit. The overall shape of the standard curve cluster of the CBP model is relatively gradual, and the fitting effect of the CBP model is relatively poor when the water level recovers rapidly. In general, the fitting effect of all three models can meet the requirements of the calculation.
In addition, an on-site investigation of the boreholes along the Shigu water source area and the Xianglushan tunnel of the central Yunnan water diversion project is adopted. The whole hole section slug test studies are carried out in the boreholes of CYWD-2, CYWD-3, CYWD-4 and CYWD-5. Three slug test models are used for the fitting curve and parameter calculation. The fitted standard curves are shown in Figure 8.
As shown in Figure 8, the standard curve shapes fitted by the three models are basically consistent. Among them, the data of the water level recovery of the boreholes CYWD-2, CYWD-3 and CYWD-4 are relatively stable, and the curve shape is comparatively smooth during the slug test. Meanwhile, the water level recovery time of these three boreholes is relatively long. The qualitative analysis shows that the rock mass permeability around these three boreholes is relatively low. The data of the water level recovery of borehole CYWD-5 have some fluctuations due to some certain disturbances during the test. The speed of the water level recovery of borehole CYWD-5 is fast, and the rock mass permeability around this borehole should be high. According to the analysis of the matching curve, the water level recovery curve of the three boreholes CYWD-2, CYWD-3 and CYWD-4 is basically the same, and all of them fit the standard curve with a damping coefficient of 1 in the Kipp model. The CBP model has a poor fitting to these three groups of data, as the overall shape of the standard curve is relatively gradual, and there is a comparatively large deviation at the beginning and the end. The HWS model can basically fit the three groups of data well. Although the recovery time of the water level of borehole CYWD-5 is relatively short during the slug test, the water level is disturbed to a certain extent, leading to a certain fluctuation effect in the water level recovery data. In general, the Kipp model fits best, the HWS model fits the second best and the CBP model fits relatively poorly.

3.2. Water Diversion Project from the Three Gorges Reservoir to Hanjiang River

3.2.1. Water Diversion Project from the Three Gorges Reservoir to Hanjiang River Profile

The Water Diversion Project from the Three Gorges Reservoir to Hanjiang River was started in Danjiangkou City, Hubei Province on 7 July 2022. The project of the water diversion project from the Three Gorges Reservoir to Hanjiang River is the first project in the follow-up project of the South to North Water Diversion Project. The project takes water from Longtan Creek on the left bank of the Three Gorges Reservoir of the Yangtze River, passes through Yichang, Xiangyang and Danjiangkou of Hubei Province and ends at the Anle River mouth on the right bank of Hanjiang River, which is downstream of Danjiangkou Reservoir. The total length is 194.8 km, and the design diversion flow is 170 m3/s. The location and water delivery route of the project is shown in Figure 9. The whole route of the project adopts tunnels for water conveyance, which is the longest pressurized water conveyance tunnel under construction in China. Approximately 2.2 × 10¹⁰ m3 of tunnel muck would be taken out from the underground [31].
After the implementation of the project, it will connect the South-to-North Water Diversion Project and the Three Gorges project, as well as the Three Gorges Reservoir and the Danjiangkou Reservoir, and, moreover, link the Yangtze River, the Han River Basin and the Beijing–Tianjin–Hebei–Henan area and improve the national important water network layout. In the meantime, it will also supplement water to the middle and downstream areas of the Hanjiang River, which play an important role in improving the water resources allocation capacity of the Hanjiang River Basin and the water ecological environment of the middle and downstream area of the Hanjiang River [32,33]. The project adopts the pressure single tunnel artesian water conveyance, which is the most difficult long-distance water diversion tunnel project under construction in China. The maximum buried depth is 1182 m, and the tunnel with a buried depth of over 600 m accounts for 45%. The route is long, and the buried depth is large. With high mountains, deep valleys, developed faults and folds, the complex terrain and geological conditions, the project faces multiple challenges, such as water inrush, mud inrush, large faults, etc.

3.2.2. Slug Test of the Water Diversion Project from the Three Gorges Reservoir to Hanjiang River

According to the route comparison scheme of the river diversion project and the boreholes situation, the permeability of six boreholes located in the main fault fracture zone was studied, and two sections of fractured strata were selected for testing in each borehole. In total, 12 groups of slug tests were carried out, namely, WDTGH-1-1, WDTGH-1-2, WDTGH-2-1, WDTGH-2-2, WDTGH-3-1, WDTGH-3-2, WDTGH-4-1, WDTGH-4-2, WDTGH-5-1, WDTGH-5-2, WDTGH-6-1 and WDTGH-6-2. Among them, two groups of water pressure tests were carried out synchronously in borehole WDTGH-1 for comparative study. Similarly, according to the theories of the Kipp model, CBP model and HWS model, the slug test data were fitted with the standard curves of the three slug test models. The fitted standard curves are shown in Figure 10.
As shown in Figure 10, the water level recovery rate of these 12 groups of tests is basically gradual, which all fit best with the Kipp model standard curve of the damping coefficient greater than 1. For the CBP model, the smaller the water level recovery rate is, the larger the damping coefficient is, leading to a better fitting effect of the CBP model. When the damping coefficient is less than 3, there will still be poor fitting in some areas, and the damping coefficient is greater than or equal to 3. The fitting effect of the CBP model can basically reach the best. The fitting effect of the HWS model is better than that of the CBP model in general. When the damping coefficient is greater than 1, the HWS model can basically achieve a better fitting effect. The shape difference between different standard curves of the Kipp model is relatively large. The standard curve of different shapes can be selected for fitting according to the actual measured data, so the Kipp model can have more choices in the matching curve, and the fitting effect of the matching curve is also the best. The shape of the standard curve of the CBP model has little difference, and the overall gradient is small. Thus, when conducting the slug test in the high permeability stratum, the measured data can only be matched with the standard curve of the dimensionless water storage coefficient φ = 10 5 with the largest gradient. When the water level recovers quickly, the fitting effect using the CBP model is not ideal. The standard curve shape of the HWS model is between the other two models. When using the HWS model for fitting, there is a large choice, and its fitting effect is also between the other two models. In addition, according to the qualitative analysis of the water level recovery time in Figure 10, it can be qualitatively understood that the rock mass permeability in the tested sections of WDTGH-1-1, WDTGH-4-2 and WDTGH-6-1 with a slow water level recovery is low.

4. Comparative Analysis of Test Results

4.1. Comparative Analysis of the Central Yunnan Water Diversion Project

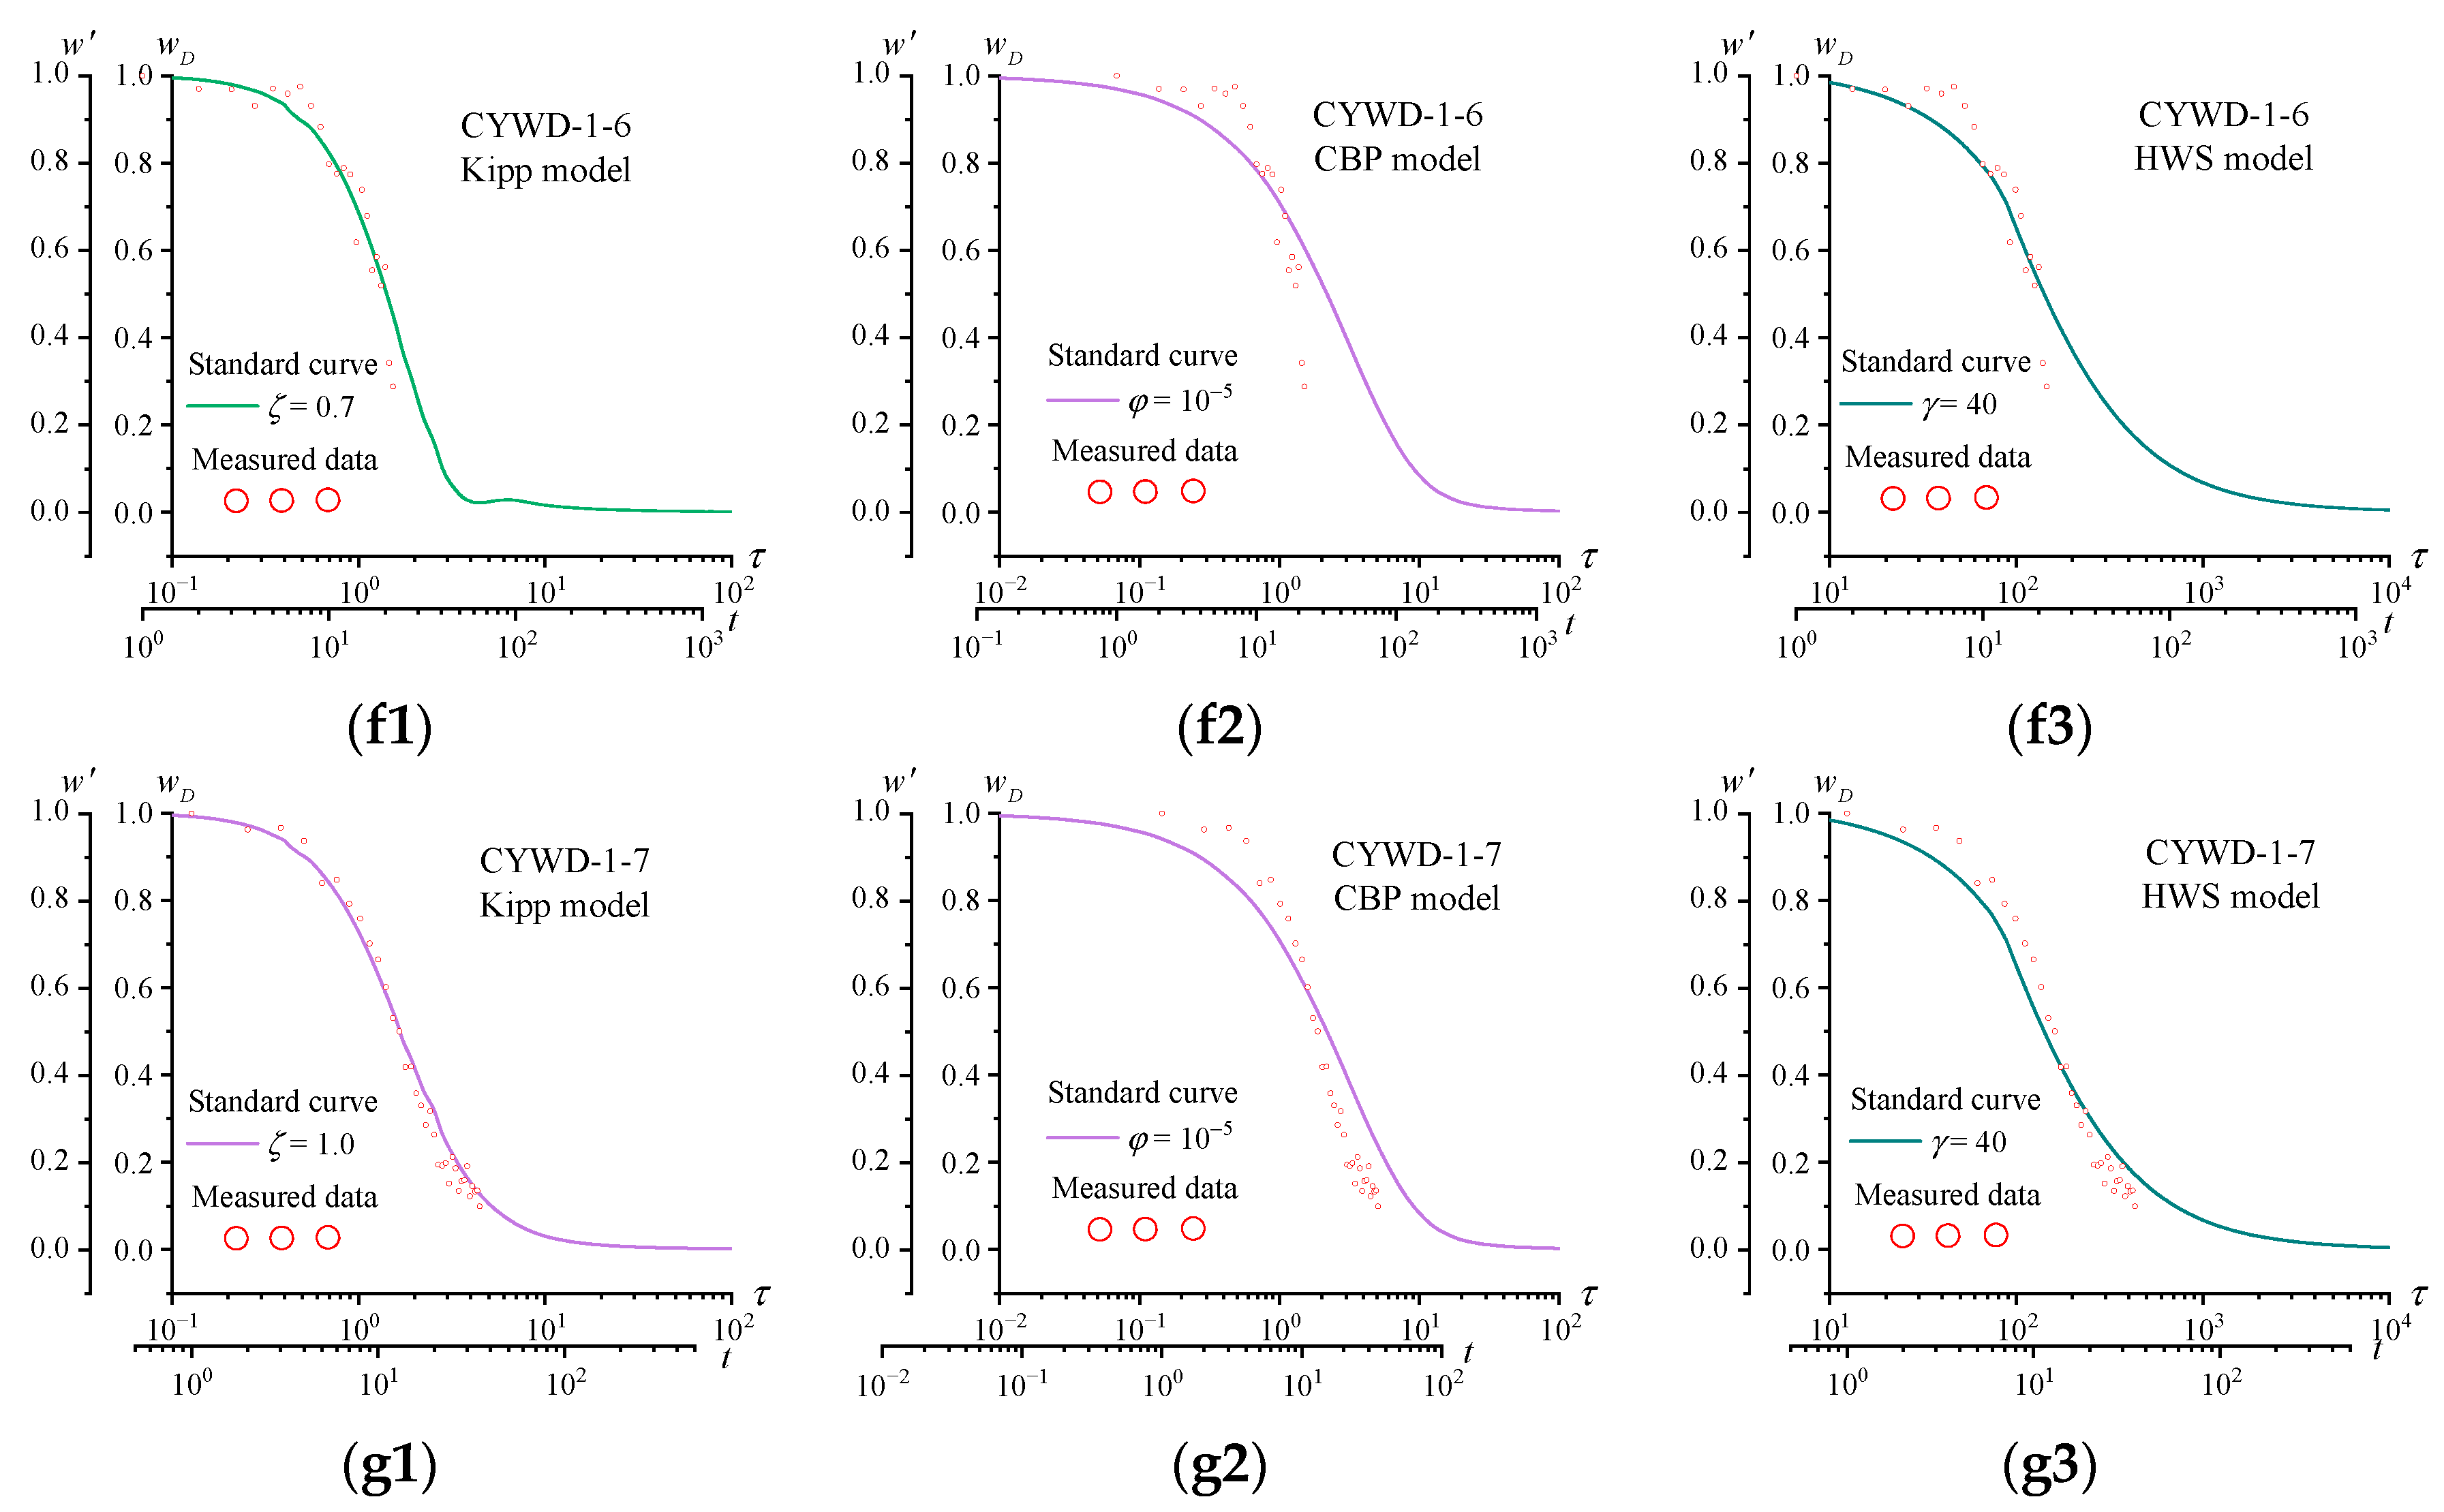
4.1.1. Comparative Analysis of the Sectional Variable Water Head Water Injection Test and Slug Test of Borehole CYWD-1

A sectional comparison test was carried out in the borehole CYWD-1. The sectional variable water head water injection test and three different slug test theories were used for analysis and calculation. The statistics of the calculation results are shown in Table 1, and a comprehensive comparison of the calculation results is shown in Figure 11.
It is shown in Table 1 and Figure 11 that the calculated results using the Kipp model are generally large, those using the CBP model are generally small and the calculated results using the water injection test method fluctuate relatively largely. Through a comprehensive comparison, the results calculated using the HWS model are most consistent with the average value, and the results obtained are more representative. This indicates that the slug test is more stable and reliable compared to the water injection test. In general, the water injection test results of each test section are basically consistent with the corresponding slug test results, and the ratio of the maximum and minimum permeability coefficients calculated by different methods is within 2.5 times. Therefore, the calculated results of the sectional water injection test and slug test carried out in the field are reliable, and it also shows that the HWS model derived by considering the finite thickness well-skin effect is also very practical and can be popularized when the well-skin factor is 1.

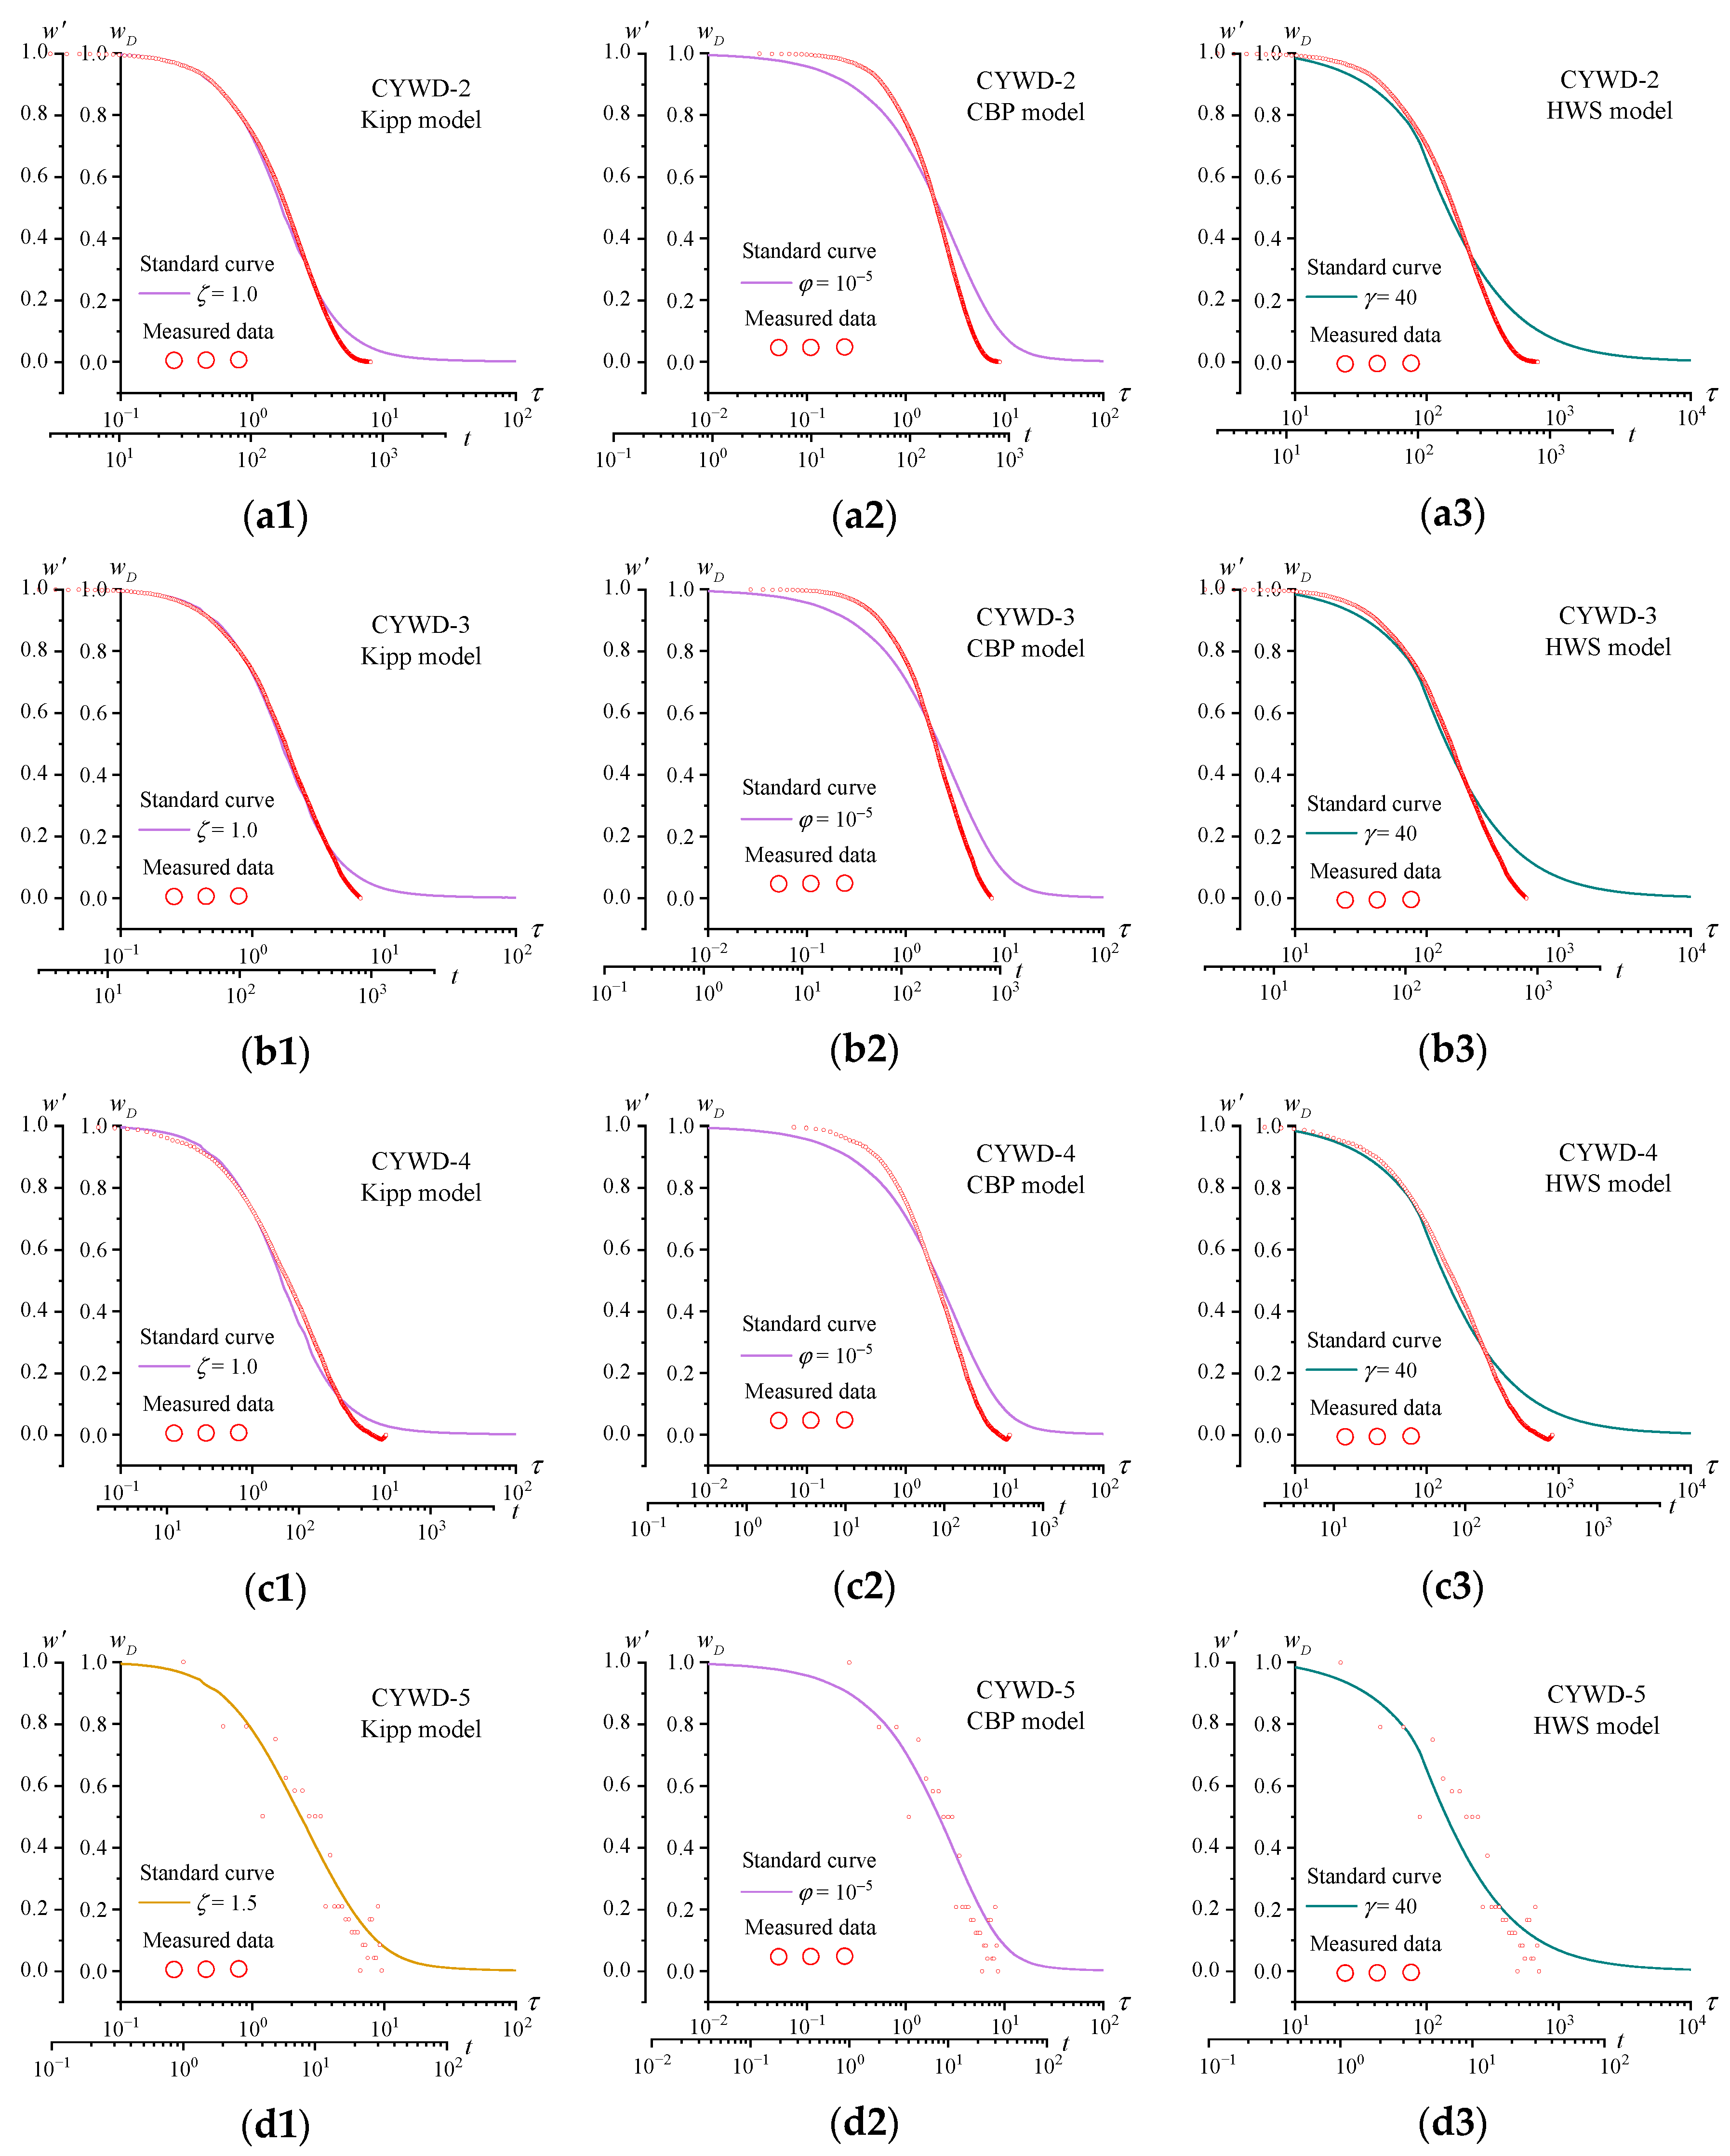
4.1.2. Comparative Analysis of the Whole Hole Slug Test of the Central Yunnan Water Diversion Project

The whole hole slug test is carried out in the boreholes CYWD-2, CYWD-3, CYWD-4 and CYWD-5. Three different slug test models are used for analysis and calculation. The statistics of the calculation results are shown in Table 2, and a comprehensive comparison of the calculation results is shown in Figure 12.
According to Table 2 and Figure 12, during the full borehole test, the calculated results of the Kipp model are still the largest among the three models. The results calculated by the CBP model and HWS model are close to and consistent with the average value, and those of the HWS model are relatively smaller. Nevertheless, the calculated results of the three models are basically consistent, and the ratio of the maximum and minimum permeability coefficients calculated by different methods is about 1.5 times. Meanwhile, combined with the qualitative analysis results in Figure 8, the quantitative calculation results in Table 2 also show that the permeability of the rock mass in the boreholes CYWD-2, CYWD-3 and CYWD-4 is low, and the permeability of the rock mass in borehole CYWD-5 is high. The qualitative and quantitative analysis results are completely consistent, which shows that the slug test has a good field operation stability, and the results calculated by the three models are reliable.

4.2. Comparative Analysis of the Water Diversion Project from the Three Gorges Reservoir to Hanjiang River

4.2.1. Comparative Analysis of the Sectional Water Pressure Test and Slug Test of Borehole WDTGH-1

The sectional comparison test is carried out in borehole WDTGH-1. The analysis and calculations were carried out by using the water pressure test and three different slug test models. The statistics of the calculation results are shown in Table 3. According to the relationship between water permeability and the permeability coefficient in the Chinese “Code for engineering geological investigation of water resources and hydropower” (GB50487-2008) [34], the comprehensive comparison of the calculation results is shown in Figure 13.
It can be seen from Table 3 and Figure 13 that, during the water pressure test and slug test in borehole WDTGH-1, the Kipp model still has a large calculated result among the three slug test models, and the HWS model has a small one at the 91–101 m test section. The calculated results of the CBP model and the HWS model are close at the 217–227 m test section, and the CBP model is relatively small. The calculated results of the three models are basically consistent. The ratio of the maximum and the minimum of the permeability coefficient calculated by the different methods is about two times, and the statistical relationship with the results of the water pressure test is also within the confidence intervals. This shows that both the water pressure test and slug test can obtain the rock mass permeability in the fault fracture zone, but the equipment and test requirements for the water pressure test are higher, and high-pressure water easily causes borehole collapse in the test section of the fractured rock, so only the slug test is carried out in the other boreholes.

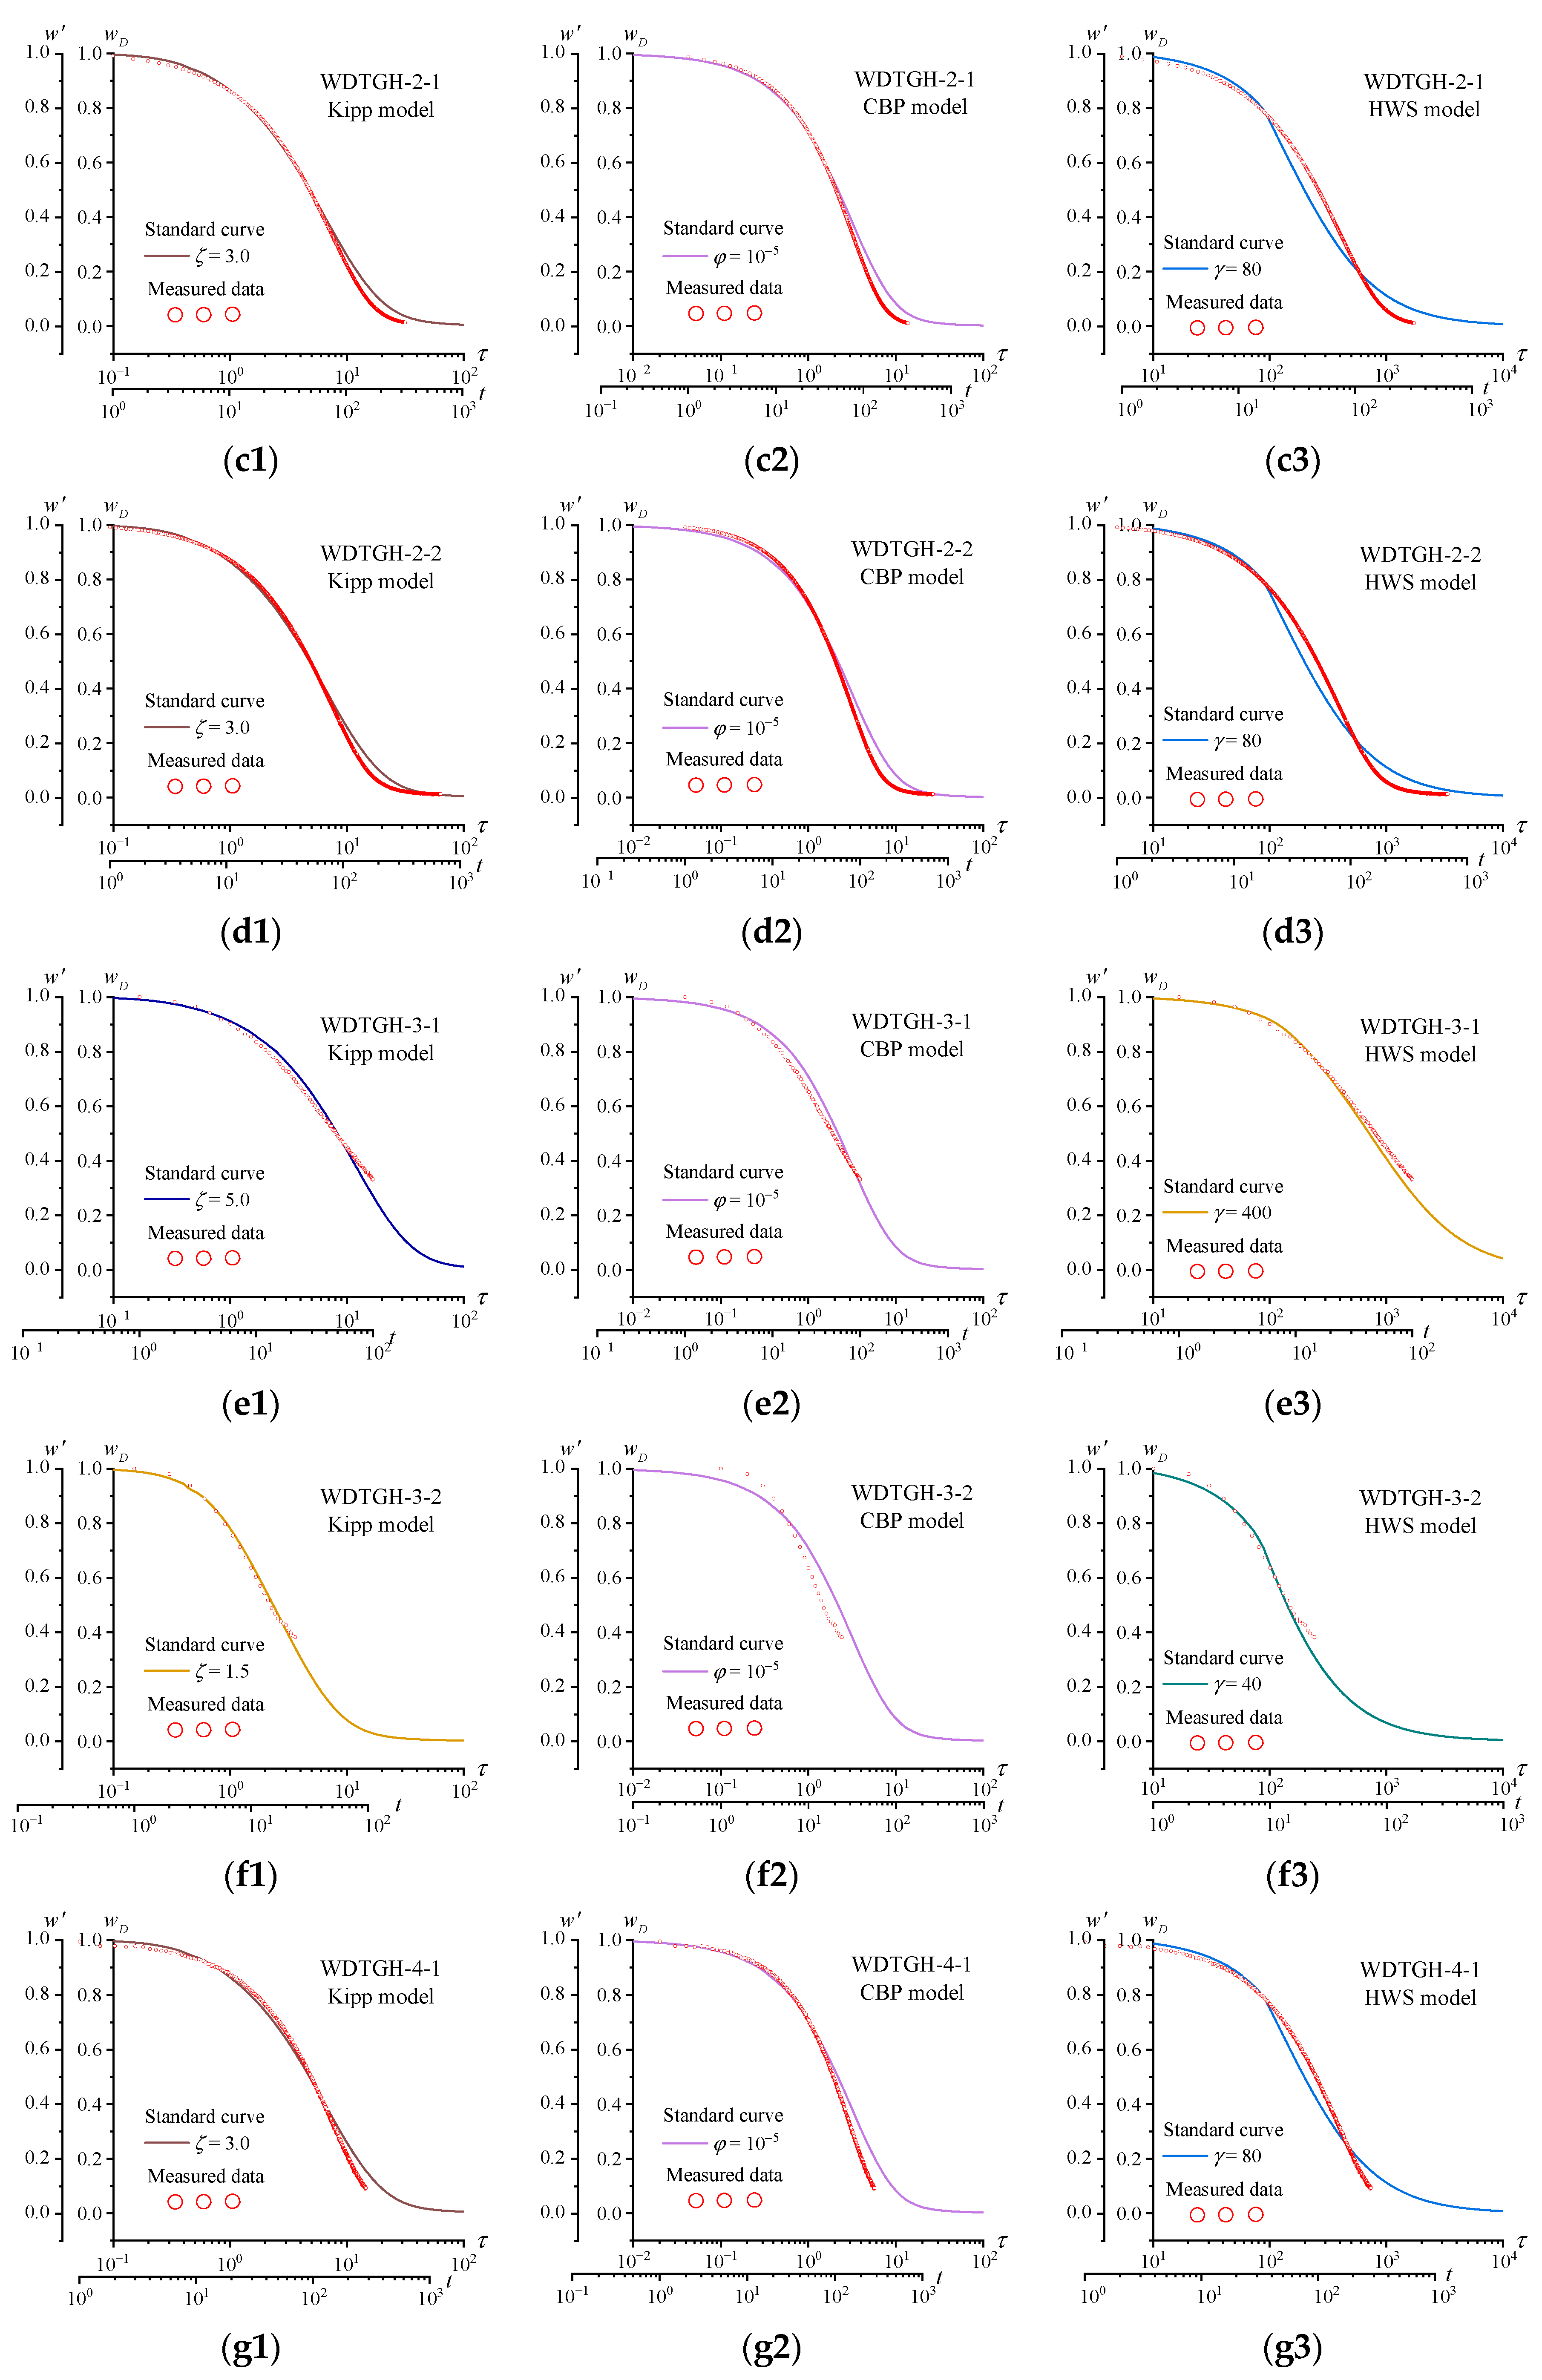
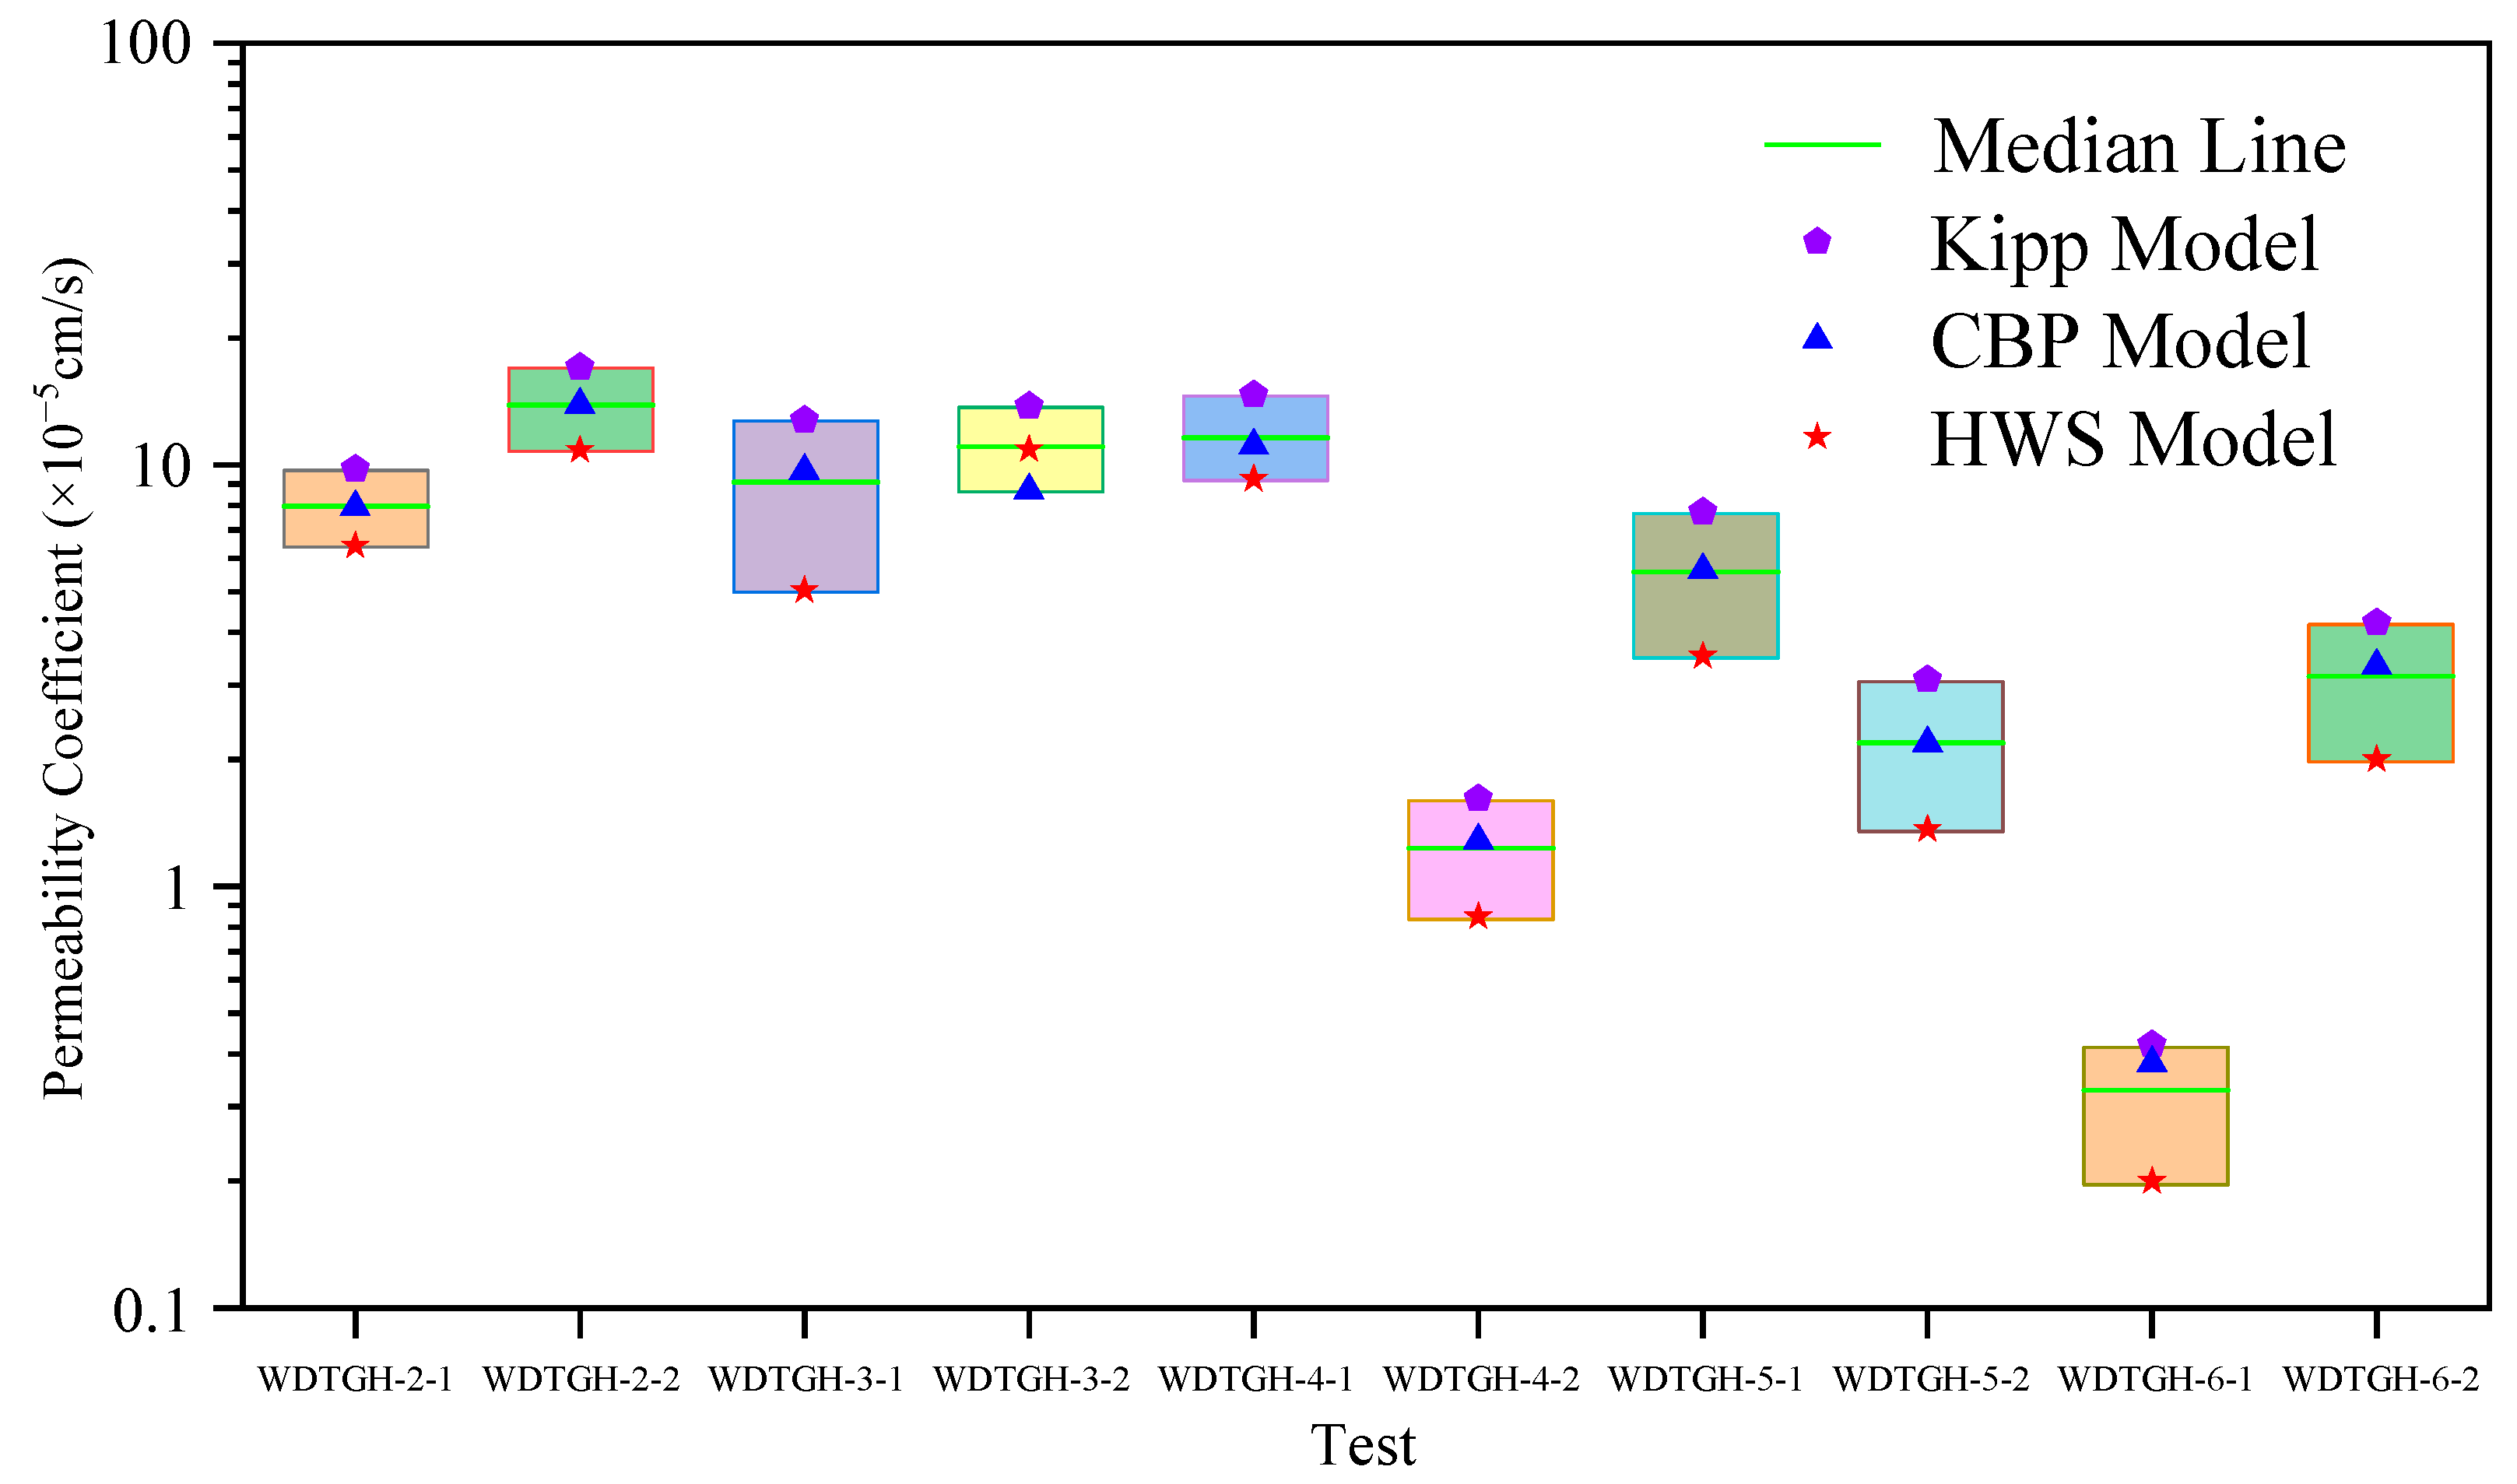
4.2.2. Comparison and Analysis of the Sectional Slug Test of the Water Diversion Project from the Three Gorges Reservoir to Hanjiang River

Sectional slug tests were carried out in the boreholes WDTGH-2, WDTGH-3, WDTGH-4, WDTGH-5 and WDTGH-6. Two sections of broken zone strata were selected from each borehole for testing. Three different slug tests models were used for the analysis and calculation in each test. The statistics of the calculation results are shown in Table 4, and a comprehensive comparison of the calculation results is shown in Figure 14.
It can be seen in Table 4 and Figure 14 that when the sectional slug test is carried out in five boreholes, the calculation results of the Kipp model are still larger, those of the CBP model are in the middle and those of the HWS model are the smallest. Therefore, the calculation results of the CBP model are closest to the average value. However, when the CBP model is used for parameter calculation, due to the similarity of the standard curve shape, it is of great uncertainty to determine the relevant parameters. The principle of the CBP model can be further improved. Hence, this fitting method based on the CBP model may lead to the inaccurate estimation of the aquifer permeability coefficient. The calculated results based on the three slug test models are relatively close, and the ratio between the maximum and the minimum of the permeability coefficient calculated by different slug test models is about 2.5 times. Similarly, combined with the qualitative analysis results in Figure 10, the quantitative calculation results in Table 3 and Table 4 also show that the rock mass permeability in the test sections WDTGH-1-1, WDTGH-4-2 and WDTGH-6-1 is low, and the qualitative and quantitative analysis results are completely consistent, which further indicates the stability, reliability and accuracy of the slug test in determining the rock mass permeability coefficient.

5. Conclusions

  • The water injection test, water pressure test and slug test can be applied to obtain the rock mass permeability coefficients. The permeability coefficients of the rock mass calculated by the three test methods are basically consistent. However, the equipment and operation of the water pressure test are complicated. It is easy to cause the borehole to collapse when encountering broken strata, such as fault zones. The applicability of this water pressure test is limited. In addition, the water pressure test and water injection test generally need a large amount of water injection when carrying out tests; therefore, it is not convenient to put into practice in some test sites where transportation is inconvenient and the water source is distant. Through comprehensive comparison, when determining the rock mass permeability coefficient in large-scale water diversion projects and long-distance deep buried tunnels, the slug test can meet the test requirements to the greatest extent, with a simple operation and strong applicability.
  • Three theoretical models of the slug test are used to synchronously analyze and compare the data of the slug test. Among them, the calculated results of the Kipp model are generally large, and those of the CBP model and the HWS model are relatively close. However, the principle of the CBP model can be further improved. The difference of the calculated results of the three models is about two times, and all of them can satisfy the requirements of determining the permeability of the rock mass. Meanwhile, it is verified that the Kipp model, the CBP model and the novel proposed HWS model have good applicability in the parameter calculation of the deep borehole slug test.
  • The standard curves of the Kipp model are based on the standard solution form of the oscillatory equation, and the standard curves cover the situation from overdamping to underdamping. Therefore, the Kipp model has more choices in fitting curves and the best effect of fitting curves among the three models. The CBP model has a single standard curve cluster shape and a relatively gradual curve. When the slug test is conducted in high-permeability fractured rock mass, the measured data can only basically match the standard curves with the largest gradient, where the dimensionless water storage coefficient φ is equal to 10 − 5. When the aquifer damping coefficient is less than 1, the fitting effect of the CBP model will be relatively poor among the three models. The fitting effect of the HWS model is between the other two models. Through the research, it can be found that the calculated results of the Kipp model are larger, and the calculated results of the HWS model are smaller, so we should pay attention to the application scope and characteristics of different models. Therefore, when selecting different slug test models for determining the permeability coefficients, the permeability coefficients should be reasonably selected in combination with the drilling core data to avoid the errors of different slug test models.
  • The novel proposed HWS model is a theoretical model of a slug test considering the influence of the finite thickness well-skin layer. In contrast, the other two models do not consider the influence of well-skin. Test holes are selected in the bedrock area with good integrity, and the disturbance around the test holes is small. Therefore, the standard curves with a well-skin factor of 1 are selected in the calculation. In the process of drilling, if the test hole is excessively washed or the wall protection material is used, the Kipp model and the CBP model will produce relatively large errors in calculation, so the HWS model is very practical and can be better popularized.

Author Contributions

Conceptualization, Y.Z.; methodology, Y.Z. and X.D.; validation, X.D., H.W., Y.W. and R.X.; formal analysis, Y.Z. and X.D.; resources, Y.Z.; data curation, X.D., H.W., Y.W. and R.X.; writing—original draft preparation, Y.Z.; writing—review and editing, X.D., H.W. and Y.W.; visualization, X.D. and H.W.; supervision, Y.Z., J.W. and Y.H.; project administration, Y.Z., J.W. and Y.H.; funding acquisition, Y.Z. and J.W. All authors have read and agreed to the published version of the manuscript.

Funding

This research was funded by the National Key Research and Development Program of China, grant number 2019YFC1510802; the Fundamental Research Funds for the Central Universities, grant number B220205006; and the scientific research project of water conveyance and the irrigation project of the Xixiayuan water control project in Henan Province, China, grant number XXYSS/GQ-KYXM-02.

Institutional Review Board Statement

Not applicable.

Informed Consent Statement

Not applicable.

Data Availability Statement

Not applicable.

Acknowledgments

The authors would like to thank the School of Earth Sciences and Engineering at Hohai University for the partial support of the graduate student in this project.

Conflicts of Interest

The authors declare no conflict of interest.

References

  1. Zhou, Z.F.; Zhuang, C.; Dai, Y.F.; Dou, Z. Determining Anisotropic Hydraulic Conductivity in Fractured Rocks Based on Single-borehole Slug Tests. Chin. J. Rock Mech. Eng. 2015, 34, 271–278. [Google Scholar] [CrossRef]
  2. Hvorslev, M.J. Time Lag and Soil Permeability in Ground Water Observations, Waterways Experiment Station, Corps of Engineers. US Army Bull. 1951, 36, 49. [Google Scholar]
  3. Zemansky, G.M.; McElwee, C.D. High-resolution slug testing. Ground Water 2005, 43, 222–230. [Google Scholar] [CrossRef] [PubMed]
  4. Cooper, H.H., Jr.; Bredehoeft, J.D.; Papadopulos, I.S. Response of a finite-diameter well to an instantaneous charge of water. Water Resour. Res. 1967, 3, 263–269. [Google Scholar] [CrossRef]
  5. Kipp, K.L., Jr. Type Curve Analysis of Inertial Effects in the Response of a Well to a Slug Test. Water Resour. Res. 1985, 21, 1397–1408. [Google Scholar] [CrossRef]
  6. Sageev, A. Slug Test Analysis. Water Resour. Res. 1986, 22, 1323–1333. [Google Scholar] [CrossRef]
  7. Zenner, M.A. Analysis of slug tests in bypassed wells. J. Hydrol. 2002, 263, 72–91. [Google Scholar] [CrossRef]
  8. Malama, B.; Kuhlman, K.L.; Brauchler, R.; Bayer, P. Modeling cross-hole slug tests in an unconfined aquifer. J. Hydrol. 2016, 540, 784–796. [Google Scholar] [CrossRef] [Green Version]
  9. Sahin, A.U. Simple methods for quick determination of aquifer parameters using slug tests. Hydrol. Res. 2017, 48, 326–339. [Google Scholar] [CrossRef]
  10. Quinn, P.M.; Klammler, H.; Cherry, J.A.; Parker, B.L. Insights from Unsteady Flow Analysis of Underdamped Slug Tests in Fractured Rock. Water Resour. Res. 2018, 54, 5825–5840. [Google Scholar] [CrossRef]
  11. Hommersen, J.D.; Quinn, P.M.; Parker, B.L. Evaluating Friction and Inertial Losses From Slug Tests Conducted in a Multilevel System. Water Resour. Res. 2021, 57, e2021WR029794. [Google Scholar] [CrossRef]
  12. Bouchaala, F.; Ali, M.; Matsushima, J. Attenuation study of a clay-rich dense zone in fractured carbonate reservoirs. Geophysics 2019, 84, B205–B216. [Google Scholar] [CrossRef]
  13. Bouchaala, F.; Ali, M.; Matsushima, J.; Bouzidi, Y.; Takam Takougang, E.; Mohamed, A.; Sultan, A. Azimuthal investigation of compressional seismic wave attenuation in fractured reservoir. Geophysics 2019, 84, B437–B446. [Google Scholar] [CrossRef]
  14. Hyder, Z.; Butler, J.J., Jr. Slug Tests in Unconfined Formations: An Assessment of the Bouwer and Rice Technique. Groundwater 1995, 33, 16–22. [Google Scholar] [CrossRef]
  15. Yeh, H.D.; Chen, Y.J.; Yang, S.Y. Semi-analytical solution for a slug test in partially penetrating wells including the effect of finite-thickness skin. Hydrol. Processes 2008, 22, 3741–3748. [Google Scholar] [CrossRef]
  16. Liang, X.Y.; Zhan, H.B.; Zhang, Y.K.; Liu, J. Underdamped slug tests with unsaturated-saturated flows by considering effects of wellbore skins. Hydrol. Processes 2018, 32, 968–980. [Google Scholar] [CrossRef]
  17. Morozov, P.E. Assessing the Hydraulic Conductivity Anisotropy and Skin-Effect Based on Data of Slug Tests in Partially Penetrating Wells. Water Resour. 2020, 47, 430–437. [Google Scholar] [CrossRef]
  18. He, G.Y.; Li, L. An Application of AWG Method of Numerical Inversion of Laplace Transform for Flow in a Fluid Finite-conductivity Vertical Fractures. Pet. Explor. Dev. 1995, 22, 47–50. [Google Scholar]
  19. Stehfest, H. Numerical Inversion of Laplace Transforms. Commun. ACM 1970, 13, 624. [Google Scholar] [CrossRef]
  20. SL 345-2007; Code of Water Injection Test for Water Resources and Hydropower Engineering. The Ministry of Water Resources of the People’s Republic of China: Beijing, China, 2008.
  21. NB/T 35113-2018; Specification for Water Pressure Test in Borehole of Hydropower Projects. National Energy Administration: Beijing, China, 2018.
  22. Barani, H.R.; Lashkaripour, G.; Ghafoori, M. Predictive permeability model of faults in crystalline rocks; verification by joint hydraulic factor (JH) obtained from water pressure tests. J. Earth Syst. Sci. 2014, 123, 1325–1334. [Google Scholar] [CrossRef] [Green Version]
  23. Li, P.; Lu, W.X.; Long, Y.Q.; Yang, Z.P.; Li, J. Seepage analysis in a fractured rock mass: The upper reservoir of Pushihe pumped-storage power station in China. Eng. Geol. 2008, 97, 53–62. [Google Scholar] [CrossRef]
  24. Zhao, Y.R.; Wei, Y.F.; Dong, X.S.; Rong, R.; Wang, J.G.; Wang, H.N. The Application and Analysis of Slug Test on Determining the Permeability Parameters of Fractured Rock Mass. Appl. Sci. Basel 2022, 12, 7569. [Google Scholar] [CrossRef]
  25. Zhang, X.; Shen, Z.; Yang, Z. Study on Control Survey of Super-long Tunnels for Water Diversion Project in Central Yunnan. IOP Conf. Ser. Earth Environ. Sci. 2019, 376, 012028. [Google Scholar] [CrossRef] [Green Version]
  26. Fu, P.; Yin, J.; Ding, X.; Liu, Y. Deformation-strain field characteristics and fault activities in central Yunnan water diversion project area. IOP Conf. Ser. Earth Environ. Sci. 2020, 570, 062029. [Google Scholar] [CrossRef]
  27. Jiang, Z.X.; Pan, D.J.; Zhang, S.H.; Yin, Z.Q.; Zhou, J.J. Advanced Grouting Model and Influencing Factors Analysis of Tunnels with High Stress and Broken Surrounding Rock. Water 2022, 14, 661. [Google Scholar] [CrossRef]
  28. Ma, Y.L.N.; Sheng, Q.; Zhang, G.M.; Cui, Z. A 3D Discrete-Continuum Coupling Approach for Investigating the Deformation and Failure Mechanism of Tunnels across an Active Fault: A Case Study of Xianglushan Tunnel. Appl. Sci. Basel 2019, 9, 2318. [Google Scholar] [CrossRef] [Green Version]
  29. Zhao, Y. The Most Representative National Key Water Conservancy Project under Construction: Central Yunnan Water Diversion Project. Tunn. Constr. 2019, 39, 511–522. [Google Scholar]
  30. Xiang, C.G.; Huang, W.; Zhou, H.D.; Xue, L.Q.; Wang, Z.W.; Ma, W. Flow reduction effect on fish habitat below water diversion—A case study of the Central Yunnan Water Diversion Project. Ecol. Eng. 2022, 175, 106499. [Google Scholar] [CrossRef]
  31. Hu, Y.; Yang, D.; Li, S.; Li, H.; Zhang, S.; Hou, Y.; Hu, W.; Zheng, H. Preliminary study on preparation of unfired bricks using filter cake from tunnel muck. J. Build. Eng. 2022, 60, 105175. [Google Scholar] [CrossRef]
  32. Chen, J. Regulation of water resources and operation of reservoir group in the Yangtze River basin. J. Hydraul. Eng. 2018, 49, 2–8. [Google Scholar] [CrossRef]
  33. Huang, H.Y.; Zhang, N.; Wan, H.; Li, B.; Zeng, S.D. Preliminary analysis on water diversion quantity of Water Diversion Project from Three Gorges Reservoir to Hanjiang River. Yangtze River 2018, 49, 15–19. [Google Scholar] [CrossRef]
  34. GB50487-2008; Code for Engineering Geological Investigation of Water Resources and Hydropower. PRC Ministry of Housing and Urban-Rural Development: Beijing, China, 2008.
Figure 1. Slug test standard curves of the Kipp model.
Applsci 12 10235 g001
Figure 2. Slug test standard curves of the CBP model.
Applsci 12 10235 g002
Figure 3. Schematic diagram of the slug test model considering the well-skin effect.
Applsci 12 10235 g003
Figure 4. HWS model standard curves without the well-skin effect.
Applsci 12 10235 g004
Figure 5. HWS model standard curves under the well-skin effect.
Applsci 12 10235 g005
Figure 6. The location and water delivery route of the central Yunnan water diversion project.
Applsci 12 10235 g006
Figure 7. Fitting curve of the CYWD-1 slug test with a different model. (a1) CYWD-1-1, Kipp model; (a2) CYWD-1-1, CBP model; (a3) CYWD-1-1, HWS model; (b1) CYWD-1-2, Kipp model; (b2) CYWD-1-2, CBP model; (b3) CYWD-1-2, HWS model; (c1) CYWD-1-3, Kipp model; (c2) CYWD-1-3, CBP model; (c3) CYWD-1-3, HWS model; (d1) CYWD-1-4, Kipp model; (d2) CYWD-1-4, CBP model; (d3) CYWD-1-4, HWS model; (e1) CYWD-1-5, Kipp model; (e2) CYWD-1-5, CBP model; (e3) CYWD-1-5, HWS model; (f1) CYWD-1-6, Kipp model; (f2) CYWD-1-6, CBP model; (f3) CYWD-1-6, HWS model; (g1) CYWD-1-7, Kipp model; (g2) CYWD-1-7, CBP model; (g3) CYWD-1-7, HWS model.
Applsci 12 10235 g007aApplsci 12 10235 g007b
Figure 8. Fitting curve of the CYWD-2–CYWD-5 slug tests with different models. (a1) CYWD-2, Kipp model; (a2) CYWD-2, CBP model; (a3) CYWD-2, HWS model; (b1) CYWD-3, Kipp model; (b2) CYWD-3, CBP model; (b3) CYWD-3, HWS model; (c1) CYWD-4, Kipp model; (c2) CYWD-4, CBP model; (c3) CYWD-4, HWS model; (d1) CYWD-5, Kipp model; (d2) CYWD-5, CBP model; (d3) CYWD-5, HWS model.
Applsci 12 10235 g008
Figure 9. The location and water delivery route of the Water Diversion Project from the Three Gorges Reservoir to Hanjiang River.
Applsci 12 10235 g009
Figure 10. Fitting curve of the WDTGH-1–WDTGH-6 slug tests with different models. (a1) WDTGH-1-1, Kipp model; (a2) WDTGH-1-1, CBP model; (a3) WDTGH-1-1, HWS model; (b1) WDTGH-1-2, Kipp model; (b2) WDTGH-1-2, CBP model; (b3) WDTGH-1-2, HWS model; (c1) WDTGH-2-1, Kipp model; (c2) WDTGH-2-1, CBP model; (c3) WDTGH-2-1, HWS model; (d1) WDTGH-2-2, Kipp model; (d2) WDTGH-2-2, CBP model; (d3) WDTGH-2-2, HWS model; (e1) WDTGH-3-1, Kipp model; (e2) WDTGH-3-1, CBP model; (e3) WDTGH-3-1, HWS model; (f1) WDTGH-3-2, Kipp model; (f2) WDTGH-3-2, CBP model; (f3) WDTGH-3-2, HWS model; (g1) WDTGH-4-1, Kipp model; (g2) WDTGH-4-1, CBP model; (g3) WDTGH-4-1, HWS model; (h1) WDTGH-4-2, Kipp model; (h2) WDTGH-4-2, CBP model; (h3) WDTGH-4-2, HWS model; (i1) WDTGH-5-1, Kipp model; (i2) WDTGH-5-1, CBP model; (i3) WDTGH-5-1, HWS model; (j1) WDTGH-5-2 Kipp model; (j2) WDTGH-5-2, CBP model; (j3) WDTGH-5-2, HWS model; (k1) WDTGH-6-1, Kipp model; (k2) WDTGH-6-1, CBP model; (k3) WDTGH-6-1, HWS model; (l1) WDTGH-6-2, Kipp model; (l2) WDTGH-6-2, CBP model; (l3) WDTGH-6-2, HWS model.
Applsci 12 10235 g010aApplsci 12 10235 g010bApplsci 12 10235 g010c
Figure 11. Comparison of the calculation results water injection test and different slug test theory models in borehole CYWD-1.
Applsci 12 10235 g011
Figure 12. Comparison of the calculation results of different slug test models in boreholes CYWD-2–CYWD-5.
Applsci 12 10235 g012
Figure 13. Comparison of calculation results of the water pressure test and slug test in borehole WDTGH-1.
Applsci 12 10235 g013
Figure 14. Comparison of the calculation results of the sectional slug test in the boreholes WDTGH-2–WDTGH-6.
Applsci 12 10235 g014
Table 1. Statistics of the calculation results of the sectional variable water head water injection test and slug test in borehole CYWD-1.
Test No.Test Section Position (m)Test Section Length (m)Permeability Coefficient of Water Injection Test (cm/s)Permeability Coefficient of Slug Test (cm/s)The Mean of Permeability Coefficient (cm/s)
Kipp ModelCBP ModelHWS Model
CYWD-1-1130–13551.10 × 10−41.98 × 10−41.25 × 10−41.56 × 10−41.47 × 10−4
CYWD-1-2135–14383.95 × 10−44.95 × 10−43.13 × 10−43.52 × 10−43.88 × 10−4
CYWD-1-3143–161182.60 × 10−32.93 × 10−31.39 × 10−31.63 × 10−32.14 × 10−3
CYWD-1-4161–173124.18 × 10−41.32 × 10−35.79 × 10−45.70 × 10−47.21 × 10−4
CYWD-1-5173–18291.79 × 10−32.75 × 10−32.31 × 10−32.31 × 10−32.29 × 10−3
CYWD-1-6182–196144.50 × 10−47.07 × 10−43.13 × 10−43.72 × 10−44.60 × 10−4
CYWD-1-7196–220244.55 × 10−45.30 × 10−43.72 × 10−44.07 × 10−44.41 × 10−4
Table 2. Statistics of the calculation results of the slug test in boreholes CYWD-2–CYWD-5.
Test No.Test Section Length (m)Permeability Coefficient of Slug Test (cm/s)The Mean of Permeability Coefficient (cm/s)
Kipp ModelCBP ModelHWS Model
CYWD-2694.73 × 10−53.32 × 10−53.01 × 10−53.69 × 10⁻⁵
CYWD-3403.96.49 × 10−64.61 × 10−64.42 × 10−65.18 × 10⁻⁶
CYWD-4133.75.42 × 10−53.81 × 10−53.68 × 10−54.30 × 10⁻⁵
CYWD-5136.64.80 × 10−44.04 × 10−43.43 × 10−44.09 × 10⁻⁴
Table 3. Statistics of the calculation results of the water pressure test and slug test in borehole WDTGH-1.
Test No.Test Section Position (m)Test Section Length (m)Water Permeability of Water Pressure Test (Lu)Permeability Coefficient of Slug Test (cm/s)The Mean of Permeability Coefficient (cm/s)
Kipp ModelCBP ModelHWS Model
WDTGH-1-191–101101.801.81 × 10−51.53 × 10−57.63 × 10−61.37 × 10⁻⁵
WDTGH-1-2217–227103.591.29 × 10−49.16 × 10−59.54 × 10−51.05 × 10⁻⁴
Table 4. Statistics of the calculation results of the slug test in the boreholes WDTGH-2–WDTGH-6.
Test No.Test Section Position (m)Test Section Length (m)Permeability Coefficient of Slug Test (cm/s)The Mean of Permeability Coefficient (cm/s)
Kipp ModelCBP ModelHWS Model
WDTGH-2-150–95459.77 × 10−57.94 × 10−56.43 × 10−58.05 × 10⁻⁵
WDTGH-2-271–95241.70 × 10−41.39 × 10−41.09 × 10−41.39 × 10⁻⁴
WDTGH-3-130–3551.28 × 10−49.68 × 10−55.04 × 10−59.16 × 10⁻⁵
WDTGH-3-249.5–63.413.91.38 × 10−48.71 × 10−51.09 × 10−41.11 × 10⁻⁴
WDTGH-4-158.4–63.34.91.47 × 10−41.11 × 10−49.26 × 10−51.17 × 10⁻⁴
WDTGH-4-2150.5–155.44.91.62 × 10−51.29 × 10−58.48 × 10−61.25 × 10⁻⁵
WDTGH-5-1140–14557.73 × 10−55.63 × 10−53.52 × 10−55.62 × 10⁻⁵
WDTGH-5-2146.3–151.353.09 × 10−52.19 × 10−51.37 × 10−52.22 × 10⁻⁵
WDTGH-6-155.8–63.37.54.22 × 10−63.81 × 10−62.00 × 10−63.34 × 10⁻⁶
WDTGH-6-269–86.57.54.22 × 10−53.33 × 10−52.00 × 10−53.18 × 10⁻⁵
Publisher’s Note: MDPI stays neutral with regard to jurisdictional claims in published maps and institutional affiliations.

