Article

Non-Destructive Porosity Measurements of 3D Printed Polymer by Terahertz Time-Domain Spectroscopy

1
National Physical Laboratory, Hampton Road, Teddington TW11 0LW, UK
2
Etaphase, Inc., 8201 164th Avenue NE, Redmond, WA 98052, USA
3
SavviDesigns, LLC, 3228 61ST Avenue SW, Seattle, WA 98116, USA
4
Mechanical Engineering, University of Washington, Stevens Way, Box 352600, Seattle, WA 98195, USA
5
Department of Physics, Advanced Technology Institute, University of Surrey, Guildford GU2 7XH, UK
*
Author to whom correspondence should be addressed.
Appl. Sci. 2022, 12(2), 927; https://doi.org/10.3390/app12020927
Submission received: 23 December 2021 / Revised: 7 January 2022 / Accepted: 14 January 2022 / Published: 17 January 2022
(This article belongs to the Special Issue Terahertz Applications for Nondestructive Testing)

Abstract

:

Featured Application

Non-destructive porosity measurements of 3D printed materials by terahertz time-domain spectroscopy.

Abstract

The porosity and inhomogeneity of 3D printed polymer samples were examined using terahertz time-domain spectroscopy, and the effects of 3D printer settings were analysed. A set of PETG samples were 3D printed by systematically varying the printer parameters, including layer thickness, nozzle diameter, filament (line) thickness, extrusion, and printing pattern. Their effective refractive indices and loss coefficients were measured and compared with those of solid PETG. Porosity was calculated from the refractive index. A diffraction feature was observed in the loss spectrum of all 3D printed samples and was used as an indication of inhomogeneity. A “sweet spot” of printer settings was found, where porosity and inhomogeneity were minimised.

1. Introduction

3D printing, also known as additive manufacturing (AM), is increasingly employed by a growing number of industries for a rapidly expanding variety of applications [1,2,3,4,5]. Increasingly, these applications rely on the electrical and optical as well as the mechanical properties of the printed structure. Starting at optical frequencies, 3D printed polymer and glass preforms have been drawn into optical fibres [6,7]. Millimetre-wave, microwave, and radio-frequency (RF) devices have been fabricated by 3D printing, including RFID devices [8], passive beam-steering elements such as Luneberg lenses [9], and graded index lenses (GRIN) with antireflective surfaces [10]. Capacitive force centres have been designed, fabricated, and tested [11]. Active investigations are underway for using the additive manufacturing of graded dielectrics to reduce the size of high voltage standoffs [12,13]. At all frequencies, the real permittivity of 3D printed materials decreases with porosity [9,10]. For the high voltage standoff application, the electrical breakdown strength of structures has been shown to decline with the characteristic air gaps (porosity) of 3D printed materials [14], and has also been shown to depend on the direction in which the field is applied relative to the print planes [15,16].
One of the most widely used 3D printing technologies is fused deposition modelling (FDM). The FDM process uses a continuous filament of thermoplastic material, which is fed from a spool through a heated extrusion nozzle to be deposited as printer tracks or lines. The printer head moves in a pre-programmed pattern, creating the desired object [17,18,19]. It is well known that 3D printing in general, and FDM in particular, produces materials that are inhomogeneous, anisotropic, and contain significant porosity; these affect the mechanical, electrical, and optical properties of the printed materials. For that reason, much work has been devoted to the analysis and optimisation of 3D printing process, aimed at minimising inhomogeneity and porosity [20,21,22].
3D printing studies predominantly employ mechanical tests, such as tensile strength and elastic modulus, which are destructive and time-consuming [20,21,22], and often require specially manufactured samples. X-ray computed tomography (XCT) and X-ray diffraction (XRD) have also been employed to reveal the microscopic structure of printed materials [23,24]. Although XCT can produce detailed high-resolution images of the internal structure of the material, it is unsuited to widespread deployment at manufacturing stations and for routine quality control. Optical techniques cannot be employed, since with very few exceptions, 3D printed materials are opaque to visible wavelengths due to strong scattering. In this regard, terahertz (THz) spectroscopy (see Section 2.3 for a description of the technique) has an advantage, because the most common class of material utilised by FDM is polymers, which are transparent or semi-transparent at THz frequencies. Moreover, THz time-domain spectroscopy (TDS) can provide a simple and direct measurement of porosity [25,26,27], as well as revealing inhomogeneity and anisotropy. A crucial advantage of THz TDS is that it can serve as an in-line or near-line non-destructive tool for process monitoring and quality control.
THz TDS has long been used for examining polymers [28,29,30,31,32]. Moreover, AM is being increasingly considered as a technology for fabricating THz components [33,34,35,36]. The THz transmission properties of 3D printed polymers have been also examined [37,38]. However, neither study considered the effects of printer settings or compared the transmission of 3D printed and solid materials.
In this work, we employ transmission THz TDS to systematically investigate the effects of 3D printer settings on the porosity and inhomogeneity of FDM-fabricated PETG samples. A set of 3D printed PETG samples was prepared by systematically varying the printer parameters, including layer thickness, nozzle diameter, filament (line) thickness, extrusion, and printing pattern. Their effective refractive indices and loss coefficients were measured and compared with those of solid PETG. The porosity was calculated from the refractive index. We observed clear relationships between printer parameters and material properties, helping to identify the “sweet spot” where porosity is minimised. In doing so, we demonstrate the utility of THz TDS for the non-destructive evaluation of FDM-printed materials.

2. Materials and Methods

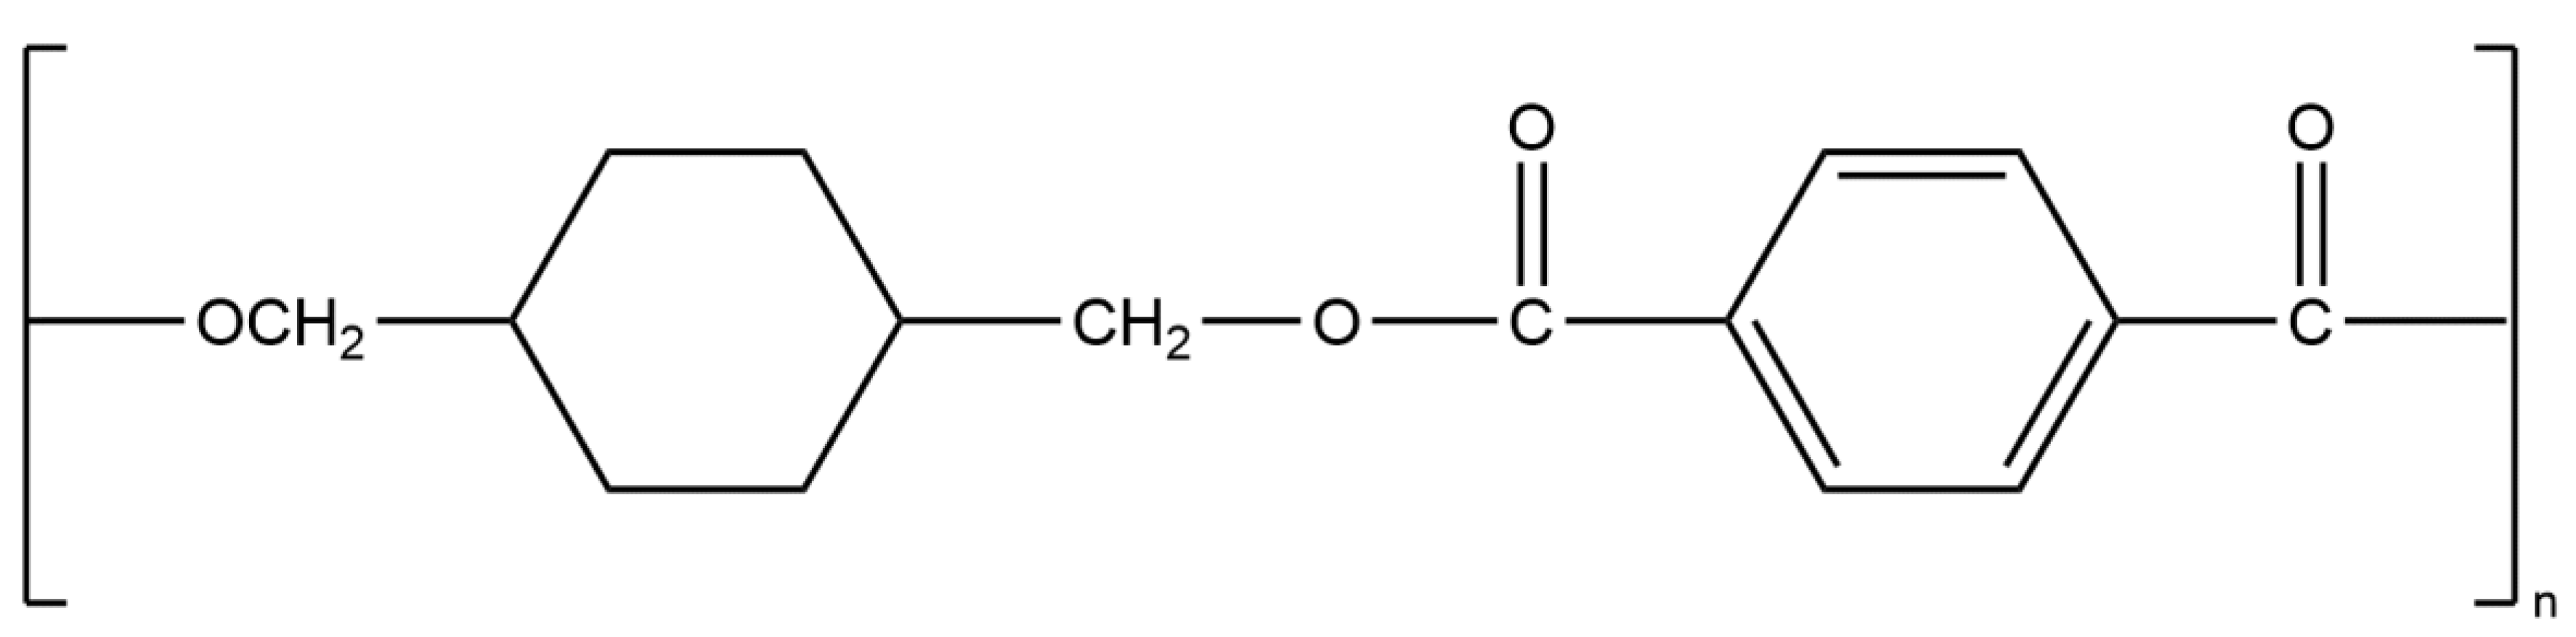
2.1. Polyethylene Terephthalate Glycol

Polyethylene terephthalate glycol, commonly known as PETG or PET-G, is a thermoplastic polyester whose chemical formula is (C16H18O4)n [39] and whose structure is depicted in Figure 1. PETG is a glassy polymer, and is transparent and colourless in the visible spectrum. Its refractive index at 589 nm is 1.57 [40,41].
PETG possesses good chemical resistance, durability, and excellent formability for 3D printing [42,43,44,45]. PETG can be easily vacuumed and pressure-formed, as well as heat-bent, thanks to its low forming temperatures. This makes it exceptionally popular for consumer and commercial applications that involve heat-forming manufacturing techniques. PETG is particularly good for 3D printing, having an extrusion temperature of between 220 °C and 260 °C [46]. It has a density of 1.27 g/cm3 [41].

2.2. 3D Printer Settings

The samples were fabricated with a Prusa i3 MK3S (Prusa Research, Prague, Czech Republic) model 3D printer, employing the FDM technology. The fabricated samples were opaque white, indicating strong scattering of visible wavelengths.
The raw PETG materials were in the form of 1.75 mm-diameter filaments. Different sample geometries were used for the three different print patterns listed in the last column of Table 1. The linear pattern, where all the layers of parallel lines are aligned along the same axis (Figure 2a), was printed as a 125 × 50 mm rectangular slab. The circular pattern (Figure 2b) is comprised of a series of concentric rings forming a 50 mm-diameter disc. The cross-hatch pattern, which consists of alternate layers of parallel lines aligned perpendicular to the adjacent layer (Figure 2c), was printed as a square with a side length of 50 mm. All samples were around 2 mm thick.
The standard nozzle temperature for PETG is 220 °C and the print speed is 55 mm/s [46]. The surface of the print-bed was coated with polyetherimide (PEI) to improve adhesion without causing warping, and its temperature was kept at 85 °C [46].
Table 1 lists the 3D printer parameters that were varied in order to investigate their effects. Two samples were printed for each combination of printer settings; therefore, in the figures below, there are two data points at each setting. The nozzle diameter is the size of the opening that extrudes the heated material. This is typically 400 µm in most consumer FDM printers, so using a smaller diameter requires a higher nozzle temperature (240 °C) and a slower print speed (35 mm/s maximum; volumetric speed set at 3 mm3/s). The layer height refers to the height of a single printed layer. The “thick/thin” column refers to the nominal width of the printed lines. Thick is meant to be 250 µm and thin is meant to be 225 µm; however, due to the numerous factors involved (such as extrusion rate and material cooling rate), this should only be taken as a rough guide. The extrusion multiplier can be varied to control the extrusion rate: 1.0 indicates no change, 1.1 indicates over-extrusion by 10%, and 0.9 indicates under-extrusion by 10%. Other parameters, such as infill density and overlap, were controlled indirectly by the printer settings mentioned above.

2.3. THz Time-Domain Spectroscopy

The terahertz time-domain spectroscopy (THz TDS) measurements were carried out using a TeraFlash Pro spectrometer from Toptica Photonics (Toptica Photonics, Munich, Germany) set up in a standard optical configuration with four F/2 parabolic mirrors [47,48]. The THz beam path was purged with dry air to eliminate absorption from atmospheric water vapor. The samples were placed in the collimated section of the beam, and laser alignment was used to ensure that they were positioned normal to the THz beam. The frequency resolution was 10 GHz.
The frequency-dependent (ν) refractive index (n(ν)) and absorption coefficient (α(ν)) of each sample were calculated by the standard method of applying Fourier transform to the time-domain data to obtain the frequency-dependent field amplitude (E(ν)) and phase (ϕ(ν)), and using the equations [47]:
n ( ν ) = 1 + ( ϕ s ( ν ) ϕ r e f ( ν ) ) c 2 π ν d
α ( ν ) = 2 d   ln [ ( n + 1 ) 2 4 n   E s ( ν ) E r e f ( ν ) ]
where c is the speed of light, d is the sample thickness, and the subscripts s and ref refer to the sample and reference data, respectively. THz TDS has an important advantage in the measurement of the THz optical properties of materials, in that it enables unambiguous, straightforward determination of the refractive index and absorption coefficient [47,48].
The measurement uncertainty had two main components: uncertainty in sample thickness; and measurement repeatability. Since 3D printed samples deviated from being optically flat and plane-parallel by as much as 100 μm, both of these factors were significant and are responsible for the large uncertainties in the figures below.

3. Results

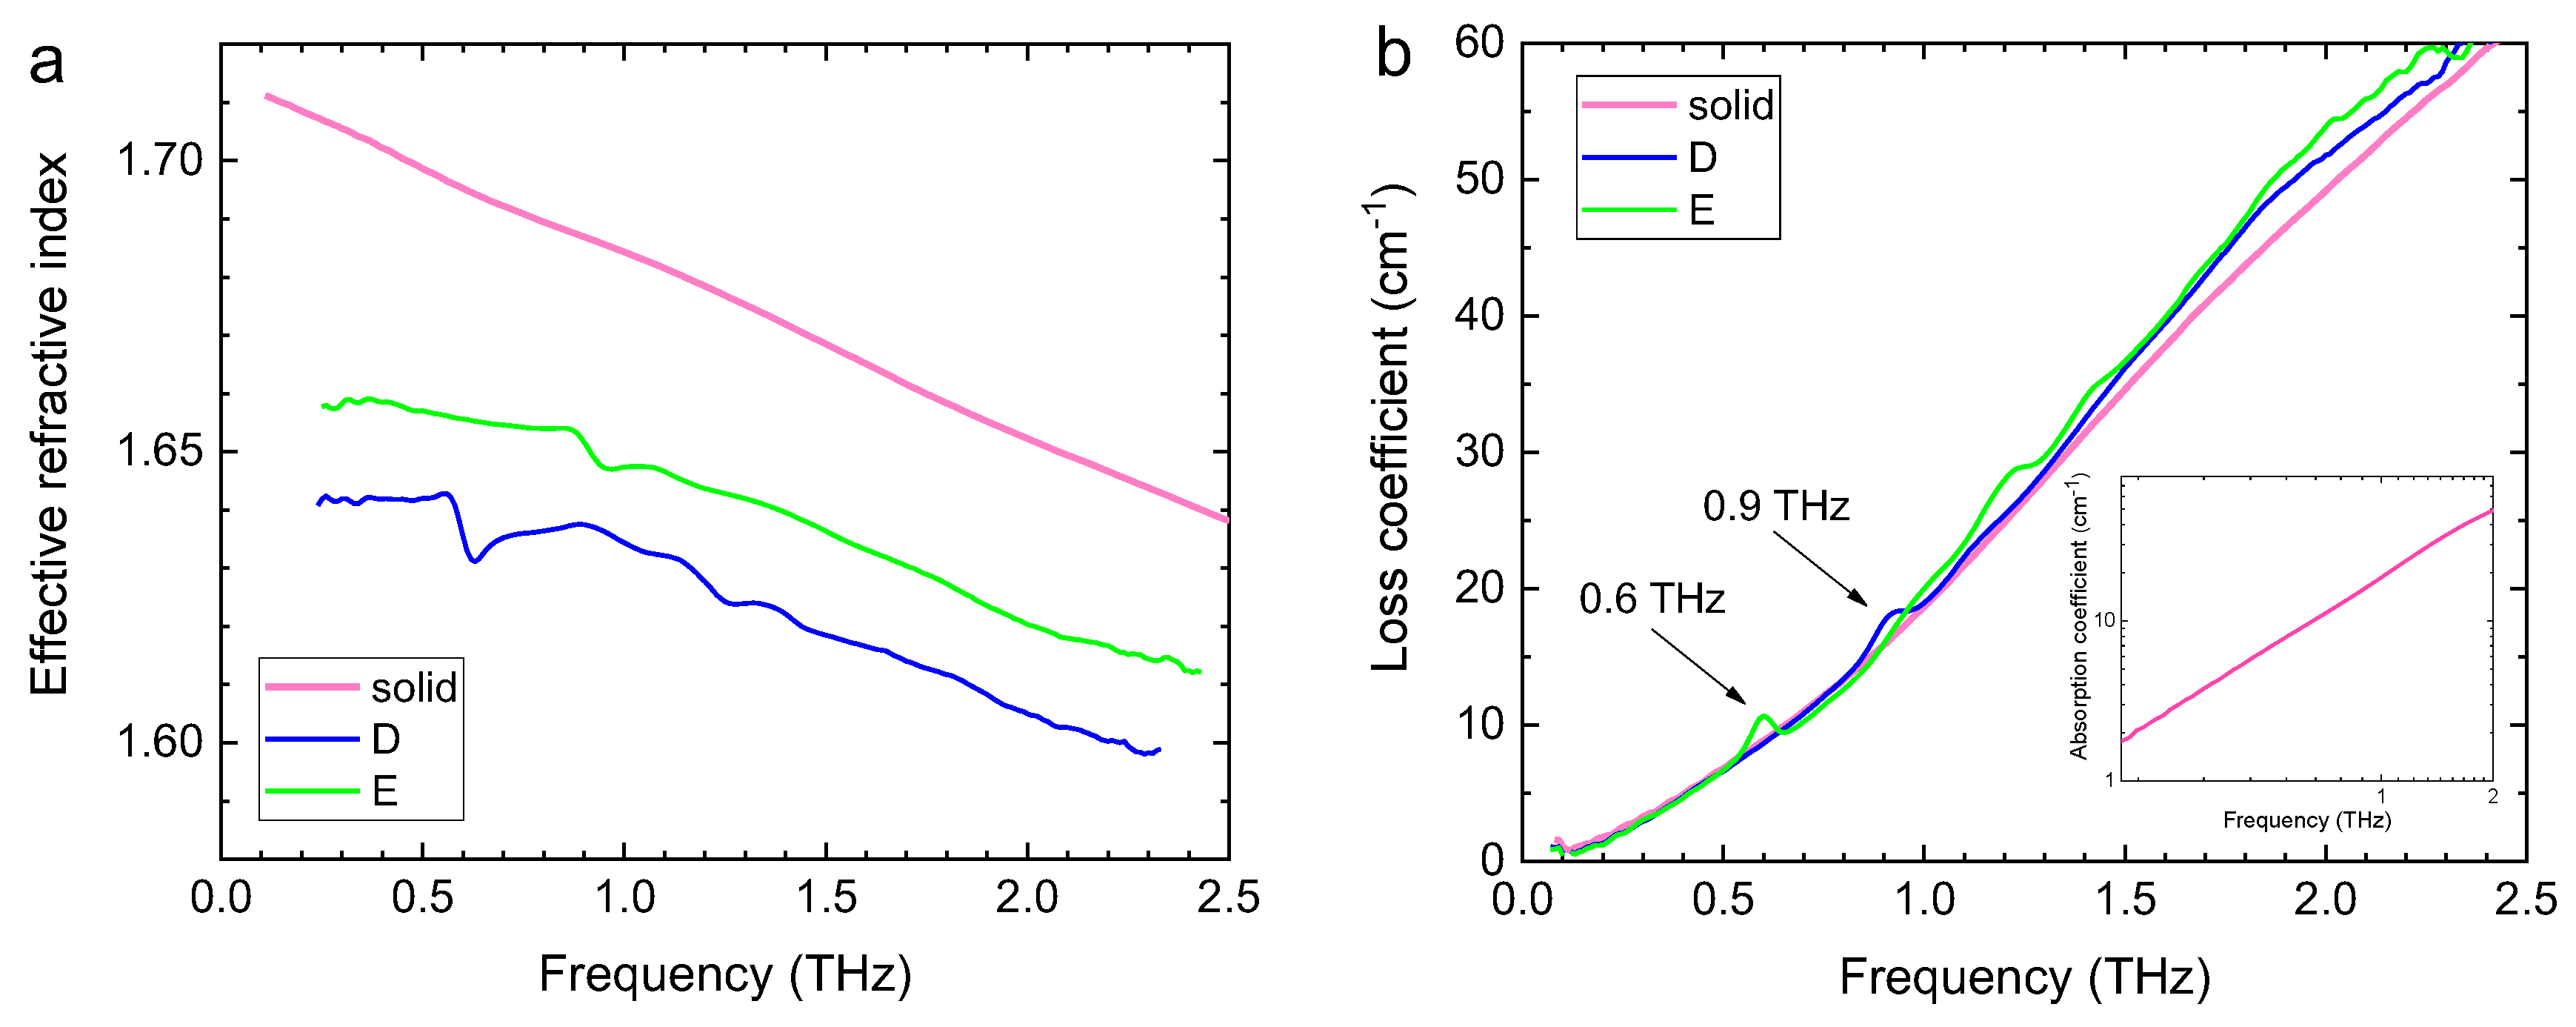
3.1. Comparison between Solid and 3D Printed Materials

Figure 3 shows the effective refractive index and loss coefficient of two of the 3D printed samples, together with that of the solid PETG material. Note that the refractive index of solid PETG at THz frequencies is higher than in the visible (1.57 at 589.3 nm), as is the case in many materials, due to the contribution of ionic polarizability. Note also that solid PETG has moderately strong THz absorption that rises with frequency following a power law (Figure 3b inset). Strong absorption is caused by the presence of polar components in the PETG molecule, especially the OH and CO groups. The power law dependence of absorption arises from the glassy nature of PETG [49]. There are two significant differences between the solid material and 3D printed samples: in the solid, the refractive index is significantly higher, and the loss coefficient is slightly lower.
The effective refractive index of 3D printed samples is lower than that of solid material due to the porosity present in the printed samples. Porosity, defined as the volume fraction of air in the material (p), causes a decrease in the effective refractive index neff, as compared with that of solid nsolid, due to the presence of air voids, with nair ≅ 1. Using a linear approximation, the effective refractive index can be obtained as [50]:
n e f f = p + ( 1 p )   n s o l i d
The porosities of all 3D printed samples were calculated and are analysed below in relation to the printer settings.
The loss coefficient of 3D printed samples is higher than that of solid material due to the contributions of scattering and diffraction. On the one hand, porosity gives rise to scattering because the air voids act as scattering centers. Scattering loss manifests as a featureless loss edge that increases with frequency, typically according to a power law. On the other hand, porosity also reduces absorption loss, as less material is present in the beam path. The two effects counteract each other, such that the total is determined by the porosity, the material absorption, and the size of the voids. In the case of the PETG samples studied here, the effects closely counter-balance, so that the excess loss is small in all cases. This is because PETG is a polar polymer with moderately strong THz absorption. The excess loss αexc can be calculated by comparing the absorption in solid material αsolid with effective loss in the sample αeff:
α e x c = α e f f ( 1 p )   α s o l i d
In addition to scattering, all 3D printed samples show a diffraction loss feature, seen as a weak broad peak. This can be explained as arising from the regular variation of the refractive index in the printed structure, which forms a Bragg grating [51] with a period H equal to the height of the printing layer. The Bragg frequency is then given by ν0 = c/(2nsolidH). The Bragg feature occurs at 0.9 THz for layers of 100 μm, at 0.6 THz for layers of 150 μm, and at 0.3 THz for layers of 300 μm. Since Bragg reflection increases with refractive index variation, the intensity of the diffraction feature reflects the degree of inhomogeneity in the sample. The intensity of the Bragg feature can be taken as excess loss at the local maximum αexc,peak. Using Equation (4), the excess peak diffraction loss values of all 3D printed samples were calculated and are discussed below in relation to the printer settings.

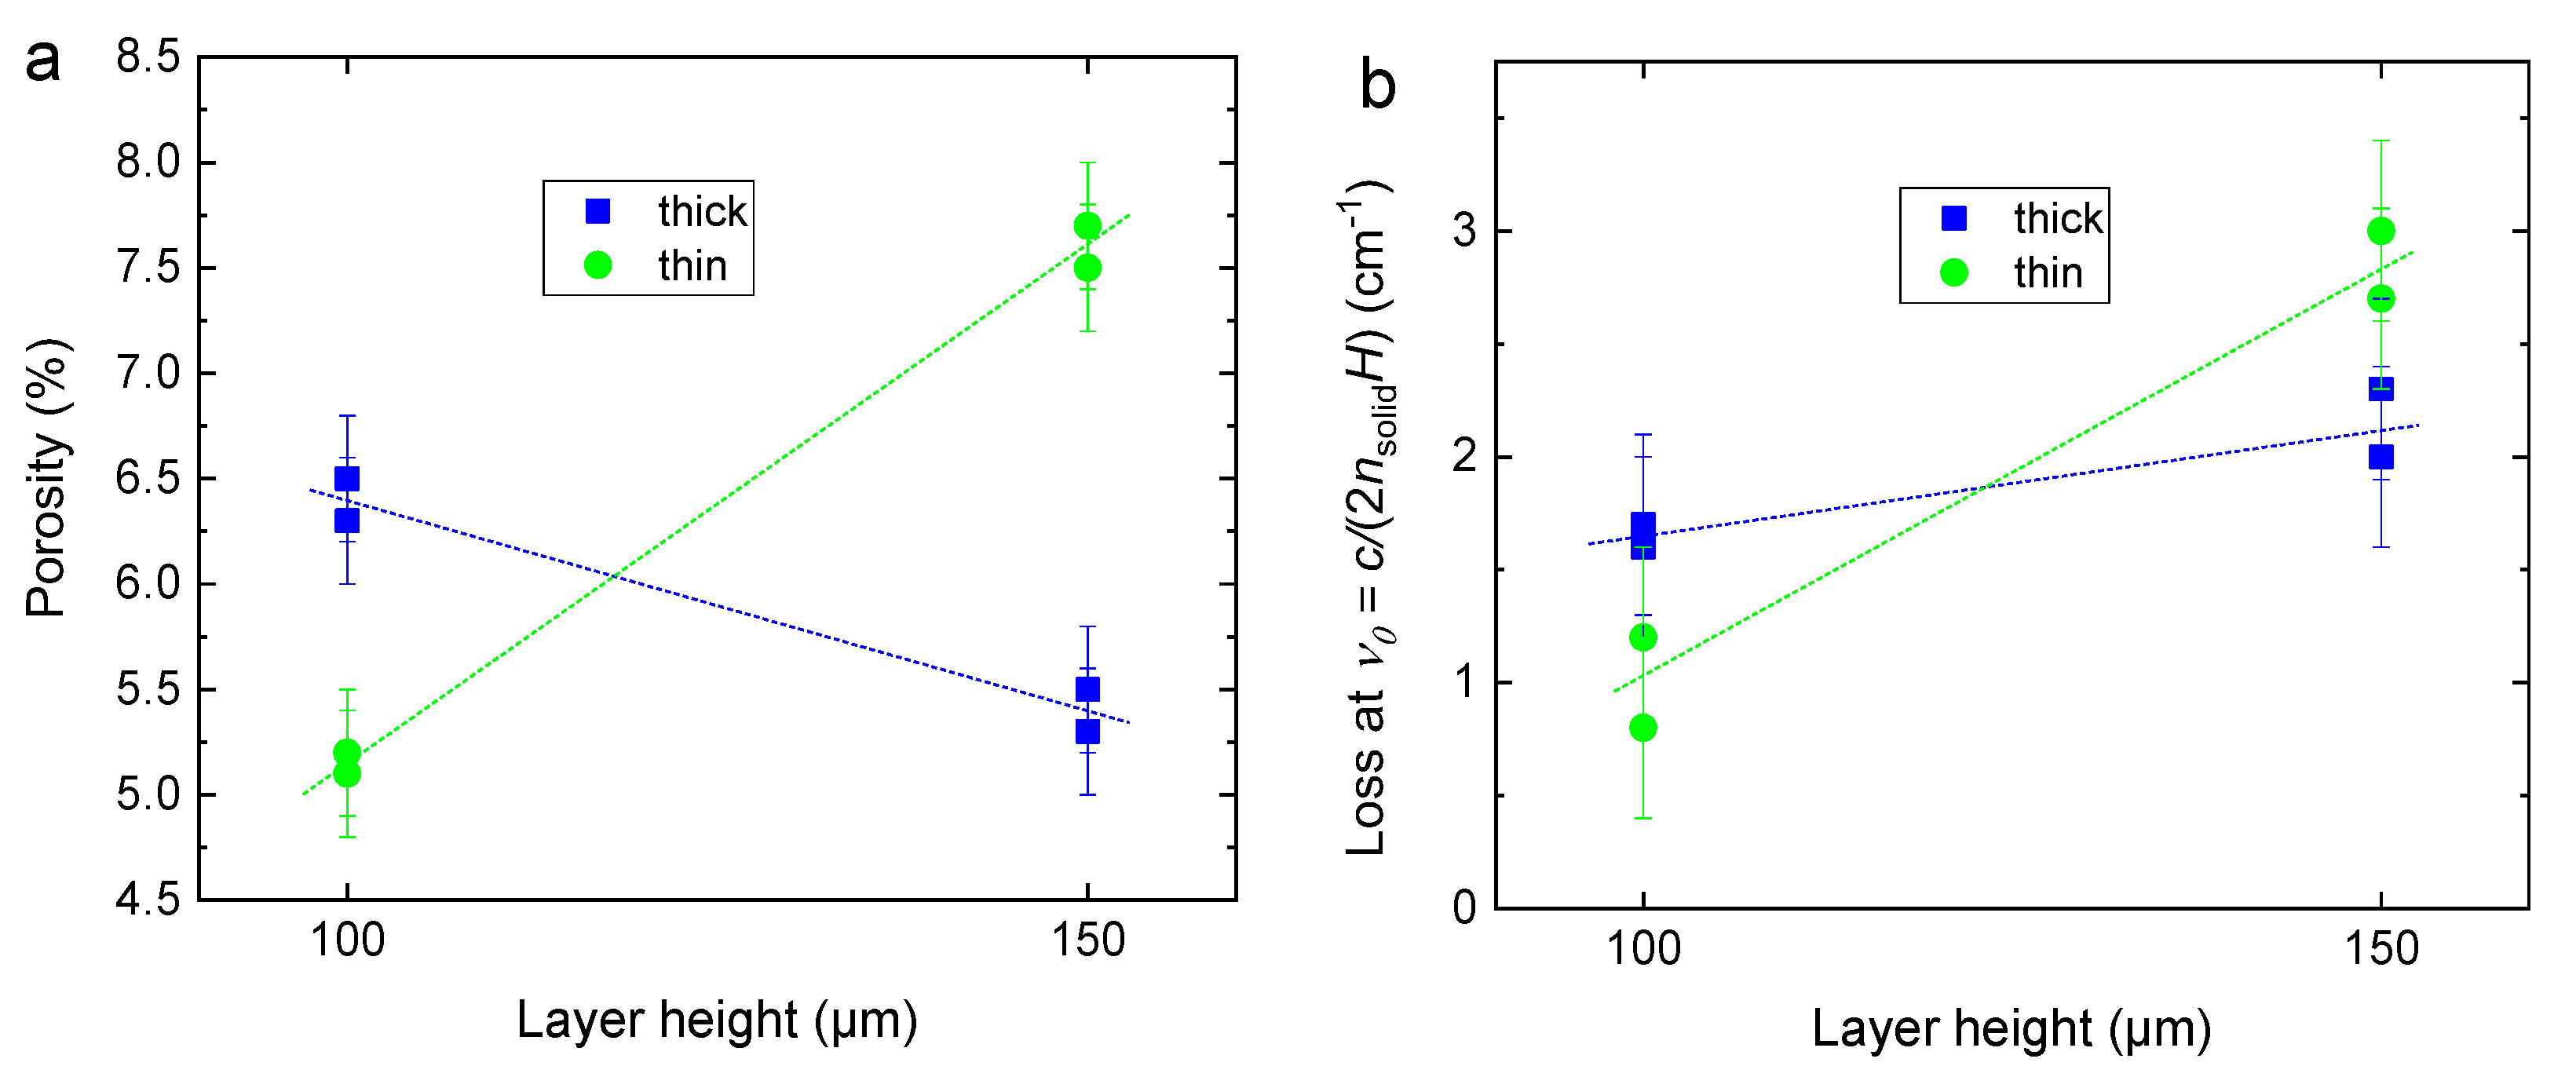
3.2. Effect of Layer Height

Figure 4 examines the effect of layer height on the porosity and inhomogeneity of the 3D printed PETG samples, together with the effect of thick/thin printing. Clearly, for the thick-printed samples, the porosity is lower in the sample with the taller layer and the opposite behaviour is observed in the thin-printed sample. However, the diffraction peak is stronger in both thick- and thin-printed printed samples with the taller layer, although the difference between the layer heights is larger in the thin-printed sample. This indicates that there is an optimal combination of layer and track sizes—a “sweet spot”—where the porosity and inhomogeneity are minimised.

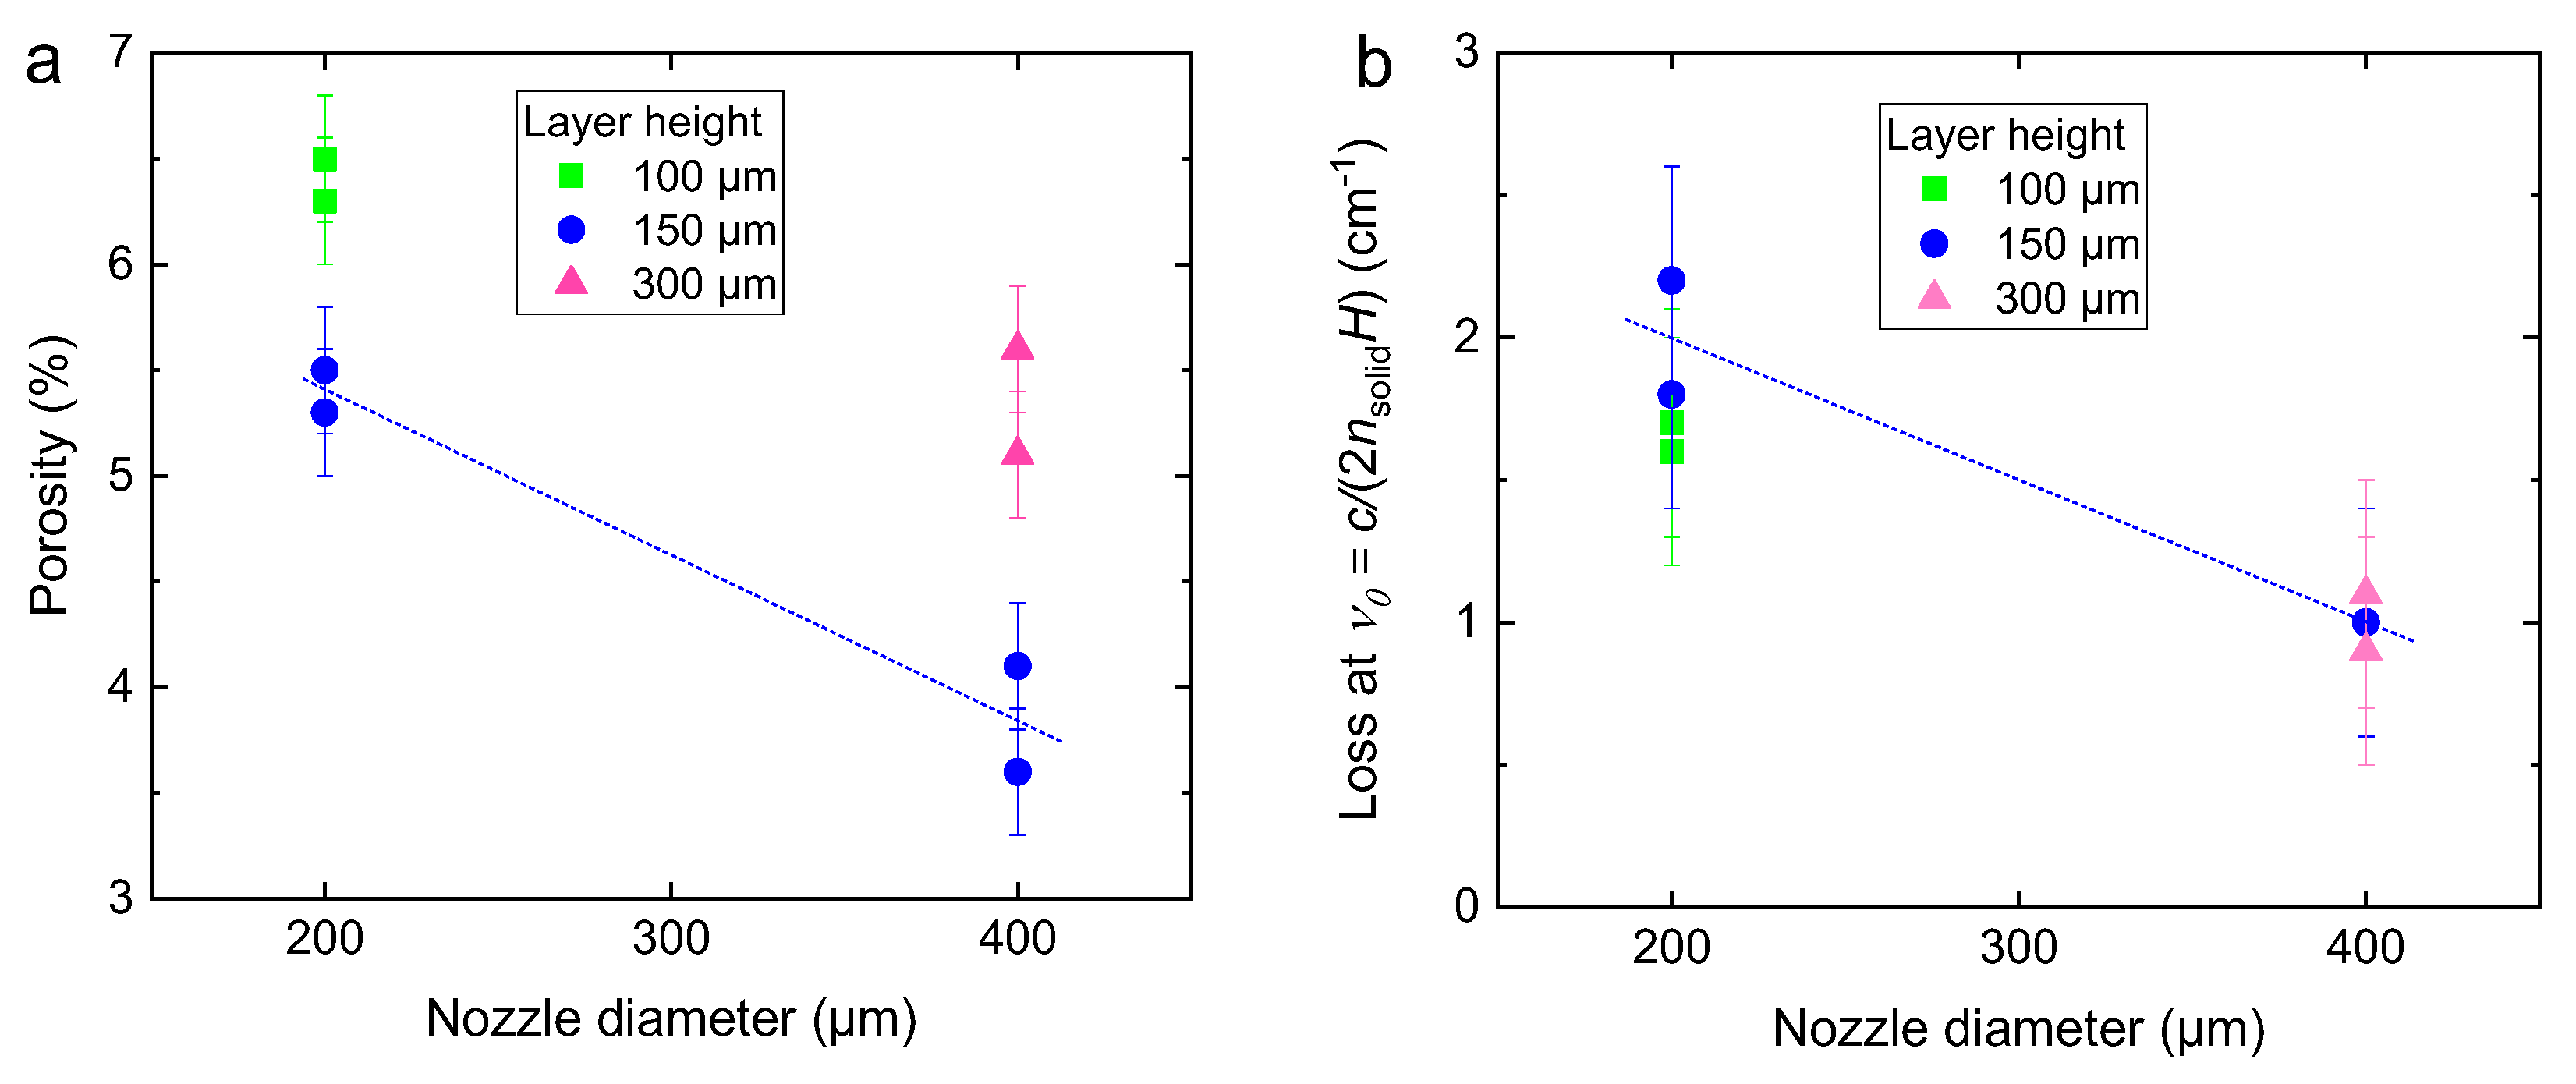
3.3. Effect of Nozzle Diameter

Figure 5 considers the effect of nozzle diameter, together with layer height, on the porosity and inhomogeneity of the 3D printed PETG samples. The porosity decreases with nozzle diameter for the 150 μm layer. However, samples with 100 μm and 300 μm layers both have higher porosity for the same nozzle diameter than that with the 150 μm layer. Here, again, it appears that there is a “sweet spot” where porosity is minimised for an optimal combination of layer height and nozzle diameter. The strength of the diffraction peak is greatly reduced for the larger nozzle diameter.

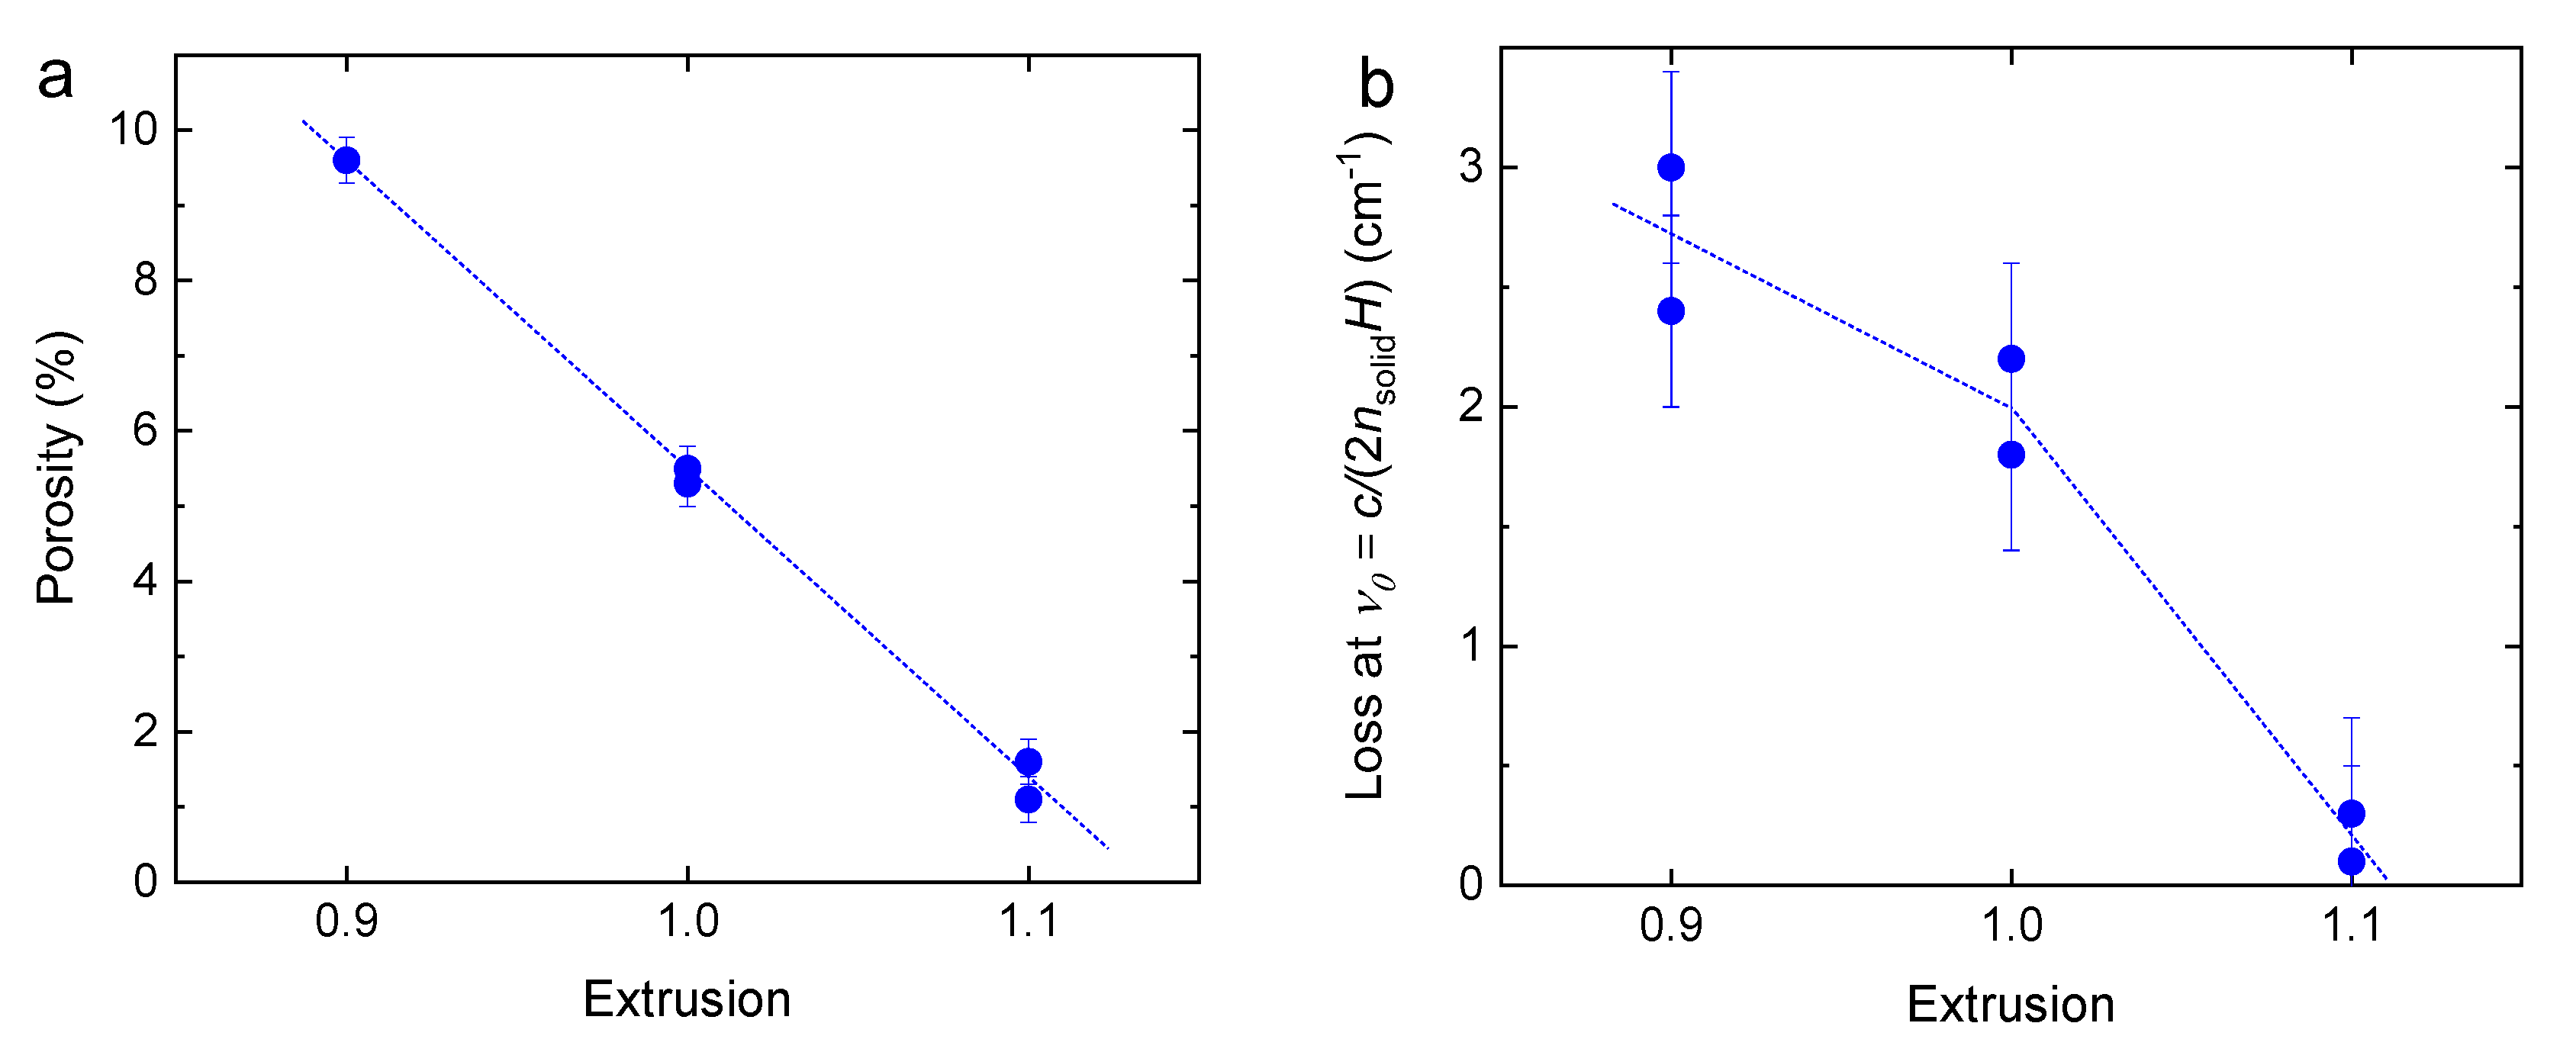
3.4. Effect of Extrusion

Figure 6 explores the effect of extrusion on the porosity and inhomogeneity of the 3D printed PETG samples. We note that the porosity decreases linearly with extrusion. The diffraction peaks also decrease with extrusion, although not linearly. This can be explained by the fact that both porosity and inhomogeneity decrease when more material is extruded, and provides a more complete and uniform in-fill of the spaces between the printing tracks.

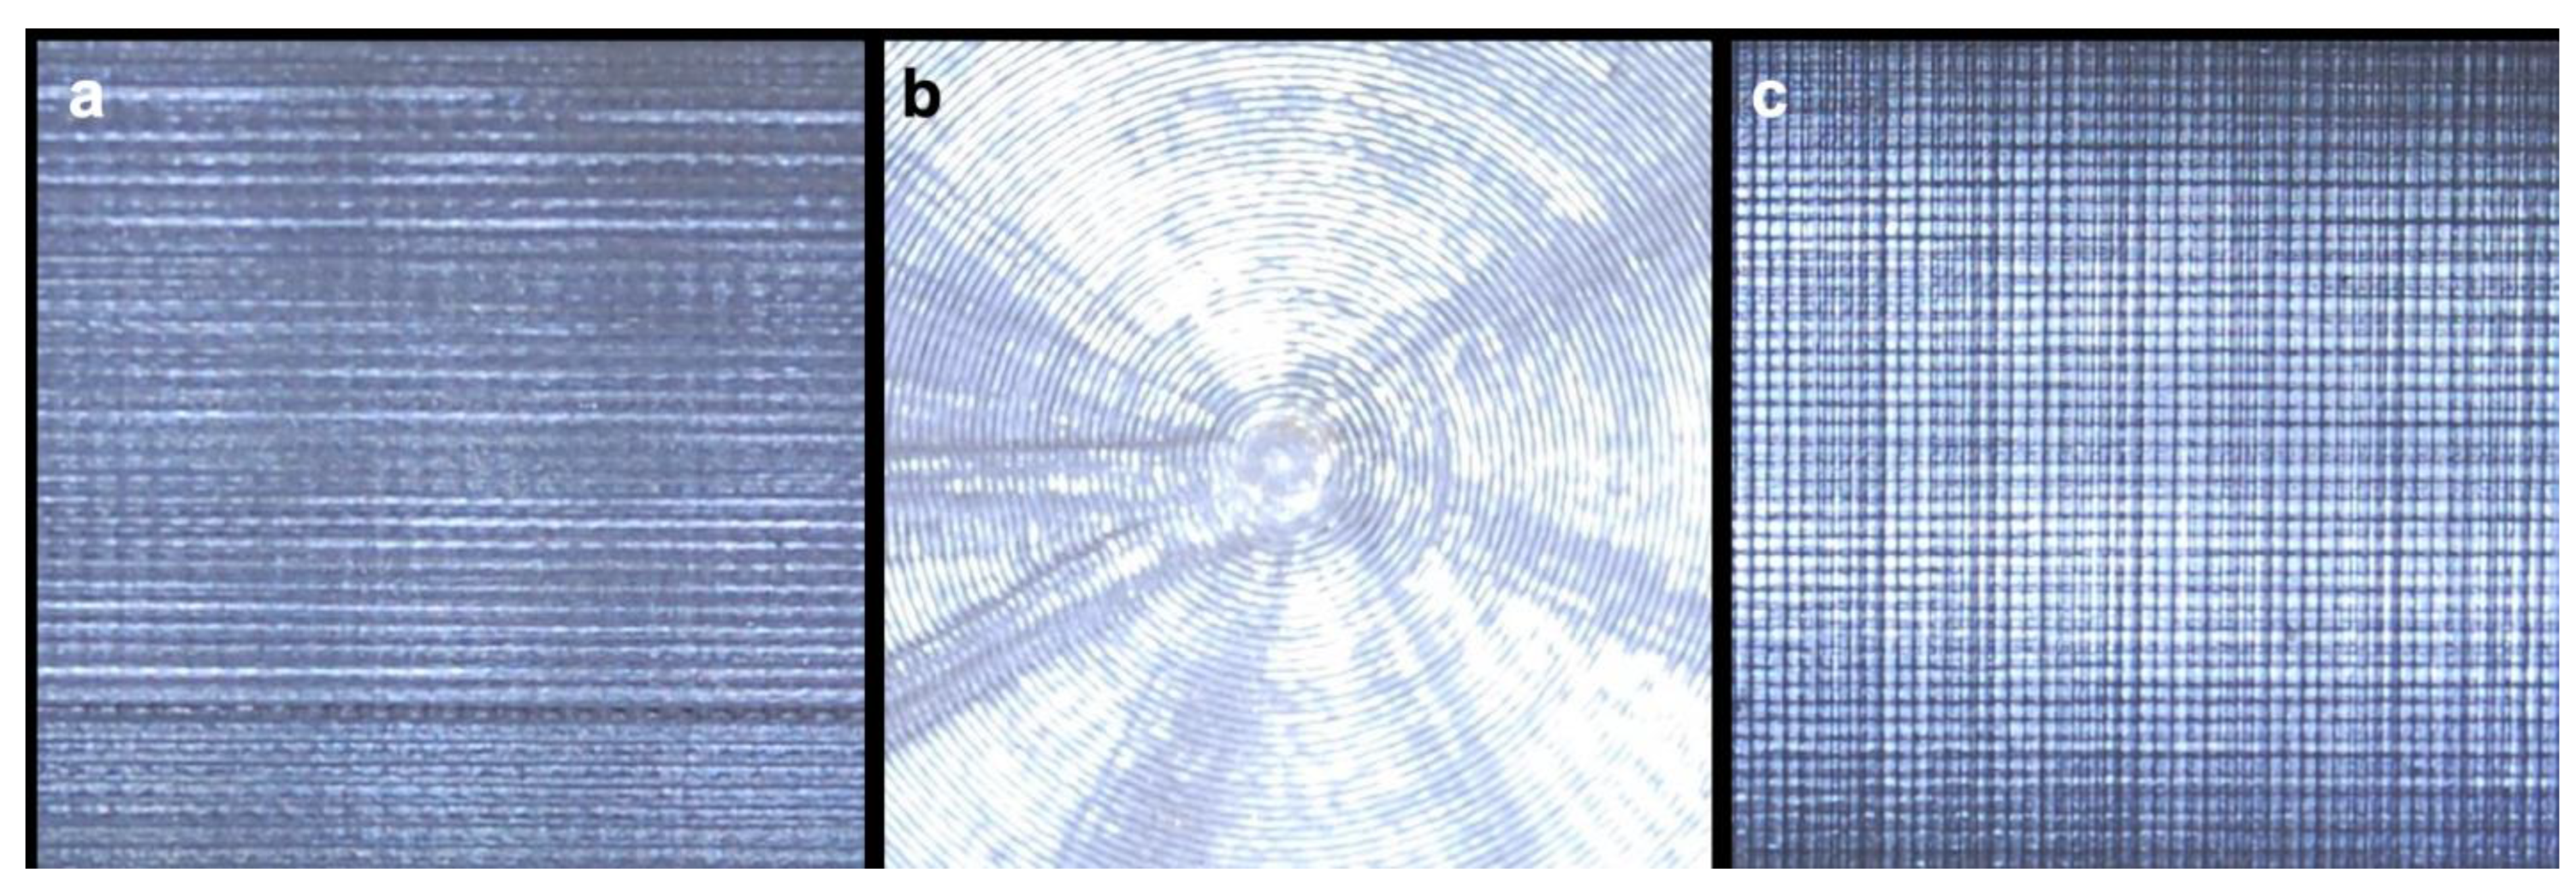
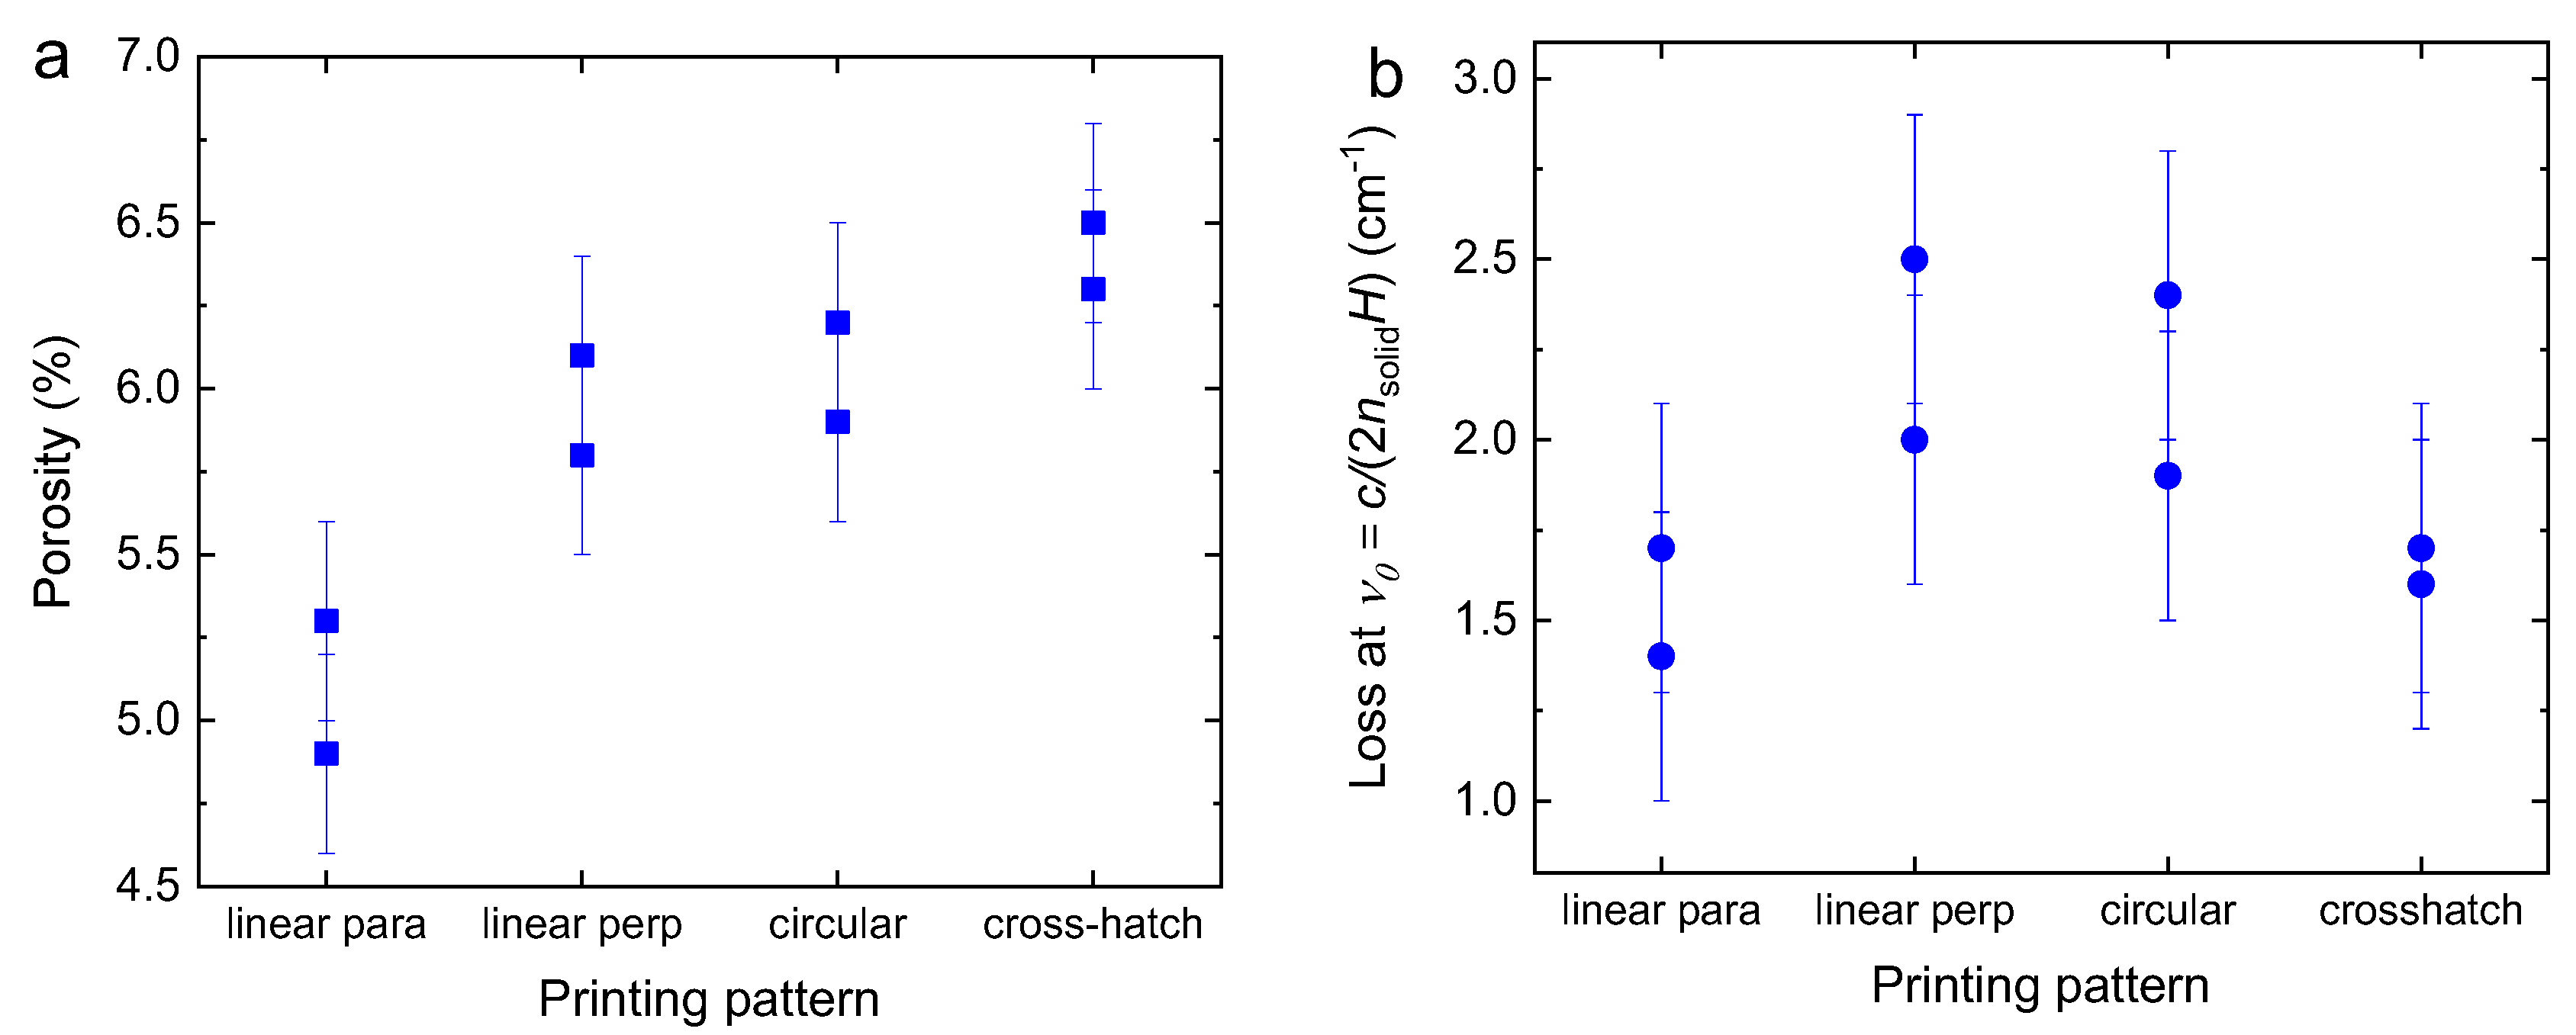
3.5. Effect of Printing Pattern

Figure 7 focuses on the effect of the printing pattern on the porosity and inhomogeneity of the 3D printed PETG samples. As expected, the linear pattern exhibits polarisation effects due to anisotropy, where the beam polarised parallel to the tracks experiences a higher refractive index (lower porosity) and weaker diffraction than the beam polarised perpendicular to the tracks. For the beam polarised normal to the tracks, the values of porosity and diffraction strength lie close to those of the circular and cross-hatch patterns. For both polarisations, the linear pattern has the lowest porosity, followed by the circular and the cross-hatch. However, there is little variation in the diffraction peak.

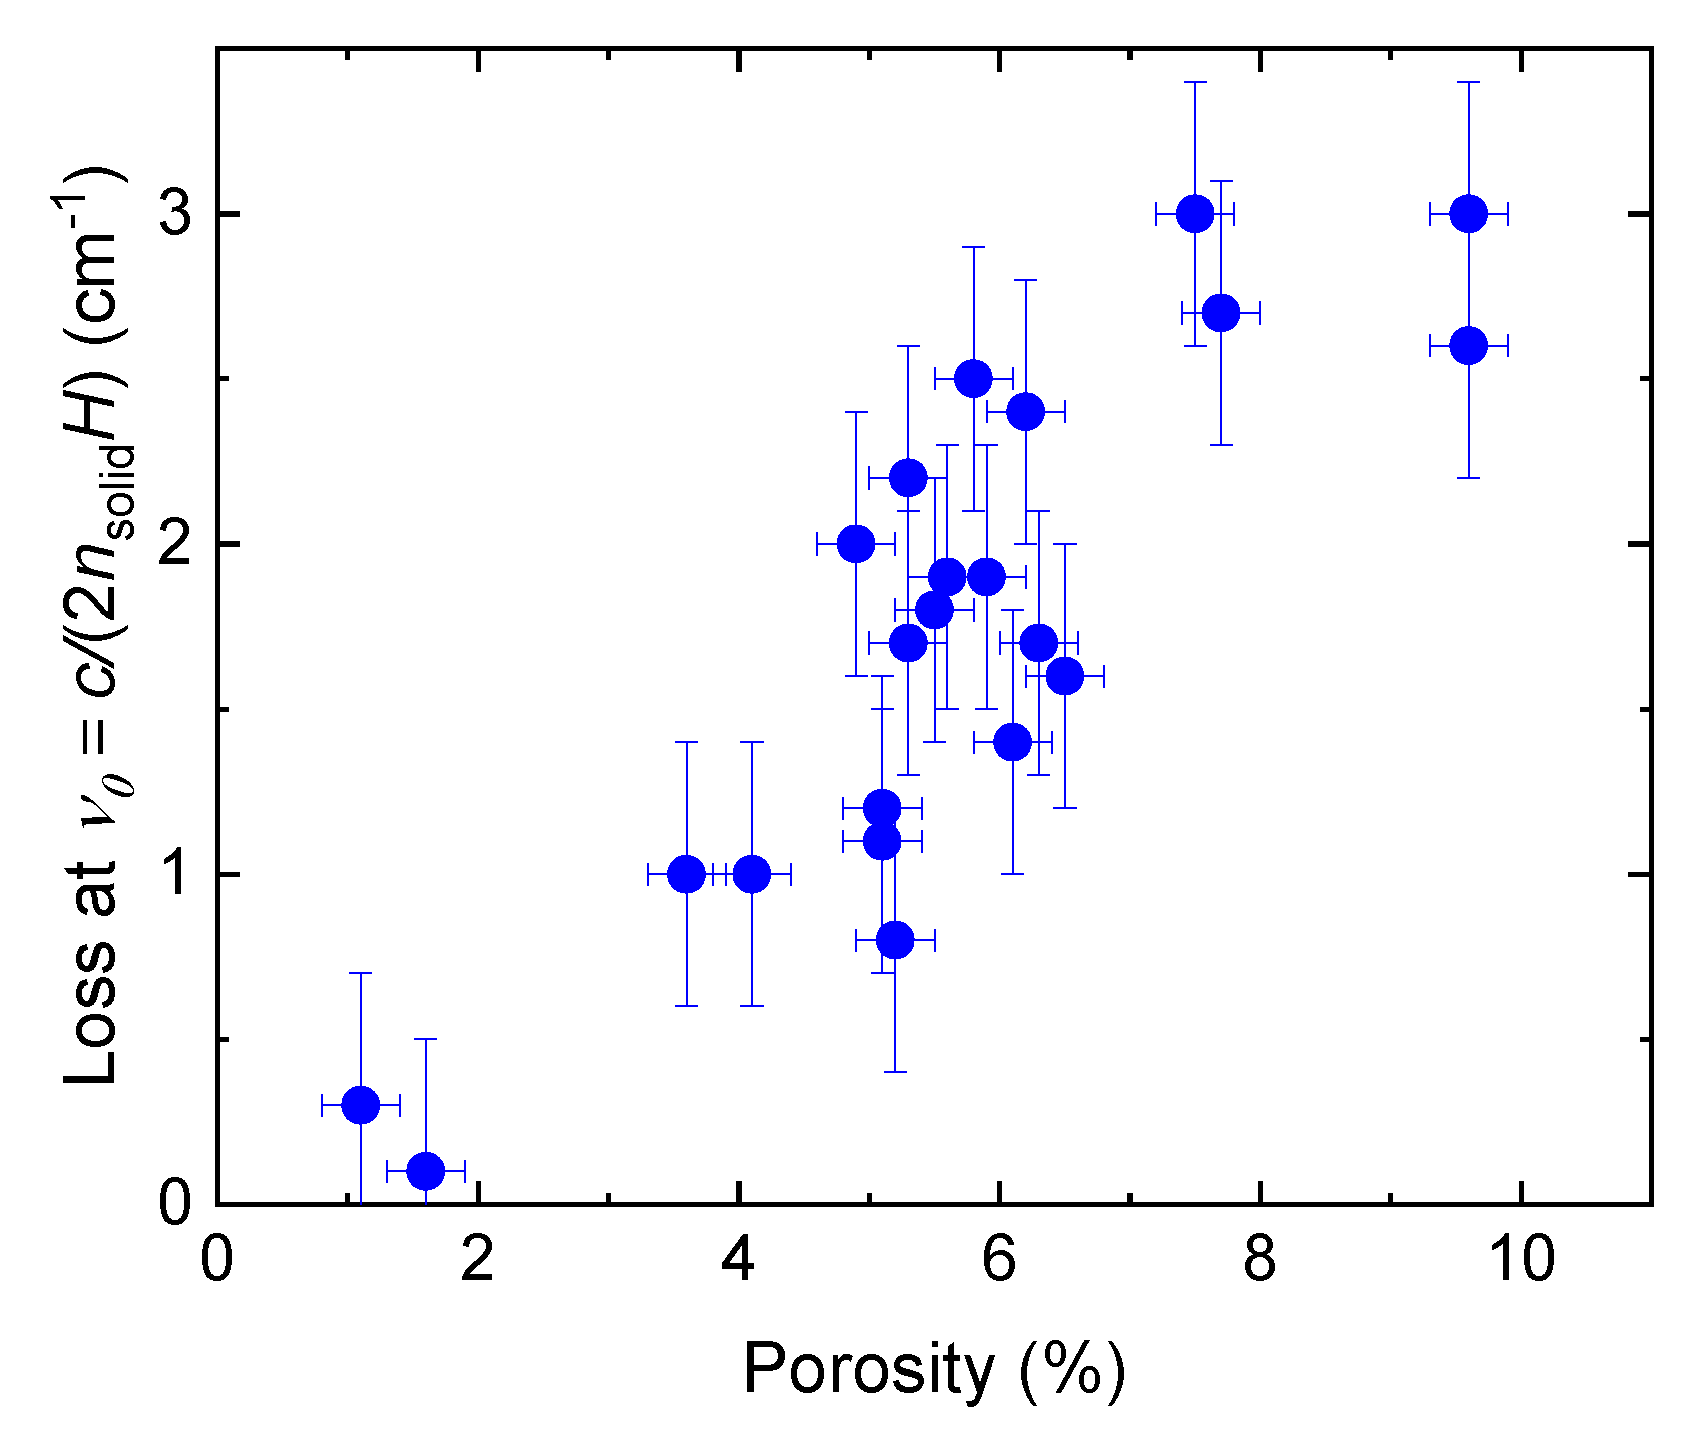
3.6. Relationship between Porosity and Diffraction

In examining Figure 4, Figure 5, Figure 6 and Figure 7, we note an apparent positive correlation between porosity and the strength of the diffraction peak. This is confirmed by the results shown in Figure 8, where we plot the peak intensity versus porosity for all samples. The correlation may be explained by the fact that higher porosity is associated with greater structured inhomogeneity in the material, which gives rise to stronger diffraction.

3.7. Model

In order to explain the findings presented here, we employ a simple geometrical model of 3D printed materials. The model, depicted in Figure 9, assumes that the deposited tracks are cylindrical, rigid, parallel, and regularly spaced. Of course, the real structure deviates from these assumptions to various degrees, especially in the fact that track cross-sections are non-circular. Nevertheless, the model provides a good first-order approximation and allows for the interpretation of the experimental results.
Figure 9a shows a partial cross-section of cross-hatch printed material, where the spacing between the tracks equals their diameter, resulting in dense packing. It is easy to see that the volume fraction of the voids in this case equals p = 1–π/4 = 0.22. (This is much higher than the observed porosity values due to flattening of the real printed tracks: see below.) If the track spacing is either larger or smaller than the track diameter, the packing density is reduced and porosity increases (Figure 9b,c). This explains the observation that there is a “sweet spot” of printer settings, where porosity is minimised. A linear printing pattern can produce a dense hexagonal packing (Figure 9d), where porosity equals p = 1–π/(2√3) = 0.09, explaining why the observed porosity is lower in the linear-printed samples. The model also allows interpretation of the positive correlation between porosity and the diffraction loss peak: Bragg diffraction arises due to variations in the refractive index; these are larger in materials with higher porosity. Finally, Figure 9e depicts a more realistic picture of the 3D-printed structure, showing tracks that are deformed and flattened due to melting. Such deformation fills in the voids, significantly reducing porosity and explaining why the measured values are much lower than those estimated by the model.
The simple model depicted in Figure 9 shows that a “sweet spot” for minimum porosity occurs when the track spacing and layer height are both equal to the track diameter, i.e., D = L = H. However, track deformation due to melting should also be taken into account. Minimising porosity will also lead to a reduced diffraction loss peak.

4. Conclusions

The effects of 3D printer settings on the porosity and homogeneity of the produced materials were examined using terahertz time-domain spectroscopy. A set of PETG samples were 3D printed by systematically varying the printer parameters, including layer thickness, nozzle diameter, thick/thin printing, extrusion, and printing pattern. The effective refractive indices and loss coefficients of the 3D printed samples were measured and compared with those of solid PETG. porosity was calculated from the difference in the refractive index of solid and 3D printed material. For the first time, a Bragg diffraction feature was observed in the loss spectrum of all 3D printed samples; material inhomogeneity was inferred from the amplitude of this feature.
When fabricating 3D printed materials, it is desirable to minimise their porosity and inhomogeneity in order to improve their mechanical and optical properties. It was found that porosity and inhomogeneity are strongly influenced by printer settings, and that a “sweet spot” exists where these are minimised for an optimal combination of printer settings. In particular, increasing extrusion appears to be most effective in reducing porosity and inhomogeneity. Moreover, there is a positive correlation between porosity and diffraction, such that both are minimised simultaneously. A simple geometrical model was proposed to explain the findings.
In this study, we have demonstrated the use of THz TDS for examining 3D printed materials. We have measured porosity and diffraction loss and have observed their variations with printer settings. Porosity is known to be related to the mechanical properties of 3D printed materials, such as elastic modulus. Therefore, THz TDS measurements can provide insight into the mechanical performance of such materials.
It should be noted that in the simple implementation described here, THz TDS is a bulk technique that measures the mean porosity over the volume of material (area and depth) exposed to the beam. As such, it cannot provide a 3D image of the internal structure of the object, nor depth variation of properties such as porosity. As with other optical techniques, tomographic implementations of THz TDS that can reveal internal structure are possible. However, these require complex equipment and are time-consuming, and therefore may not be suitable for routine quality control.
THz TDS is a non-contact, non-destructive technique that can be implemented in an industrial environment to provide in-line or near-line testing, and therefore offers a useful testing tool to the additive manufacturing industry.

Author Contributions

Conceptualization, M.N. and R.A.M.; data curation, G.S., M.N., P.F. and R.A.M.; methodology, G.S., F.A., R.A.M. and M.N.; software, G.S.; validation, G.S. and M.N.; formal analysis, G.S. and M.N.; investigation, M.N., G.S., F.A. and R.A.M.; resources, G.S., R.A.M. and M.N.; writing—original draft preparation, M.N. and G.S.; writing—review and editing, P.F., R.A.M., F.A., G.S., G.L., M.F. and M.N.; visualization, G.S. and M.N.; supervision, R.A.M. and F.A.; project administration, R.A.M.; funding acquisition, R.A.M. and M.N. All authors have read and agreed to the published version of the manuscript.

Funding

The Etaphase contributions to this research were funded by the National Science Foundation, grant number NSF SBIR-1534779. MN’s work was funded by the National Measurement Office of the Department for Business, Energy & Industrial Strategy (BEIS) of the UK government. M.F. and G.L. acknowledge support from the EPSRC (United Kingdom) Doctoral Training Partnership grant EP/R513350/1, EPSRC (United Kingdom) Strategic Equipment Grant No. EP/L02263X/1 (EP/M008576/1) and EPSRC (United Kingdom) Grant EP/M027791/1.

Institutional Review Board Statement

Not applicable.

Informed Consent Statement

Not applicable.

Acknowledgments

Savvides Design provided access to the Prusa-3D printer as in-kind support.

Conflicts of Interest

The authors declare no conflict of interest.

References

  1. Redwood, B.; Schöffer, F.; Garret, B. The 3D Printing Handbook: Technologies, Design and Applications; 3D Hubs: Amsterdam, The Netherlands, 2017. [Google Scholar]
  2. Jordan, J.M. 3D Printing; MIT Press: Cambrdge, MA, USA, 2019. [Google Scholar]
  3. Espera, A.H.; Dizon, J.R.C.; Chen, Q.; Advincula, R.C. 3D-printing and advanced manufacturing for electronics. Prog. Addit. Manuf. 2019, 4, 245–267. [Google Scholar] [CrossRef]
  4. Badiru, A.B.; Valencia, V.V.; Liu, D. (Eds.) Additive Manufacturing Handbook: Product Development for the Defense Industry; CRC Press: Boca Raton, FL, USA, 2017. [Google Scholar]
  5. Dumitrescu, I.B.; Lupuliasa, D.; Drăgoi, C.M.; Nicolae, A.C.; Pop, A.; Șaramet, G.; Drăgănescu, D. The age of pharmaceutical 3D printing. Technological and therapeutical implications of additive manufacturing. Farmacia 2018, 66, 365–389. [Google Scholar] [CrossRef]
  6. Marques, T.H.R.; Lima, B.M.; Osório, J.H.; da Silva, L.E.; Cordeiro, C.M.B. 3D Printed Microstructured Optical Fibers. In Proceedings of the 2017 SBMO/IEEE MTT-S International Microwave and Optoelectronics Conference (IMOC), Aguas de Lindoia, Brazil, 27–30 August 2017; pp. 1–3. [Google Scholar]
  7. Van der Elst, L.; de Lima, C.F.; Kurtoglu, M.G.; Koraganji, V.N.; Zheng, M.; Gumennik, A. 3D Printing in Fiber-Device Technology. Adv. Fiber Mater. 2021, 3, 59–75. [Google Scholar] [CrossRef]
  8. Colella, R.; Chietera, F.P.; Catarinucci, L. Analysis of FDM and DLP 3D-Printing Technologies to Prototype Electromagnetic Devices for RFID Applications. Sensors 2021, 21, 897. [Google Scholar] [CrossRef]
  9. Biswas, S.; Lu, A.; Larimore, Z.; Parsons, P.; Good, A.; Hudak, N.; Garrett, B.; Suarez, J.; Mirotznik, M.S. Realization of modified Luneburg lens antenna using quasi-conformal transformation optics and additive manufacturing. Microw. Opt. Technol. Lett. 2019, 61, 1022–1029. [Google Scholar] [CrossRef]
  10. Good, B.; Ransom, P.; Simmons, S.; Good, A.; Mirotznik, M.S. Design of graded index flat lenses with integrated antireflective properties. Microw. Opt. Technol. Lett. 2012, 54, 2774–2781. [Google Scholar] [CrossRef]
  11. Liu, G.D.; Wang, C.H.; Jia, Z.L.; Wang, K.X. An Integrative 3D printing method for rapid additive manufacturing of a capacitive force sensor. J. Micromech. Microeng. 2021, 31, 065005. [Google Scholar] [CrossRef]
  12. Li, X.-R.; Liu, Z.; Li, W.-D.; Sun, G.-Y.; Xue, J.-Y.; Wang, C.; Zhang, G.-J. 3D printing fabrication of conductivity non-uniform insulator for surface flashover mitigation. IEEE Trans. Dielectr. Electr. Insul. 2019, 26, 1172–1180. [Google Scholar] [CrossRef]
  13. Kojima, H.; Hayakawa, N.; Kato, K.; Zebouchi, N. Electric Field Simulation of Permittivity and Conductivity Graded Materials (ε/σ-FGM) for HVDC GIS Spacers. IEEE Trans. Dielectr. Electr. Insul. 2021, 28, 736–744. [Google Scholar]
  14. Veselý, P.; Tichý, T.; Šefl, O.; Horynová, E. Evaluation of dielectric properties of 3D printed objects based on printing resolution. In IOP Conference Series: Materials Science and Engineering; IOP Publishing: Bristol, UK, 2018; Volume 461, p. 012091. [Google Scholar]
  15. Hoff, B.W.; Maestas, S.S.; Hayden, S.C.; Harrigan, D.J.; Grudt, R.O.; Ostraat, M.L.; Horwath, J.C.; Leontsev, S. Dielectric strength heterogeneity associated with printing orientation in additively manufactured polymer materials. Addit. Manuf. 2018, 22, 21–30. [Google Scholar] [CrossRef]
  16. Kurimoto, M.; Manabe, Y.; Mitsumoto, S.; Suzuoki, Y. Layer interface effects on dielectric breakdown strength of 3D printed rubber insulator using stereolithography. Addit. Manuf. 2021, 46, 102069. [Google Scholar] [CrossRef]
  17. Vyavahare, S.; Teraiya, S.; Panghal, D.; Kumar, S. Fused deposition modelling: A review. Rapid Prototyp. J. 2020, 26, 176–201. [Google Scholar] [CrossRef]
  18. Sathies, T.; Senthil, P.; Anoop, M.S. A review on advancements in applications of fused deposition modelling process. Rapid Prototyp. J. 2020, 26, 669–687. [Google Scholar]
  19. Cano-Vicent, A.; Tambuwala, M.M.; Hassan, S.S.; Barh, D.; Aljabali, A.A.A.; Birkett, M.; Arjunan, A.; Serrano-Aroca, A. Fused deposition modelling: Current status, methodology, applications and future prospects. Addit. Manuf. 2021, 47, 102378. [Google Scholar] [CrossRef]
  20. Mohamed, O.A.; Masood, S.H.; Bhowmik, J.L. Optimization of fused deposition modeling process parameters: A review of current research and future prospects. Adv. Manuf. 2015, 3, 42–53. [Google Scholar] [CrossRef]
  21. Dey, A.; Yodo, N. A systematic survey of FDM process parameter optimization and their influence on part characteristics. J. Manuf. Mater. Process. 2019, 3, 64. [Google Scholar] [CrossRef] [Green Version]
  22. Sheoran, A.J.; Kumar, H. Fused Deposition modeling process parameters optimization and effect on mechanical properties and part quality: Review and reflection on present research. Mater. Today Proc. 2020, 21, 1659–1672. [Google Scholar] [CrossRef]
  23. Wang, X.; Zhao, L.; Fuh, J.Y.H.; Lee, H.P. Effect of porosity on mechanical properties of 3D printed polymers: Experiments and micromechanical modeling based on X-ray computed tomography analysis. Polymers 2019, 11, 1154. [Google Scholar] [CrossRef] [Green Version]
  24. Liao, Y.; Liu, C.; Coppola, B.; Barra, G.; Di Maio, L.; Incarnato, L.; Lafdi, K. Effect of porosity and crystallinity on 3D printed PLA properties. Polymers 2019, 11, 1487. [Google Scholar] [CrossRef] [Green Version]
  25. Bawuah, P.; Markl, D.; Farrell, D.; Evans, M.; Portieri, A.; Anderson, A.; Goodwin, D.; Lucas, F.; Zeitler, J.A. Terahertz-based porosity measurement of pharmaceutical tablets: A tutorial. J. Infrared Millim. Terahertz Waves 2020, 41, 450–469. [Google Scholar] [CrossRef] [Green Version]
  26. Lu, X.; Sun, H.; Chang, T.; Zhang, J.; Cui, H.-L. Terahertz detection of porosity and porous microstructure in pharmaceutical tablets: A review. Int. J. Pharm. 2020, 591, 120006. [Google Scholar] [CrossRef]
  27. Hakobyan, D.; Hamdi, M.; Redon, O.; Ballestero, A.; Mayaudon, A.; Boyer, L.; Durand, O.; Abraham, E. Non-destructive evaluation of ceramic porosity using terahertz time-domain spectroscopy. J. Eur. Ceram. Soc. 2021, 42, 525–533. [Google Scholar] [CrossRef]
  28. Krumbholz, N.; Hochrein, T.; Vieweg, N.; Hasek, T.; Kretschmer, K.; Bastian, M.; Mikulics, M.; Koch, M. Monitoring polymeric compounding processes inline with THz time-domain spectroscopy. Polym. Test. 2009, 28, 30–35. [Google Scholar] [CrossRef]
  29. Wietzke, S.; Jansen, C.; Reuter, M.; Jung, T.; Kraft, D.; Chatterjee, S.; Fischer, B.M.; Koch, M. Terahertz spectroscopy on polymers: A review of morphological studies. J. Mol. Struct. 2011, 1006, 41–51. [Google Scholar] [CrossRef]
  30. Yakovlev, E.V.; Zaytsev, K.I.; Dolganova, I.N.; Yurchenko, S.O. Non-destructive evaluation of polymer composite materials at the manufacturing stage using terahertz pulsed spectroscopy. IEEE Trans. Terahertz Sci. Technol. 2015, 5, 810–816. [Google Scholar] [CrossRef]
  31. Sommer, S.; Raidt, T.; Fischer, B.M.; Katzenberg, F.; Tiller, J.C.; Koch, M. THz-spectroscopy on high density polyethylene with different crystallinity. J. Infrared Millim. Terahertz Waves 2016, 37, 189–197. [Google Scholar] [CrossRef]
  32. Engelbrecht, S.; Tybussek, K.-H.; Sampaio, J.; Böhmler, J.; Fischer, B.M.; Sommer, S. Monitoring the Isothermal Crystallization Kinetics of PET-A Using THz-TDS. J. Infrared Millim. Terahertz Waves 2019, 40, 306–313. [Google Scholar] [CrossRef]
  33. Castro-Camus, E.; Koch, M.; Hernandez-Serrano, A.I. Additive manufacture of photonic components for the terahertz band. J. Appl. Phys. 2020, 127, 210901. [Google Scholar] [CrossRef]
  34. Ornik, J.; Sakaki, M.; Koch, M.; Balzer, J.C.; Benson, N. 3D Printed Al2O3 for Terahertz Technology. IEEE Access 2020, 9, 5986–5993. [Google Scholar] [CrossRef]
  35. Seifert, J.M.; Hernandez-Cardoso, G.G.; Koch, M.; Castro-Camus, E. Terahertz beam steering using active diffraction grating fabricated by 3D printing”. Opt. Express 2020, 28, 21737–21744. [Google Scholar] [CrossRef]
  36. Rohrbach, D.; Kang, B.J.; Feurer, T. 3D-printed THz wave-and phaseplates. Opt. Express 2021, 29, 27160–27170. [Google Scholar] [CrossRef] [PubMed]
  37. Busch, S.F.; Weidenbach, M.; Fey, M.; Schäfer, F.; Probst, T.; Koch, M. Optical properties of 3D printable plastics in the THz regime and their application for 3D printed THz optics. J. Infrared Millim. Terahertz Waves 2014, 35, 993–997. [Google Scholar] [CrossRef]
  38. Squires, A.D.; Lewis, R.A. Feasibility and characterization of common and exotic filaments for use in 3D printed terahertz devices. J. Infrared Millim. Terahertz Waves 2018, 39, 614–635. [Google Scholar] [CrossRef] [Green Version]
  39. Matmatch. PETG vs. PLA. Available online: https://matmatch.com/learn/material/petg-vs-pla (accessed on 23 December 2021).
  40. Iiyama, K.; Ishida, T.; Ono, Y.; Maruyama, T.; Yamagishi, T. Fabrication and characterization of amorphous polyethylene terephthalate optical waveguides. IEEE Photonics Technol. Lett. 2011, 23, 275–277. [Google Scholar] [CrossRef] [Green Version]
  41. Ashby, M.F.; Shercliff, H.; Cebon, D. Materials: Engineering, Science, Processing and Design; Butterworth-Heinemann: Oxford, UK, 2018. [Google Scholar]
  42. Hsueh, M.-H.; Lai, C.-J.; Wang, S.-H.; Zeng, Y.-S.; Hsieh, C.-H.; Pan, C.-Y.; Huang, W.-C. Effect of Printing Parameters on the Thermal and Mechanical Properties of 3D-Printed PLA and PETG, Using Fused Deposition Modeling. Polymers 2021, 13, 1758. [Google Scholar] [CrossRef] [PubMed]
  43. Algarni, M.; Ghazali, S. Comparative study of the sensitivity of PLA, ABS, PEEK, and PETG’s mechanical properties to FDM printing process parameters. Crystals 2021, 11, 995. [Google Scholar] [CrossRef]
  44. Barrios, J.M.; Romero, P.E. Improvement of surface roughness and hydrophobicity in PETG parts manufactured via fused deposition modeling (FDM): An application in 3D printed self–cleaning parts. Materials 2019, 12, 2499. [Google Scholar] [CrossRef] [Green Version]
  45. Kumar, M.A.; Khan, M.S.; Mishra, S.B. Effect of machine parameters on strength and hardness of FDM printed carbon fiber reinforced PETG thermoplastics. Mater. Today Proc. 2020, 27, 975–983. [Google Scholar] [CrossRef]
  46. PETG Filament—Complete 3D Printing Guide [2021]; STANDARD PRINT CO: Sydney, Australia, 2021.
  47. Jepsen, P.U.; Cooke, D.G.; Koch, M. Terahertz spectroscopy and imaging-Modern techniques and applications. Laser Photon. Rev. 2010, 5, 124–166. [Google Scholar] [CrossRef]
  48. Neu, J.; Schmuttenmaer, C.A. Tutorial: An introduction to terahertz time domain spectroscopy (THz-TDS). J. Appl. Phys. 2018, 124, 231101. [Google Scholar] [CrossRef] [Green Version]
  49. Wada, O.; Ramachari, D.; Yang, C.-S.; Uchino, T.; Pan, C.-L. Systematic characterization of THz dielectric properties of multi-component glasses using the unified oscillator model. Opt. Mater. Express 2021, 11, 858–874. [Google Scholar] [CrossRef]
  50. Markl, D.; Strobel, A.; Schlossnikl, R.; Bøtker, J.; Bawuah, P.; Ridgway, C.; Rantanen, J.; Rades, T.; Gane, P.; Peiponen, K.-E.; et al. Characterisation of pore structures of pharmaceutical tablets: A review. Int. J. Pharm. 2018, 538, 188–214. [Google Scholar] [CrossRef] [PubMed] [Green Version]
  51. Hill, K.O. Fiber Bragg Gratings. In Handbook of Optics, 3rd ed.; Bass, M., Ed.; McGraw Hill: New York, NY, USA, 2010; Volume 5, Chapter 17. [Google Scholar]
Figure 1. The chemical structure of polyethylene terephthalate glycol (PETG): (C16H18O4)n [39]. (Figure courtesy of Keir Murphy, University of Strathclyde, UK.)
Applsci 12 00927 g001
Figure 2. Photographs of 3D printed PETG samples: (a) linear pattern; (b) circular pattern; (c) cross-hatch pattern.
Applsci 12 00927 g002
Figure 3. Effective refractive index (a) and loss coefficient (b) of two 3D printed samples (D and E) and of solid PETG. The inset in (b) shows the power-law relationship in the solid material.
Applsci 12 00927 g003
Figure 4. Effects of layer height and thick/thin printing on the porosity (a) and diffraction loss (b) in 3D printed PETG samples. Dashed lines are guides to the eye.
Applsci 12 00927 g004
Figure 5. Effects of layer nozzle diameter, together with layer height, on the porosity (a) and diffraction loss (b) in 3D printed PETG samples. Dashed lines are guides to the eye.
Applsci 12 00927 g005
Figure 6. Effects of extrusion on the porosity (a) and diffraction loss (b) in 3D printed PETG samples. Dashed lines are guides to the eye.
Applsci 12 00927 g006
Figure 7. Effects of the printing pattern on the porosity (a) and diffraction loss (b) in 3D printed PETG samples. The labels “linear para” and “linear perp” refer to the linear pattern oriented parallel and perpendicular to the beam polarisation, respectively.
Applsci 12 00927 g007
Figure 8. Correlation between porosity and the strength of the diffraction peak.
Applsci 12 00927 g008
Figure 9. A schematic drawing of a small part of the cross-section of 3D printed materials, depicting three layers and four end-on tracks. This simple geometric model shows variations in porosity as a function of the printer settings. D is the track diameter; L is the distance between the centres of neighbouring tracks; H is the vertical distance between layers. (a) Cross-hatch pattern, L = D; (b) cross-hatch pattern, L > D; (c) cross-hatch pattern, L < D; (d) circular pattern, hexagonal packing; (e) similar to (a), but with tracks deformed due to melting; (f) layer dimensions.
Applsci 12 00927 g009
Table 1. The printer settings for the 3D samples studied.
SampleNozzle
Diameter (µm)
Layer Height (µm)Thick/Thin
(Width)
ExtrusionPattern
A200100Thick1.0Linear
B200100Thick1.0Circular
C200100Thick1.0Cross-hatch
D200100Thin1.0Cross-hatch
E200150Thin1.0Cross-hatch
F200150Thick1.1Cross-hatch
G200150Thick0.9Cross-hatch
H200150Thick1.0Cross-hatch
I400300Thick1.0Cross-hatch
J400150Thick1.0Cross-hatch
Publisher’s Note: MDPI stays neutral with regard to jurisdictional claims in published maps and institutional affiliations.

