
Performance Analysis of a Waste-to-Energy System Integrated with the Steam–Water Cycle and Urea Hydrolysis Process of a Coal-Fired Power Unit

 ,
,
Abstract
:1. Introduction
2. Methodology
3. System Description
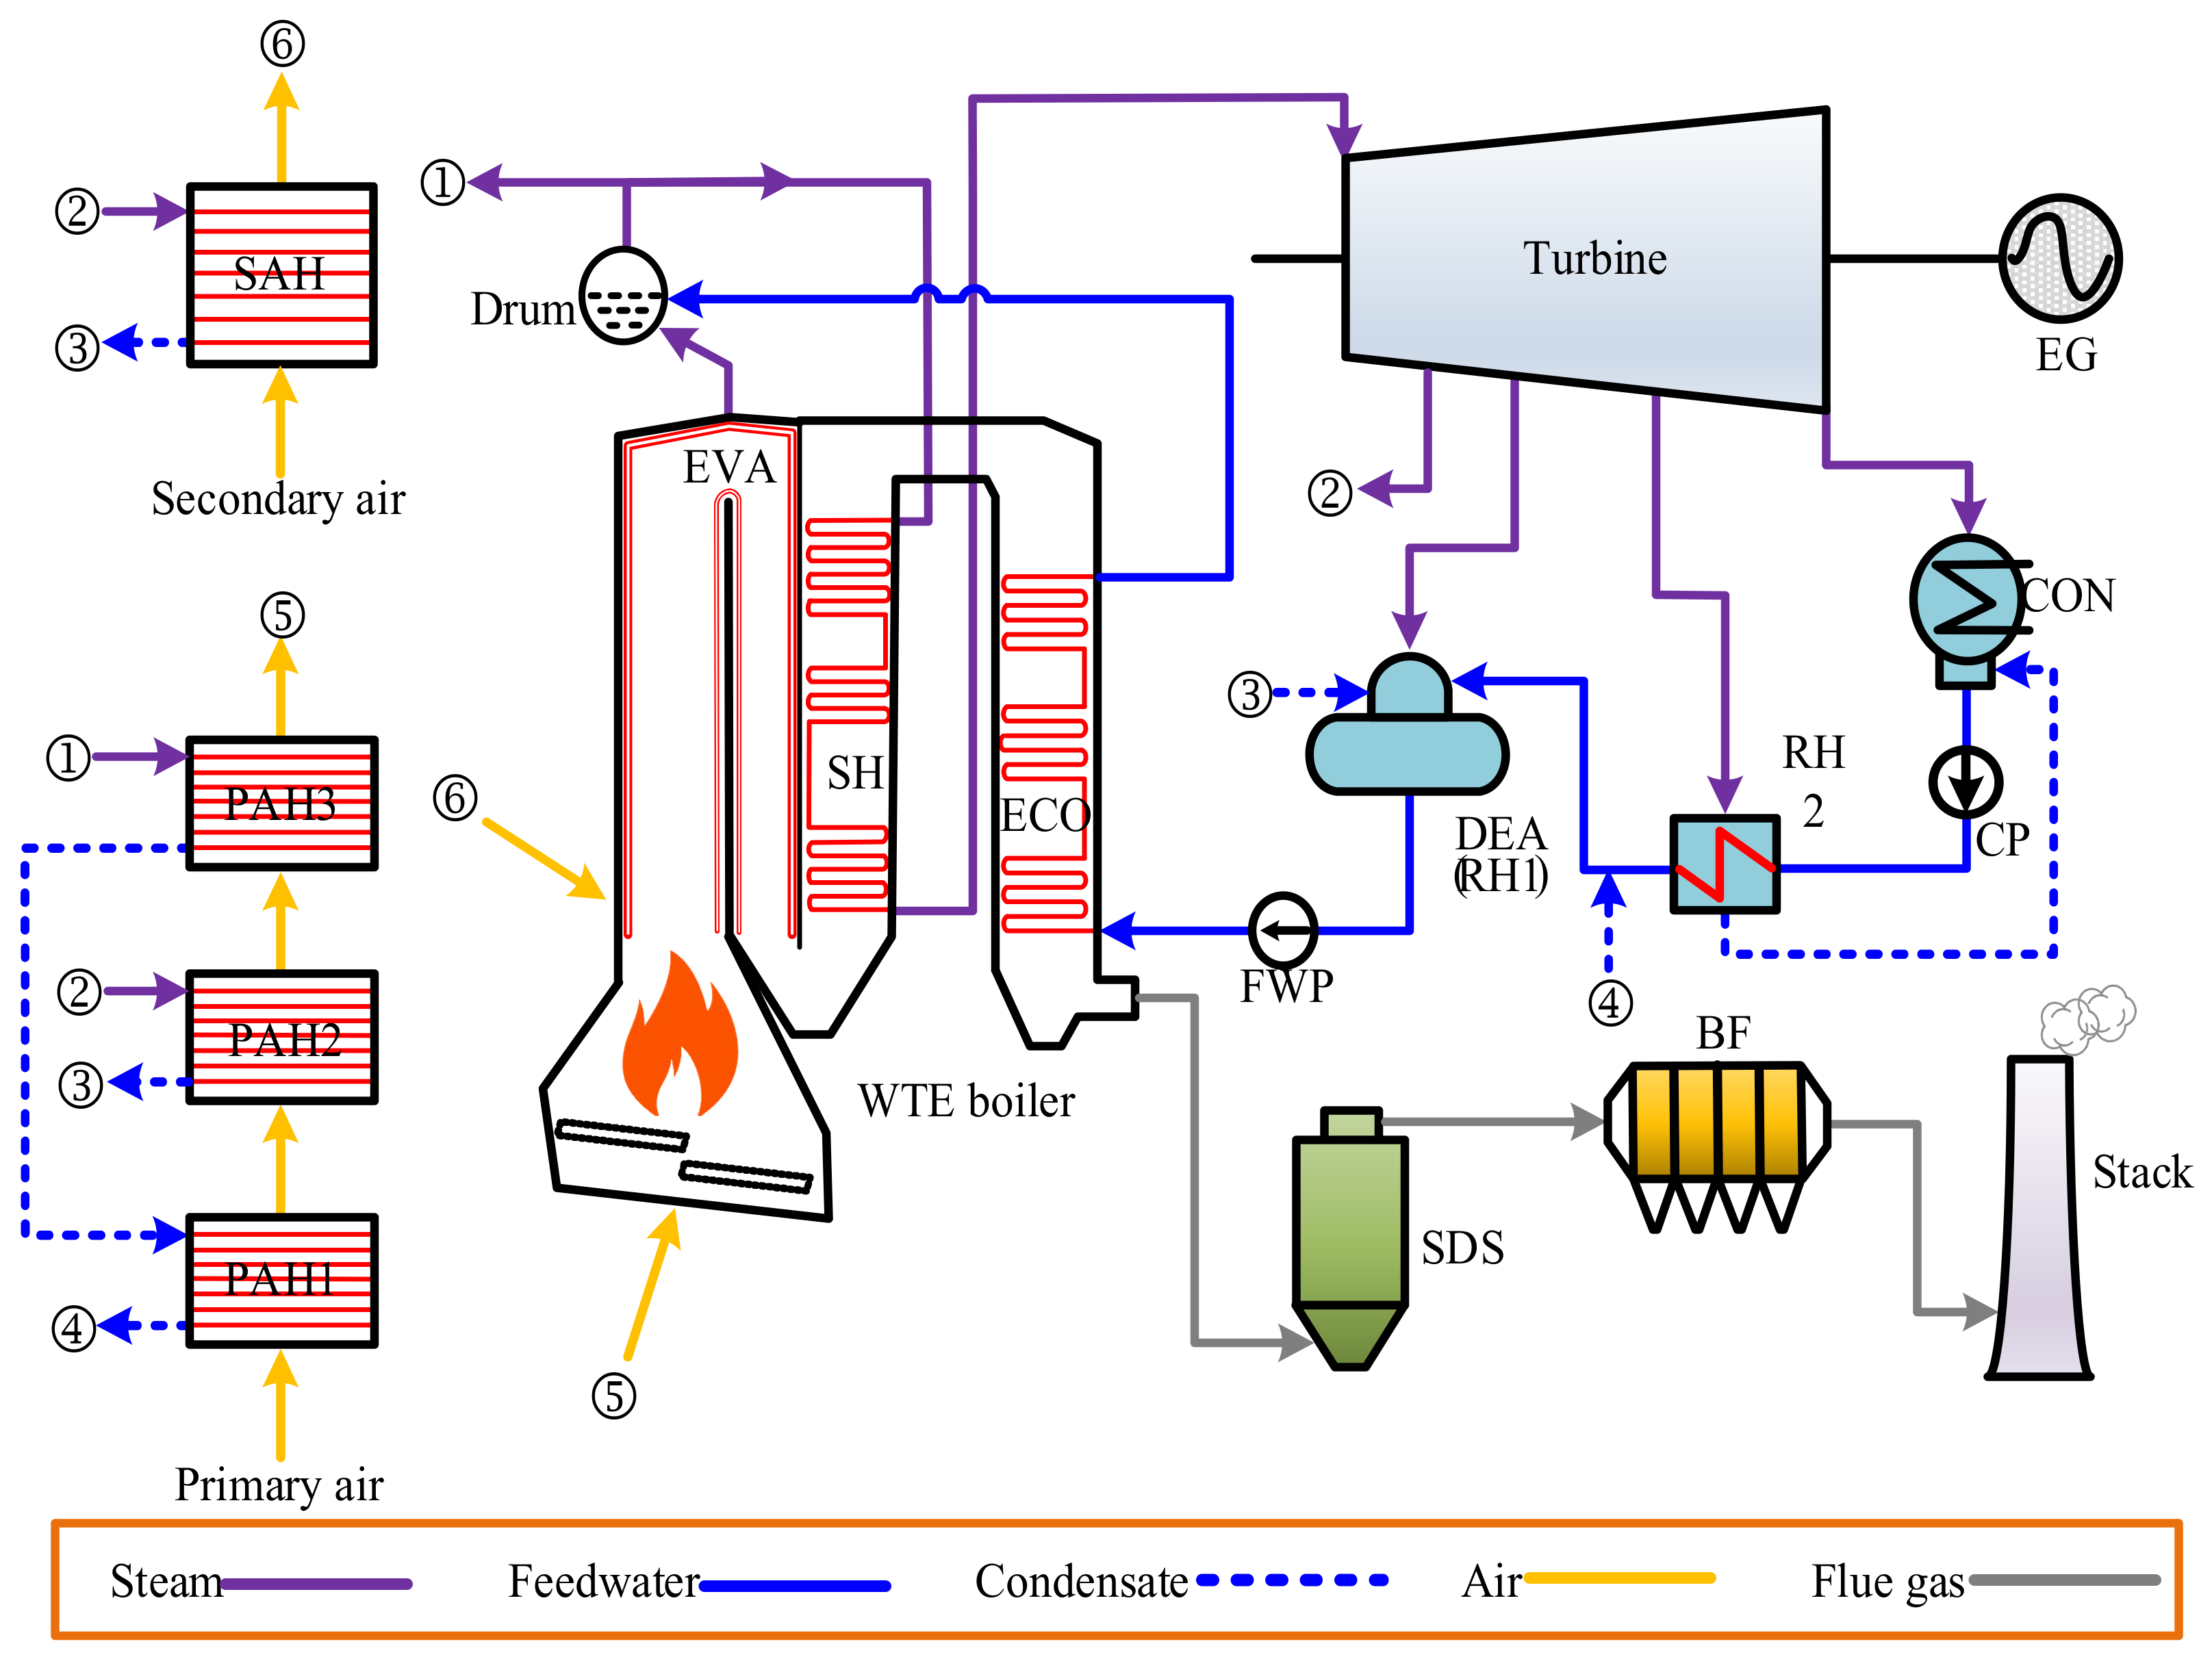
3.1. Reference Waste-to-Energy Unit
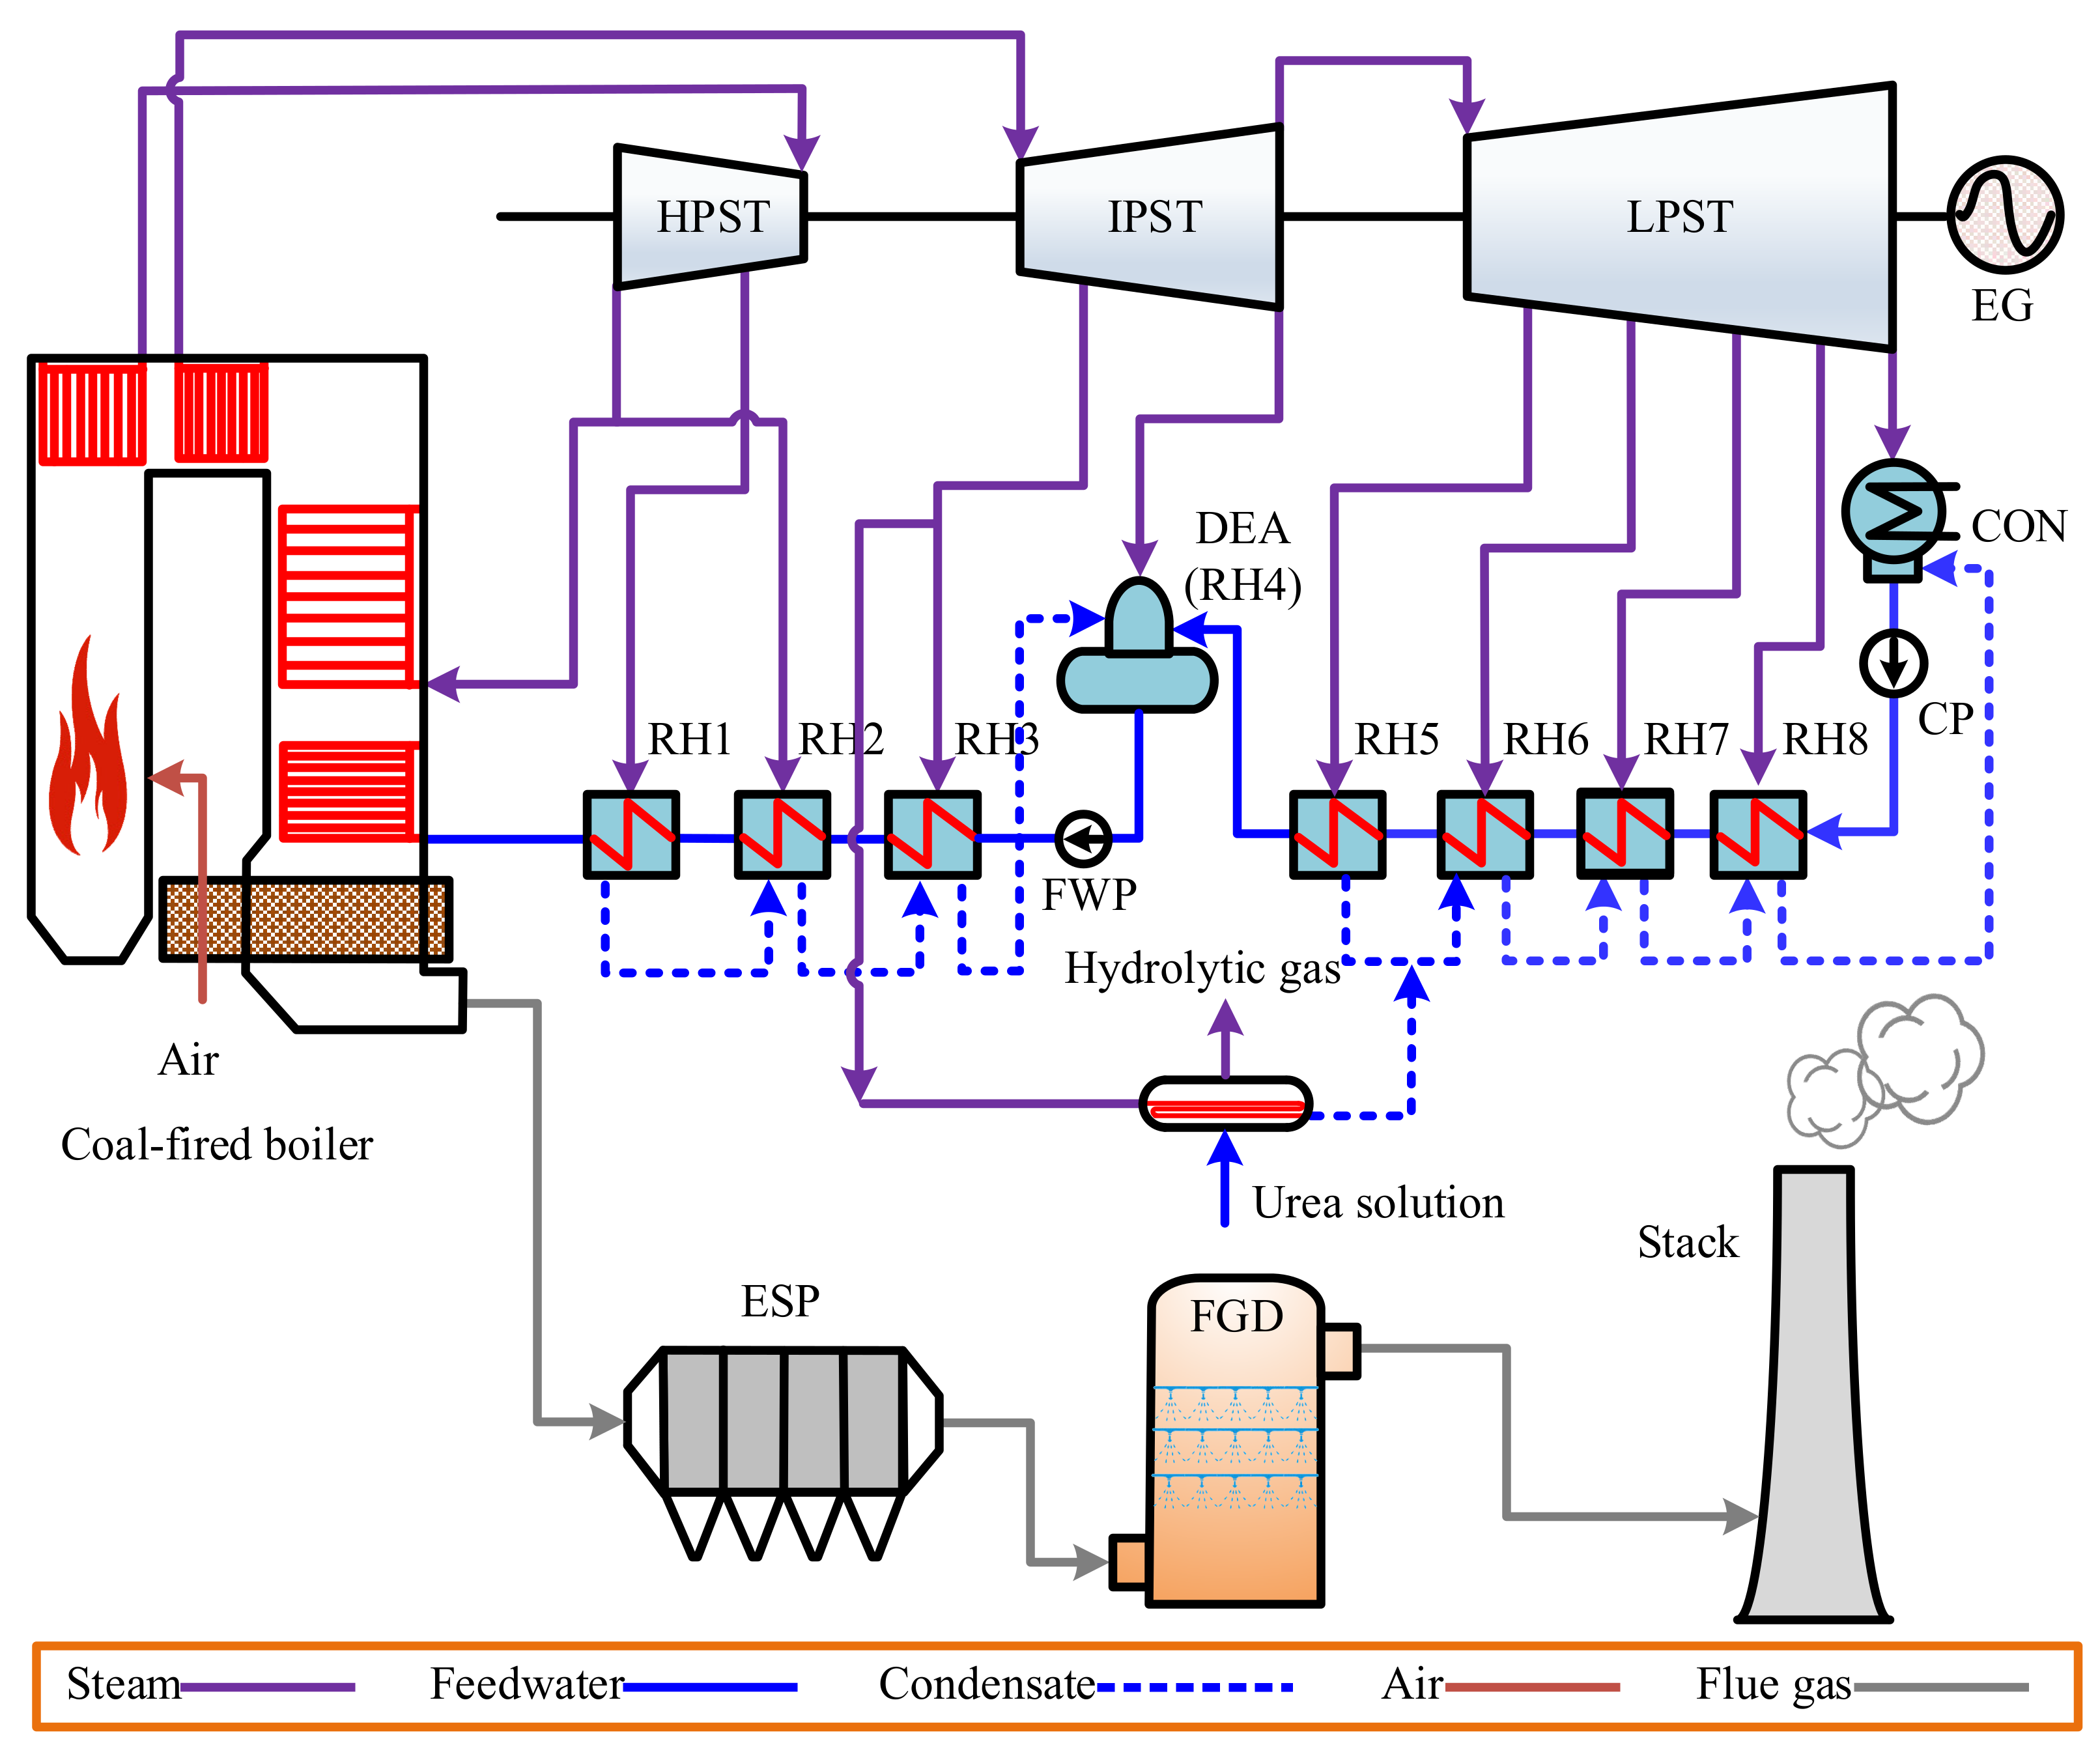
3.2. Reference Coal-Fired Power Unit
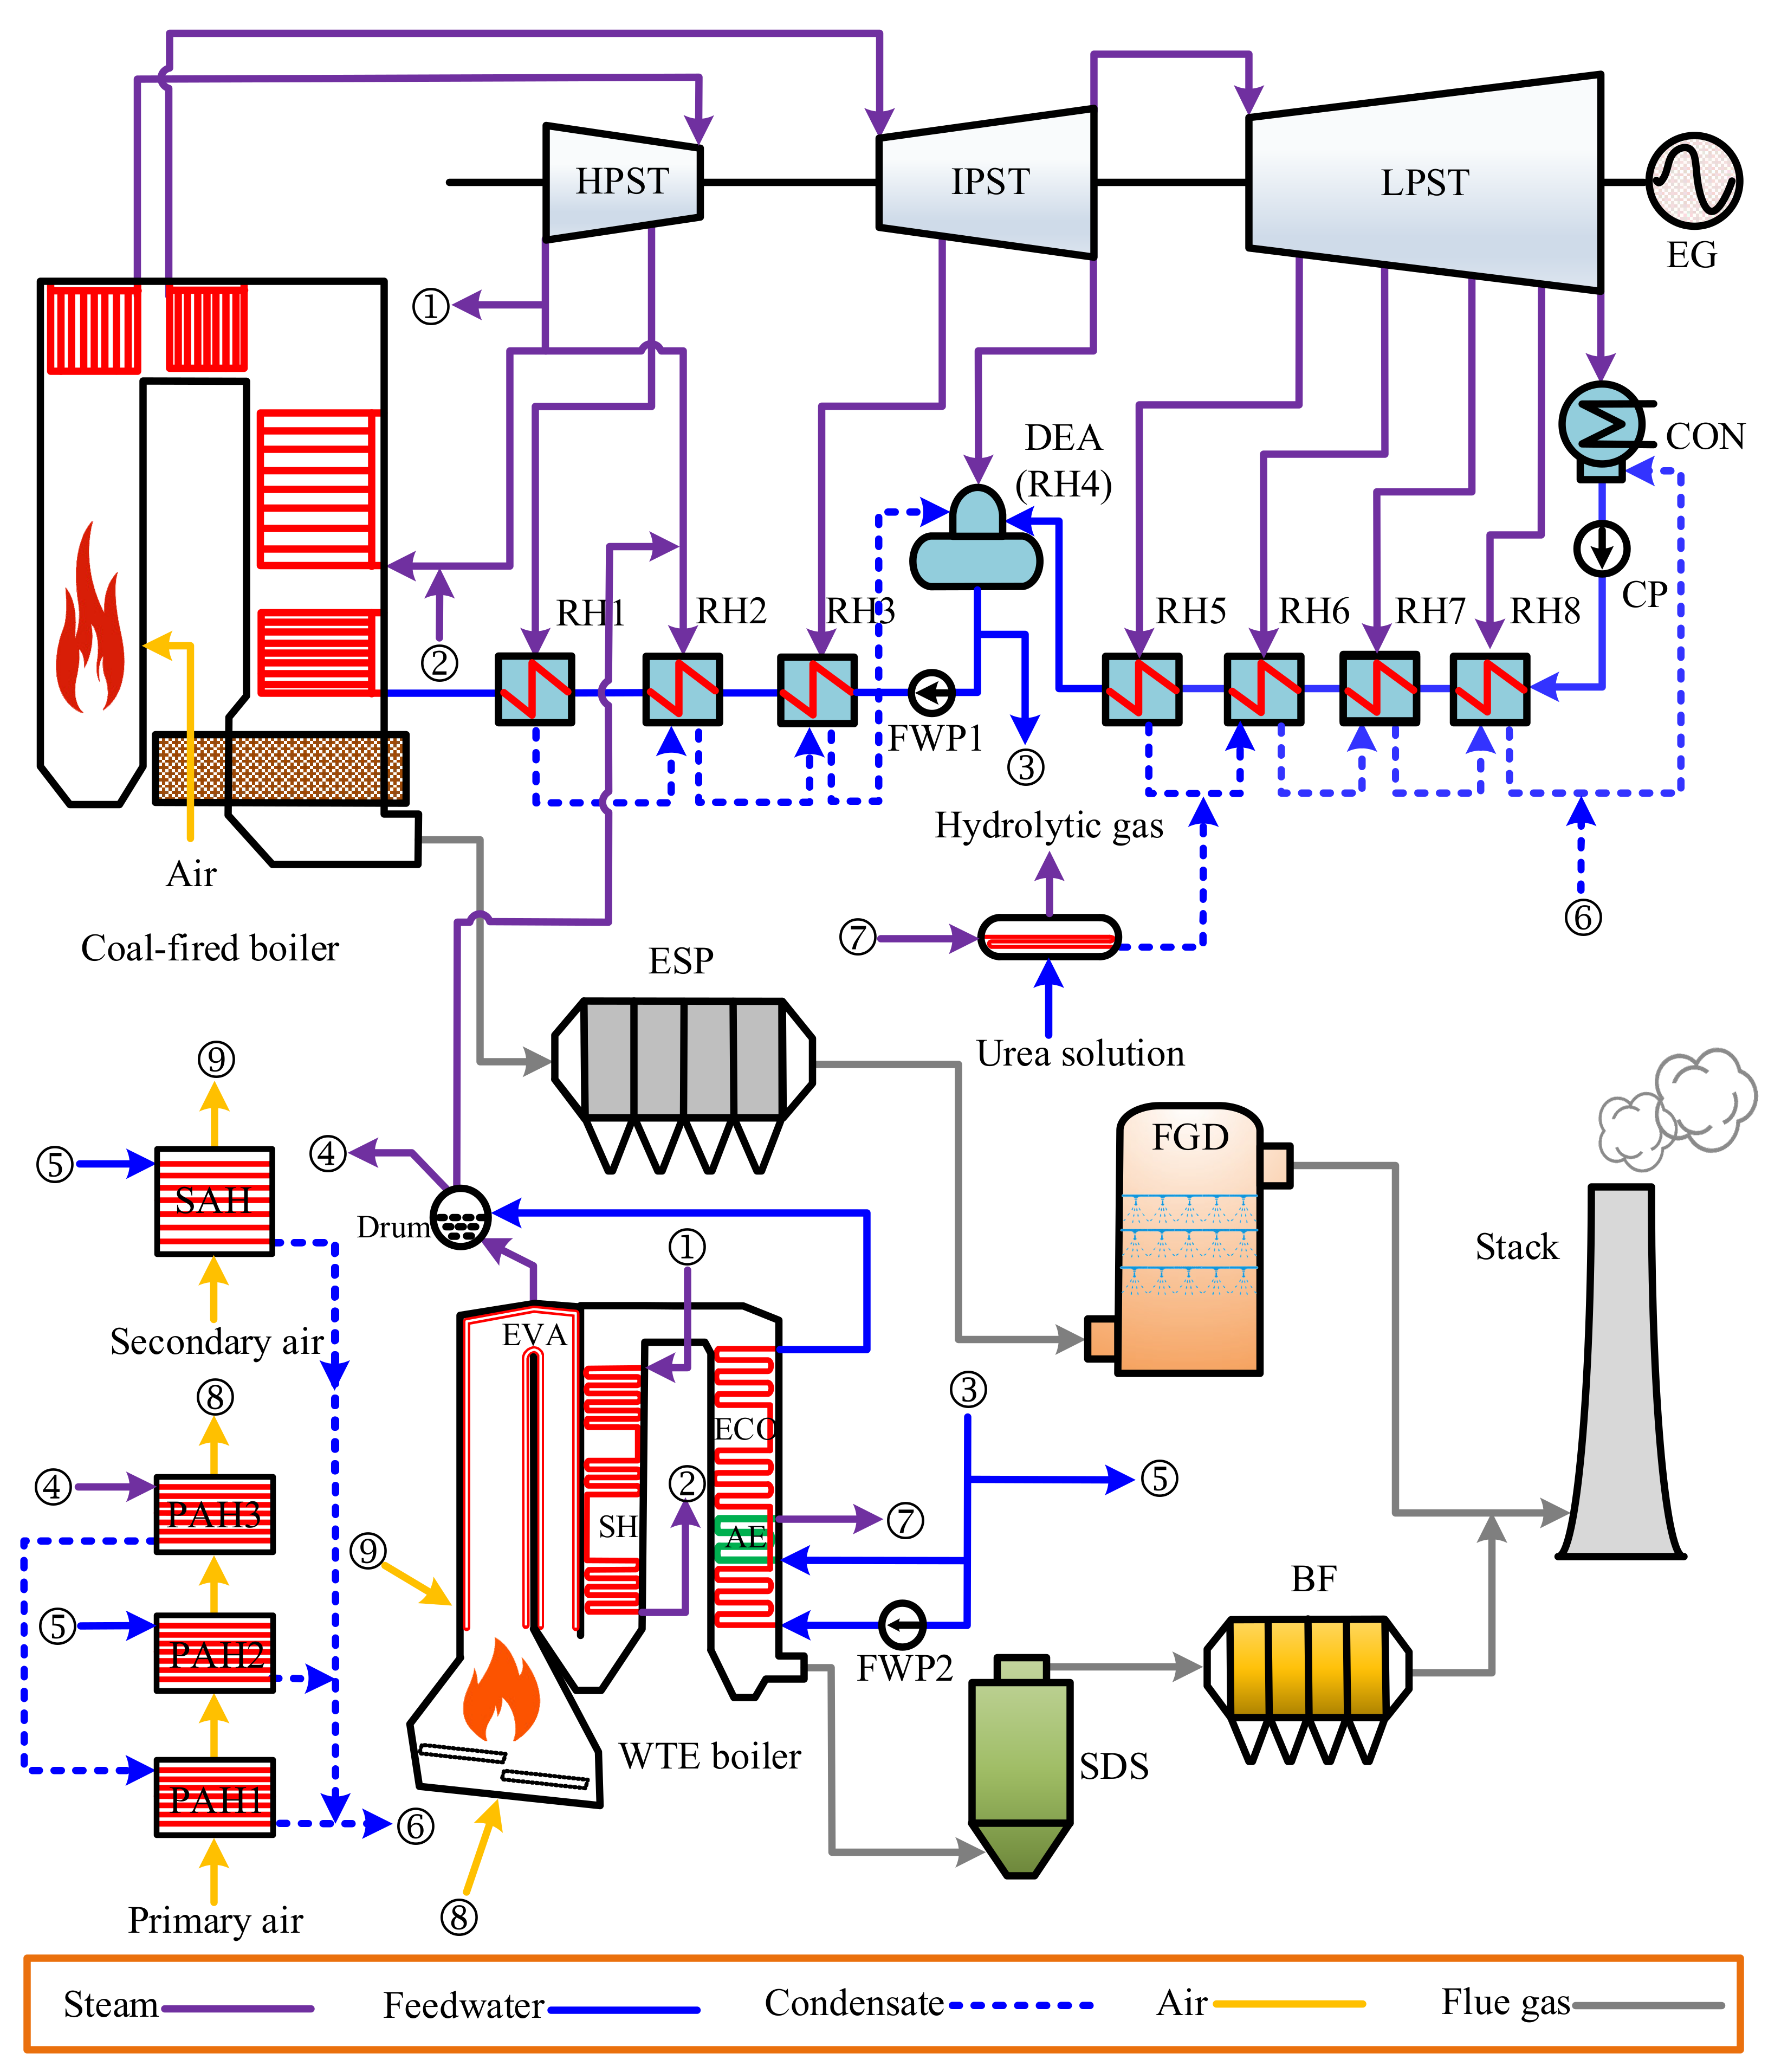
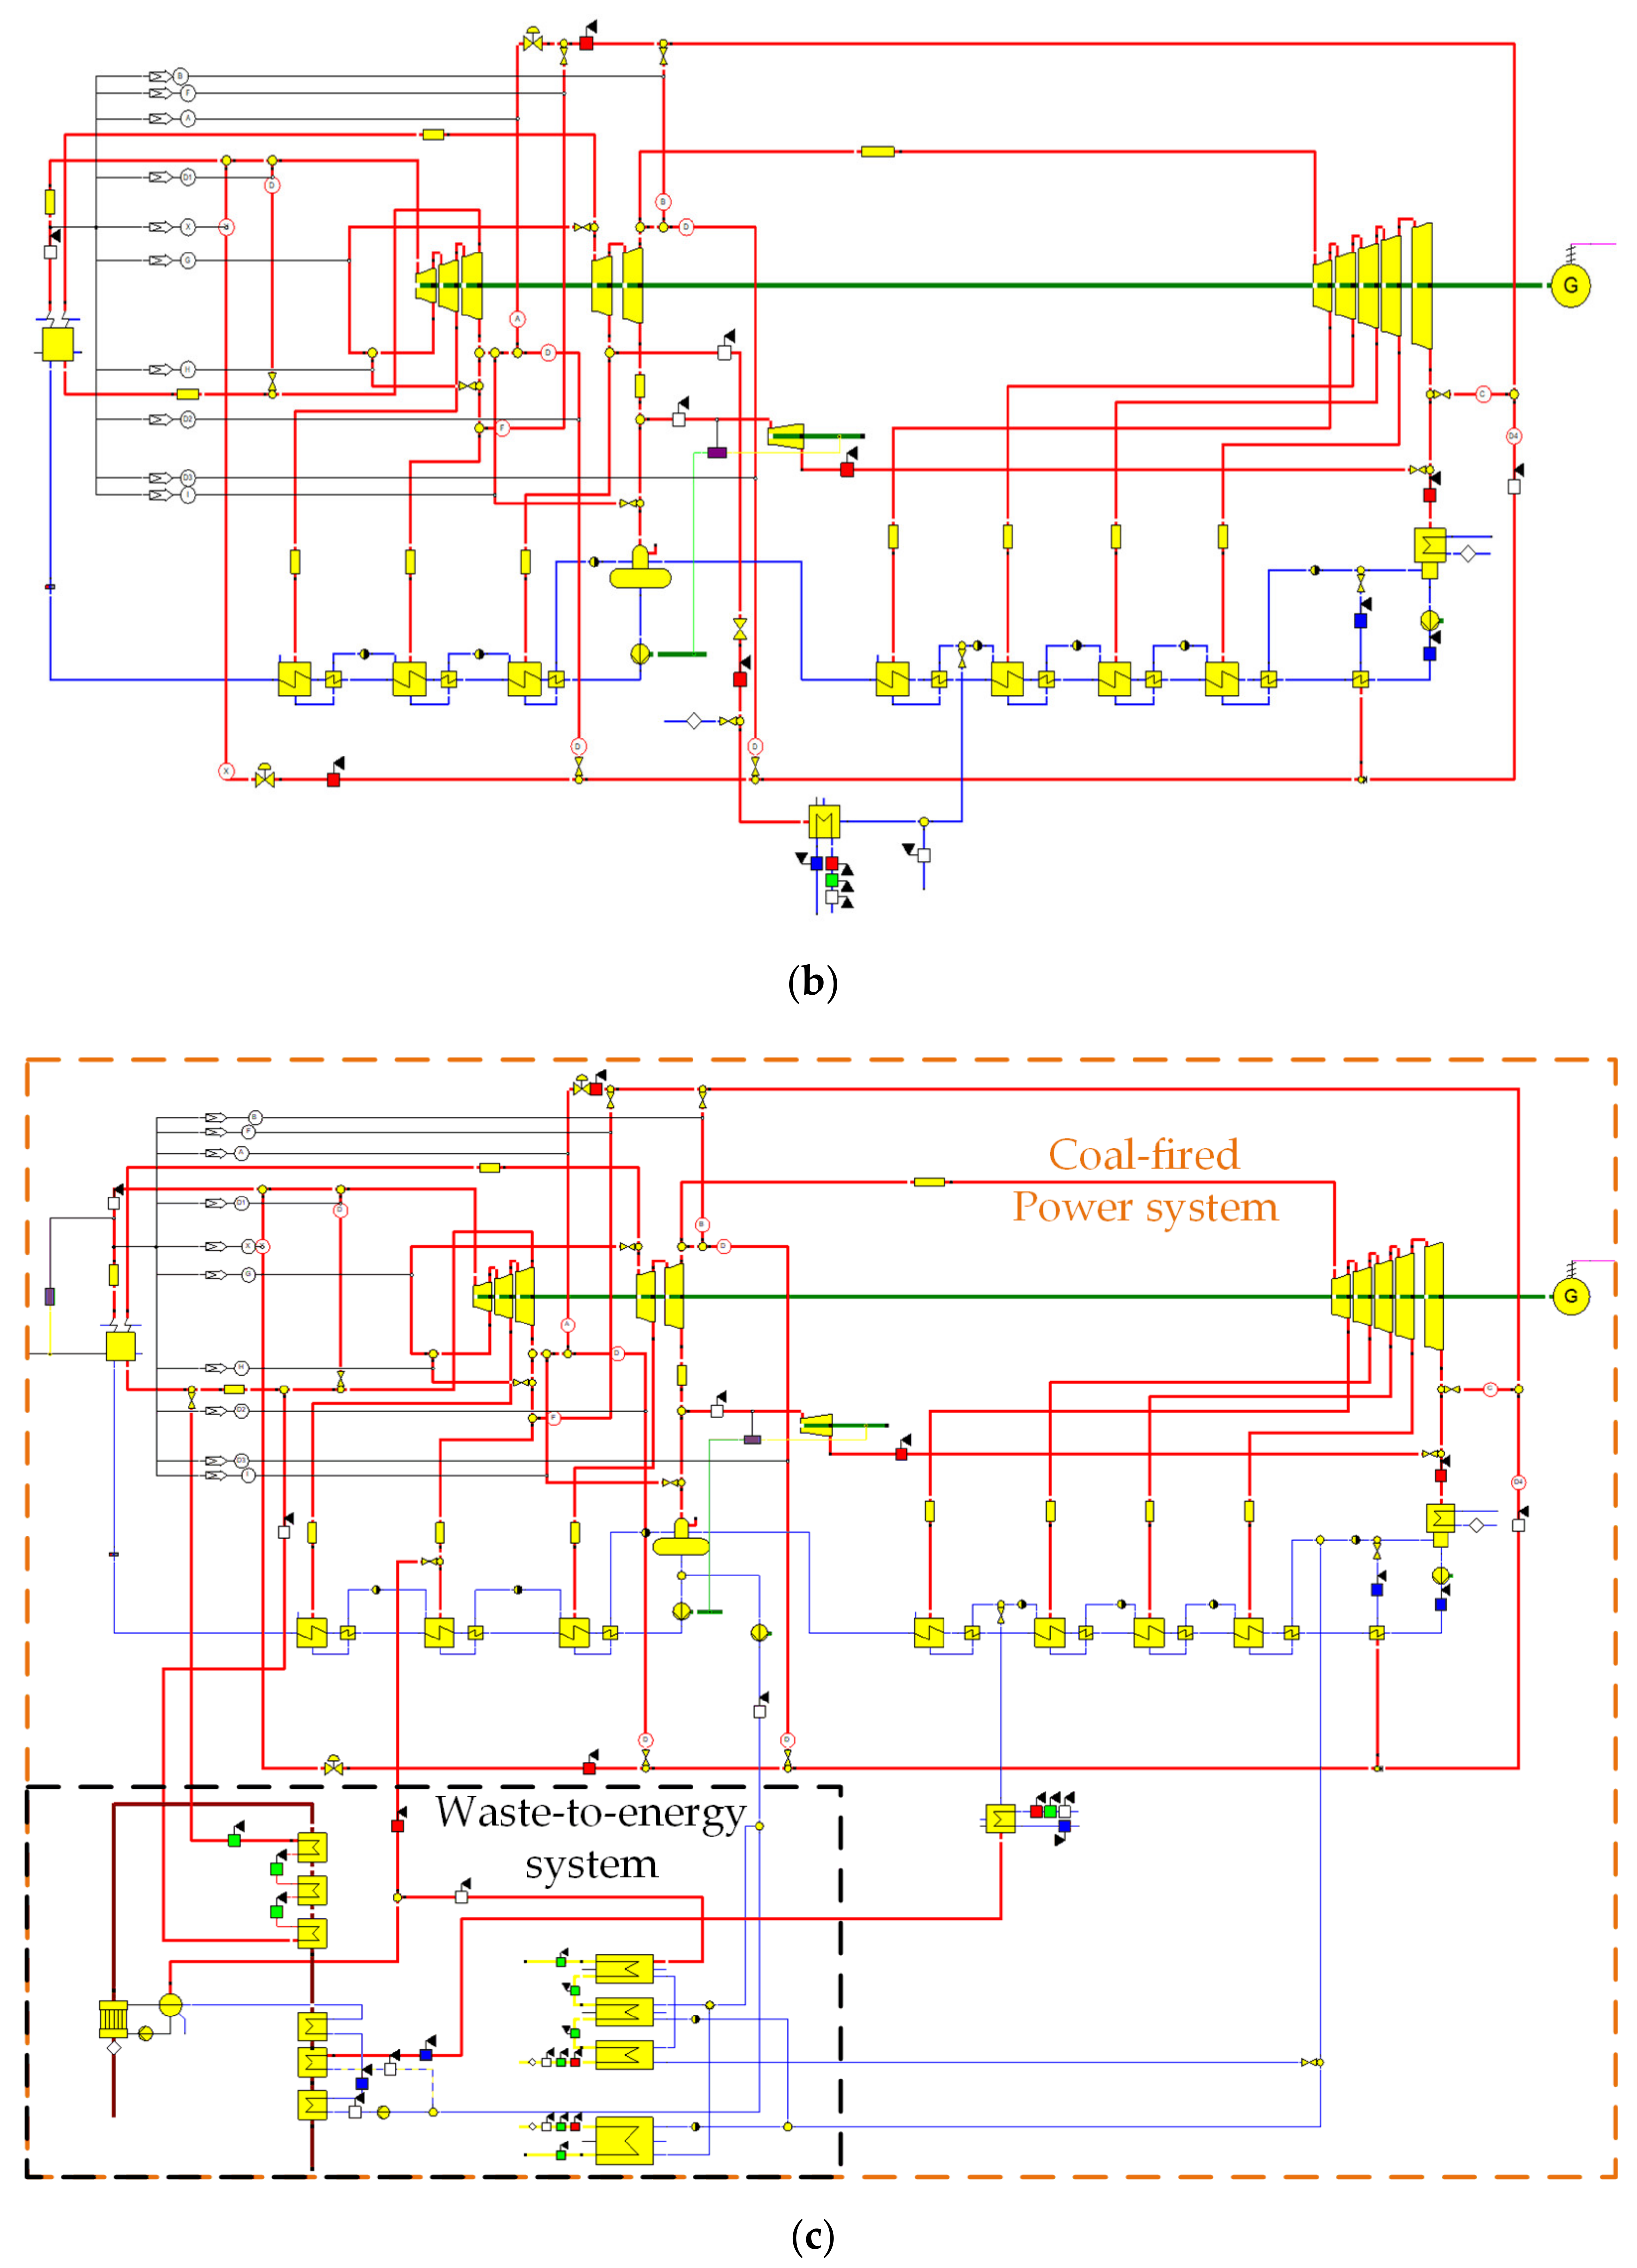
3.3. Proposed Integrated Design
- Remove ST, EG, RHs and condenser (CON) of the WTEU. Both WTEU and CFPU use the steam turbine generator set of CFPU for electricity generation.
- The saturated steam of WTE boiler drum is transported to the second stage extraction steam to heat the feedwater flowing into the RH2.
- The SH of WTEU no longer heats the saturated steam from boiler drum but heat partial exhaust steam from the HPST of CFPU. Then the steam from the SH outlet of WTE boiler returns to the reheater of coal-fired boiler for further heat absorption.
- Since the steam employed in the original urea hydrolyzer derives from the third stage extraction steam of STs of CFPU, decreasing the work output and efficiency of STs. An additional evaporator (AE) is deployed in the ECO space of WTE boiler to supply the heating steam to the urea solution hydrolysis.
- The fluid entering the ECO of WTEU is the feedwater from the DEA outlet of CFPU, and the fluid getting into AE extracts from the feedwater of the suggested WTE system.
- The heat source of PAH2 and SAH is changed from the first stage extraction steam of ST of original WTEU to the feedwater from DEA outlet of CFPU, while the heat source of PAH3 and PAH1 remains unchanged. Then the cooling water from PAH1, PAH2 and SAH gathers and flows into the CON of CFPU with the drain water of RH8.
4. Modeling
4.1. Essential Assumptions
- The temperature of exhaust flue gas in the WTE boiler and its thermal efficiency are constant [31].
- The thermal efficiency of CFPU boiler and its auxiliary power are invariant [31].
- The consumption rates of coal and MSW are unchanged [31].
- The power generated by coal combustion keeps invariable [31].
- The power generation of the WTE system is considered variable [31].
- The ambient pressure and temperature are 1 atm and 15.0 °C, respectively.
4.2. Initial System Modeling
4.3. Integrated System Modeling
5. Thermodynamic Evaluation
5.1. Energy Analysis and Results
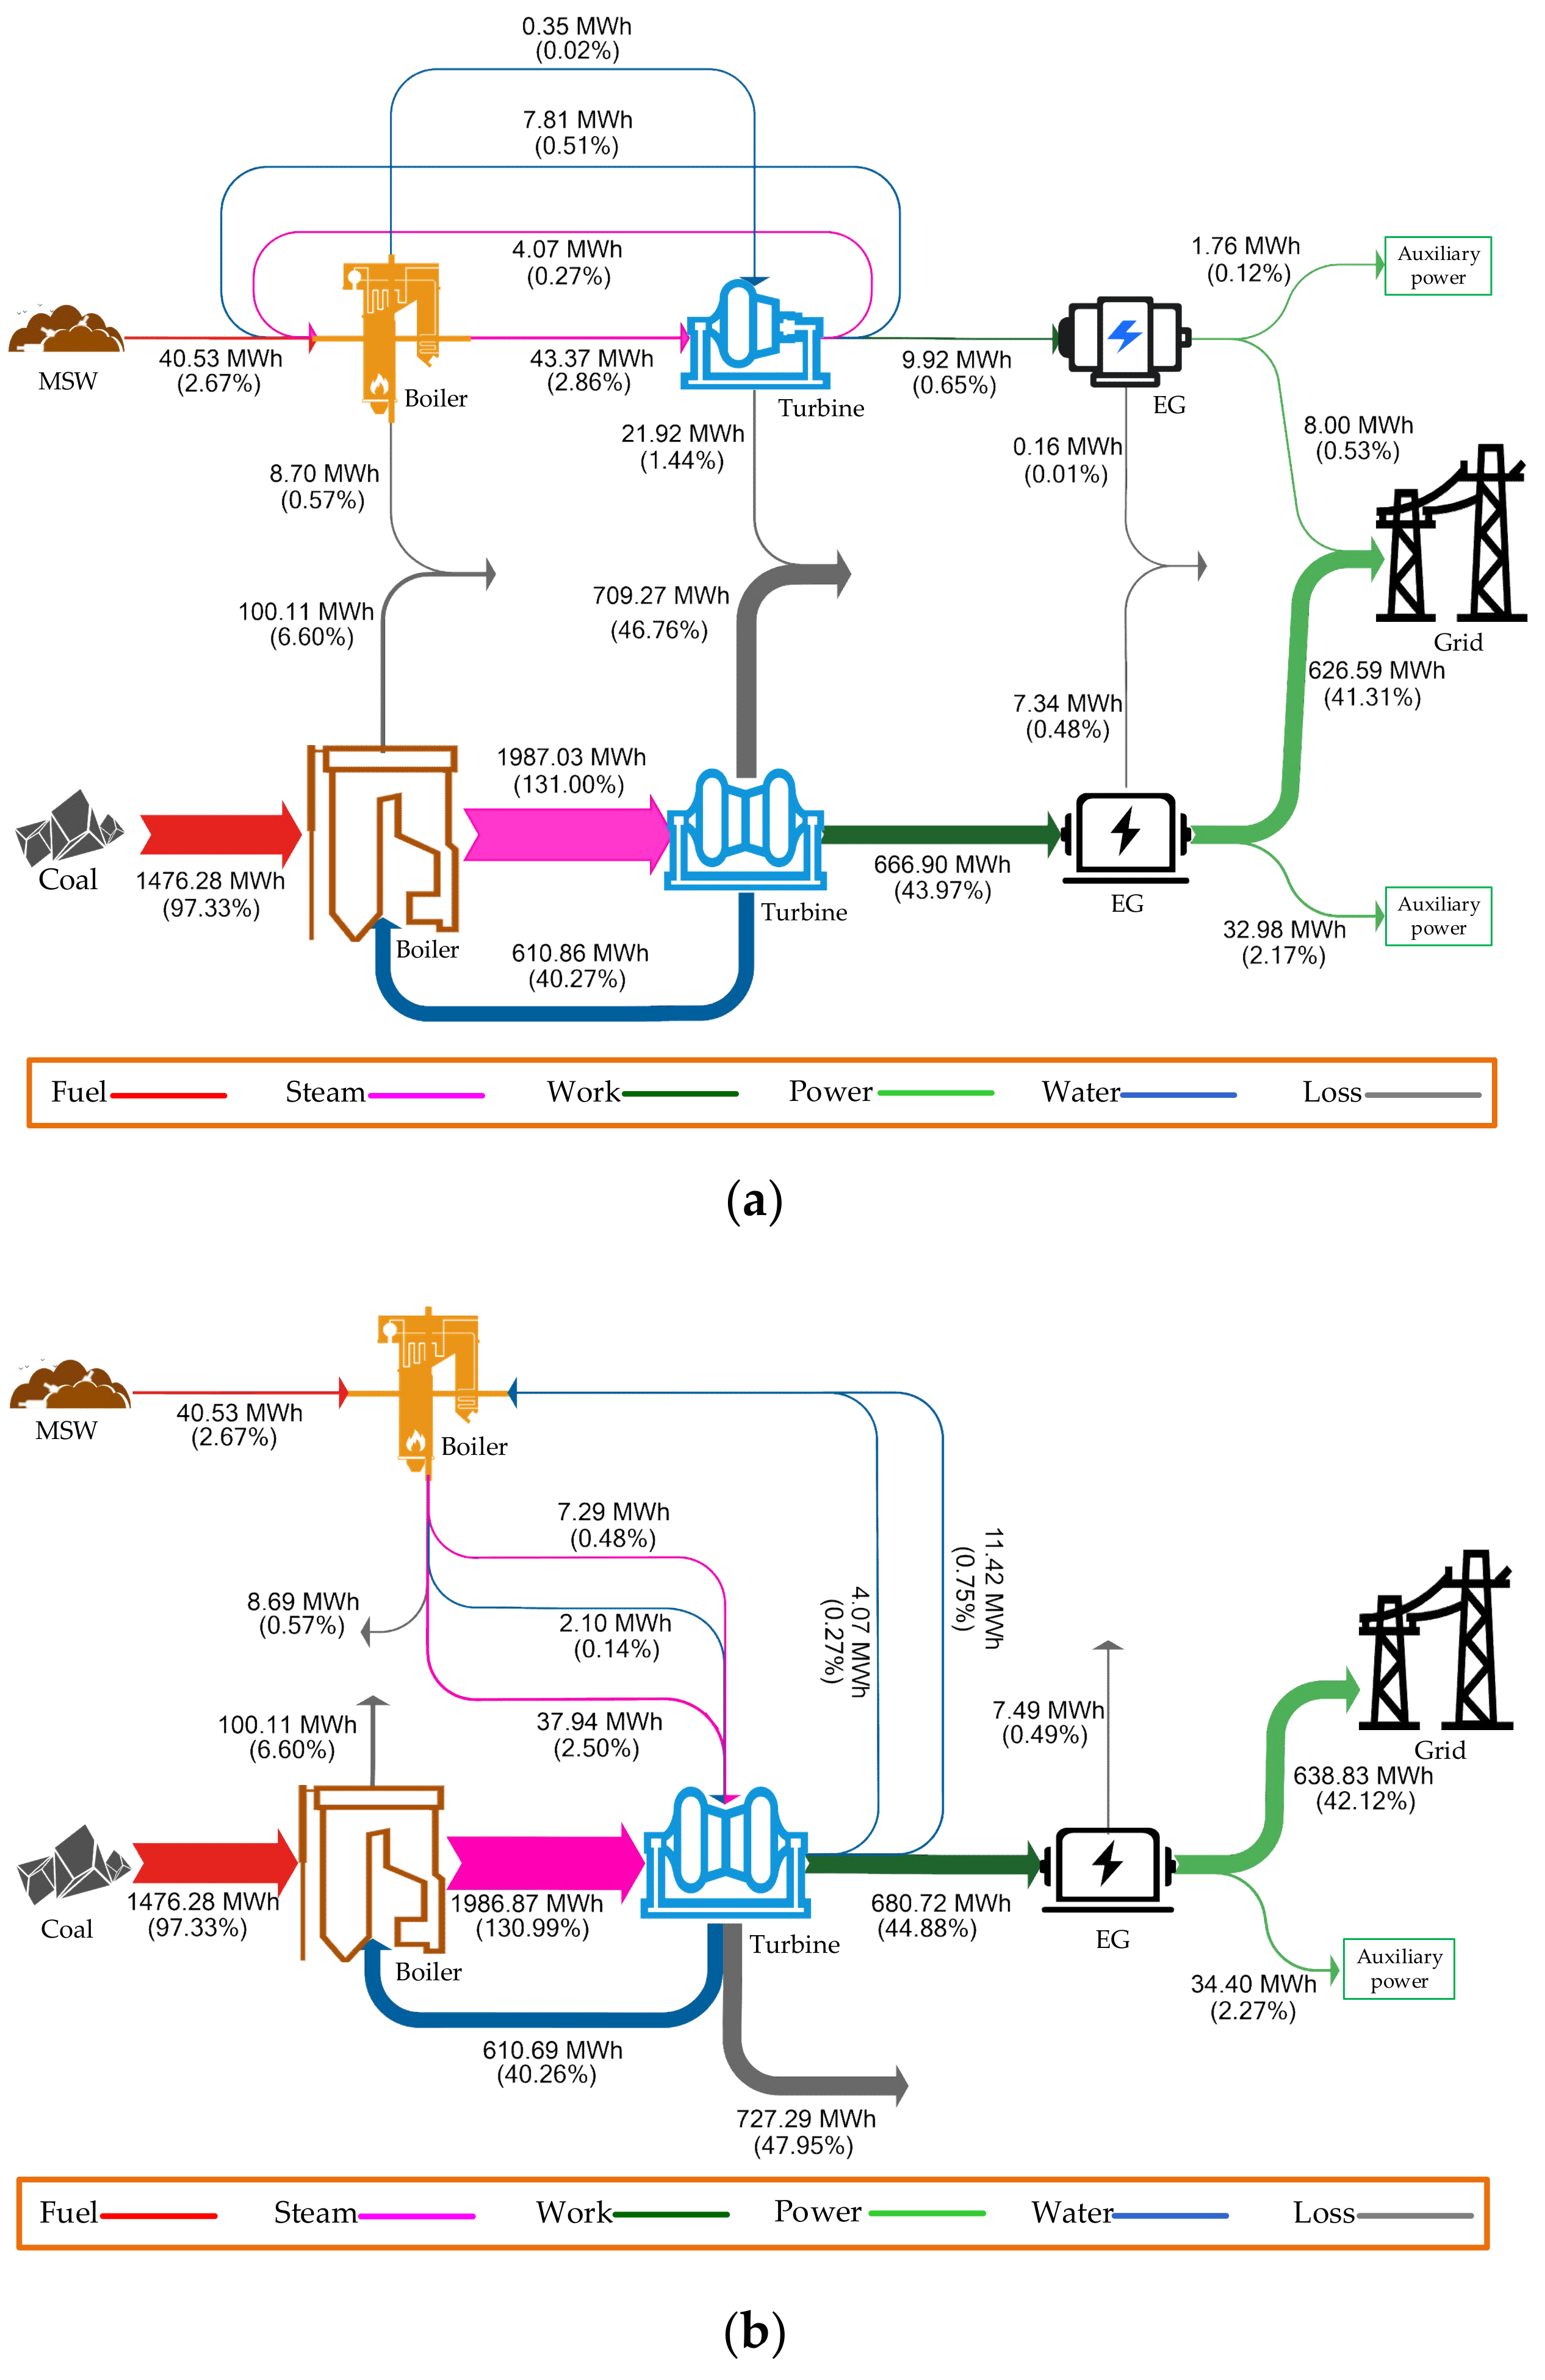
5.2. Energy Flow Diagram
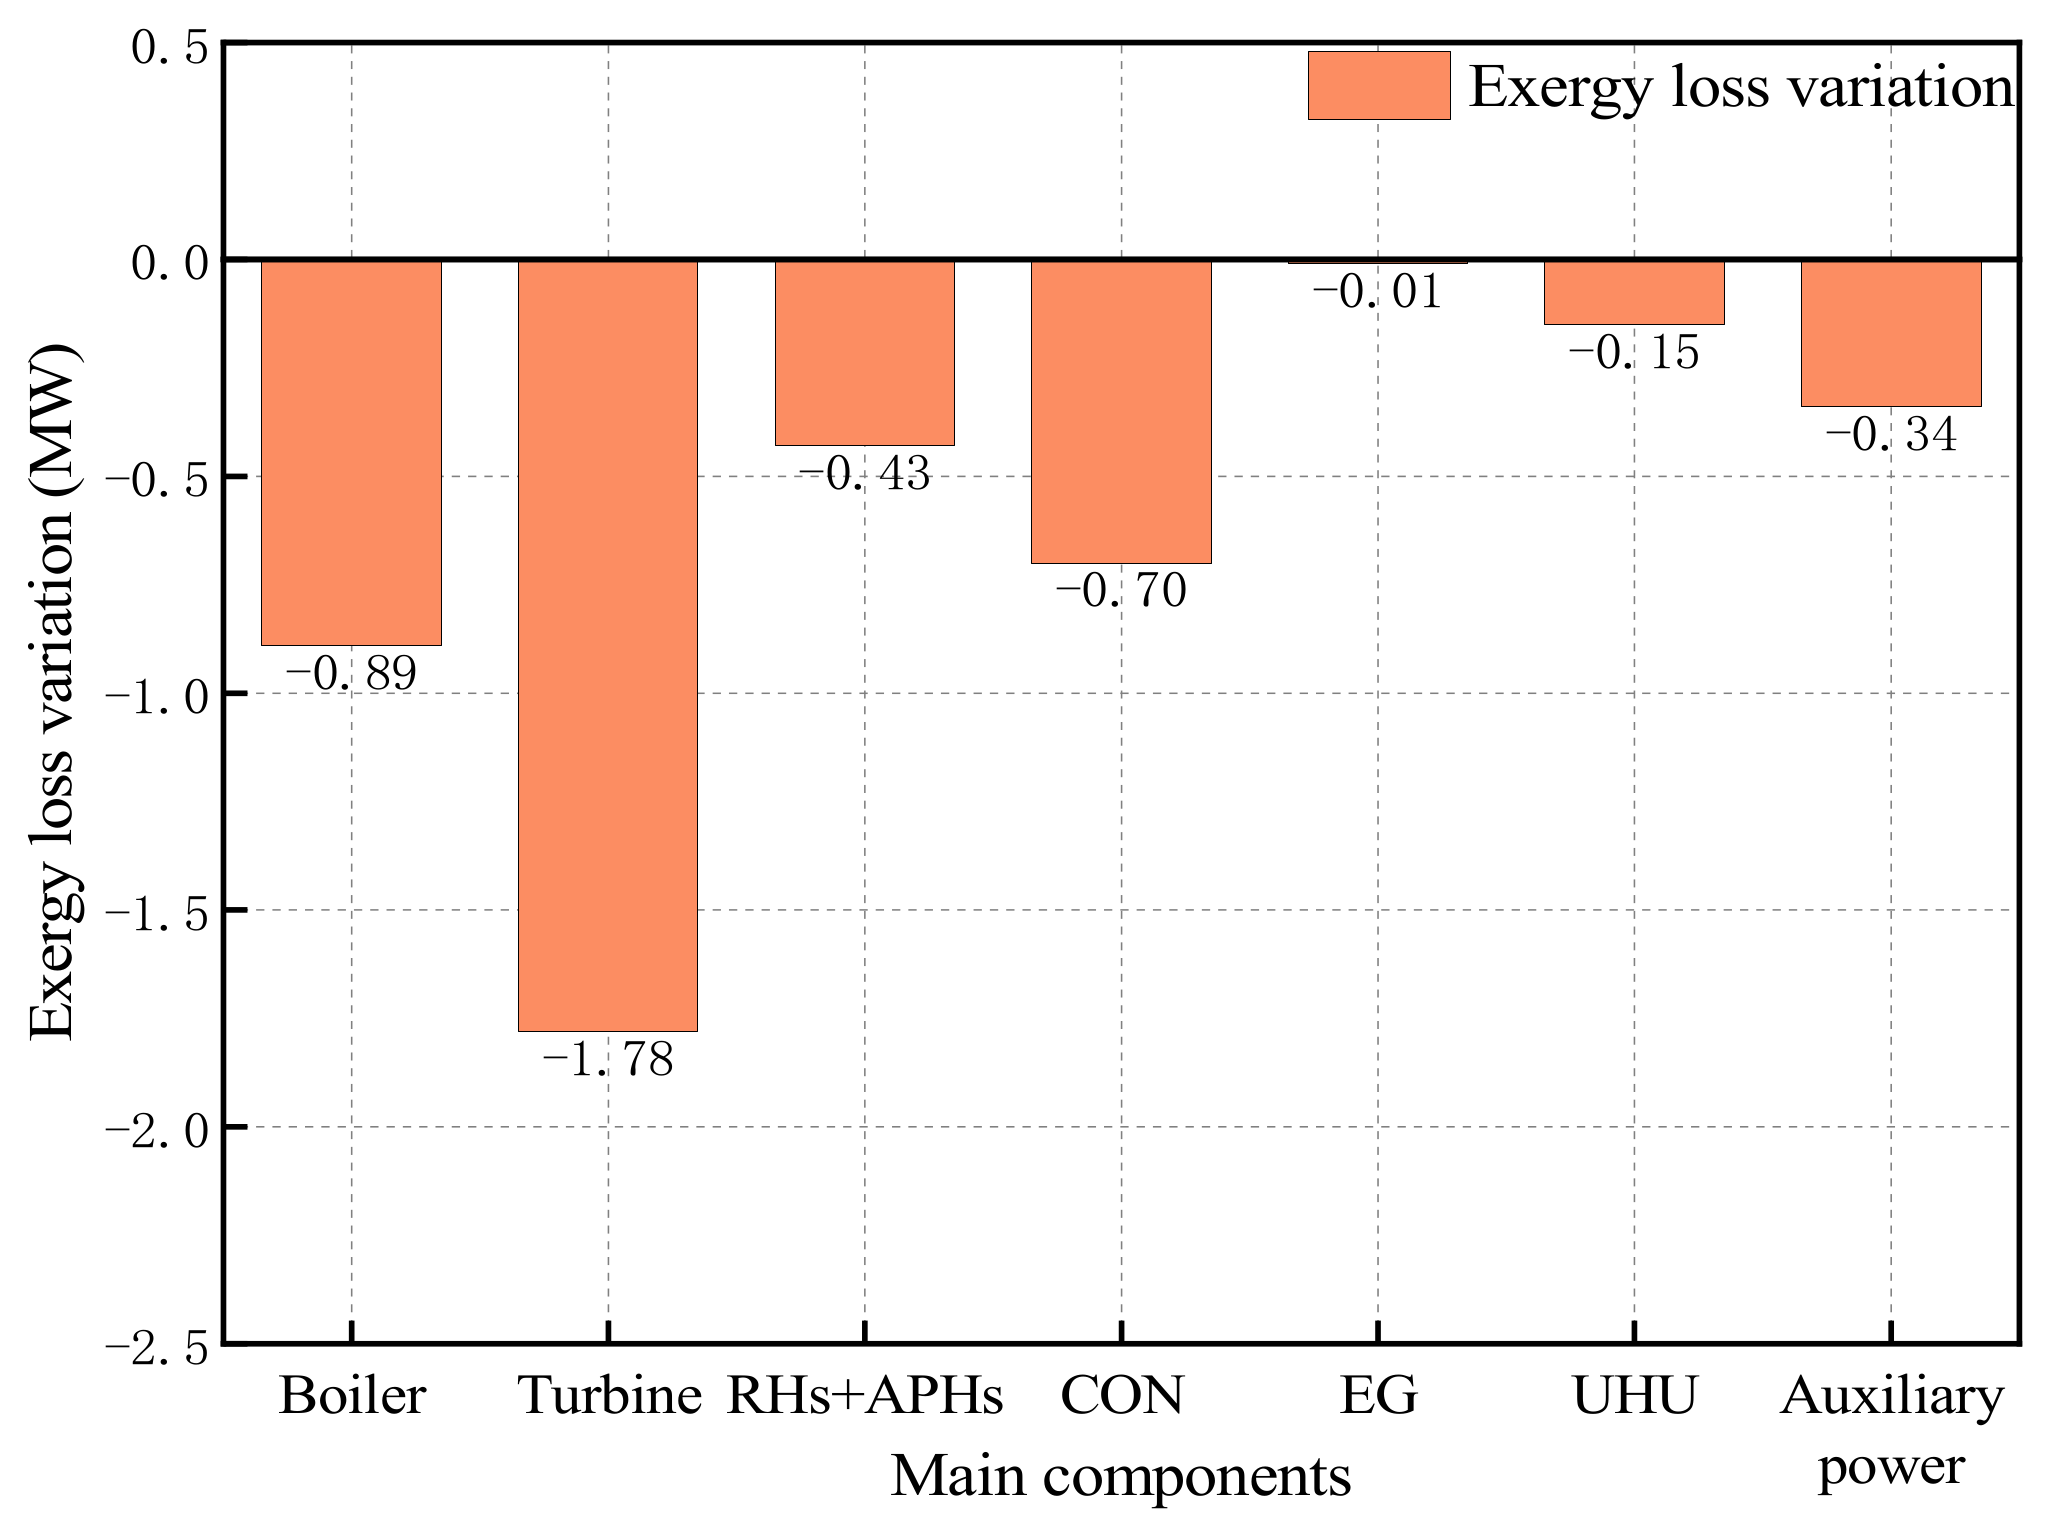
5.3. Exergy Analysis and Results
- The exergy loss in WTE boiler is declined by 0.52 MW, because heat transfer temperature difference of those heat exchangers in WTE boiler diminishes. The exergy loss in CFPU boiler is decreased by 0.38 MW, primarily triggered by the cold reheat steam temperature increase. As a result, the total boiler exergy loss is reduced by 0.89 MW.
- The exergy loss in all STs is shrunk by 1.78 MW with sharing a higher efficiency and larger scale steam turbine generator set.
- As the saturated steam from WTE boiler drum is sent to the extraction steam pipe of RH2, the exergy loss of RHs of CFPU increased by 0.38 MW. At the same time, in WTEU, because the RH is removed, the heat sources of SAH and PAH2 are replaced, the working fluid mass flow of PAH3 and PAH1 is adjusted, and the heat transfer temperature difference of each section of APHs is reduced, the exergy of RHs and APHs is decreased by 0.81 MW. Therefore, the total exergy loss of RHs and APHs of integrated system is reduced by 0.43 MW.
- The total exhaust steam flow of STs falls, which contributes to the CON exergy loss reducing by 0.70 MW.
- The exergy loss in UHU is decreased by 0.15 MW, with the heat source of UHU varying after combination.
- There is no apparent change in the exergy loss of other components.
6. Economic Evaluation
7. Discussion
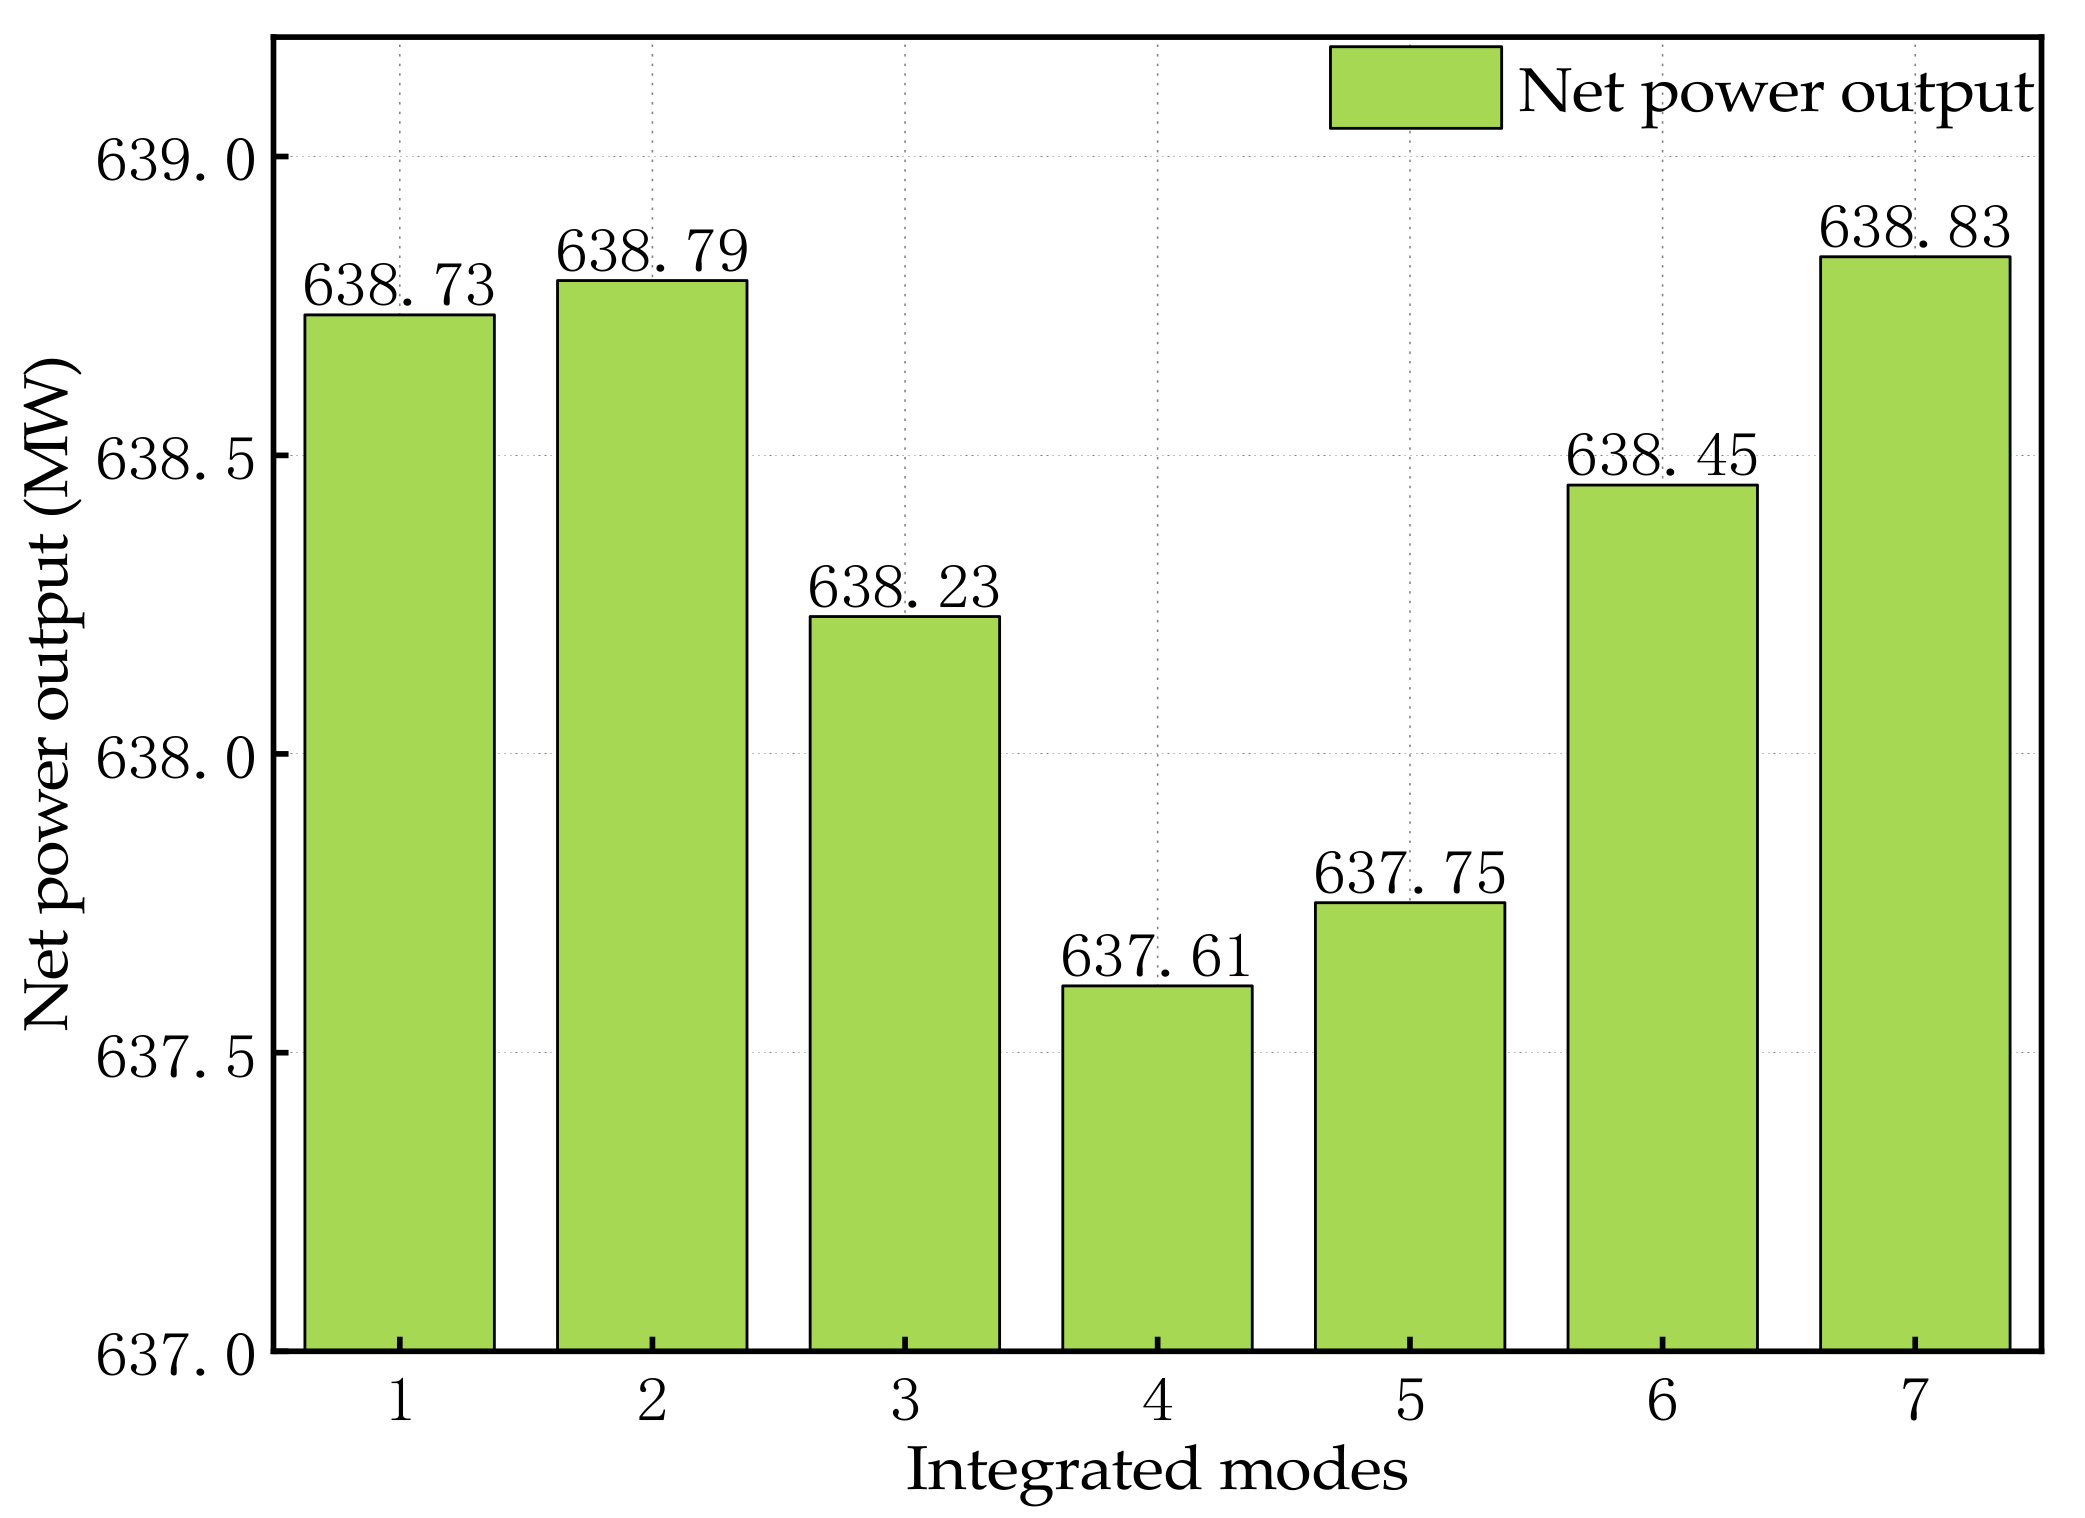
- (a)
- Mode 1: Directly apply the scheme of Reference [31];
- (b)
- Mode 2: Modify APHs based on reference WTEU and Mode 1;
- (c)
- Mode 3: Transport the outlet superheated steam of SH of WTEU to the RHR of CFPU based on Mode 1;
- (d)
- Mode 4: Directly adopt the scheme of Reference [33];
- (e)
- Mode 5: Change the outlet steam of SH of WTE boiler to RHR of CFPU based on Mode 4;
- (f)
- Mode 6: Modify APHs based on Mode 5;
- (g)
- Mode 7: Integrated scheme in this paper.
8. Conclusions
- When consumption rates of coal and MSW keep unchanged, the WTE system in the new configuration can generate an extra 4.25 MW of net power output and increase power generation efficiency by 10.48%. The reduction of energy loss in CON could explain the upturn in power generation of the proposed design through energy analysis.
- System integration reduces the exergy loss of boilers, STs and CON by 0.89 MW, 1.78 MW and 0.70 MW, with the decrease of heat transfer temperature difference in boilers and the reduction of the total exhaust steam flow in STs. Subsequently, the exergy efficiency of WTEU is raised by 9.92%, and the total exergy efficiency of suggested system is enhanced by 0.28%.
- After the system integration, the DDP of WTE system is cut down from 11.39 years to 5.48 years. Its NPV is augmented from $9.60 million to $24.02 million, confirming the financial feasibility of the innovative hybrid design.
- According to the comparison of listed integration modes, the mode with the highest net power generation is adopted in this paper. Among the compared modes, the utilized way of SH of WTE boiler has become the main factor affecting the total power output difference of the integrated system. In addition, exergy analysis results indicate that the larger heat transfer temperature difference will cause more exergy loss, reducing net power output. That’s why the outlet fluid from each heat exchanger of WTEU must be mixed with the working fluid at a close temperature in the CFPU to maximize the energy output.
Supplementary Materials
Author Contributions
Funding
Institutional Review Board Statement
Informed Consent Statement
Data Availability Statement
Conflicts of Interest
Nomenclature
| Abbreviation | |||
| AE | additional evaporator | IPST | intermediate-pressure steam turbine |
| APH | air preheater | LMTD | logarithmic mean temperature difference |
| BF | bag filter | LPST | low-pressure steam turbine |
| CFPU | Coal-fired power unit | MSW | municipal solid waste |
| CON | condenser | NPV | net present value |
| CP | condensate pump | PAH | primary air heater |
| CWP | circulating water pump | RH | regenerative heater |
| DEA | deaerator | RHR | reheater |
| DPP | dynamic payback period | SAH | secondary air heater |
| ECO | economizer | SCR | selective catalytic reduction |
| EG | electricity generator | SDS | semi-dry scrubber |
| EP | extra pump | SH | superheater |
| ESP | electrostatic precipitator | ST | steam turbine |
| EVA | evaporator | UHU | urea hydrolysis unit |
| FGD | flue gas desulfurization | WTE | waste-to-energy |
| FWP | feedwater pump | WTEU | waste-to-energy unit |
| HPST | high-pressure steam turbine | ||
| Symbol | |||
| A | area (m2) | NO | nitric oxide |
| a | a year in project lifetime | NO2 | nitrogen dioxide |
| C | carbon/cost ($)/cash flow ($) | NOx | nitrogen oxides |
| CO(NH2)2 | urea | n | mole ratio (%)/project lifetime (year) |
| c | cash flow ($) | O | oxygen |
| Cl | chlorine | P | power (kW) |
| EX | exergy (kW) | ΔQ | concerntration change (mg/m3) |
| ƒ | scale factor | q | net calorific value (kJ/kg) |
| H | hydrogen | r | rate (%) |
| h | enthalpy (kJ/kg) | S | sulfur/scale parameter |
| η | efficiency (%) | s | entropy (kJ/(kg·K)) |
| IC | investment cost ($) | t | yearly operation time (h) |
| M | molar mass (g/mol) | T | temperature (K) |
| M$ | Million USD | V | volume (Nm3/h) |
| m | mass flow (kg/s) | W | work (kW) |
| N | nitrogen | w | weight (%) |
| NH3 | ammonia | ||
| subscript | |||
| 0 | ambient state | HX | heat exchanger |
| AE | additional evaporator | in | inlet/inflow |
| c | coal | int | integrated |
| cc | changed components | it | income tax ($) |
| ch | changed | out | outlet/outflow |
| DEA | deaerator | o&m | operation and maintenance |
| dis | discount | ow | original WTEU |
| EG | electricity generator | P | pump |
| e | electricity (kWh) | pw | proposed WTEU |
| en | energy (kW) | ref | reference |
| ex | exergy (kW) | T | turbine |
| f | fuel | tot | total |
| fd | fluid | w | waste |
| fw | feedwater | wds | waste disposal subsidy |
Appendix A. Simulation Models of the Reference Power Systems


References
- Sun, C.; Meng, X.; Peng, S. Effects of waste-to-energy plants on china’s urbanization: Evidence from a hedonic price analysis in Shenzhen. Sustainability 2017, 9, 475. [Google Scholar] [CrossRef] [Green Version]
- Ji, L.; Lu, S.; Yang, J.; Du, C.; Chen, Z.; Buekens, A.; Yan, J. Municipal solid waste incineration in China and the issue of acidification: A Review. Waste Manag. Res. J. A Sustain. Circ. Econ. 2016, 34, 280–297. [Google Scholar] [CrossRef] [PubMed]
- National Bureau of Statistics. Municipal Solid Waste Removal and Disposal. Available online: https://data.stats.gov.cn (accessed on 25 August 2021).
- Xu, H.; Lin, W.Y.; Dal Magro, F.; Li, T.; Py, X.; Romagnoli, A. Towards higher energy efficiency in future waste-to-energy plants with novel latent heat storage-based thermal buffer system. Renew. Sustain. Energy Rev. 2019, 112, 324–337. [Google Scholar] [CrossRef]
- Tun, M.M.; Palacky, P.; Juchelkova, D.; Síťař, V. Renewable waste-to-energy in southeast Asia: Status, challenges, opportunities, and selection of waste-to-energy technologies. Appl. Sci. 2020, 10, 7312. [Google Scholar] [CrossRef]
- Fei, F.; Wen, Z.; Huang, S.; De Clercq, D. Mechanical biological treatment of municipal solid waste: Energy efficiency, environmental impact and economic feasibility analysis. J. Clean. Prod. 2018, 178, 731–739. [Google Scholar] [CrossRef]
- Cesaro, A.; Belgiorno, V. Anaerobic Digestion of Mechanically Sorted Organic Waste: The influence of storage time on the energetic potential. Sustain. Chem. Pharm. 2021, 20, 100373. [Google Scholar] [CrossRef]
- Leme, M.M.V.; Rocha, M.H.; Lora, E.E.S.; Venturini, O.J.; Lopes, B.M.; Ferreira, C.H. Techno-economic analysis and environmental impact assessment of energy recovery from municipal solid waste (MSW) in Brazil. Resour. Conserv. Recycl. 2014, 87, 8–20. [Google Scholar] [CrossRef]
- Li, Y.; Zhao, X.; Li, Y.; Li, X. Waste incineration industry and development policies in China. Waste Manag. 2015, 46, 234–241. [Google Scholar] [CrossRef]
- Mian, M.M.; Zeng, X.; Nasry, A.A.N.B.; Al-Hamadani, S.M.Z.F. Municipal solid waste management in China: A comparative analysis. J. Mater. Cycles Waste Manag. 2017, 19, 1127–1135. [Google Scholar] [CrossRef]
- Makarichi, L.; Jutidamrongphan, W.; Techato, K. The evolution of waste-to-energy incineration: A review. Renew. Sustain. Energy Rev. 2018, 91, 812–821. [Google Scholar] [CrossRef]
- Lombardi, L.; Carnevale, E.; Corti, A. A review of technologies and performances of thermal treatment systems for energy recovery from waste. Waste Manag. 2015, 37, 26–44. [Google Scholar] [CrossRef] [PubMed]
- Müller, D.; Wöllmer, S.; Aßbichler, D.; Murer, M.J.; Heuss-Aßbichler, S.; Rieger, K.; Hill, H.; Härtel, C.; Masset, P.J. High temperature corrosion studies of a zirconia coating: Implications for waste-to-energy (WTE) plants. Coatings 2016, 6, 36. [Google Scholar] [CrossRef] [Green Version]
- Lee, S.; Themelis, N.J.; Castaldi, M.J. High-temperature corrosion in waste-to-energy boilers. J. Therm. Spray Technol. 2007, 16, 104–110. [Google Scholar] [CrossRef] [Green Version]
- Martin, J.J.E.; Koralewska, R.; Wohlleben, A. Advanced solutions in combustion-based WtE technologies. Waste Manag. 2015, 37, 147–156. [Google Scholar] [CrossRef] [PubMed]
- Koralewska, R. Innovative concepts of high-efficiency EfW plants. In Proceedings of the 16th Annual North American Waste-to-Energy Conference, Philadelphia, PA, USA, 19–21 May 2008. [Google Scholar]
- Bogale, W.; Viganò, F. A preliminary comparative performance evaluation of highly efficient waste-to-energy plants. Energy Procedia 2014, 45, 1315–1324. [Google Scholar] [CrossRef] [Green Version]
- Liuzzo, G.; Verdone, N.; Bravi, M. The benefits of flue gas recirculation in waste incineration. Waste Manag. 2007, 27, 106–116. [Google Scholar] [CrossRef] [PubMed]
- Strobel, R.; Waldner, M.H.; Gablinger, H. Highly efficient combustion with low excess air in a modern energy-from-waste (EfW) plant. Waste Manag. 2018, 73, 301–306. [Google Scholar] [CrossRef]
- Stehlík, P. Up-to-date technologies in waste to energy field. Rev. Chem. Eng. 2012, 28, 223–242. [Google Scholar] [CrossRef]
- Alrobaian, A.A. Improving waste incineration CHP plant efficiency by waste heat recovery for feedwater preheating process: Energy, exergy, and economic (3E) analysis. J. Braz. Soc. Mech. Sci. Eng. 2020, 42, 403. [Google Scholar] [CrossRef]
- Arabkoohsar, A.; Nami, H. Thermodynamic and economic analyses of a hybrid waste-driven CHP-ORC plant with exhaust heat recovery. Energy Convers. Manag. 2019, 187, 512–522. [Google Scholar] [CrossRef]
- Zuo, W.; Zhang, X.; Li, Y. Review of flue gas acid dew-point and related low temperature corrosion. J. Energy Inst. 2020, 93, 1666–1677. [Google Scholar] [CrossRef]
- De Greef, J.; Villani, K.; Goethals, J.; Van Belle, H.; Van Caneghem, J.; Vandecasteele, C. Optimising energy recovery and use of chemicals, resources and materials in modern waste-to-energy plants. Waste Manag. 2013, 33, 2416–2424. [Google Scholar] [CrossRef] [PubMed]
- Chen, X.; Xue, X.; Si, Y.; Liu, C.; Chen, L.; Guo, Y.; Mei, S. Thermodynamic analysis of a hybrid trigenerative compressed air energy storage system with solar thermal energy. Entropy 2020, 22, 764. [Google Scholar] [CrossRef]
- Pan, P.; Wu, Y.; Chen, H. Performance evaluation of an improved biomass-fired cogeneration system simultaneously using Extraction Steam, Cooling Water, and Feedwater for Heating. Front. Energy 2021, 1–15. [Google Scholar] [CrossRef]
- Hulgaard, T.; Sondergaard, I. Integrating waste-to-energy in Copenhagen, Denmark. Proc. Inst. Civ. Eng. Civ. Eng. 2018, 171, 3–10. [Google Scholar] [CrossRef] [Green Version]
- Nami, H.; Arabkoohsar, A.; Anvari-Moghaddam, A. Thermodynamic and sustainability analysis of a municipal waste-driven combined cooling, heating and power (CCHP) plant. Energy Convers. Manag. 2019, 201, 112158. [Google Scholar] [CrossRef]
- Bianchi, M.; Branchini, L.; De Pascale, A. Combining waste-to-energy steam cycle with gas turbine units. Appl. Energy 2014, 130, 764–773. [Google Scholar] [CrossRef]
- Mendecka, B.; Lombardi, L.; Gładysz, P.; Stanek, W. Exergo-ecological assessment of waste to energy plants supported by solar energy. Energies 2018, 11, 773. [Google Scholar] [CrossRef] [Green Version]
- Chen, H.; Zhang, M.; Xue, K.; Xu, G.; Yang, Y.; Wang, Z.; Liu, W.; Liu, T. An innovative waste-to-energy system integrated with a coal-fired power plant. Energy 2020, 194, 116893. [Google Scholar] [CrossRef]
- Sun, L.; Wu, C. Theory and practice of ammonia production by hydrolysis of urea for flue gas denitration. Clean Coal Technol. 2020, 26, 229–236. (In Chinese) [Google Scholar]
- Chen, H.; Zhang, M.; Chen, Z.; Xu, G.; Han, W.; Liu, W.; Liu, T. Performance analysis and operation strategy of an improved waste-to-energy system incorporated with a coal-fired power unit based on feedwater heating. Appl. Therm. Eng. 2020, 178, 115637. [Google Scholar] [CrossRef]
- Carneiro, M.L.N.M.; Gomes, M.S.P. Energy, exergy, environmental and economic analysis of hybrid waste-to-energy plants. Energy Convers. Manag. 2019, 179, 397–417. [Google Scholar] [CrossRef]
- Lu, F.; Zhu, Y.; Pan, M.; Li, C.; Yin, J.; Huang, F. Thermodynamic, economic, and environmental analysis of new combined power and space cooling system for waste heat recovery in waste-to-energy plant. Energy Convers. Manag. 2020, 226, 113511. [Google Scholar] [CrossRef]
- STEAG Energy Services. EBSILON Professional Documentation. Available online: https://www.ebsilon.com/en/ (accessed on 22 November 2021).
- Costa, M.; Indrizzi, V.; Massarotti, N.; Mauro, A. Modeling and optimization of an incinerator plant for the reduction of the environmental impact. Int. J. Numer. Methods Heat Fluid Flow 2015, 25, 1463–1487. [Google Scholar] [CrossRef]
- Wang, X.; Li, W.; Wang, N.; Bai, C.; Xiao, H. Mechanism and influence factors of ammonia production using urea. Therm. Power Gener. 2019, 48, 101–107. (In Chinese) [Google Scholar]
- Feng, M.; Yan, H. Research on the concentration value conversion of NOx in the flue gas from thermal power plants. Shanxi Electr. Power 2007, 103, 15–16. (In Chinese) [Google Scholar]
- Zhao, X.; Jiang, G.; Li, A.; Wang, L. Economic analysis of waste-to-energy industry in China. Waste Manag. 2016, 48, 604–618. [Google Scholar] [CrossRef] [PubMed]
- Zeng, X. Cost Analysis of waste incineration-power generation projects. Environ. Sanit. Eng. 2014, 22, 57–60. (In Chinese) [Google Scholar]
- Li, C.; Wang, F.; Zhang, D.; Ye, X. Cost management for waste to energy systems using life cycle costing approach: A case study from China. J. Renew. Sustain. Energy 2016, 8, 25901. [Google Scholar] [CrossRef]
- National Development and Reform Commission. Notice of the National Development and Reform Commission on Improving the Price Policy of Waste Incineration for Power Generation. 2021. Available online: www.ndrc.gov.cn (accessed on 29 August 2021).
- Ogorure, O.J.; Oko, C.O.C.; Diemuodeke, E.O.; Owebor, K. Energy, exergy, environmental and economic analysis of an agricultural waste-to-energy integrated multigeneration thermal power plant. Energy Convers. Manag. 2018, 171, 222–240. [Google Scholar] [CrossRef]
- Lian, Z.T.; Chua, K.J.; Chou, S.K. A thermoeconomic analysis of biomass energy for trigeneration. Appl. Energy 2010, 87, 84–95. [Google Scholar] [CrossRef]
- Zhang, C.; Liu, C.; Wang, S.; Xu, X.; Li, Q. Thermo-economic comparison of subcritical organic Rankine cycle based on different heat exchanger configurations. Energy 2017, 123, 728–741. [Google Scholar] [CrossRef]
- Electric Power Planning and Engineering Institute. Quota Design Reference Cost Indicators for Thermal Power Projects; 2016 Edition; China Electric Power Press: Beijing, China, 2017; Available online: https://www.doc88.com/p-9943837447835.html (accessed on 22 November 2021).
- Elsido, C.; Martelli, E.; Kreutz, T. Heat integration and heat recovery steam cycle optimization for a low-carbon lignite/biomass-to-jet fuel demonstration project. Appl. Energy 2019, 239, 1322–1342. [Google Scholar] [CrossRef]
- Xu, G.; Xu, C.; Yang, Y.; Fang, Y.; Li, Y.; Song, X. A novel flue gas waste heat recovery system for coal-fired ultra-supercritical Power Plants. Appl. Therm. Eng. 2014, 67, 240–249. [Google Scholar] [CrossRef]
- Xu, C.; Xu, G.; Han, Y.; Liang, F.; Fang, Y.; Yang, Y. A novel lignite pre-drying system with low-grade heat integration for modern lignite power plants. Chin. Sci. Bull. 2014, 59, 4426–4435. [Google Scholar] [CrossRef]
- Mi, X.; Liu, R.; Cui, H.; Memon, S.A.; Xing, F.; Lo, Y. Energy and economic analysis of building integrated with PCM in different cities of China. Appl. Energy 2016, 175, 324–336. [Google Scholar] [CrossRef]


| Fuel | Proximate Analysis (wt%) | Ultimate Analysis (wt%) | LHV (kJ/kg) | ||||||
|---|---|---|---|---|---|---|---|---|---|
| MSW | A | M | C | H | O | N | S | Cl | 7000 |
| 41.75 | 20.59 | 21.97 | 1.91 | 12.78 | 1.91 | 0.20 | 0.30 | ||
| Parameter | Unit | Value | |
|---|---|---|---|
| Fuel consumption rate (MSW) | kg/s | 5.79 | |
| Live steam | Pressure | MPa | 4.10 |
| Temperature | °C | 400 | |
| Mass flow | kg/s | 13.50 | |
| Exhaust steam | Pressure | MPa | 0.007 |
| Temperature | °C | 39.0 | |
| Mass flow | kg/s | 9.95 | |
| Boiler efficiency | % | 78.55 | |
| Total power generation | MW | 9.75 | |
| Net power generation | MW | 8.00 | |
| Net WTE efficiency | % | 19.73 | |
| Parameter | Unit | PAH1 | PAH2 | PAH3 | SAH | |
|---|---|---|---|---|---|---|
| Cold side | Inlet/outlet fluid | - | Air/air | Air/air | Air/air | Air/air |
| Inlet/outlet temperature | °C | 15.0/31.1 | 31.1/166.0 | 166.0/220.0 | 15.0/166.0 | |
| Mass flow | kg/s | 20.48 | 20.48 | 20.48 | 8.38 | |
| Hot side | Inlet/outlet fluid | - | Condensate/ condensate | Steam/ condensate | Steam/ condensate | Steam/ condensate |
| Inlet/outlet pressure | MPa | 4.30/3.90 | 1.31/1.30 | 4.50/4.30 | 1.31/1.30 | |
| Inlet/outlet temperature | °C | 224.1/101.0 | 290.7/102.5 | 257.4/224.1 | 290.7/102.3 | |
| Mass flow | kg/s | 0.62 | 1.08 | 0.62 | 0.49 | |
| LMTD | °C | 132.4 | 95.6 | 47.0 | 104.9 | |
| Heat load | MW | 0.33 | 2.79 | 1.13 | 1.28 | |
| Parameter | Unit | RH1 | RH2 | RH3 | RH4 | RH5 | RH6 | RH7 | RH8 | |
|---|---|---|---|---|---|---|---|---|---|---|
| Extracted steam | Pressure | MPa | 5.81 | 4.11 | 2.02 | 1.01 | 0.39 | 0.13 | 0.06 | 0.02 |
| Temperature | °C | 352.5 | 316.2 | 473.3 | 359.4 | 253.1 | 136.8 | 86.7 | 61.0 | |
| Mass flow | kg/s | 28.53 | 40.49 | 19.74 | 26.43 | 24.04 | 12.76 | 16.09 | 15.20 | |
| Feedwater | Inlet/outlet temperature | °C | 252.0/ 275.2 | 213.0/ 252.0 | 185.9/ 213.0 | 140.0/ 180.2 | 103.7/ 140.0 | 83.9/ 103.7 | 58.2/ 83.9 | 33.3/ 58.2 |
| Outlet mass flow | kg/s | 506.35 | 506.35 | 506.35 | 506.35 | 391.16 | 391.16 | 391.16 | 391.16 | |
| Drain water | Temperature | °C | 257.5 | 218.6 | 191.4 | - | 109.2 | 89.4 | 63.8 | 38.9 |
| Mass flow | kg/s | 28.53 | 69.02 | 88.76 | - | 24.04 | 37.38 | 53.47 | 68.67 | |
| Fuel | Proximate Analysis (wt%) | Ultimate Analysis (wt%) | LHV (kJ/kg) | |||||
|---|---|---|---|---|---|---|---|---|
| Coal | A | M | C | H | O | N | S | 24,720 |
| 19.70 | 6.00 | 67.60 | 2.70 | 1.80 | 0.90 | 1.30 | ||
| Parameter | Unit | Value | |
|---|---|---|---|
| Fuel consumption rate (coal) | kg/s | 59.72 | |
| ECO | Inlet fluid | - | Feedwater |
| Inlet pressure | MPa | 29.30 | |
| Inlet temperature | °C | 275.2 | |
| Mass flow | kg/s | 506.35 | |
| SH | Outlet fluid | - | Superheated steam |
| Outlet pressure | MPa | 24.20 | |
| Outlet temperature | °C | 566.0 | |
| Mass flow | kg/s | 506.35 | |
| RHR | Inlet/outlet pressure | MPa | 4.24/3.82 |
| Inlet/outlet temperature | °C | 308.4/566.0 | |
| Mass flow | kg/s | 432.31 | |
| Exhaust gas temperature | °C | 122.0 | |
| Total power generation | MW | 659.57 | |
| Net power generation | MW | 626.59 | |
| Boiler efficiency | % | 93.22 | |
| Net power efficiency | % | 42.44 | |
| Parameter | Unit | Value | |
|---|---|---|---|
| Cold side | Inlet/outlet fluid | - | Urea solution/ Hydrolytic gas |
| Inlet/outlet temperature | °C | 50.0/150.0 | |
| Mass flow | kg/s | 0.67 | |
| Hot side | steam pressure | MPa | 2.13 |
| steam temperature | °C | 473.9 | |
| steam flow | kg/s | 0.58 | |
| Attempering water pressure | MPa | 1.10 | |
| Attempering water temperature | °C | 25.0 | |
| Attempering water flow | kg/s | 0.14 | |
| LMTD | °C | 76.9 | |
| Heat load | MW | 1.41 | |
| Comparison | Unit | Design | Simulation | Relative Error (%) | |
|---|---|---|---|---|---|
| Fuel consumption rate | kg/s | 5.79 | 5.79 | 0.00 | |
| Live steam | Pressure | MPa | 4.10 | 4.10 | 0.00 |
| Temperature | °C | 400.0 | 400.0 | 0.00 | |
| Mass flow | kg/s | 13.50 | 13.50 | 0.00 | |
| Exhaust steam | Pressure | MPa | 0.007 | 0.007 | 0.00 |
| Temperature | °C | 39.0 | 39.0 | 0.00 | |
| Mass flow | kg/s | 9.95 | 9.96 | 0.10 | |
| Exhaust gas temperature | °C | 190.0 | 189.9 | −0.05 | |
| Total power generation | MW | 9.74 | 9.75 | 0.10 | |
| Net power generation | MW | 7.99 | 8.00 | 0.13 | |
| Comparison | Unit | Design | Simulation | Relative Error (%) | |
|---|---|---|---|---|---|
| Fuel consumption rate | kg/s | 59.72 | 59.72 | 0.00 | |
| Live steam | Pressure | MPa | 24.20 | 24.20 | 0.00 |
| Temperature | °C | 566.0 | 566.0 | 0.00 | |
| Mass flow | kg/s | 506.35 | 506.35 | 0.00 | |
| Reheat steam | Pressure | MPa | 3.82 | 3.82 | 0.00 |
| Temperature | °C | 566 | 566 | 0.00 | |
| Mass flow | kg/s | 432.42 | 432.31 | −0.03 | |
| Exhaust steam | Pressure | MPa | 0.0049 | 0.0049 | 0.00 |
| Temperature | °C | 32.5 | 32.5 | 0.00 | |
| Mass flow | kg/s | 322.83 | 322.17 | −0.20 | |
| Total power generation | MW | 659.34 | 659.57 | 0.03 | |
| Net power generation | MW | 626.37 | 626.59 | 0.04 | |
| Parameter | Unit | Value | |
|---|---|---|---|
| Cold side | Inlet/outlet fluid | - | Feedwater/saturated steam |
| Inlet/outlet pressure | MPa | 1.09/1.01 | |
| Inlet/outlet temperature | °C | 180.3/180.5 | |
| Mass flow | kg/s | 0.72 | |
| Hot side | Inlet/outlet fluid | - | Flue gas/flue gas |
| Inlet/outlet temperature | °C | 271.3/235.5 | |
| Mass flow | kg/s | 35.61 | |
| LMTD | °C | 71.6 | |
| Heat load | MW | 1.45 | |
| Parameter | Unit | Initial Design | Integrated Design | |
|---|---|---|---|---|
| Cold side | Inlet/outlet fluid | - | Urea solution/ Hydrolytic gas | Urea solution/ Hydrolytic gas |
| Inlet/outlet temperature | °C | 50.0/150.0 | 50.0/150.0 | |
| Mass flow | kg/s | 0.67 | 0.67 | |
| Hot side | Steam pressure | MPa | 2.13 | 1.01 |
| Steam temperature | °C | 473.9 | 180.5 | |
| Steam flow | kg/s | 0.58 | 0.72 | |
| Attempering water pressure | MPa | 1.10 | - | |
| Attempering water temperature | °C | 25.0 | - | |
| Attempering water flow | kg/s | 0.14 | - | |
| LMTD | °C | 76.9 | 77.5 | |
| Heat load | MW | 1.41 | 1.41 | |
| Comparison | Unit | Initial Design | Integrated Design | |||
|---|---|---|---|---|---|---|
| ECO | SH | ECO | SH | |||
| Cold side | Inlet/outlet fluid | - | Feedwater/ feedwater | Saturated steam/ superheated steam | Feedwater/ feedwater | Superheated steam/ superheated steam |
| Inlet/outlet pressure | MPa | 5.30/4.50 | 4.50/4.10 | 5.30/4.50 | 4.24/4.04 | |
| Inlet/outlet temperature | °C | 130.1/254.4 | 257.4/400.0 | 181.0/254.4 | 308.4/400.0 | |
| Mass flow | kg/s | 14.19 | 13.50 | 14.12 | 30.76 | |
| Hot side | Inlet/outlet fluid | - | Flue gas/ flue gas | Flue gas/ flue gas | Flue gas/ flue gas | Flue gas/ flue gas |
| Inlet/outlet temperature | °C | 382.7/189.9 | 513.5/382.7 | 342.3/189.9 | 513.6/342.3 | |
| Mass flow | kg/s | 35.61 | 35.61 | 35.61 | 35.61 | |
| LMTD | °C | 89.7 | 119.3 | 34.50 | 65.9 | |
| Heat load | MW | 7.91 | 5.60 | 4.76 | 7.29 | |
| Parameter | Unit | PAH1 | PAH2 | PAH3 | SAH | |
|---|---|---|---|---|---|---|
| Hot side | Inlet/outlet fluid | - | Condensate/ condensate | Feedwater/ condensate | Steam/ condensate | Feedwater/ condensate |
| Inlet/outlet pressure | MPa | 4.30/3.90 | 1.09/0.99 | 4.50/4.30 | 1.09/0.99 | |
| Inlet/outlet temperature | °C | 178.5/37.7 | 180.3/32.4 | 257.4/178.5 | 180.3/22.2 | |
| Mass flow | kg/s | 0.56 | 4.45 | 0.56 | 1.91 | |
| LMTD | °C | 66.7 | 5.4 | 22.7 | 10.4 | |
| Heat load | MW | 0.33 | 2.79 | 1.13 | 1.28 | |
| Parameter | Initial Design | Proposed Design | Difference | |
|---|---|---|---|---|
| WTEU | MSW consumption rate (kg/s) | 5.79 | 5.79 | 0 |
| Live steam mass flow (kg/s) | 13.50 | - | - | |
| Exhaust steam mass flow (kg/s) | 9.96 | - | - | |
| Boiler efficiency (%) | 78.55 | 78.55 | 0 | |
| CFPU | Coal consumption rate (kg/s) | 59.72 | 59.72 | 0 |
| Live steam mass flow (kg/s) | 506.35 | 506.21 | −0.14 | |
| Reheat steam mass flow (kg/s) | 432.31 | 444.56 | +12.25 | |
| Exhaust steam mass flow (kg/s) | 322.17 | 330.52 | +8.35 | |
| Boiler efficiency (%) | 93.22 | 93.22 | 0 | |
| Total power generation (MW) | 669.32 | 673.23 | +3.91 | |
| Total auxiliary power (MW) | 34.73 | 34.40 | −0.33 | |
| Net total power generation (MW) | 634.59 | 638.83 | +4.25 | |
| Net power generation of WTEU (MW) | 8.00 | 12.25 | +4.25 | |
| Net waste-to-energy efficiency (%) | 19.73 | 30.21 | +10.48 | |
| Net total energy efficiency (%) | 41.84 | 42.12 | +0.28 | |
| Parameter | Initial Design | Proposed Design | Difference | |||
|---|---|---|---|---|---|---|
| MW | Proportion | MW | Proportion | MW | ||
| Exergy input of CFPU | 1497.95 | 97.22% | 1497.95 | 97.22% | 0.00 | |
| Exergy input of WTEU | 42.82 | 2.78% | 42.82 | 2.78% | 0.00 | |
| Total exergy input | 1540.76 | 100.00% | 1540.76 | 100.00% | 0.00 | |
| Net exergy output of CFPU | 626.59 | 40.67% | 626.59 | 40.67% | 0.00 | |
| Net exergy output of WTEU | 8.00 | 0.52% | 12.25 | 0.79% | +4.25 | |
| Net total exergy output | 634.59 | 41.19% | 638.83 | 41.46% | +4.25 | |
| Exergy loss variation | ||||||
| CFPU | Boiler | 720.09 | 46.74% | 719.71 | 46.71% | −0.38 |
| Turbine | 45.94 | 2.98% | 46.82 | 3.04% | +0.88 | |
| RHs | 14.84 | 0.96% | 15.22 | 0.99% | +0.38 | |
| CON | 40.60 | 2.63% | 41.61 | 2.70% | +1.02 | |
| EG | 7.34 | 0.48% | 7.49 | 0.49% | +0.15 | |
| UHU | 0.66 | 0.04% | 0.51 | 0.03% | −0.14 | |
| Auxiliary power | 32.98 | 2.14% | 32.98 | 2.14% | 0.00 | |
| Other | 8.92 | 0.58% | 8.97 | 0.58% | +0.05 | |
| WTEU | Boiler | 26.20 | 1.70% | 25.68 | 1.67% | −0.52 |
| Turbine | 2.66 | 0.17% | - | - | −2.66 | |
| RHs + APHs | 2.33 | 0.15% | 1.52 | 0.10% | −0.81 | |
| CON | 1.72 | 0.11% | - | - | −1.72 | |
| EG | 0.16 | 0.01% | - | - | −0.16 | |
| Auxiliary power | 1.76 | 0.11% | 1.42 | 0.09% | −0.34 | |
| Total exergy loss | 906.18 | 58.81% | 901.93 | 58.54% | −4.25 | |
| Net total exergy efficiency | 41.19% | 41.46% | 0.28% | |||
| Net exergy efficiency of WTEU | 18.68% | 28.60% | +9.92% | |||
| Parameter | Unit | Value | Source | |
|---|---|---|---|---|
| Total investment of proposed WTEU | M$ | 26.49 | [40] | |
| Yearly operation and maintenance cost of WTEU | M$ | 10% of total investment cost | [31] | |
| Yearly operating time of WTEU | h | 7000 | ||
| Project period | Building period | year | 2 | [42] |
| Payback period | year | 23 | ||
| Discount rate | - | 8% | [42] | |
| Waste disposal subsidy | $/t | 13.04 | [40] | |
| On-grid power tariff | $/MWh | 99.97 | [43] | |
| Income tax rate | 1st to 3rd year | % | 0 | [41] |
| 4th to 6th year | % | 12.5 | ||
| 7th to 25th year | % | 25.0 | ||
| Component | Function | Source |
|---|---|---|
| Turbine | [44] | |
| EG | [45] | |
| CP, EP, FWP and CWP | [44] | |
| RH2 | [46] | |
| DEA | [45] | |
| AE | [44] |
| Facility | Basic Cost (k$) | Basic Scale | Unit | Scale Factor | Source |
|---|---|---|---|---|---|
| Cooling tower | 27,355.45 | 1,845,000 | m2 | 1 | [47] |
| CON | 1715.287 | 18,000 | m2 | 1 | |
| Stack | 3827.12 | 1,178,352 | m3/h | 1 | |
| SH | 45.84 | 500 | m2 | 0.741 | [48] |
| ECO | 693.00 | 13,149 | m2 | 0.68 | [49] |
| PAH | 800.00 | 8372 | m2 | 0.68 | [50] |
| SAH | 800.00 | 8372 | m2 | 0.68 |
| Component | Initial WTE Design (k$) | Proposed WTE Design (k$) | Difference (k$) | |
|---|---|---|---|---|
| Removed | ST | 4126.61 | - | −4126.61 |
| EG | 369.71 | - | −369.71 | |
| CON | 45.53 | - | −45.53 | |
| CWP | 211.74 | - | −211.74 | |
| Cooling tower | 920.06 | - | −920.06 | |
| CP | 8.90 | - | −8.90 | |
| RH2 | 18.96 | - | −18.96 | |
| DEA | 38.51 | - | −38.51 | |
| Stack | 331.86 | - | −331.86 | |
| Transformed | ECO | 246.58 | 346.08 | +99.50 |
| SH | 107.78 | 203.60 | +95.82 | |
| PAH | 252.53 | 761.37 | +508.84 | |
| SAH | 109.58 | 257.31 | +147.73 | |
| Added | EP | - | 7.09 | +7.09 |
| AE | - | 62.88 | +62.88 | |
| Sum | 6788.35 | 1638.33 | −5150.03 | |
| Comparison | Unit | Initial WTE Design | Proposed WTE Design | Difference |
|---|---|---|---|---|
| Total investment | M$ | 26.49 | 21.34 | −5.15 |
| MSW consumption per year | t | 145833 | 114583 | −31,250 |
| Annual waste disposal income | M$ | 1.90 | 1.49 | −0.41 |
| Net power generation | MW | 8.00 | 12.25 | +4.25 |
| Net annual power generation (the 100% load of CFPU is 5500 h per year) | GWh | 56.00 | 67.38 | +11.38 |
| Annual electricity sales income | M$ | 5.60 | 6.74 | +1.14 |
| Total annual income | M$ | 7.50 | 8.23 | +0.73 |
| Yearly operation and maintenance cost | M$ | 2.65 | 2.13 | −0.52 |
| Dynamic payback period | year | 11.39 | 5.48 | −5.91 |
| Net present value | M$ | 9.60 | 24.02 | +14.42 |
Publisher’s Note: MDPI stays neutral with regard to jurisdictional claims in published maps and institutional affiliations. |
© 2022 by the authors. Licensee MDPI, Basel, Switzerland. This article is an open access article distributed under the terms and conditions of the Creative Commons Attribution (CC BY) license (https://creativecommons.org/licenses/by/4.0/).
Share and Cite
Zhang, Y.; Wei, L.; Gao, X.; Chen, H.; Li, Q.; Zhang, K.; Huang, Q. Performance Analysis of a Waste-to-Energy System Integrated with the Steam–Water Cycle and Urea Hydrolysis Process of a Coal-Fired Power Unit. Appl. Sci. 2022, 12, 866. https://doi.org/10.3390/app12020866
Zhang Y, Wei L, Gao X, Chen H, Li Q, Zhang K, Huang Q. Performance Analysis of a Waste-to-Energy System Integrated with the Steam–Water Cycle and Urea Hydrolysis Process of a Coal-Fired Power Unit. Applied Sciences. 2022; 12(2):866. https://doi.org/10.3390/app12020866
Chicago/Turabian StyleZhang, Yuanyuan, Lai Wei, Xin Gao, Heng Chen, Qiubai Li, Kai Zhang, and Qilong Huang. 2022. "Performance Analysis of a Waste-to-Energy System Integrated with the Steam–Water Cycle and Urea Hydrolysis Process of a Coal-Fired Power Unit" Applied Sciences 12, no. 2: 866. https://doi.org/10.3390/app12020866