
Scanning Strategy Investigation for Direct Powder Bed Selective Laser Processing of Silicon Carbide Ceramic

 , , , ,
  and
and
Abstract
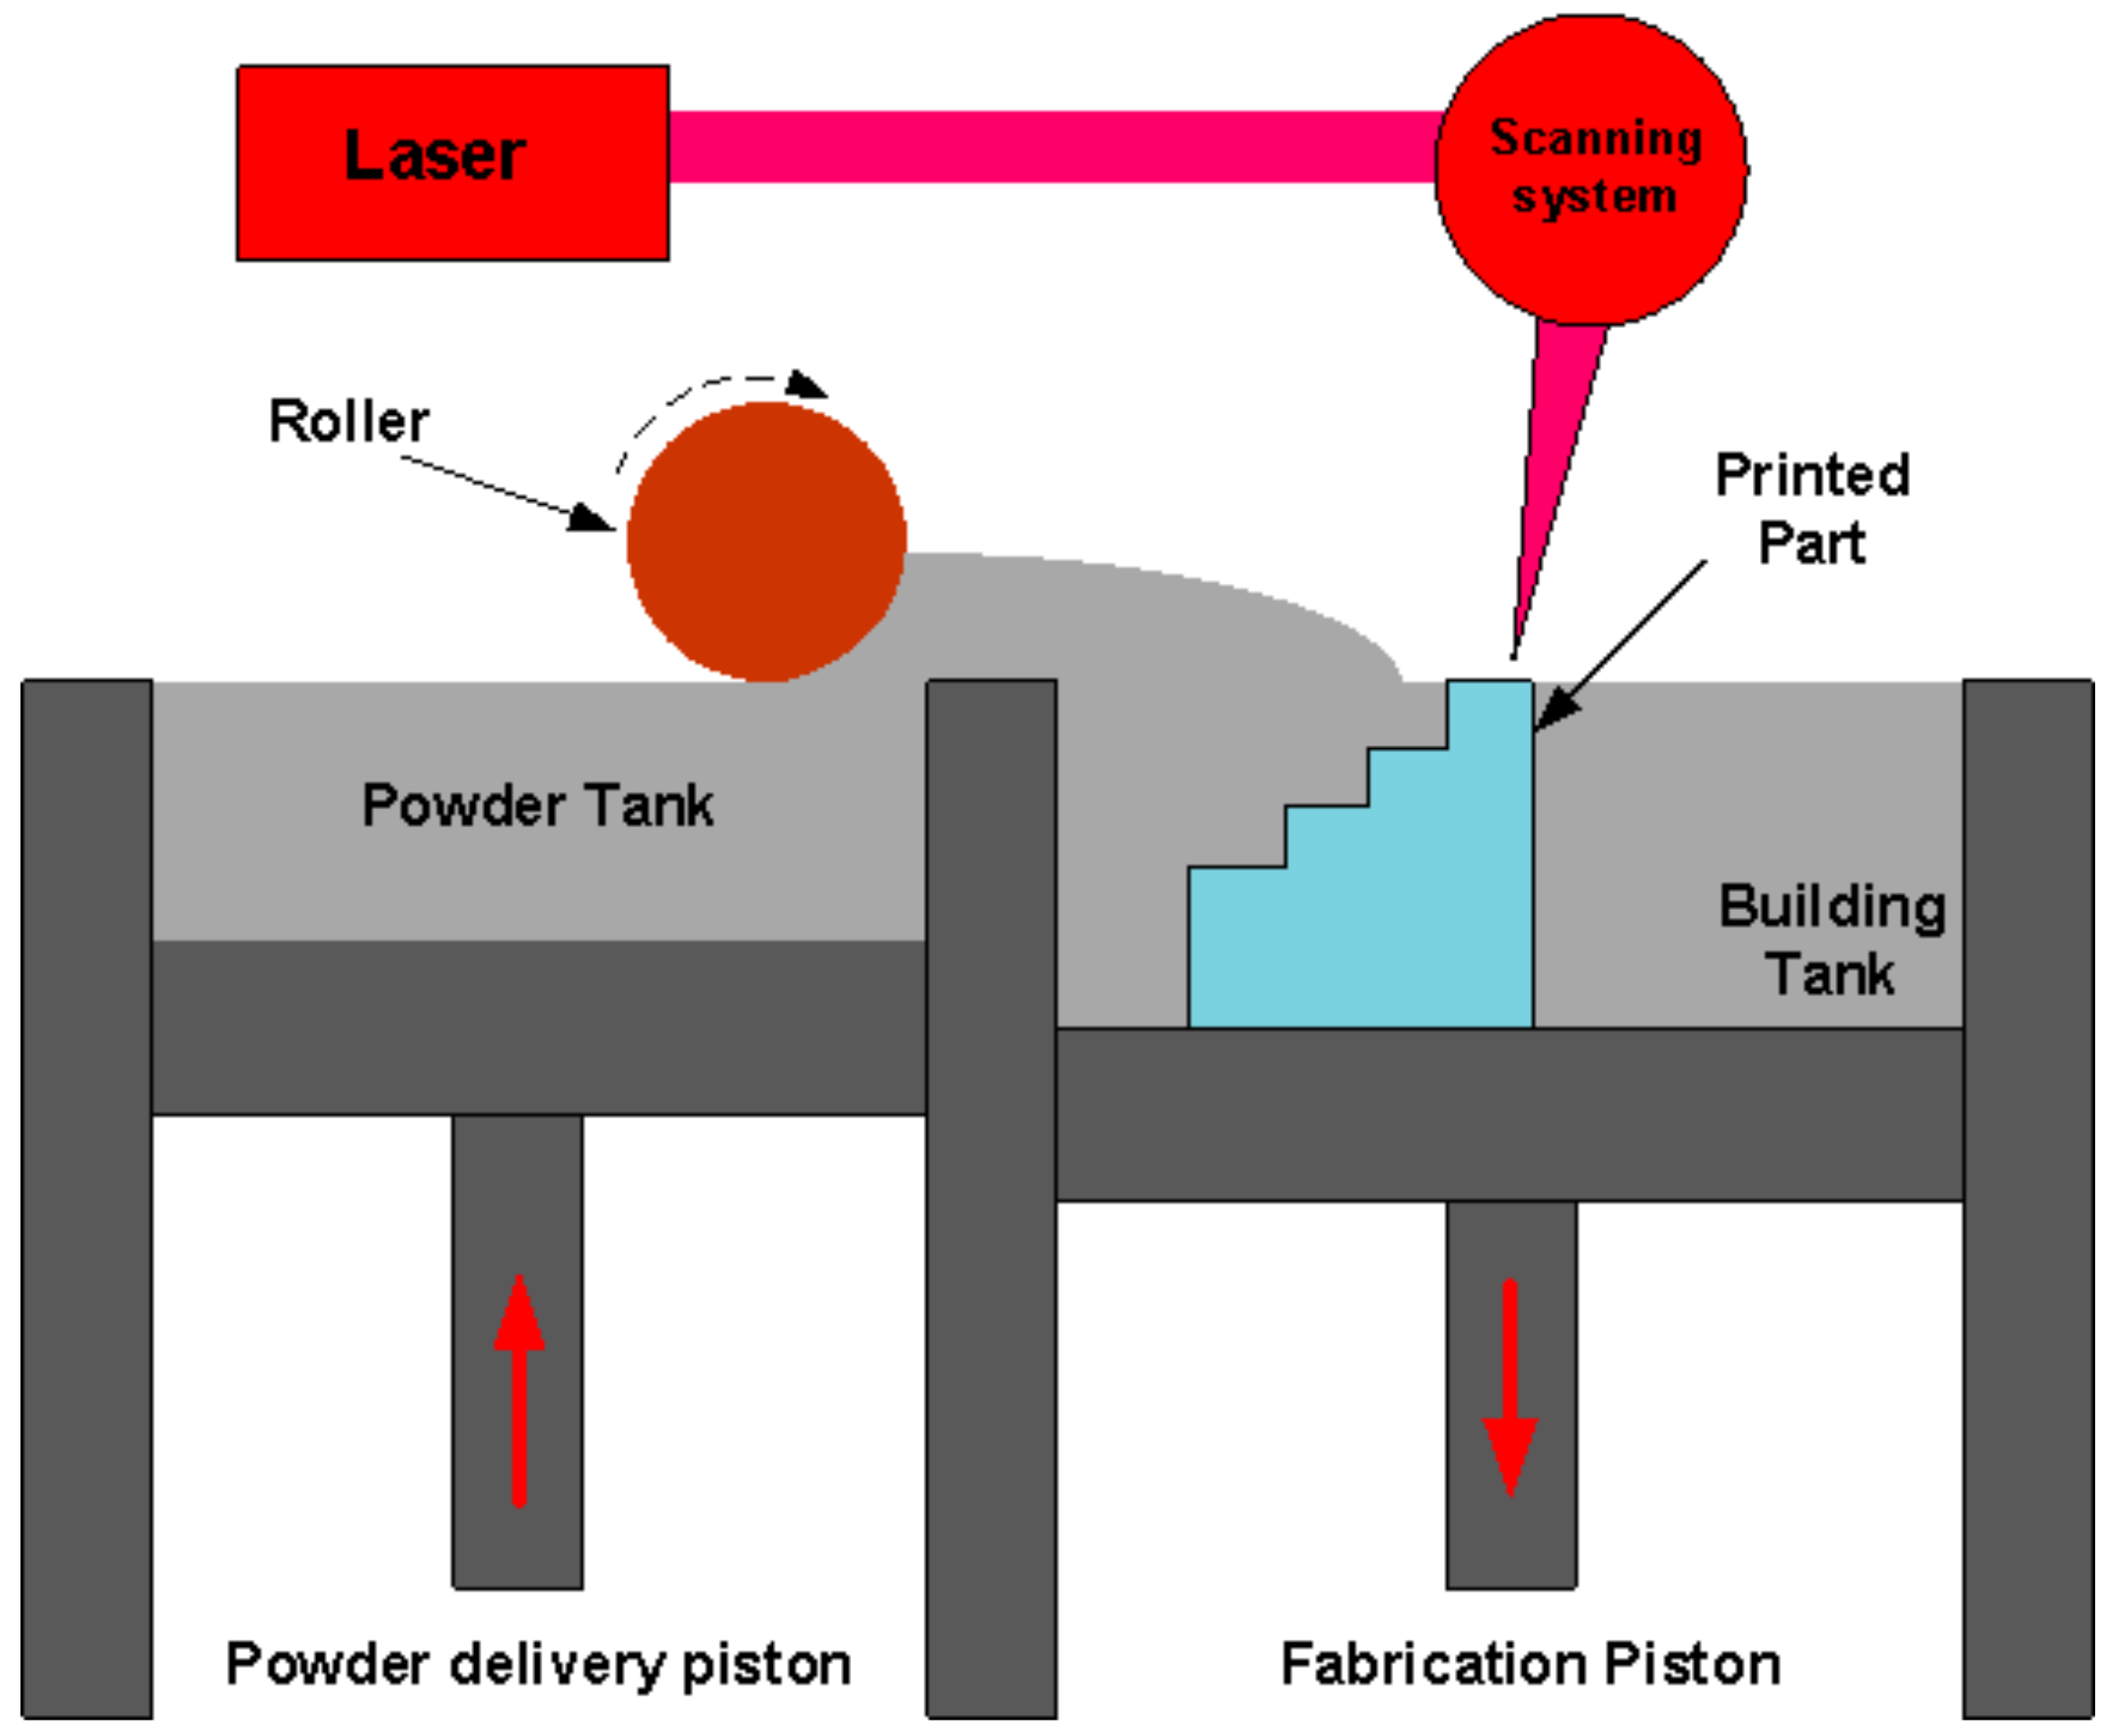
:1. Introduction
2. Methodology
2.1. Numerical Procedures
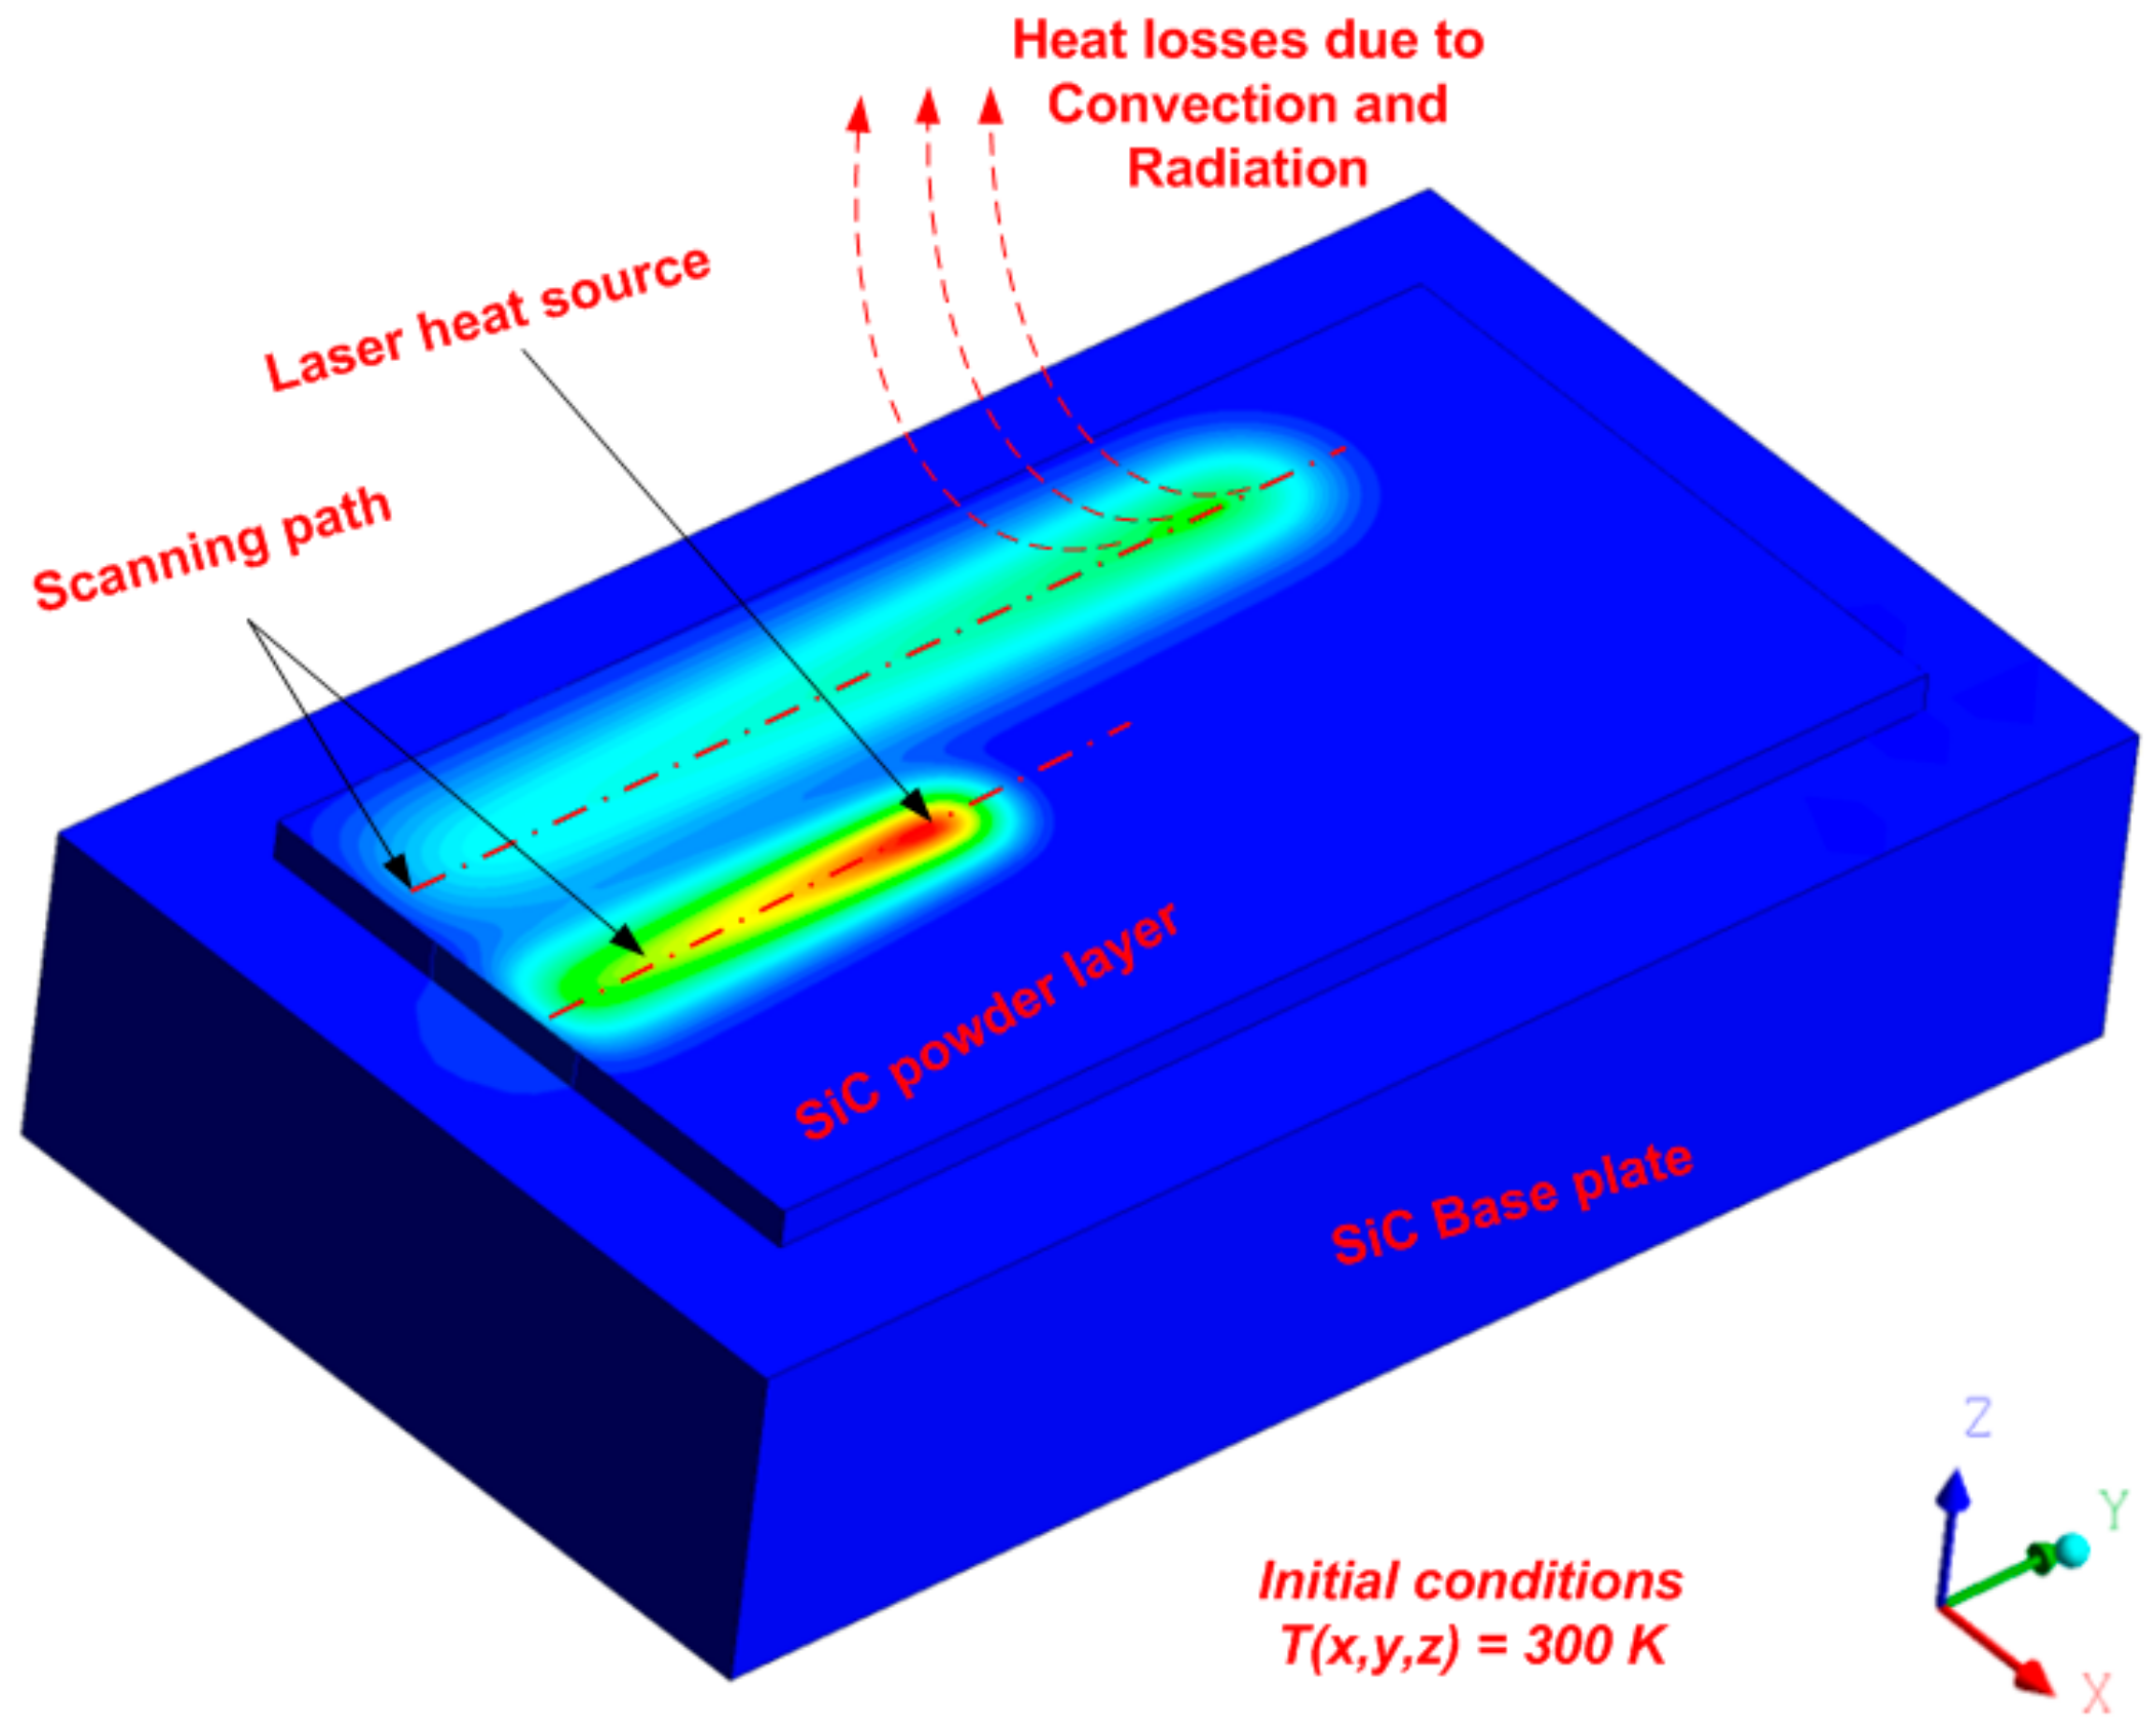
2.1.1. Numerical Model Development
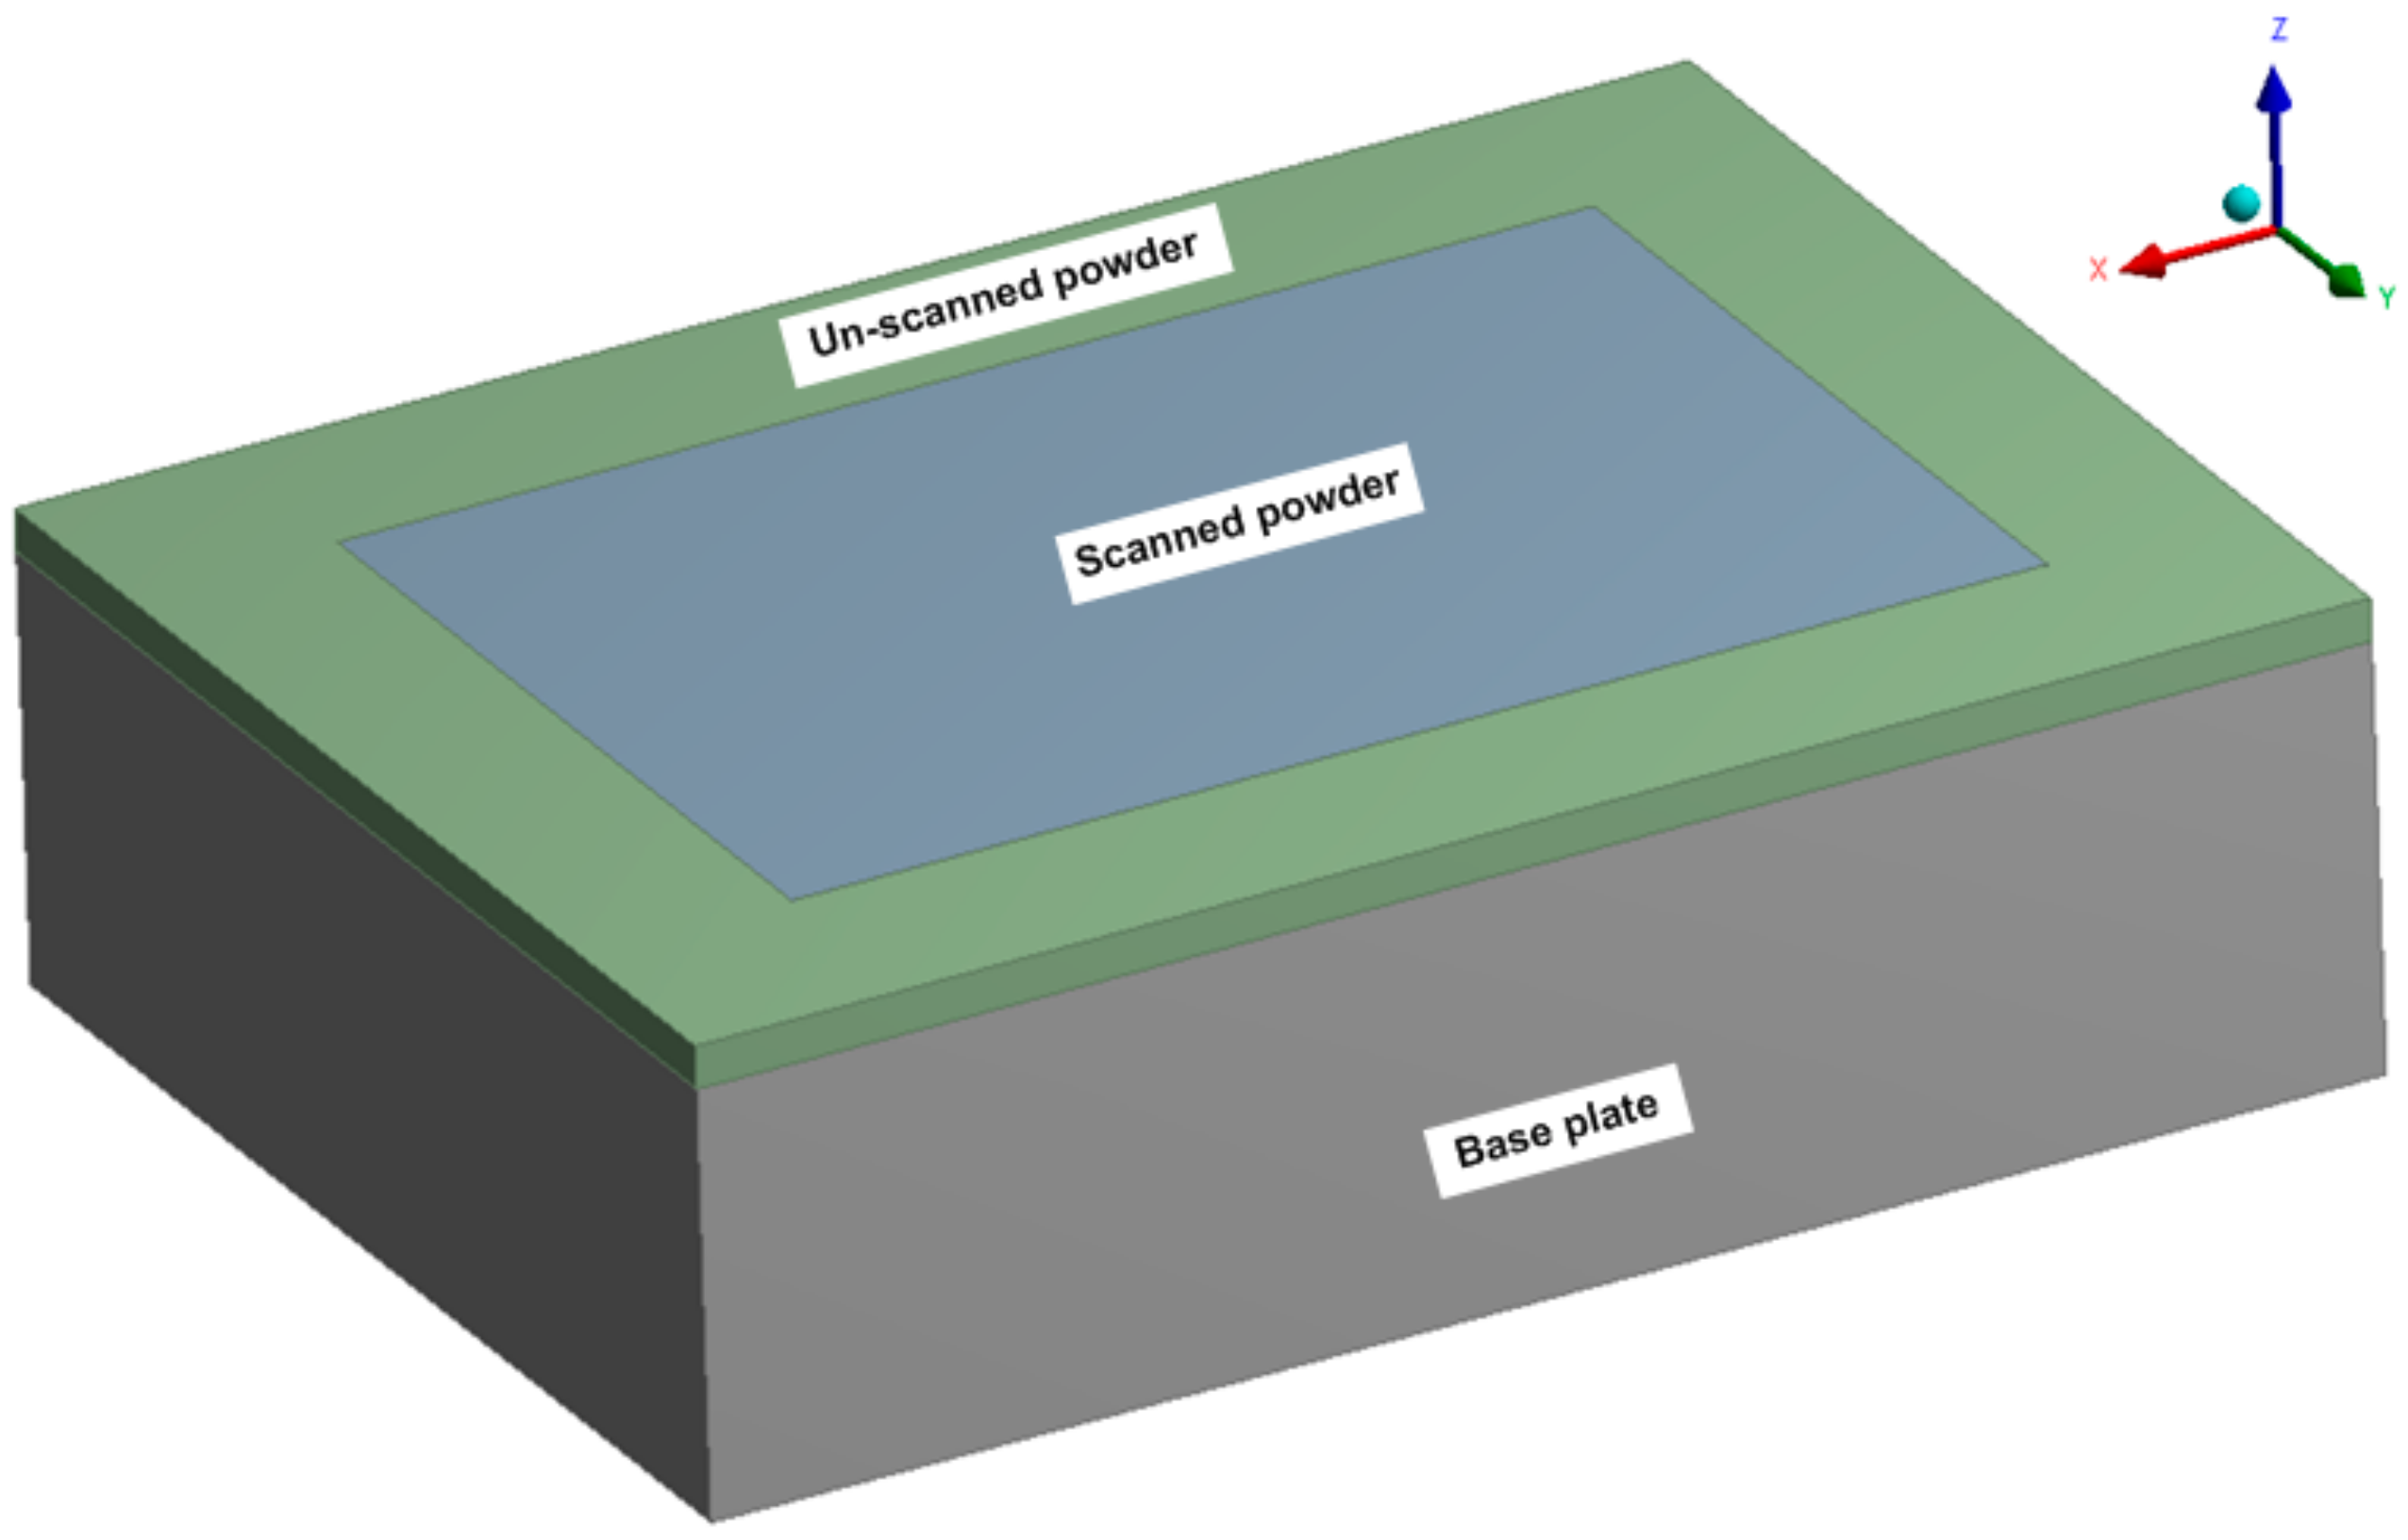
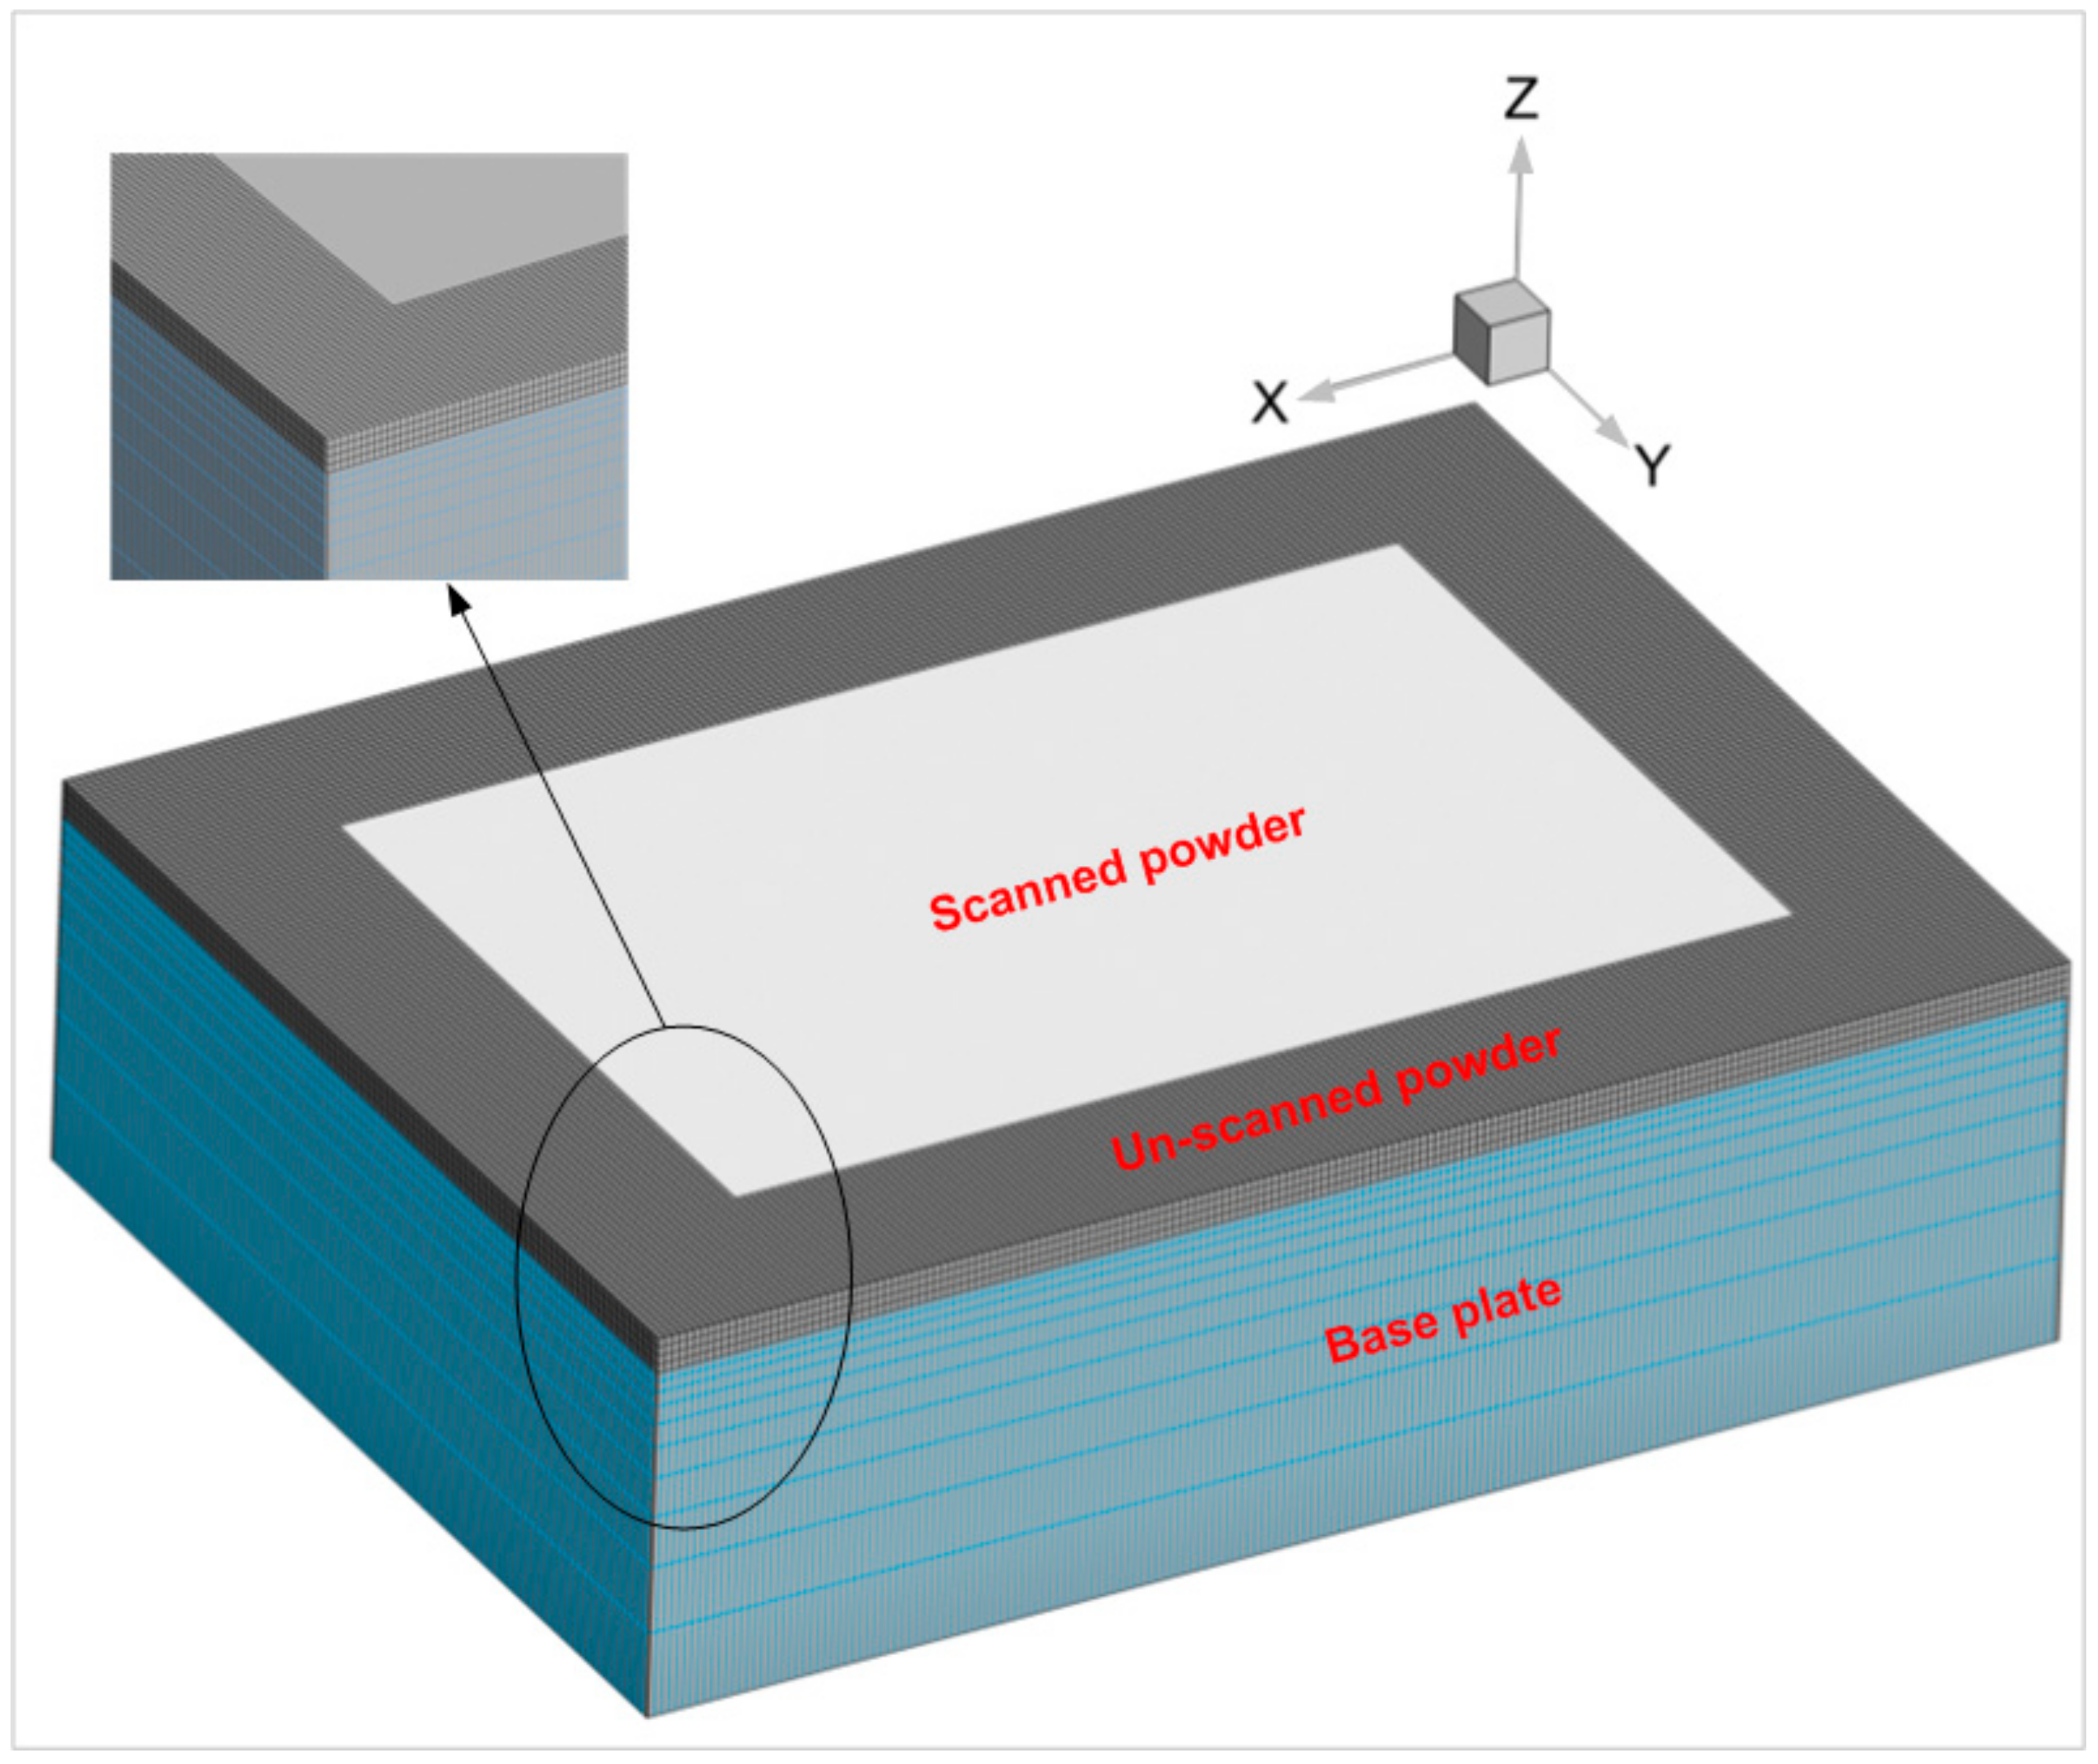
2.1.2. Model Geometry and the Computational Domain
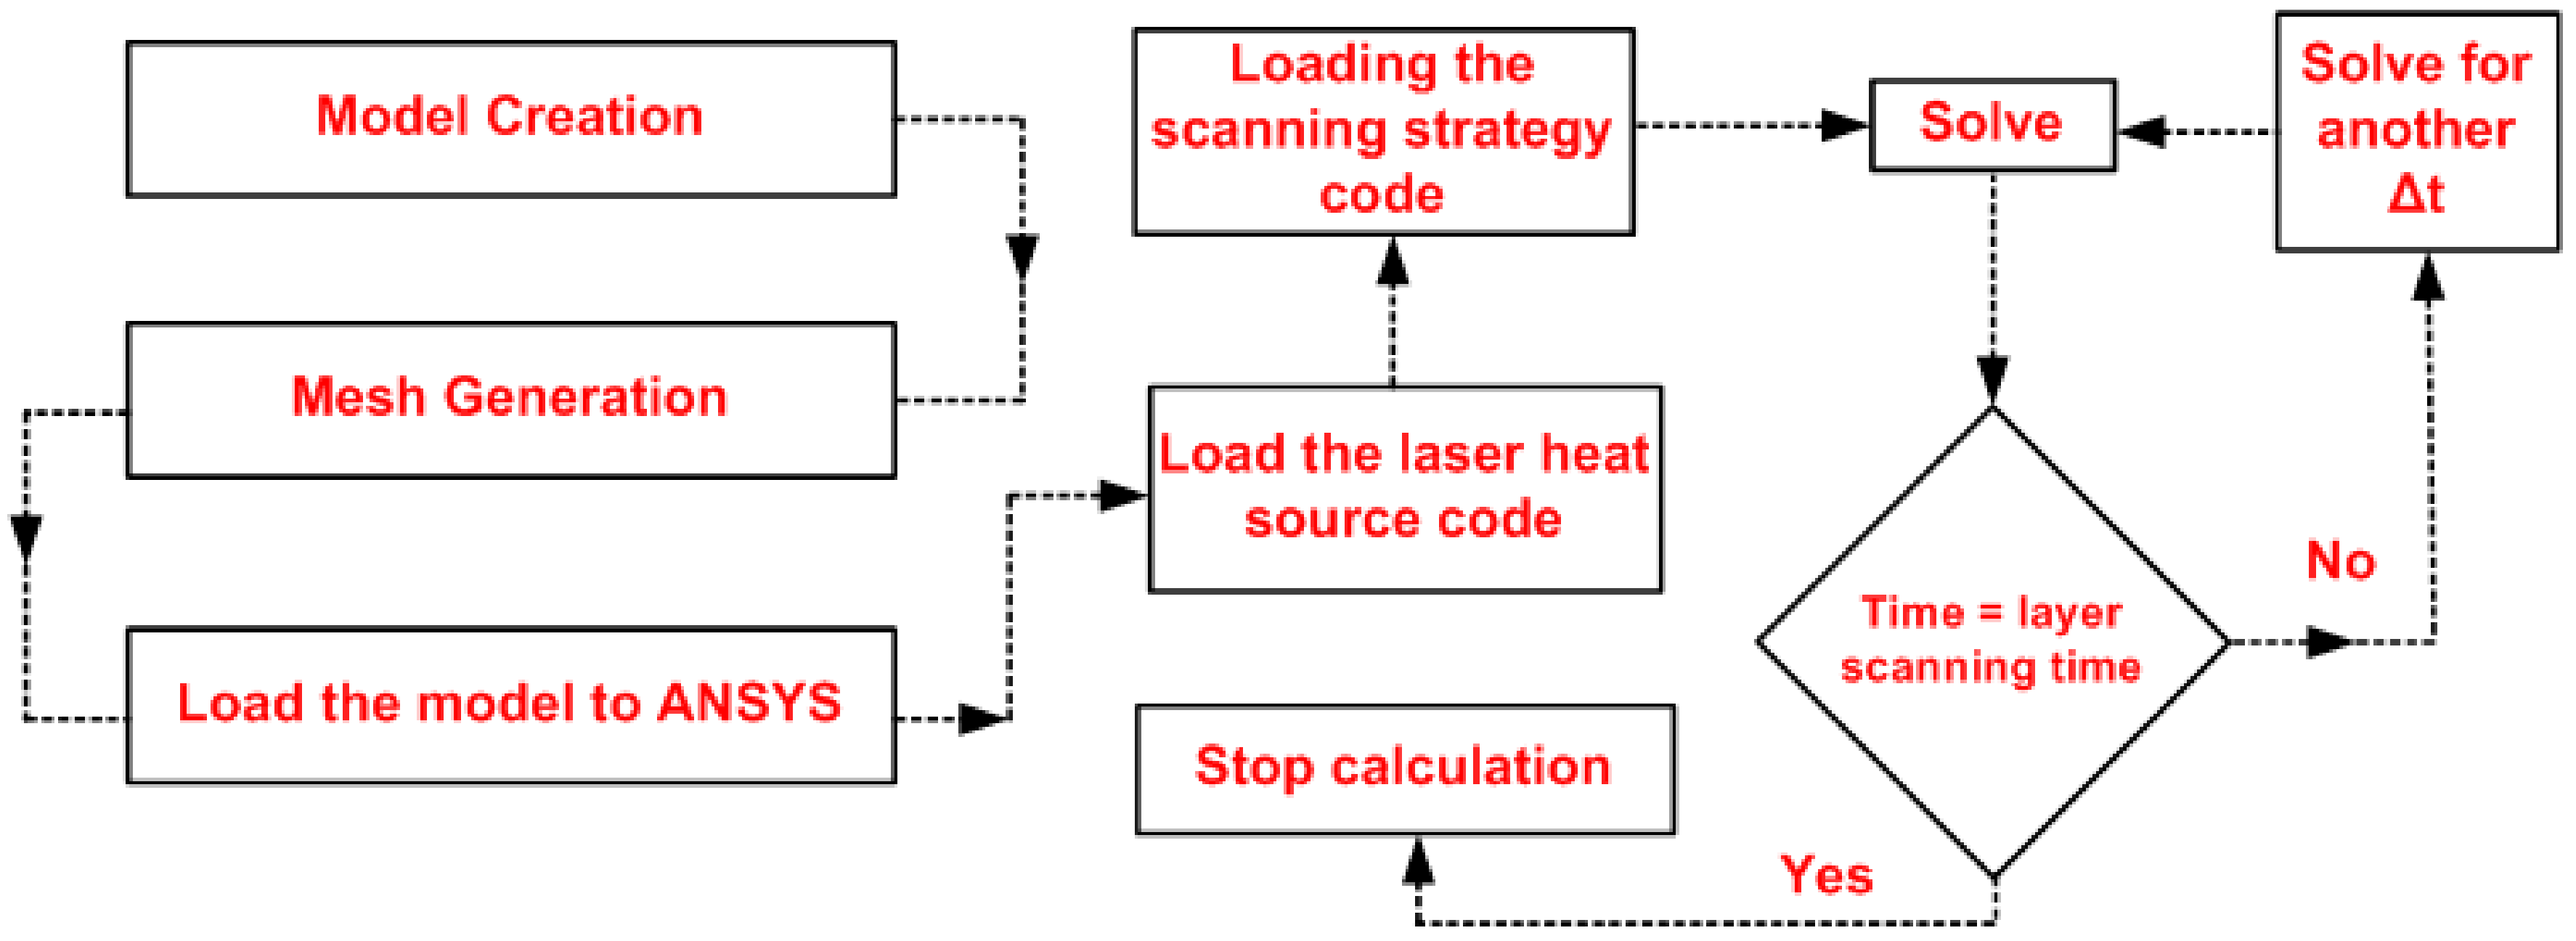
2.1.3. Numerical solution
2.2. Experimental Procedures
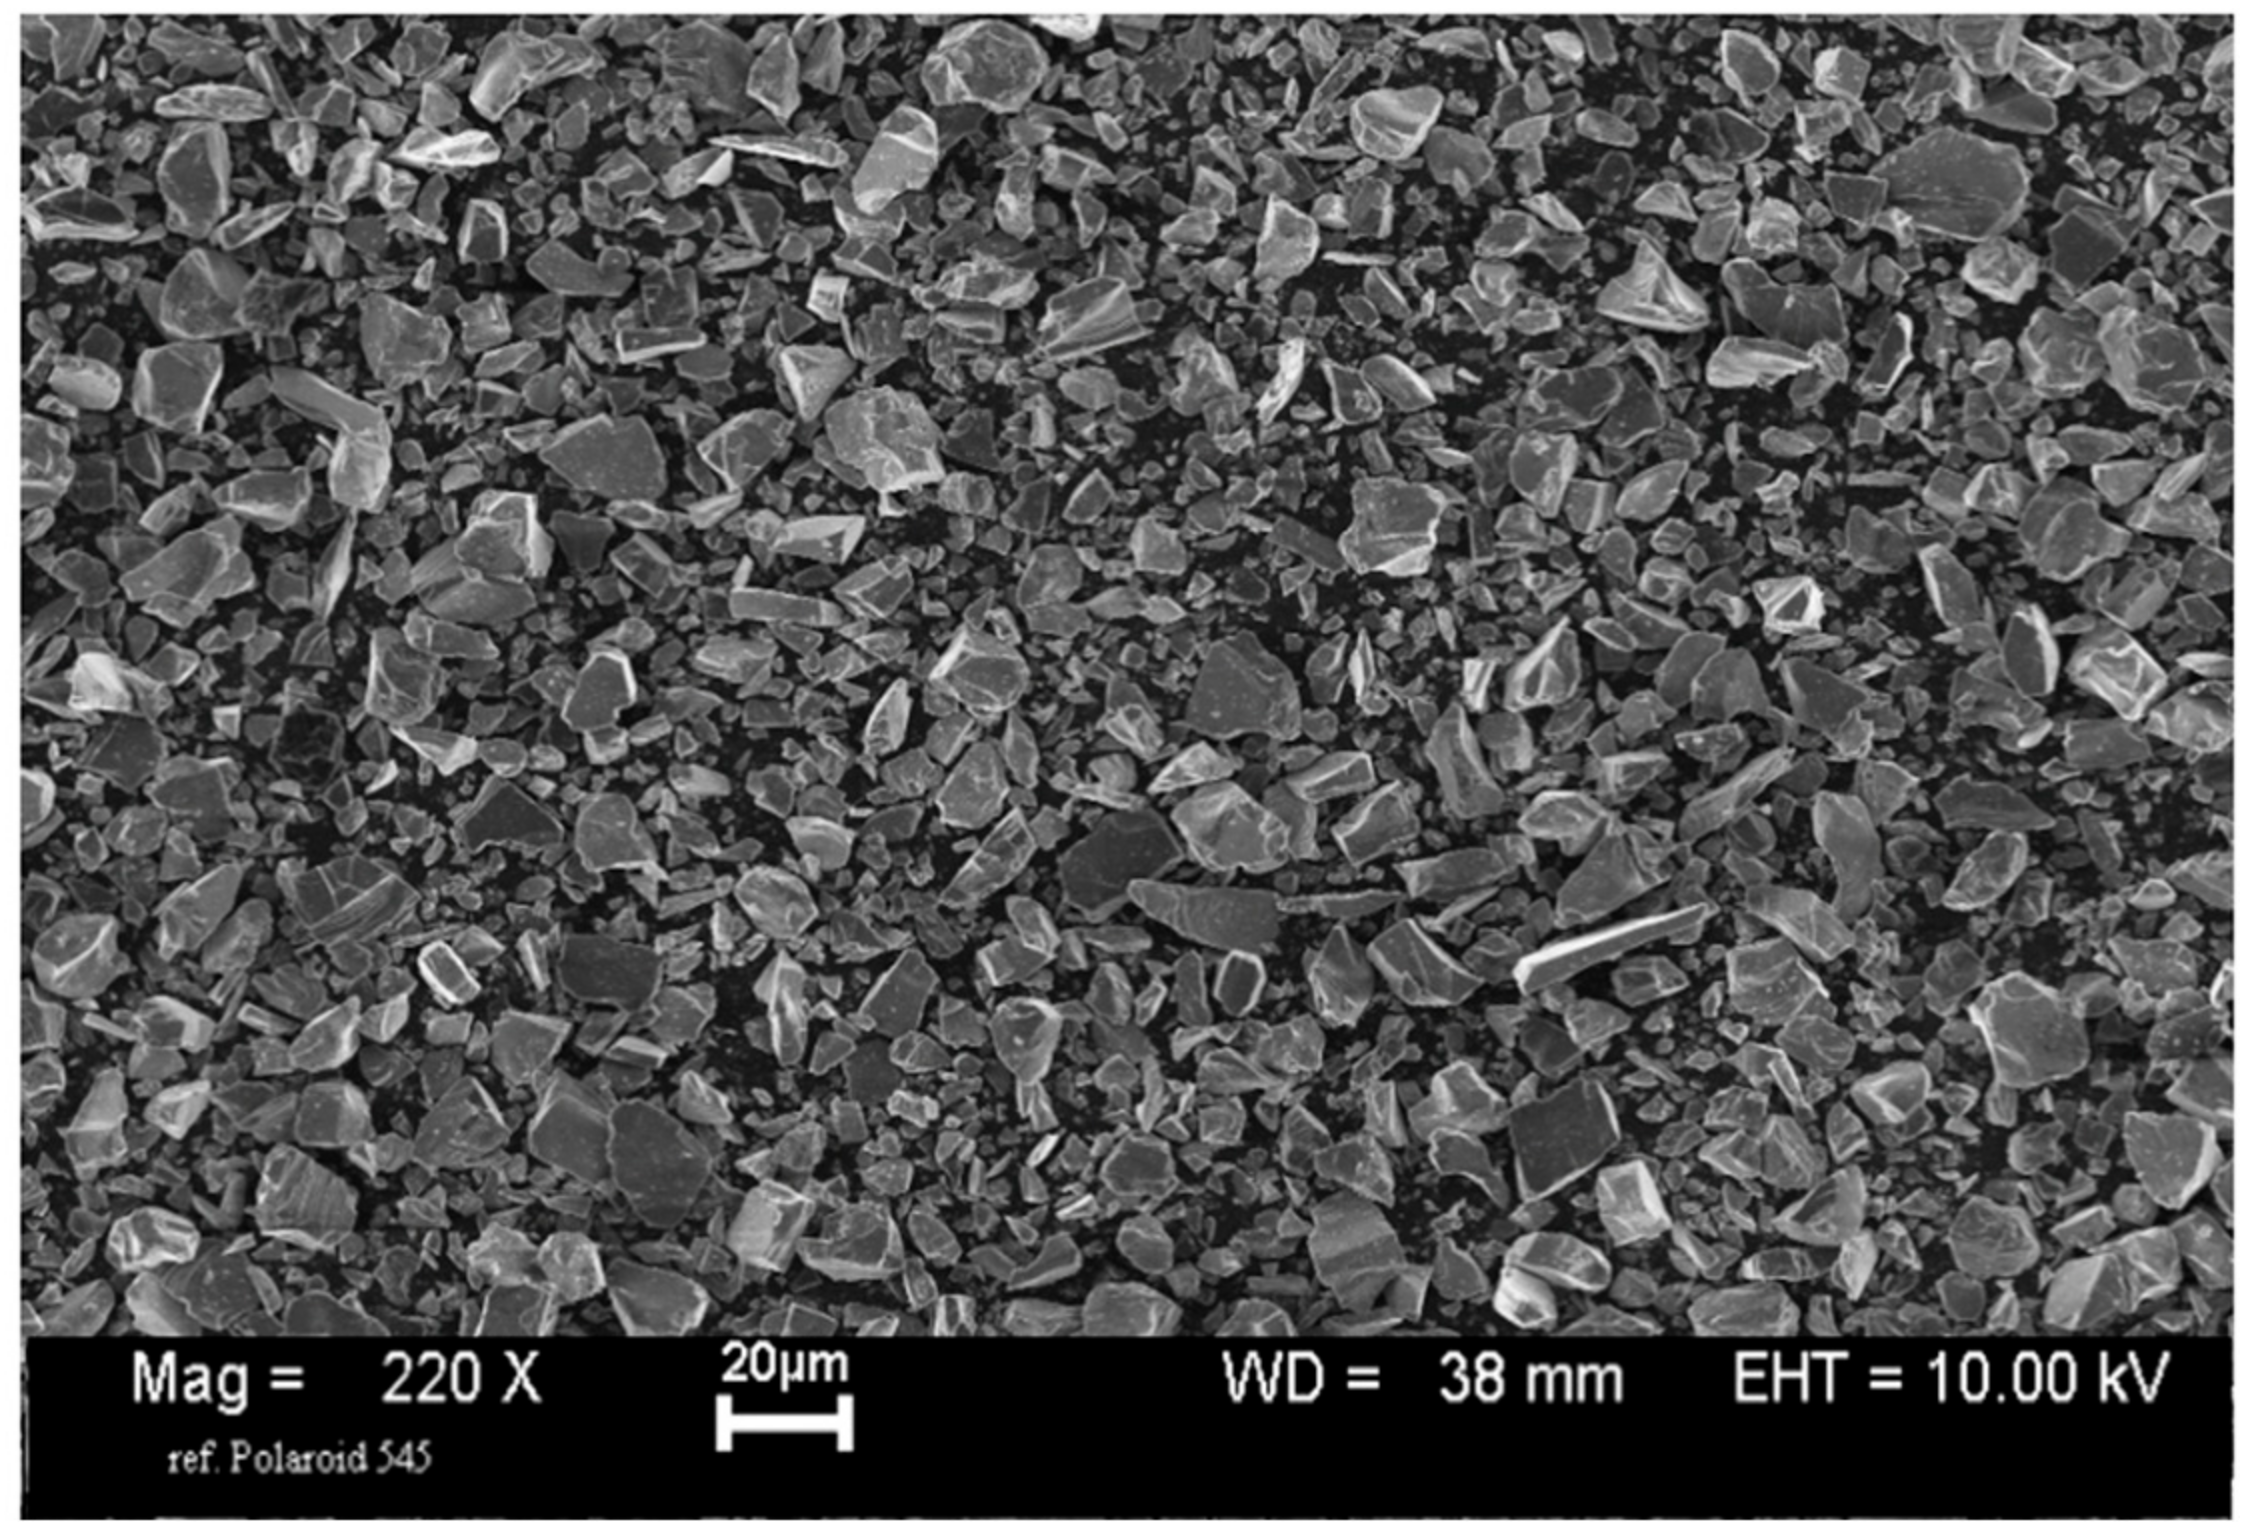
2.2.1. Powder Characterization
2.2.2. Sample Preparation and Characterization
3. Results and Discussion
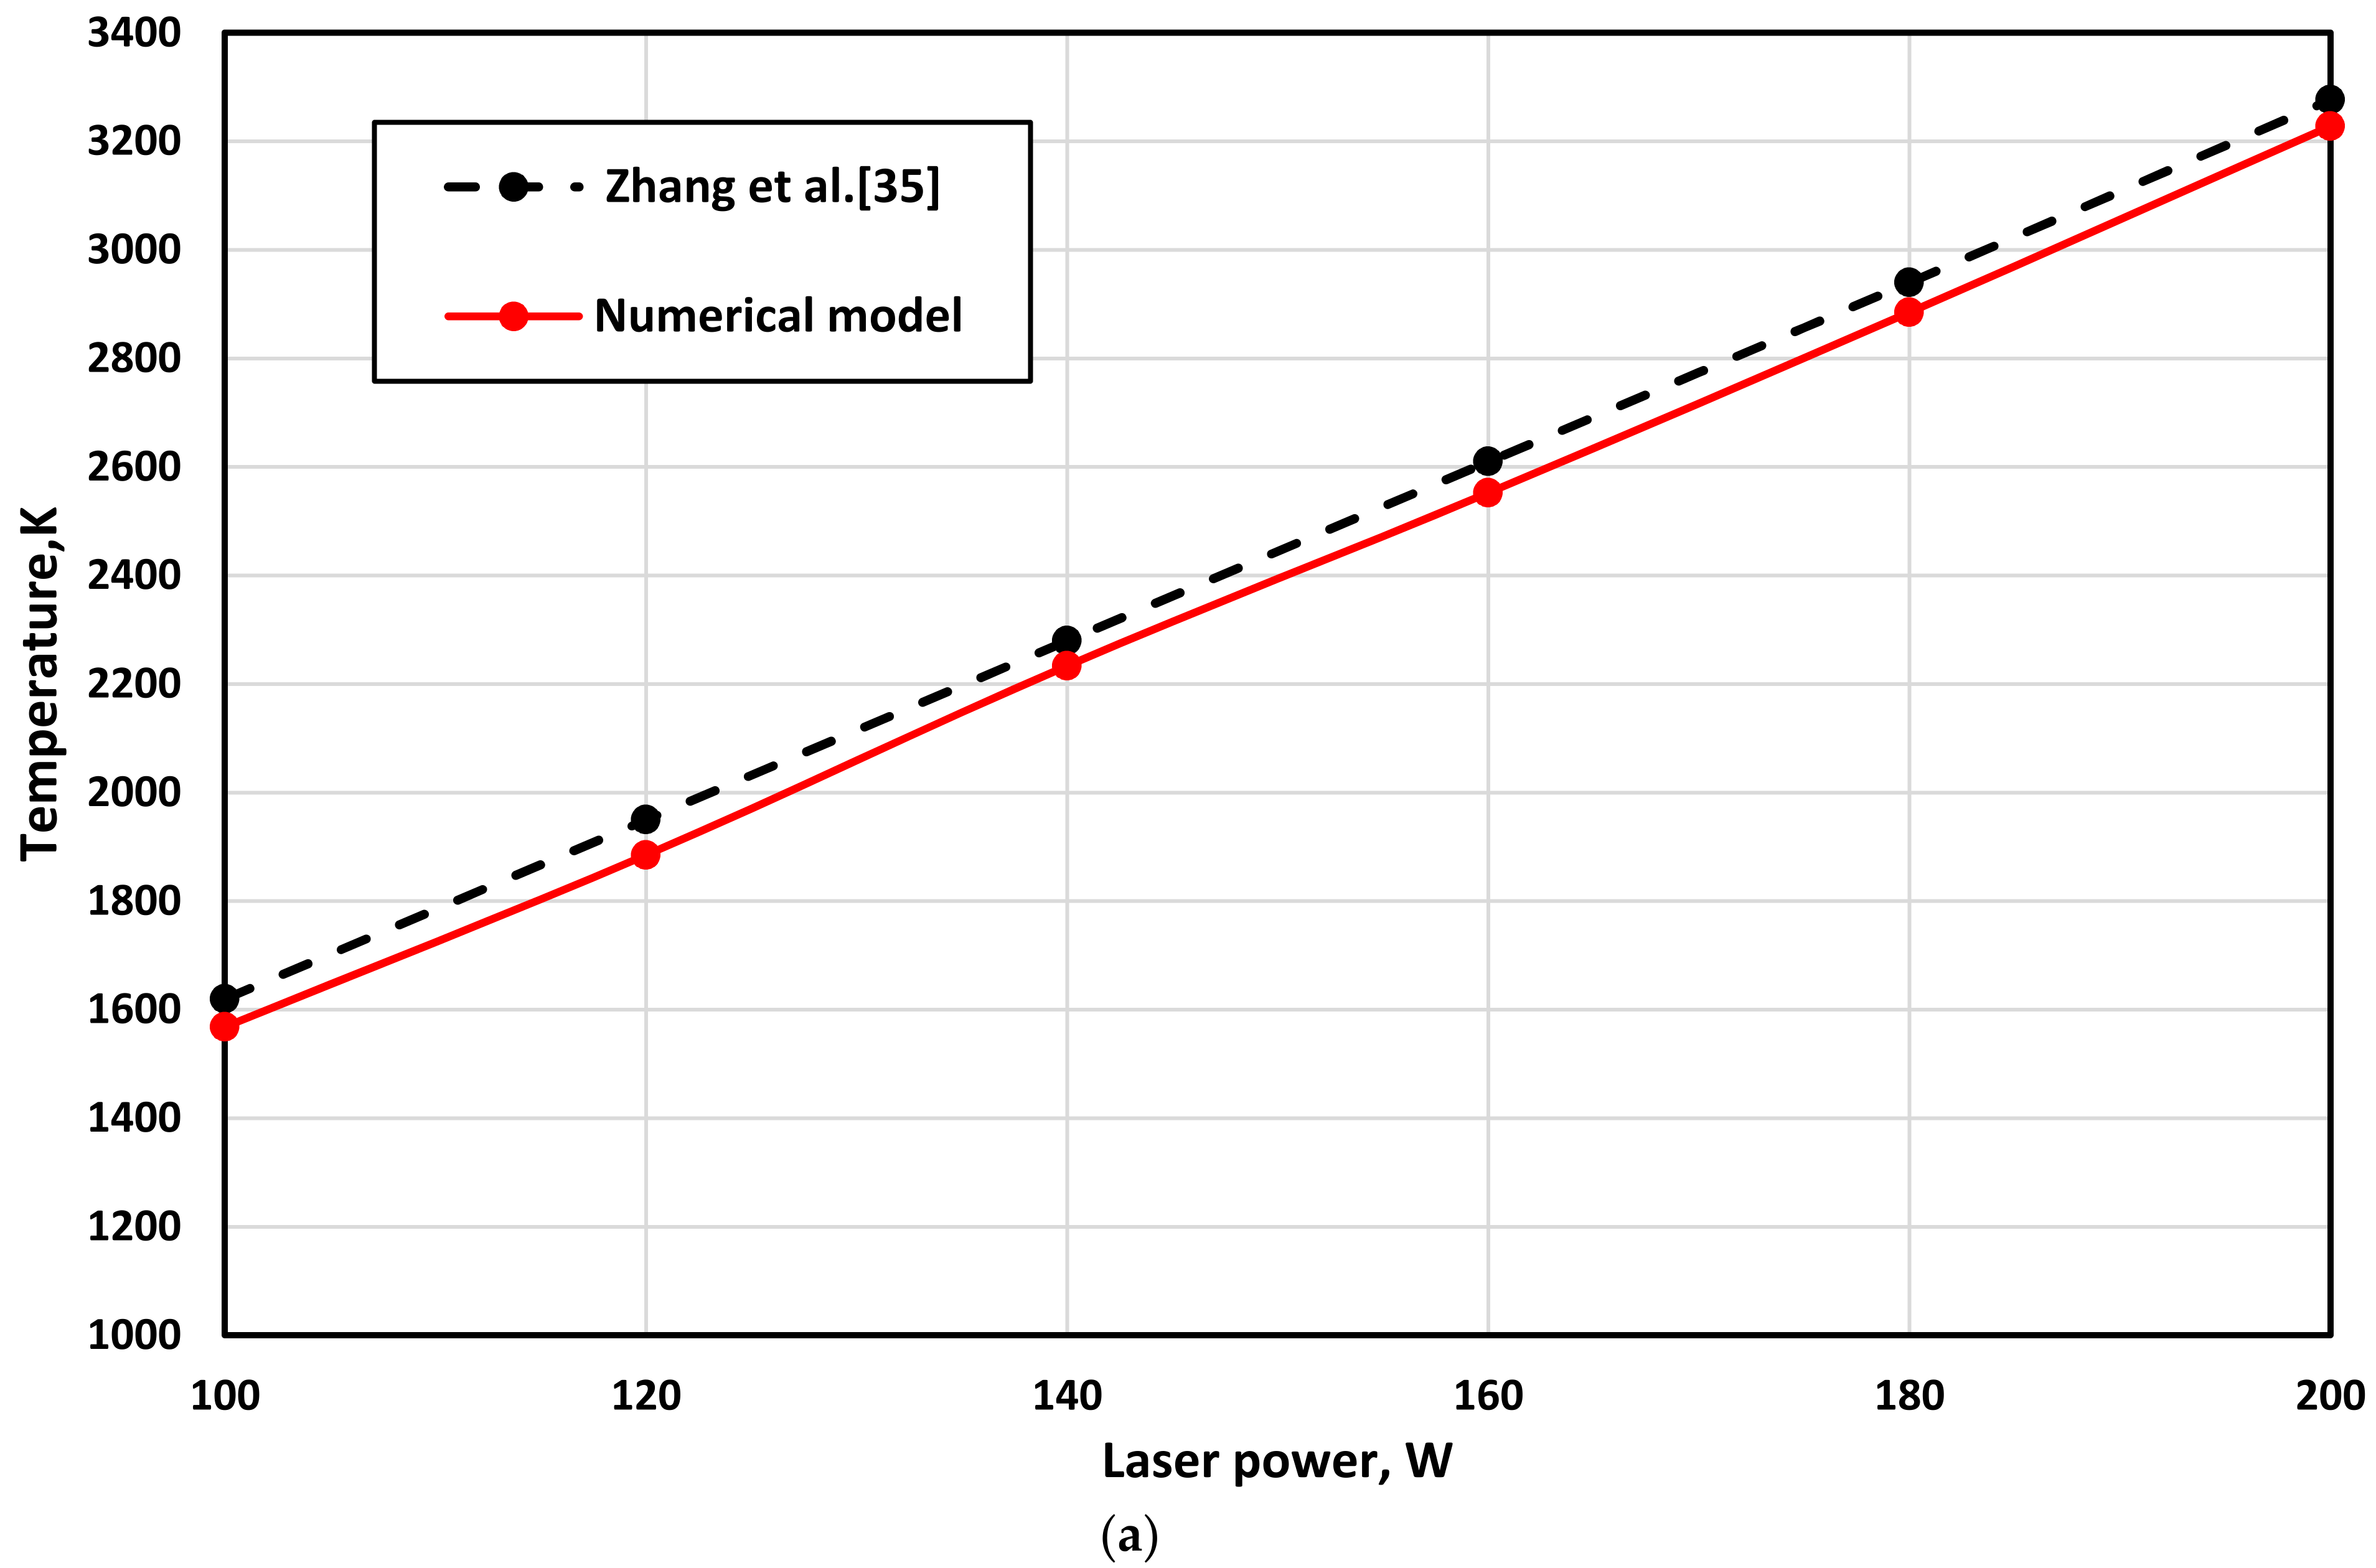
3.1. Model Validation
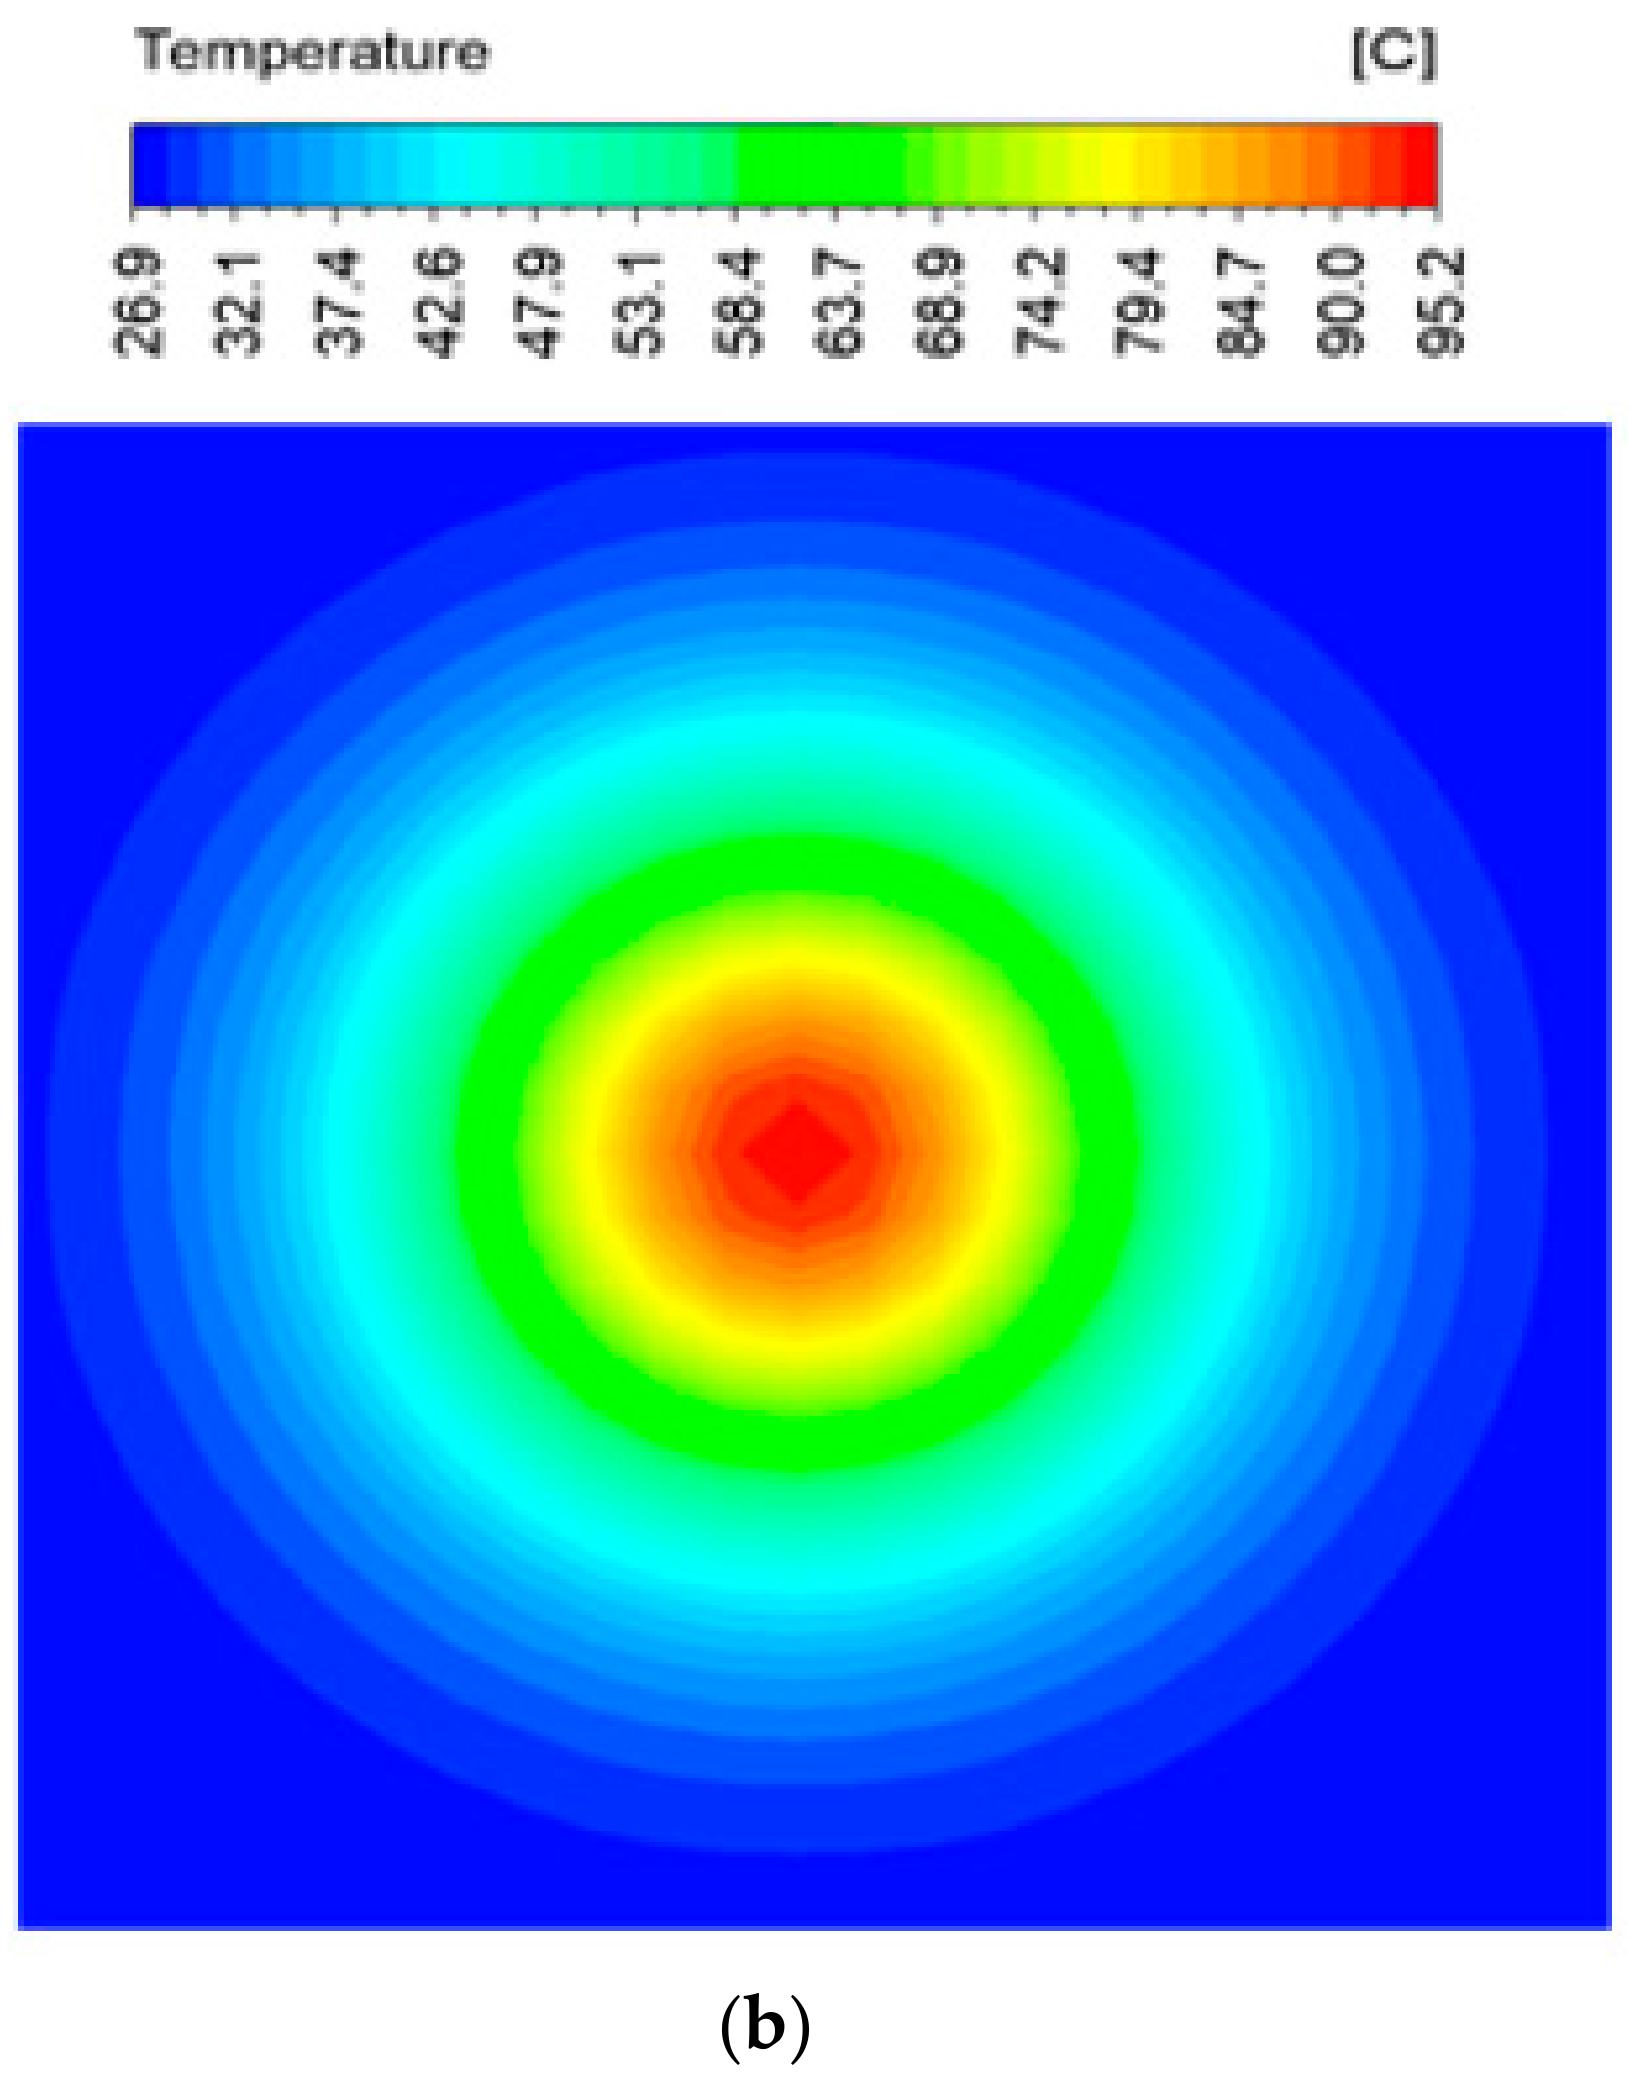
3.2. Numerical Results
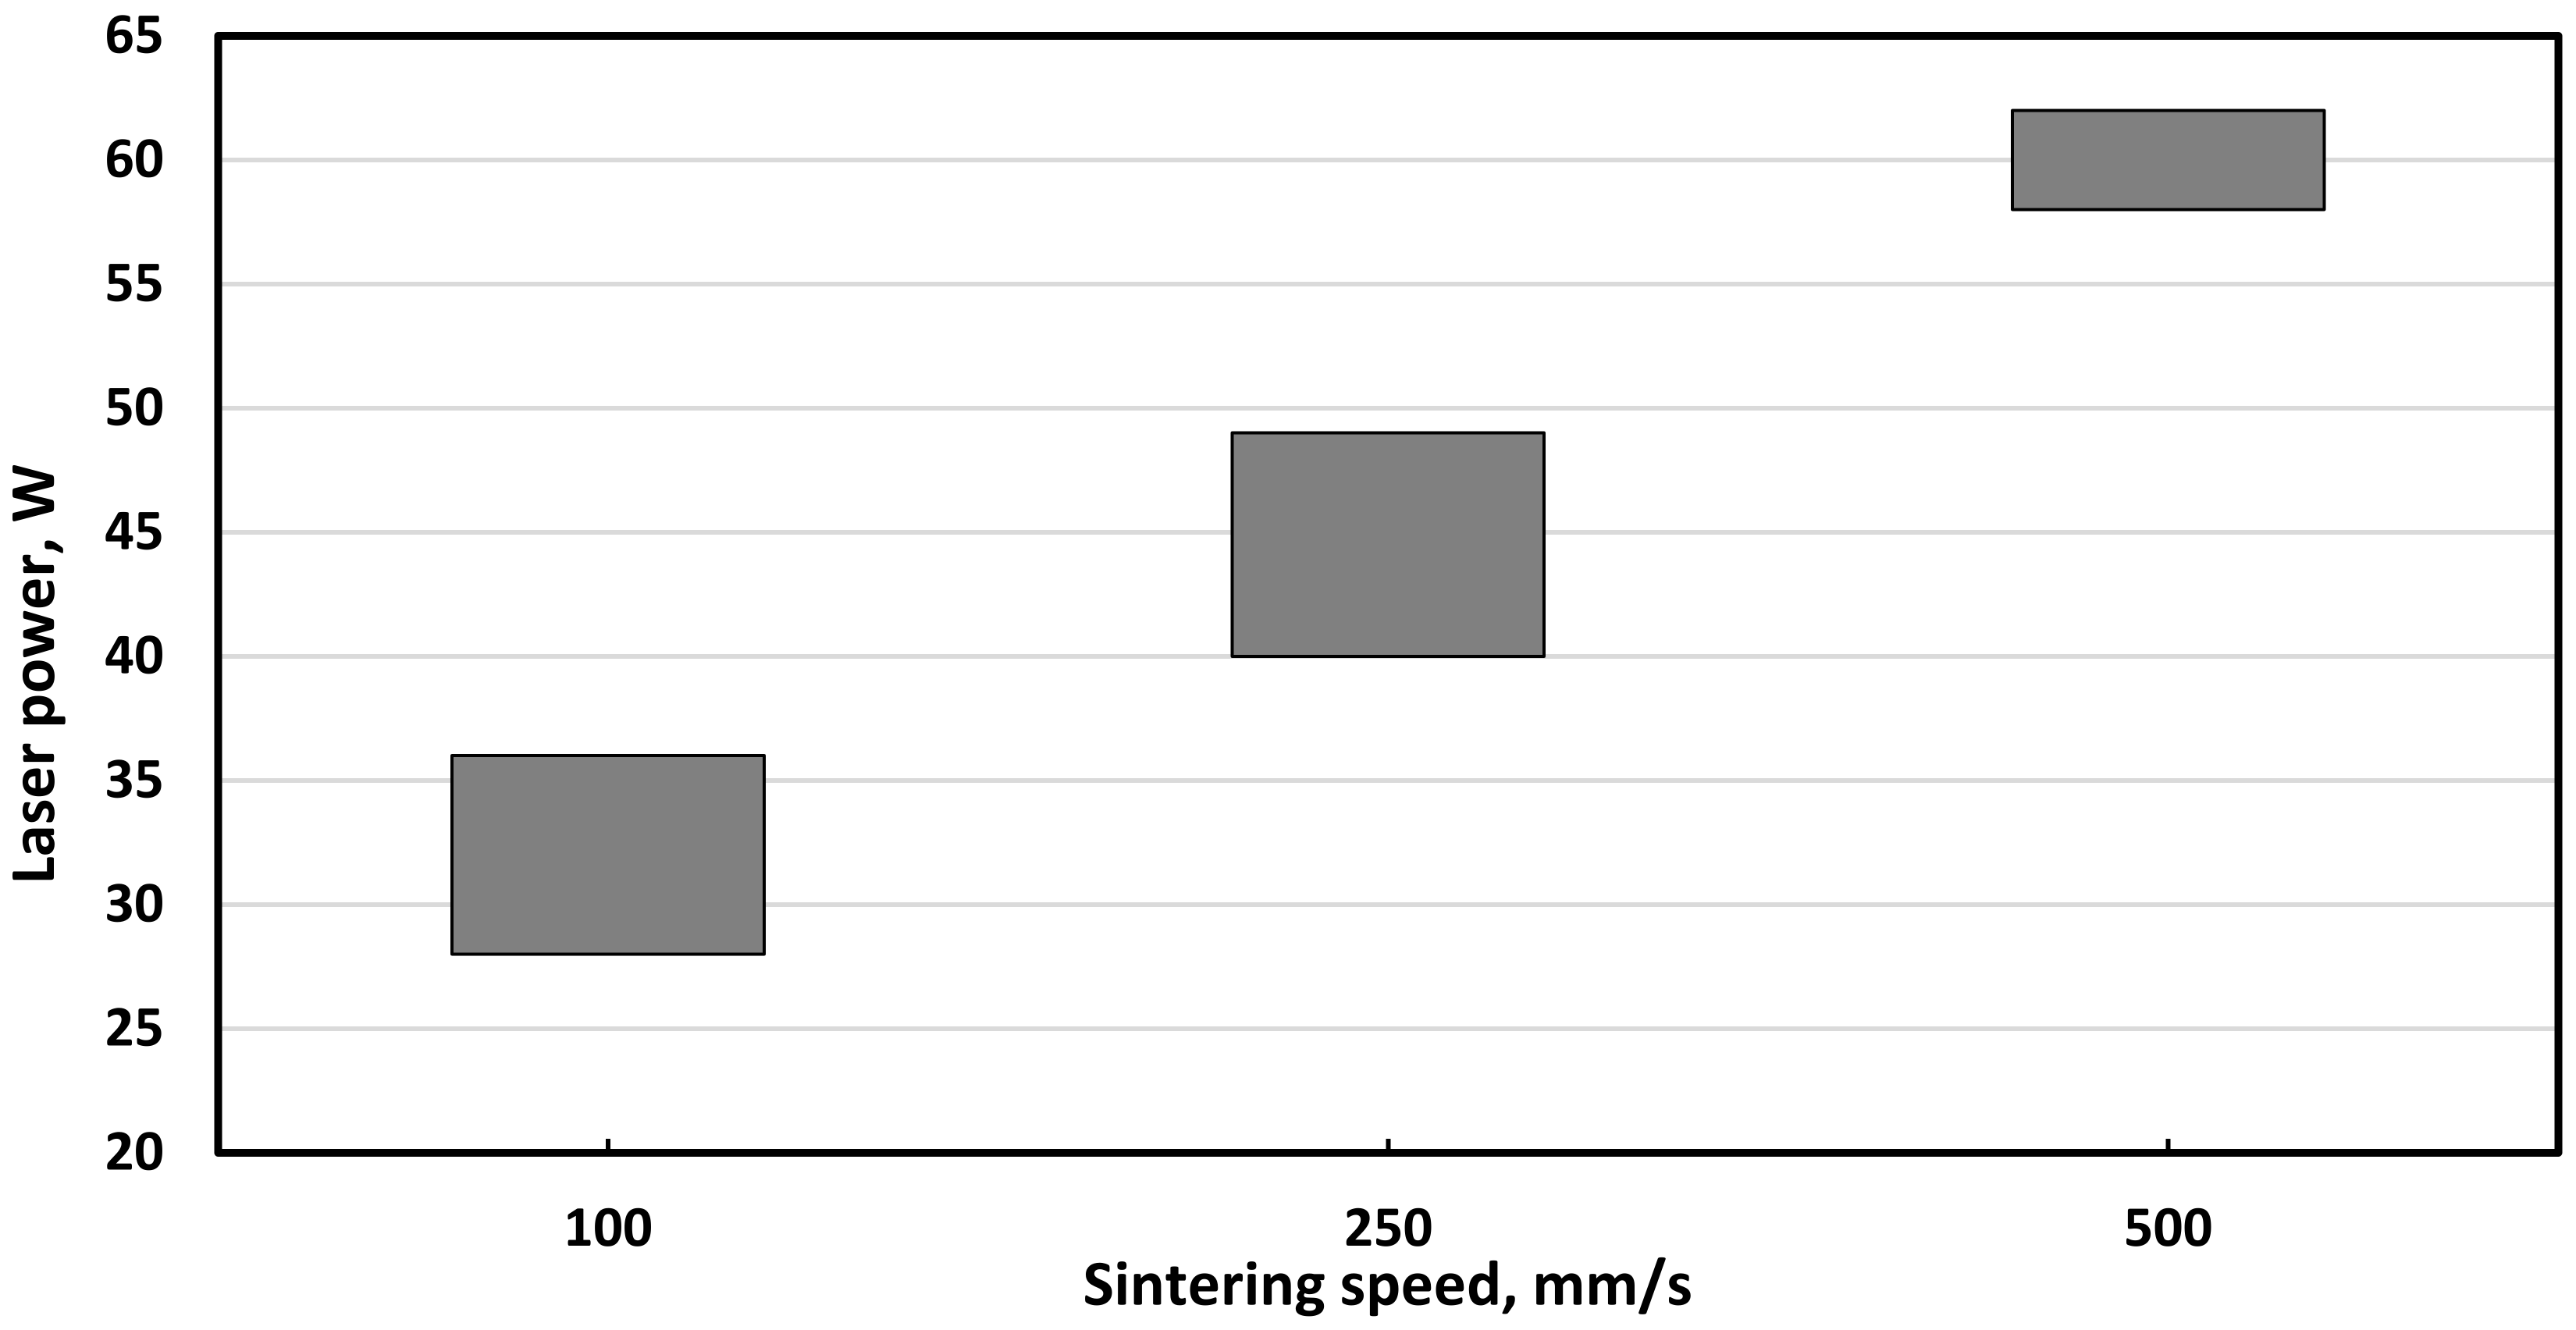
3.3. Experimental Results
4. Conclusions and Future Study
- D-PBSLP OF SiC is possible through the optimization of the process parameters.
- The numerical model effectively predicts the process parameters even for hard to print materials such as SiC.
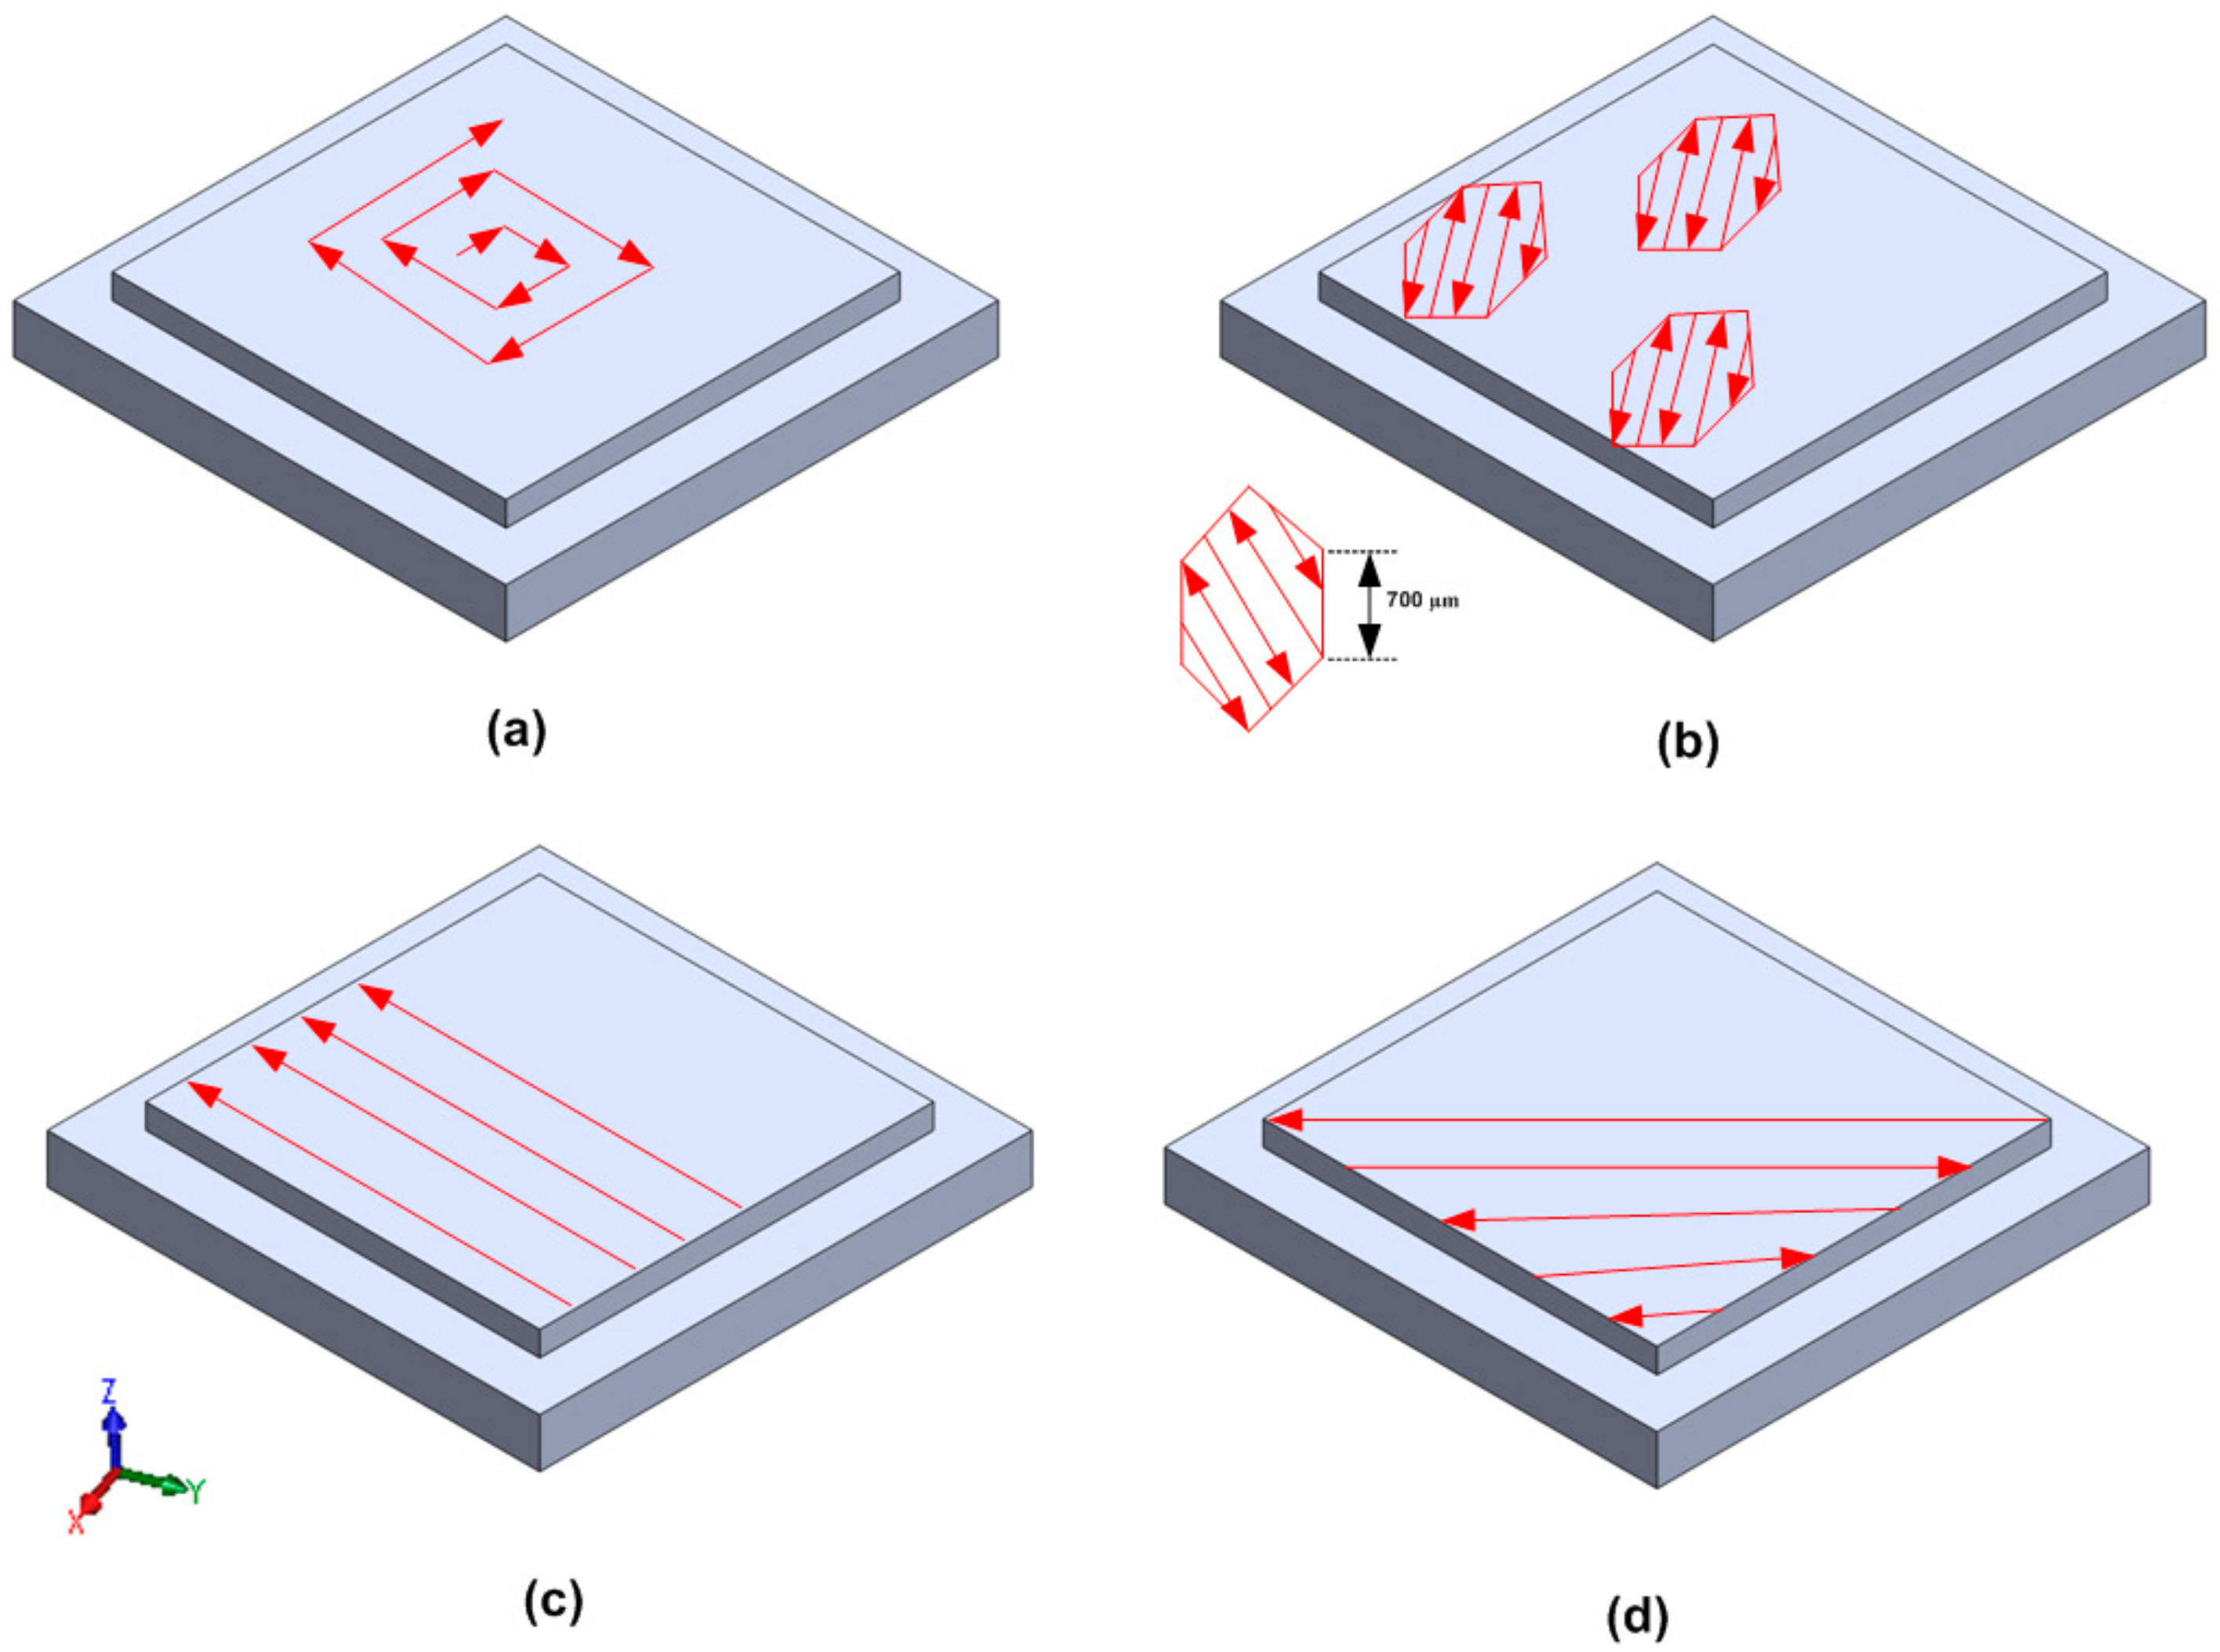
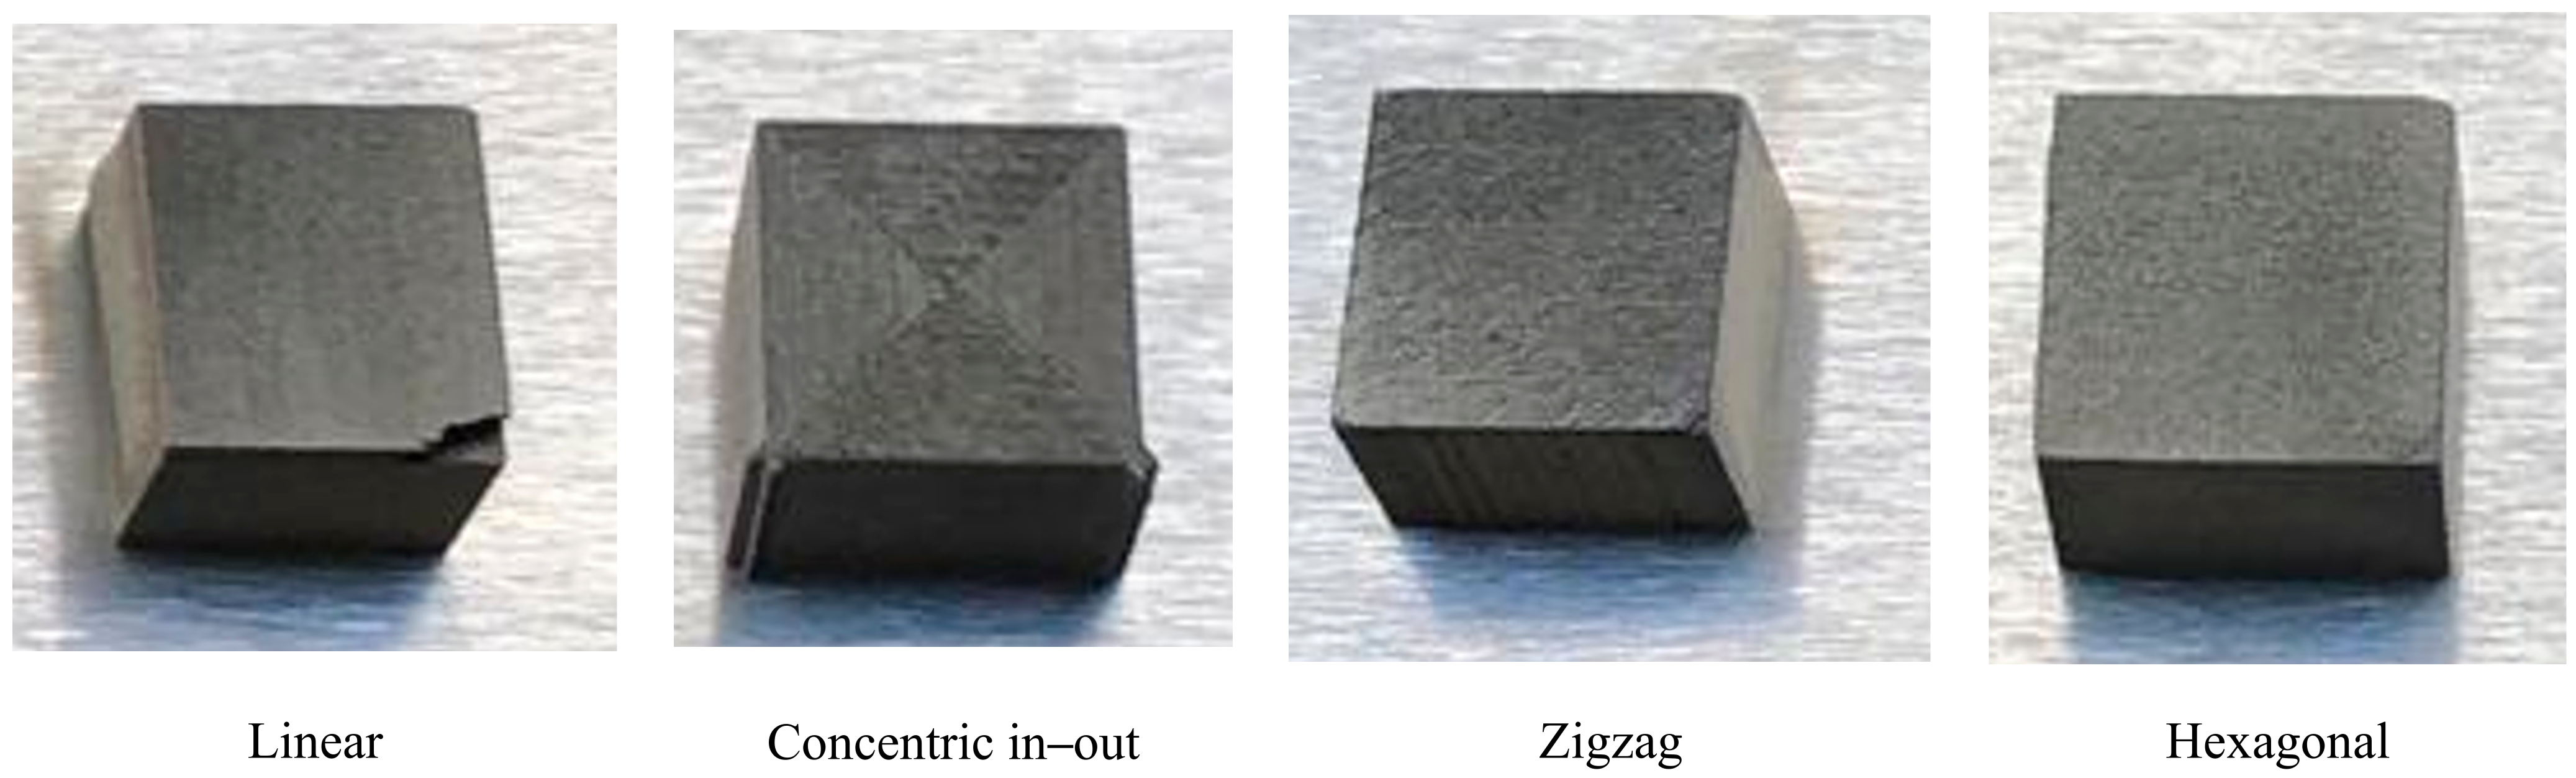
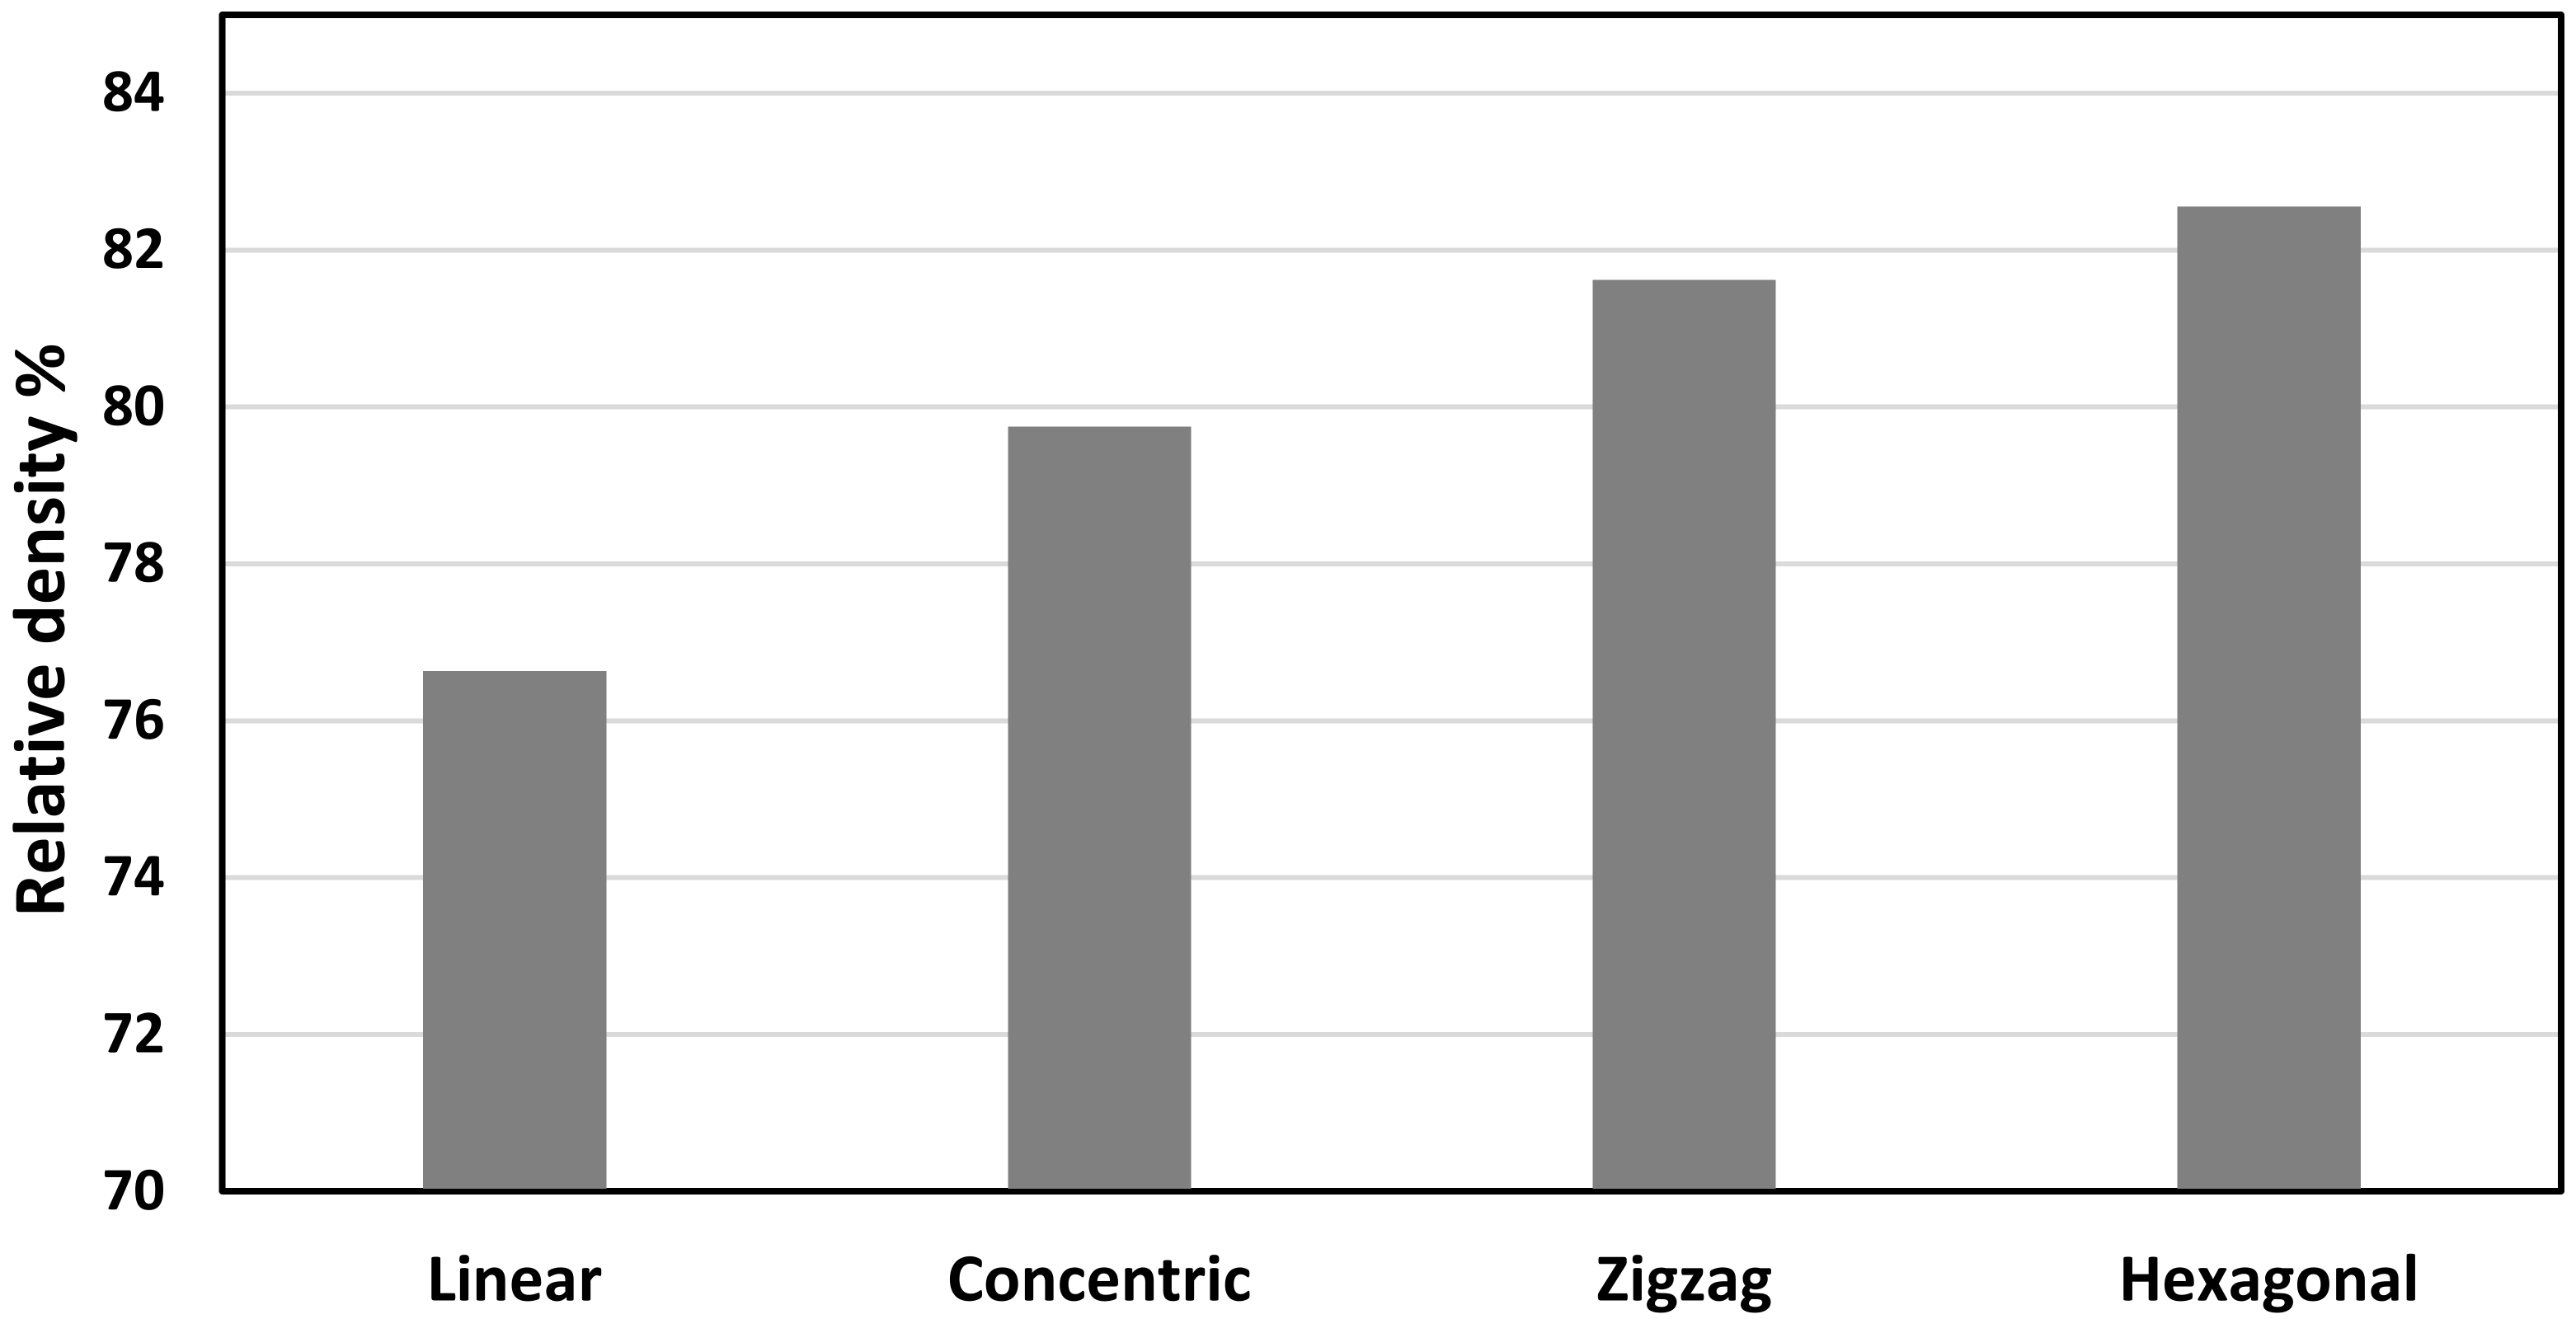
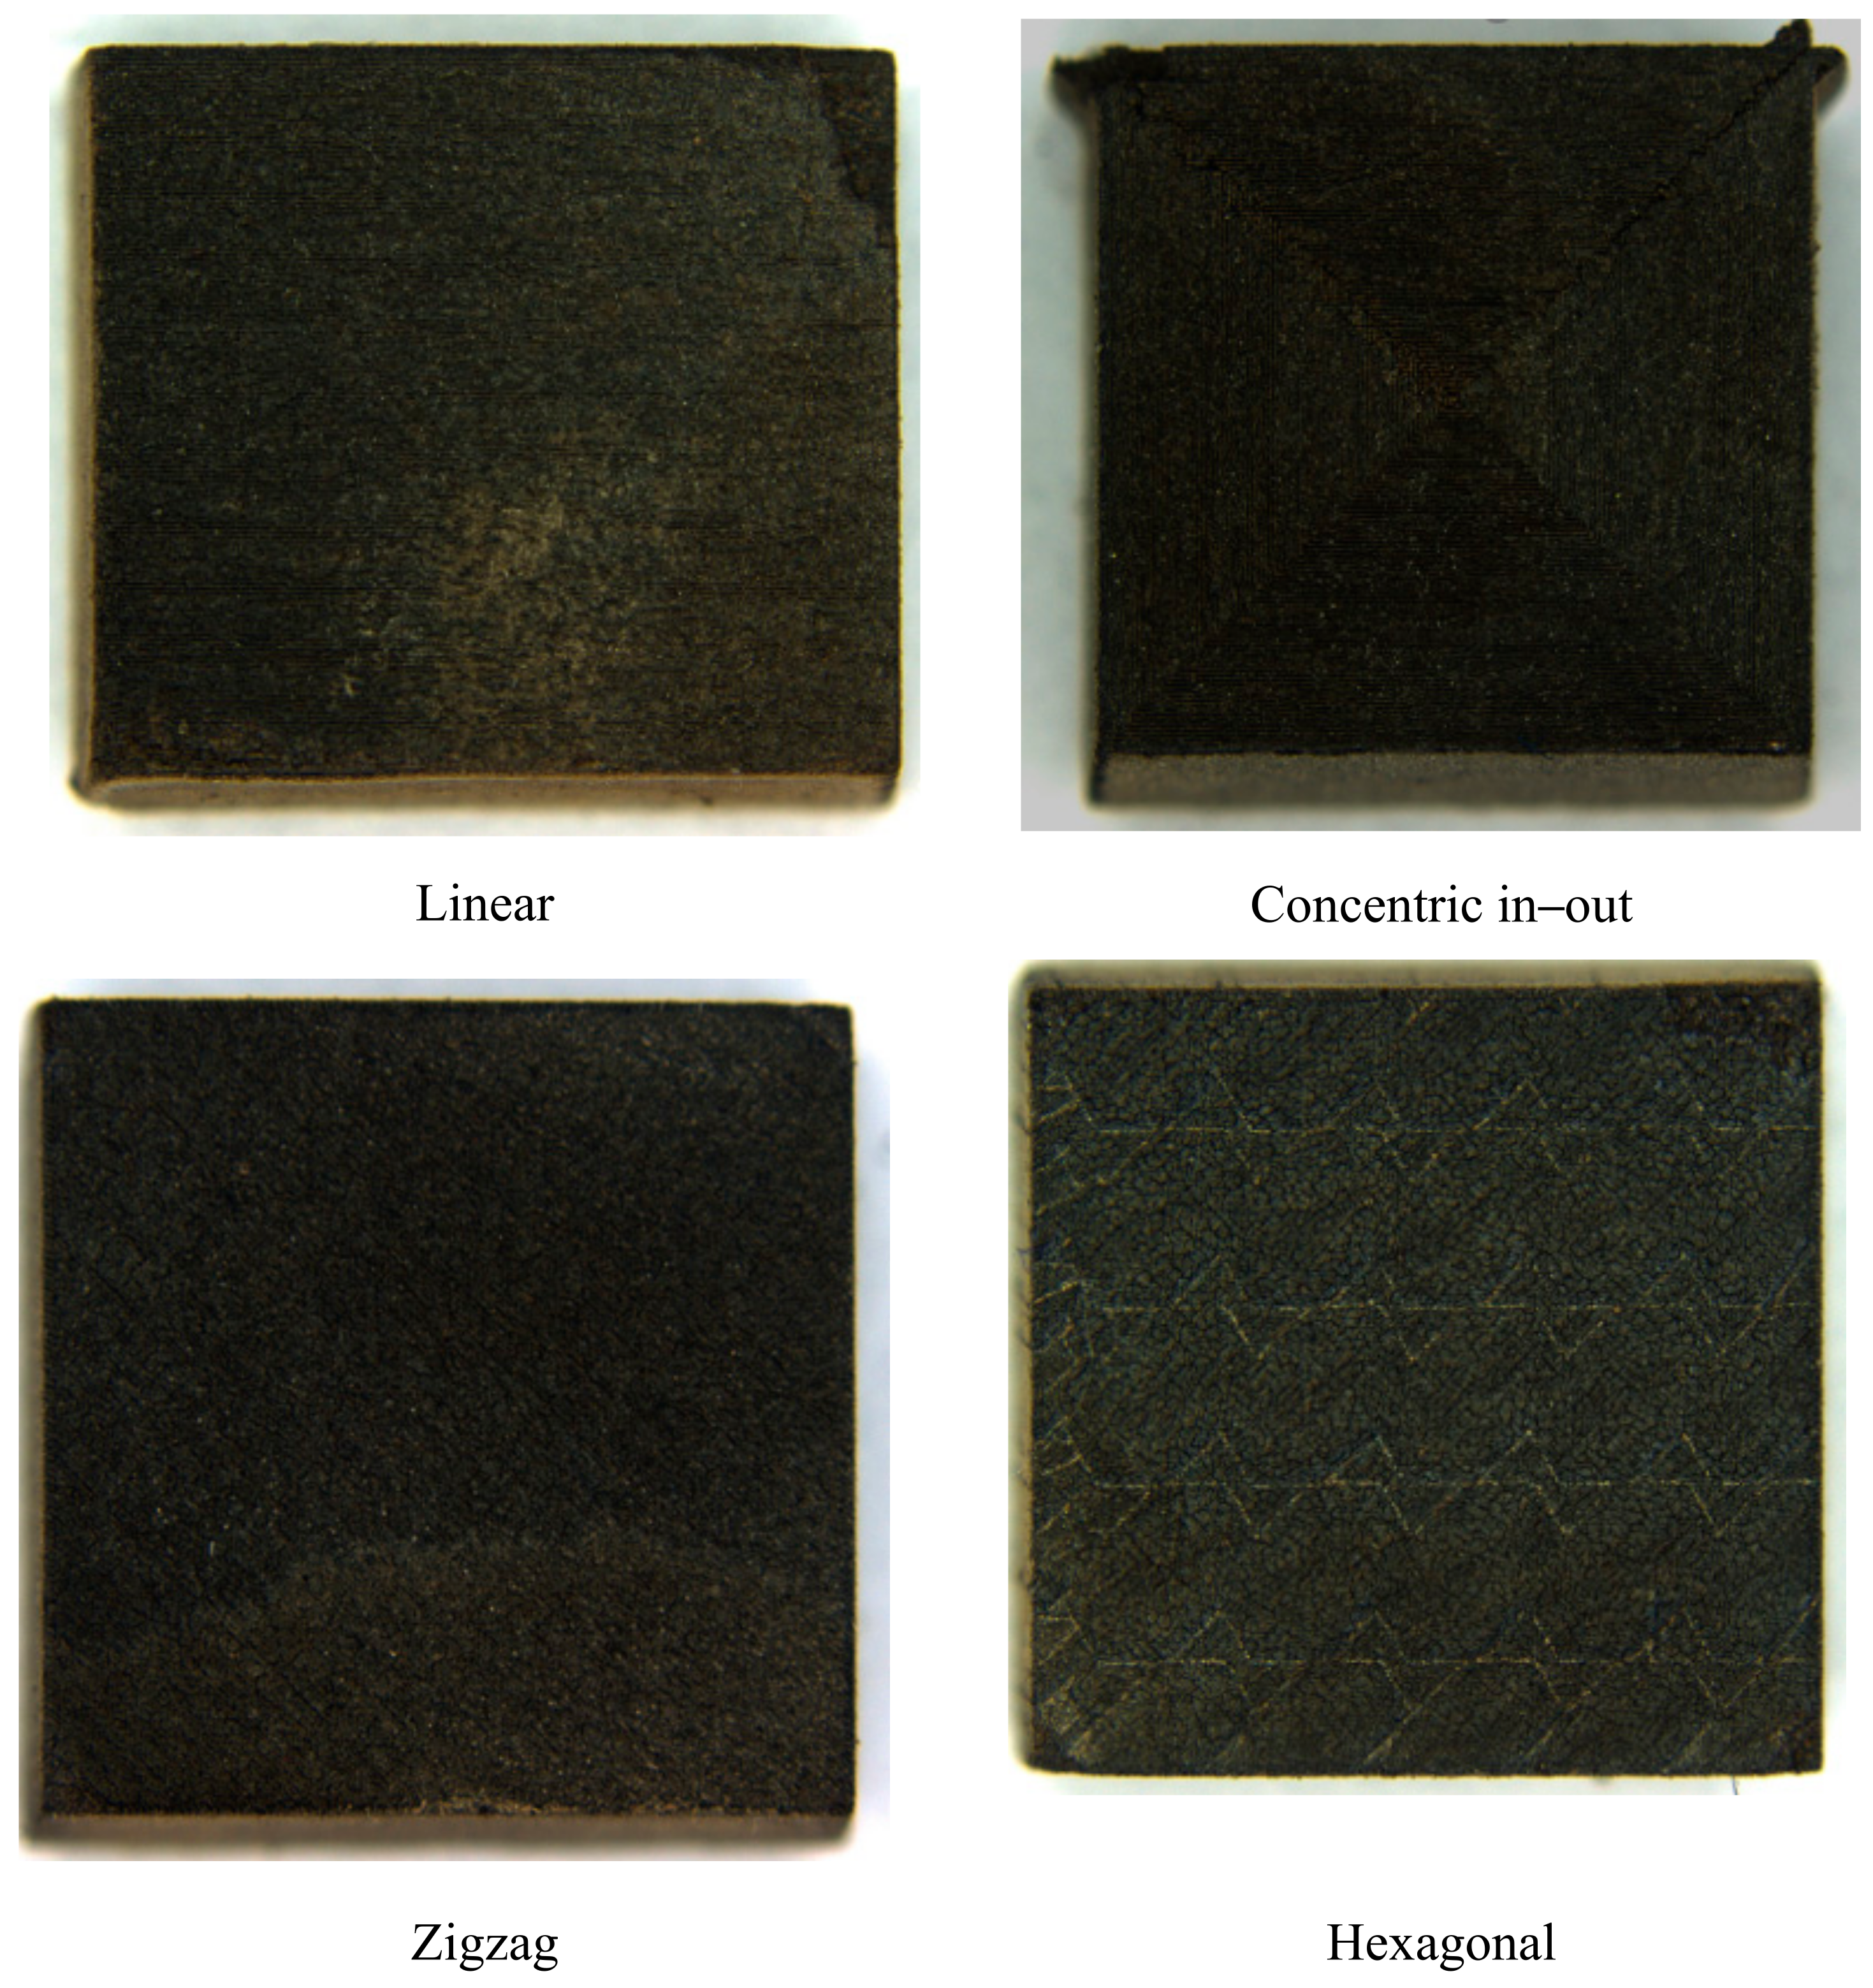
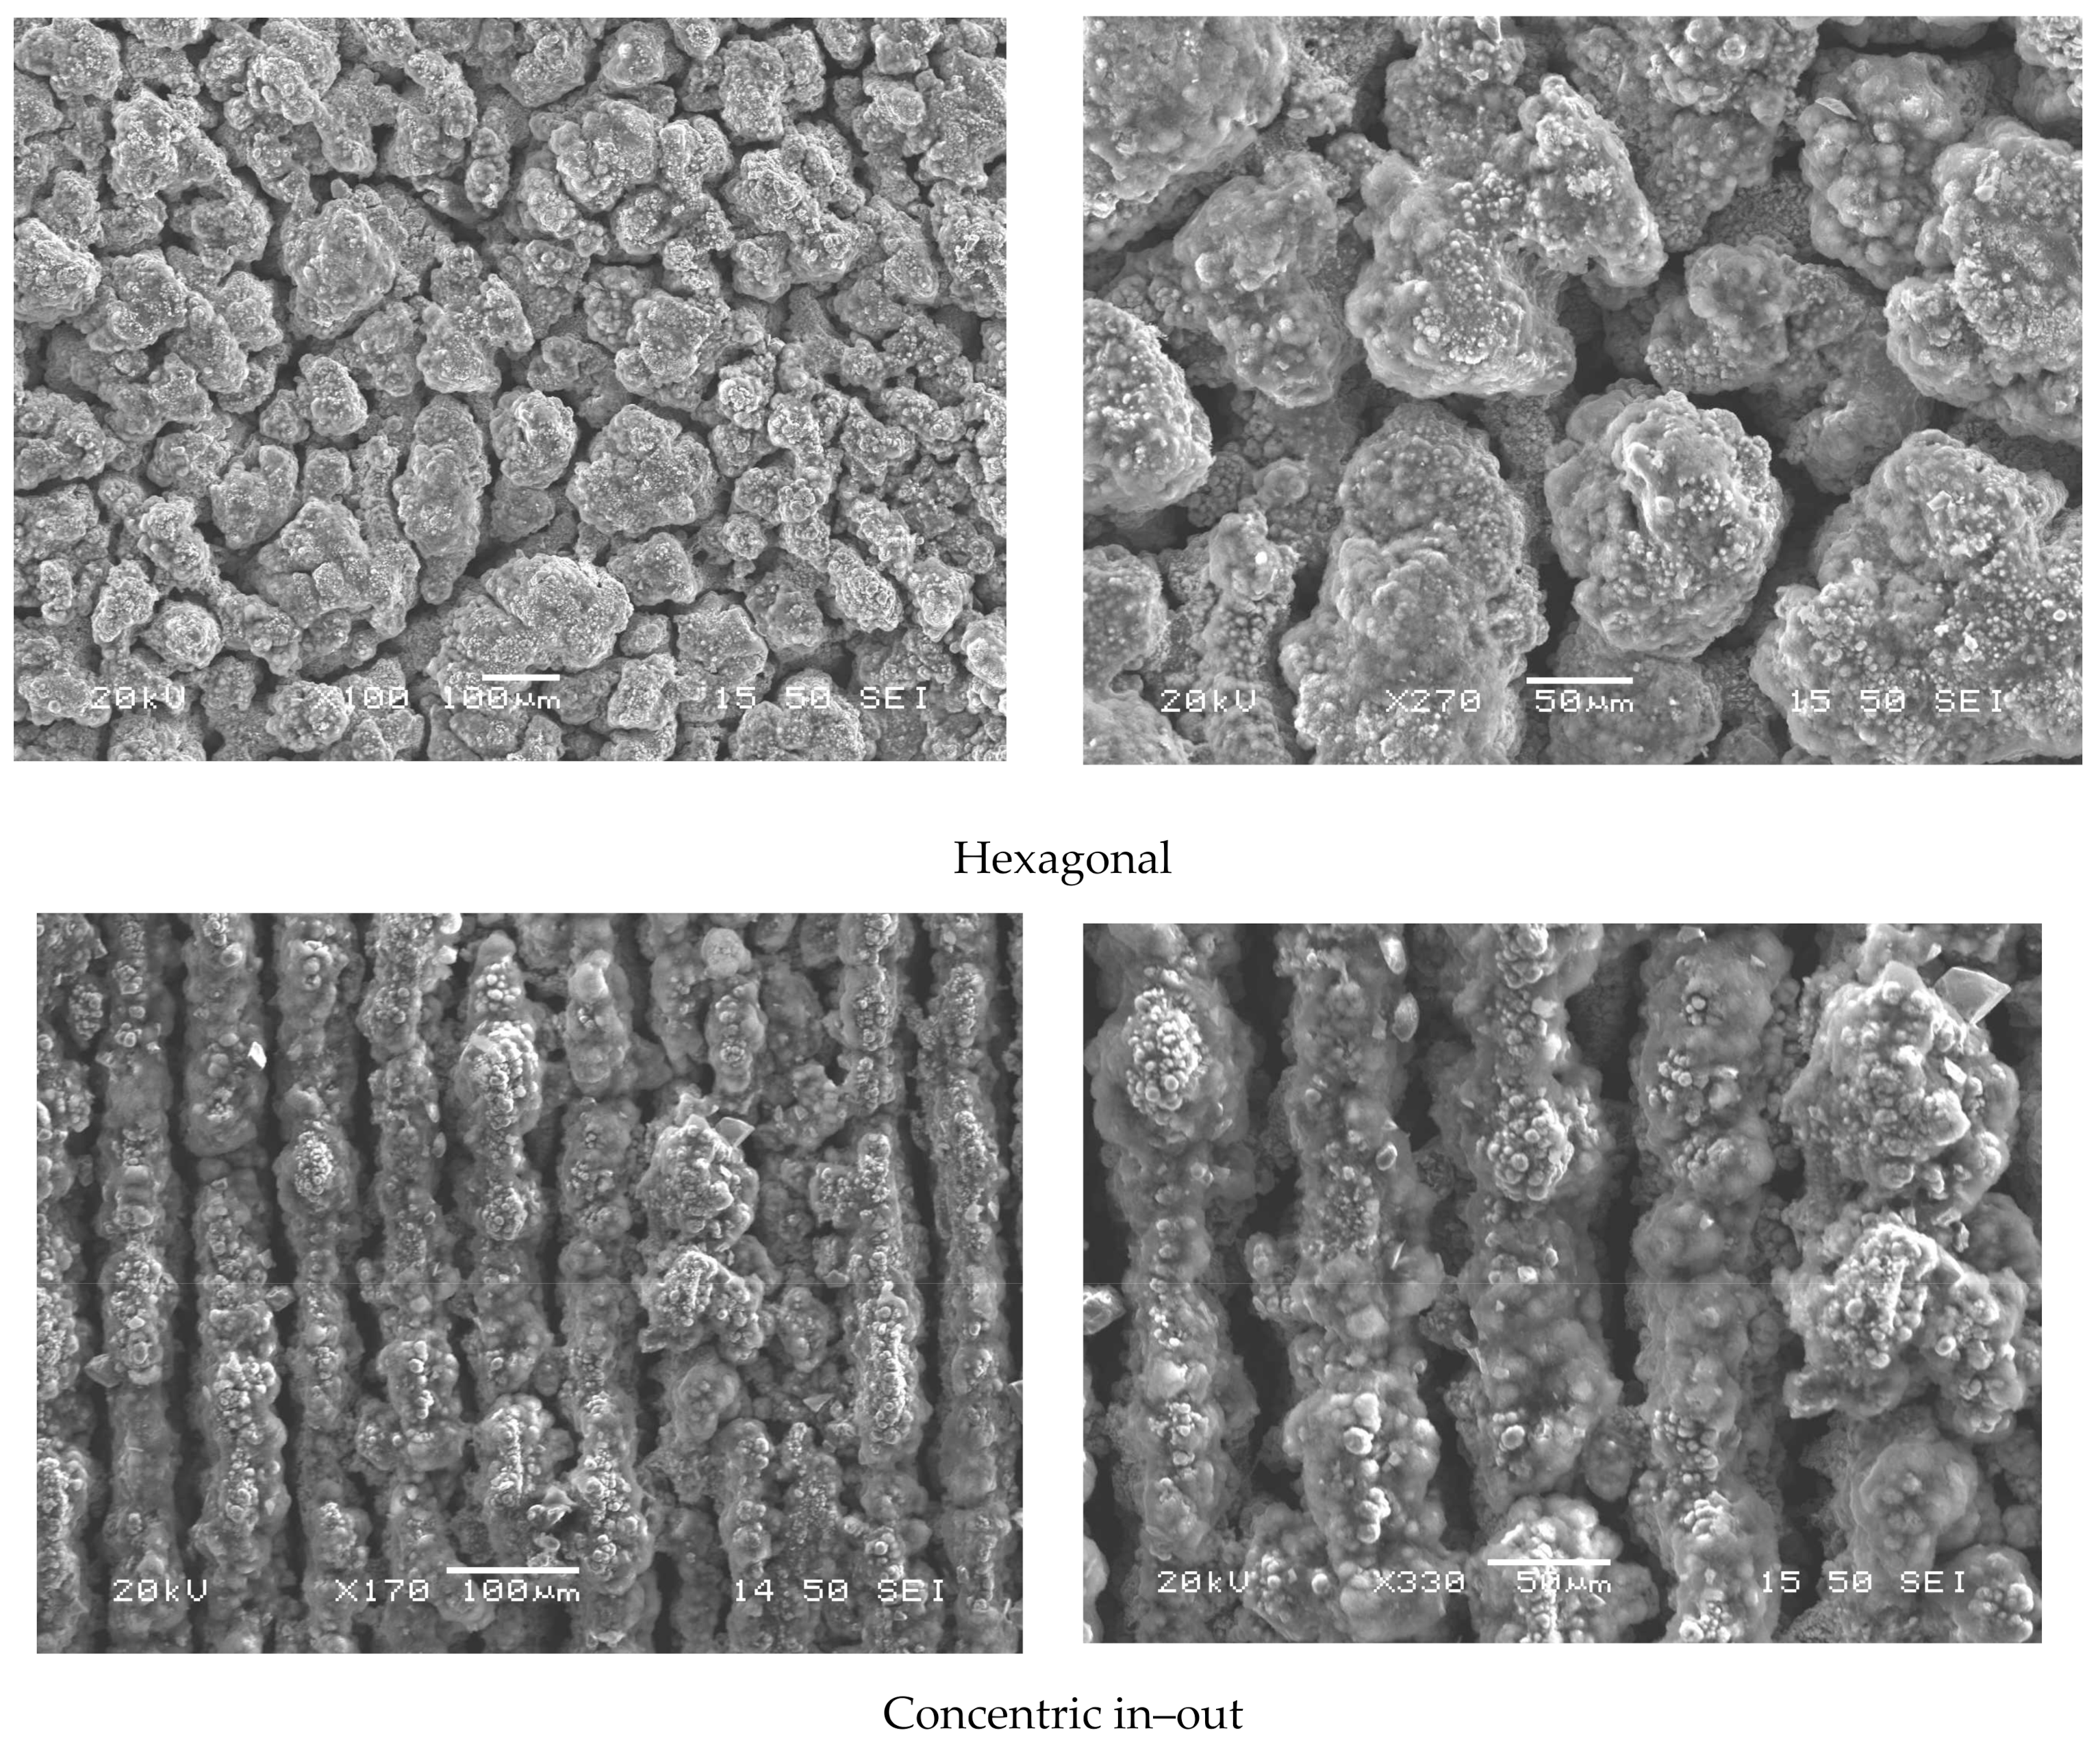
- For scanning strategies’ effects, the concentric in–out and hexagonal strategies are ineffective in the D-PBSLP of SiC due to the characteristic pattern on the layer’s top surface. Additionally, the linear strategy gave a low relative density value compared to other scanning strategies.
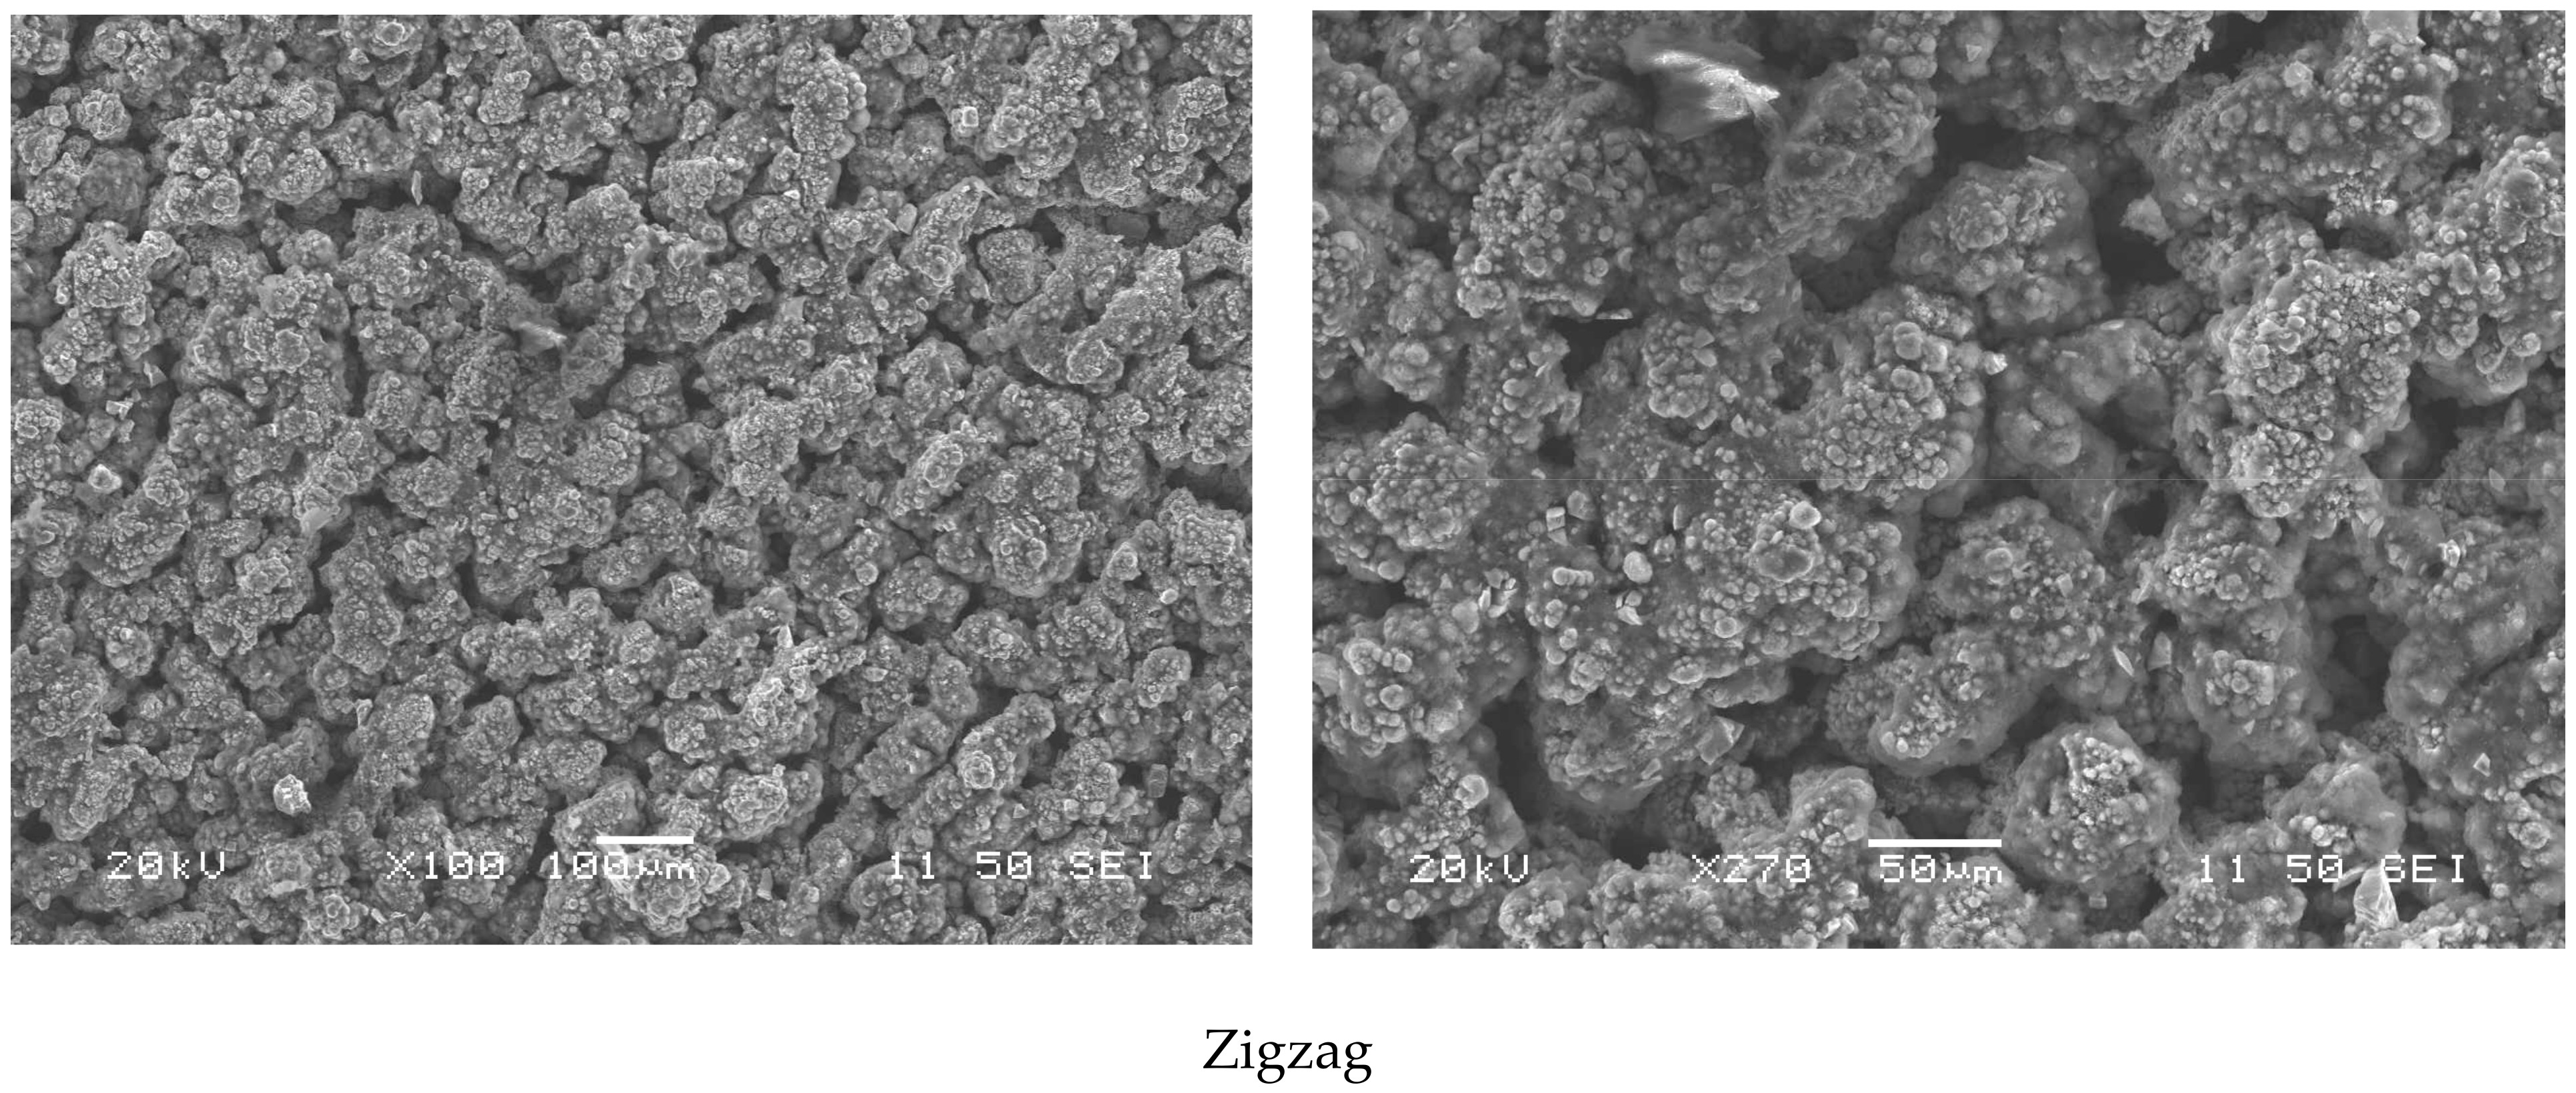
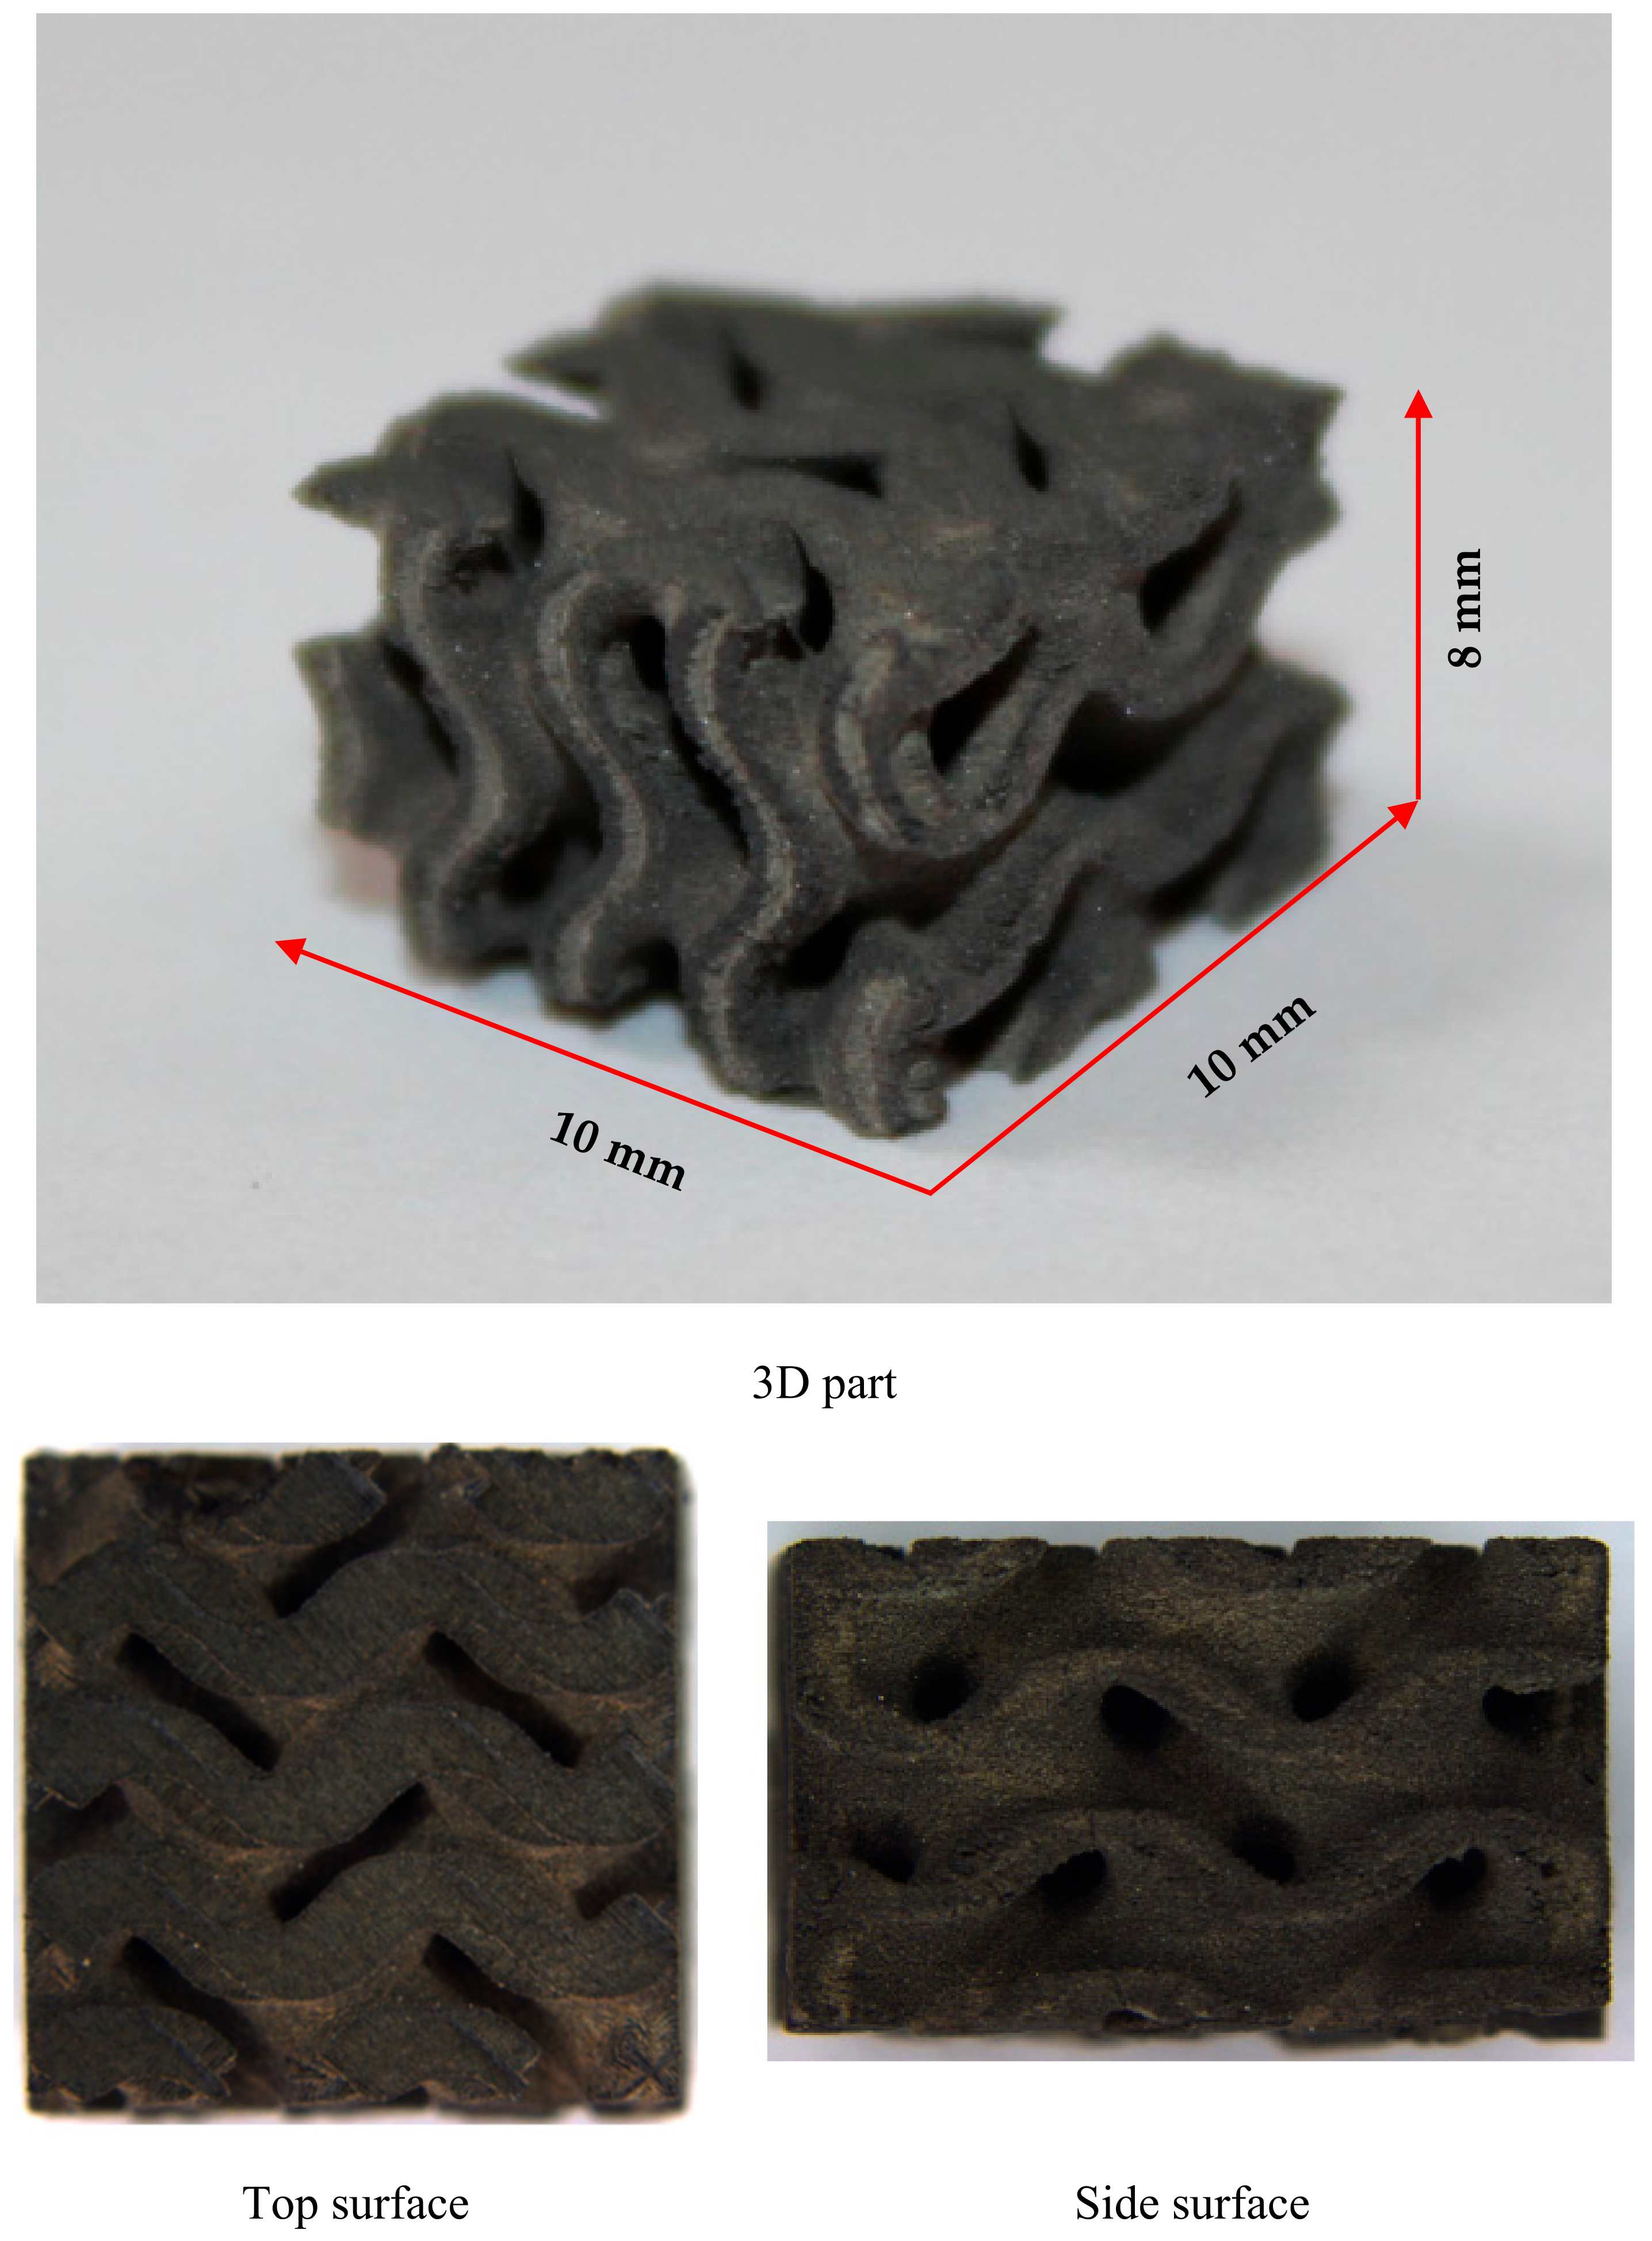
- The Zigzag strategy can be considered the best suitable strategy to be used with SiC, as it succeeds in giving a flat top surface without any characteristic pattern and a good relative density of more than 80%. Printing of SiC complex shapes using D-PBSLP was achieved using the proper process parameters obtained from the developed numerical model.
Author Contributions
Funding
Institutional Review Board Statement
Informed Consent Statement
Conflicts of Interest
References
- Cui, Y.; Wang, L.; Ren, J. Multi-Functional SiC/Al Composites for Aerospace Applications. Chin. J. Aeronaut. 2008, 21, 578–584. [Google Scholar] [CrossRef] [Green Version]
- Hunter, G.W.; Neudeck, P.G.; Xu, J.; Lukco, D.; Trunek, A.; Artale, M.; Lampard, P.; Androjna, D.; Makel, D.; Ward, B.; et al. Development of SiC-Based Gas Sensors for Aerospace Applications. MRS Proc. 2004, 815, J4.4. [Google Scholar] [CrossRef]
- Yonenaga, I. Thermo-Mechanical Stability of Wide-Bandgap Semiconductors: High Temperature Hardness of SiC, AlN, GaN, ZnO and ZnSe. Phys. B Condens. Matter 2001, 308–310, 1150–1152. [Google Scholar] [CrossRef]
- Xun, Q.; Xun, B.; Li, Z.; Wang, P.; Cai, Z. Application of SiC Power Electronic Devices in Secondary Power Source for Aircraft. Renew. Sustain. Energy Rev. 2017, 70, 1336–1342. [Google Scholar] [CrossRef]
- Zhou, W.; Xu, Z.M. Casting of SiC Reinforced Metal Matrix Composites. J. Mater. Processing Technol. 1997, 63, 358–363. [Google Scholar] [CrossRef]
- Canakci, A.; Varol, T. Microstructure and Properties of AA7075/Al–SiC Composites Fabricated Using Powder Metallurgy and Hot Pressing. Powder Technol. 2014, 268, 72–79. [Google Scholar] [CrossRef]
- Reddy, M.P.; Shakoor, R.A.; Parande, G.; Manakari, V.; Ubaid, F.; Mohamed, A.M.A.; Gupta, M. Enhanced Performance of Nano-Sized SiC Reinforced Al Metal Matrix Nanocomposites Synthesized through Microwave Sintering and Hot Extrusion Techniques. Prog. Nat. Sci. Mater. Int. 2017, 27, 606–614. [Google Scholar] [CrossRef]
- Rauber, C.; Lohmüller, A.; Opel, S.; Singer, R.F. Microstructure and Mechanical Properties of SiC Particle Reinforced Magnesium Composites Processed by Injection Molding. Mater. Sci. Eng. A 2011, 528, 6313–6323. [Google Scholar] [CrossRef]
- Ravichander, B.B.; Rahimzadeh, A.; Farhang, B.; Shayesteh Moghaddam, N.; Amerinatanzi, A.; Mehrpouya, M. A Prediction Model for Additive Manufacturing of Inconel 718 Superalloy. Appl. Sci. 2021, 11, 8010. [Google Scholar] [CrossRef]
- Dalpadulo, E.; Pini, F.; Leali, F. Assessment of Computer-Aided Design Tools for Topology Optimization of Additively Manufactured Automotive Components. Appl. Sci. 2021, 11, 10980. [Google Scholar] [CrossRef]
- Grad, M.; Nadammal, N.; Schultheiss, U.; Lulla, P.; Noster, U. An Integrative Experimental Approach to Design Optimization and Removal Strategies of Supporting Structures Used during L-PBF of SS316L Aortic Stents. Appl. Sci. 2021, 11, 9176. [Google Scholar] [CrossRef]
- ASTM International. Additive Manufacturing—General Principles—Terminology; ISO/ASTM International 52900:2015; ASTM International: West Conshohocken, PA, USA, 2015. [Google Scholar]
- Zocca, A.; Lima, P.; Diener, S.; Katsikis, N.; Günster, J. Additive Manufacturing of SiSiC by Layerwise Slurry Deposition and Binder Jetting (LSD-Print). J. Eur. Ceram. Soc. 2019, 39, 3527–3533. [Google Scholar] [CrossRef]
- Zhang, H.; Yang, Y.; Liu, B.; Huang, Z. The Preparation of SiC-Based Ceramics by One Novel Strategy Combined 3D Printing Technology and Liquid Silicon Infiltration Process. Ceram. Int. 2019, 45, 10800–10804. [Google Scholar] [CrossRef]
- Kang, H.-K.; Kang, S.B. Thermal Decomposition of Silicon Carbide in a Plasma-Sprayed Cu/SiC Composite Deposit. Mater. Sci. Eng. A 2006, 428, 336–345. [Google Scholar] [CrossRef]
- Evans, R.S.; Bourell, D.L.; Beaman, J.J.; Campbell, M.I. Rapid Manufacturing of Silicon Carbide Composites. Rapid Prototyp. J. 2005, 11, 37–40. [Google Scholar] [CrossRef] [Green Version]
- Evans, R.S.; Bourell, D.L.; Beaman, J.J.; Campbell, M.I. Reaction Bonded Silicon Carbide: SFF, Process Refinement and Applications. In Proceedings of the 2003 International Solid Freeform Fabrication Symposium, Austin, TX, USA, 4–6 August 2003. [Google Scholar]
- Nelson, J.C.; Vail, N.K.; Barlow, J.W.; Beaman, J.J.; Bourell, D.L.; Marcus, H.L. Selective Laser Sintering of Polymer-Coated Silicon Carbide Powders. Ind. Eng. Chem. Res. 1995, 34, 1641–1651. [Google Scholar] [CrossRef]
- Hon, K.K.B.; Gill, T.J. Selective Laser Sintering of SiC/Polyamide Composites. CIRP Ann. 2003, 52, 173–176. [Google Scholar] [CrossRef]
- Vail, N.K.; Barlow, J.W.; Marcus, H.L. Silicon Carbide Preforms for Metal Infiltration by Selective Laser SinteringTM of Polymer Encapsulated Powders. In Proceedings of the International Solid Freeform Fabrication Symposium 1993, Austin, TX, USA, 9–11 August 1993. [Google Scholar]
- Xiong, B.W.; Yu, H.; Xu, Z.F.; Yan, Q.S.; Zheng, Y.H.; Zhu, P.L.; Chen, S.N. Study on Dual Binders for Fabricating SiC Particulate Preforms Using Selective Laser Sintering. Compos. Part B Eng. 2013, 48, 129–133. [Google Scholar] [CrossRef]
- Stevinson, B.Y.; Bourell, D.L.; Beaman, J.J. Support-Free Infiltration of Selective Laser Sintered (SLS) Silicon Carbide Preforms. In Proceedings of the International Solid Freeform Fabrication Symposium 2006, Austin, TX, USA, 14–16 August 2006. [Google Scholar] [CrossRef]
- Jin, L.; Zhang, K.; Xu, T.; Zeng, T.; Cheng, S. The Fabrication and Mechanical Properties of SiC/SiC Composites Prepared by SLS Combined with PIP. Ceram. Int. 2018, 44, 20992–20999. [Google Scholar] [CrossRef]
- Meyers, S.; De Leersnijder, L.; Vleugels, J.; Kruth, J.-P. Direct Laser Sintering of Reaction Bonded Silicon Carbide with Low Residual Silicon Content. J. Eur. Ceram. Soc. 2018, 38, 3709–3717. [Google Scholar] [CrossRef]
- Liu, K.; Wu, T.; Bourell, D.L.; Tan, Y.; Wang, J.; He, M.; Sun, H.; Shi, Y.; Chen, J. Laser Additive Manufacturing and Homogeneous Densification of Complicated Shape SiC Ceramic Parts. Ceram. Int. 2018, 44, 21067–21075. [Google Scholar] [CrossRef]
- Song, S.; Gao, Z.; Lu, B.; Bao, C.; Zheng, B.; Wang, L. Performance Optimization of Complicated Structural SiC/Si Composite Ceramics Prepared by Selective Laser Sintering. Ceram. Int. 2020, 46, 568–575. [Google Scholar] [CrossRef]
- Streek, A.; Regenfuß, P.; Ullmann, F.; Hartwig, L.; Ebert, R.; Exner, H. Processing of Silicon Carbide by Laser Micro Sintering. In Proceedings of the International Solid Freeform Fabrication Symposium 2006, Austin, TX, USA, 14–16 August 2006. [Google Scholar] [CrossRef]
- Löschau, W.; Lenk, R.; Scharek, S.; Teichgraber, M.; Nowotny, S.; Richter, C. Prototyping of Complex-Shaped Parts and Tools of Si/SiC-Ceramics. Ind. Ceram. 2000, 38, 6. [Google Scholar] [CrossRef]
- Cheng, B.; Shrestha, S.; Chou, K. Stress and Deformation Evaluations of Scanning Strategy Effect in Selective Laser Melting. Addit. Manuf. 2016, 12, 240–251. [Google Scholar] [CrossRef]
- Song, J.; Wu, W.; Zhang, L.; He, B.; Lu, L.; Ni, X.; Long, Q.; Zhu, G. Role of Scanning Strategy on Residual Stress Distribution in Ti-6Al-4V Alloy Prepared by Selective Laser Melting. Optik 2018, 170, 342–352. [Google Scholar] [CrossRef]
- Mugwagwa, L.; Dimitrov, D.; Matope, S.; Yadroitsev, I. Evaluation of the Impact of Scanning Strategies on Residual Stresses in Selective Laser Melting. Int. J. Adv. Manuf. Technol. 2019, 102, 2441–2450. [Google Scholar] [CrossRef]
- Moser, D.; Beaman, J.; Fish, S. Multi-Layer Computational Modeling of Selective Laser Sintering Processes. In Proceedings of the ASME 2014 International Mechanical Engineering Congress and Exposition IMECE2014 2016, Montreal, QC, Canada, 14–20 November 2014; pp. 1–11. [Google Scholar]
- Groth, R.; Kauer, E. Absorption freier Ladungsträger in α-SiC-Kristallen. Phys. Status Solidi 1961, 1, 445–450. [Google Scholar] [CrossRef]
- Montón, A.; Abdelmoula, M.; Küçüktürk, G.; Maury, F.; Grossin, D.; Ferrato, M. Experimental and Numerical Study for Direct Powder Bed Selective Laser Processing (Sintering/Melting) of Silicon Carbide Ceramic. Mater. Res. Express 2021, 8, 045603. [Google Scholar] [CrossRef]
- Zhang, K.; Liu, T.; Liao, W.; Zhang, C.; Zheng, Y.; Shao, H. Simulation of The Thermal Behavior and Analysis of Solidification Process During Selective Laser Melting of Alumina. In Proceedings of the Solid Freeform Fabrication 2018: Proceedings of the 29th Annual International Solid Freeform Fabrication Symposium—An Additive Manufacturing Conference, Austin, TX, USA, 13–15 August 2018. [Google Scholar]
- Wiria, F.E.; Leong, K.F.; Chua, C.K. Modeling of Powder Particle Heat Transfer Process in Selective Laser Sintering for Fabricating Tissue Engineering Scaffolds. Rapid Prototyp. J. 2010, 16, 400–410. [Google Scholar] [CrossRef]
- Meyers, S. Additive Manufacturing of Technical Ceramics: Laser Sintering of Alumina and Silicon Carbide; KU Leuven—Faculty of Engineering Science: Leuven, Belgium, 2019. [Google Scholar]


| Parameter | Baseplate | Powder Layer |
|---|---|---|
| Length (mm) | 4 | 3 |
| Width (mm) | 2.5 | 1.5 |
| Thickness (mm) | 1 | 0.022 |
| Mesh | A | B | C |
|---|---|---|---|
| Mesh |  |  |  |
Mesh element size (µm) | 5 | 2.5 | 2 |
| Number of cores used in the calculation * | 48 | ||
| Elapsed time to solve one-step time (s) | 3.92 | 6.89 | 8.4 |
| Temperature (K) | 2343.7 | 2376.37 | 2379.4 |
| Sintering Speed, mm/s | Laser Power, W | Sintering Contour | Temperature Contour, K |
|---|---|---|---|
| 500 | 15% (45 W) |  |  |
| 500 | 20% (60 W) |  |  |
| Sintering Speed, mm/s | Laser Power, W | Sintering Contour |
|---|---|---|
| 250 | 15% (45 W) |  |
| 100 | 11% (32 W) |  |
| Sintering Speed, mm/s | Laser Power, Wa | Sintering Contour | Sintering Path Width, µm |
|---|---|---|---|
| 500 | 60 W |  | 38 |
| 250 | 45 W |  | 43 |
| 100 | 32 W |  | 48 |
Publisher’s Note: MDPI stays neutral with regard to jurisdictional claims in published maps and institutional affiliations. |
© 2022 by the authors. Licensee MDPI, Basel, Switzerland. This article is an open access article distributed under the terms and conditions of the Creative Commons Attribution (CC BY) license (https://creativecommons.org/licenses/by/4.0/).
Share and Cite
Abdelmoula, M.; Zarazaga, A.M.; Küçüktürk, G.; Maury, F.; Grossin, D.; Ferrato, M. Scanning Strategy Investigation for Direct Powder Bed Selective Laser Processing of Silicon Carbide Ceramic. Appl. Sci. 2022, 12, 788. https://doi.org/10.3390/app12020788
Abdelmoula M, Zarazaga AM, Küçüktürk G, Maury F, Grossin D, Ferrato M. Scanning Strategy Investigation for Direct Powder Bed Selective Laser Processing of Silicon Carbide Ceramic. Applied Sciences. 2022; 12(2):788. https://doi.org/10.3390/app12020788
Chicago/Turabian StyleAbdelmoula, Mohamed, Alejandro Montón Zarazaga, Gökhan Küçüktürk, Francis Maury, David Grossin, and Marc Ferrato. 2022. "Scanning Strategy Investigation for Direct Powder Bed Selective Laser Processing of Silicon Carbide Ceramic" Applied Sciences 12, no. 2: 788. https://doi.org/10.3390/app12020788