Article

Sensitivity Analysis of Holdback Bar Release Load during Catapult-Assisted Takeoff of Carrier-Based Aircraft

1
Key Laboratory of Fundamental Science for National Defense-Advanced Design Technology of Flight Vehicle, Nanjing University of Aeronautics & Astronautics, Nanjing 210016, China
2
State Key Laboratory of Mechanics and Control of Mechanical Structures, Nanjing University of Aeronautics and Astronautics, Nanjing 210016, China
*
Author to whom correspondence should be addressed.
Appl. Sci. 2022, 12(2), 785; https://doi.org/10.3390/app12020785
Submission received: 19 December 2021 / Revised: 9 January 2022 / Accepted: 10 January 2022 / Published: 13 January 2022
(This article belongs to the Topic Dynamical Systems: Theory and Applications)

Abstract

:
The release load of holdback bar will affect the safety of catapult-assisted takeoff of carrier-based aircraft, and the accurate control of releasing the load will ensure success. The magnitude and the control accuracy of release load are important parameters which impact the takeoff performance, therefore unstable release load and insufficient release precision are the main factors affecting the takeoff safety. In this paper, mechanical models of the carrier-based aircraft in the catapult-assisted takeoff tensioning state and gliding state after release are established based on multi-body dynamics, contact mechanics and tribological theory, and the influence of the release load of the holdback bar on the catapult-assisted takeoff performance is analyzed. Furthermore, a kinetic model of the holdback bar device is established, and the kinetic characteristics of the release process of the holdback bar are studied. Based on the kinetic model and friction model of the holdback bar, the influencing factors of the sensitivity of the holdback bar release load are analyzed and the structural parameters are optimized. The results show that the released load decreases slowly with the increase of the contact surface angle of the holdback bar structure and increases rapidly when that angle reaches the critical value; besides, the release load increases slowly with the increase of the friction coefficient of the contact surface and increases faster when the critical friction coefficient is reached.

1. Introduction

When the carrier-based aircraft takes off with catapult assist, the holdback bar is connected to the torque arm joint of the nose landing gear and the holdback bar device on the deck, respectively, and the launch bar on the nose landing gear is connected to the catapult shuttle on the deck. Under the combined effect of the catapult and engine thrust on the aircraft, the holdback bar is tensioned, and when the force applying on the holdback bar reaches the release load, the bar is quickly discharged from the nose landing gear, so that the aircraft is released from the restraint of the holdback bar and starts gliding. To reach the safe takeoff speed of the carrier-based aircraft within the limited gliding distance, ensuring the magnitude and accuracy of the holdback bar release load is necessary. One-time holdback bars were used in the 1960s, and research on repeatable holdback bars began in the United States in the 1970s [1]. The literature [2,3,4] gives the design requirements for the nose landing gear before catapult-assisted takeoff of the carrier-based aircraft, as well as for the holdback bar, which needs to be accurately controlled within 0–6% of the release load in a certain temperature range.
As catapult-assisted takeoff method was adopted for carrier-based aircraft, scholars around the world have conducted many in-depth studies on the catapult-assisted takeoff process: In [5], the catapult performance of several aircrafts were analyzed and the criteria for the catapult-assisted takeoff based on the departure speed was given out. In [6], dynamics analysis and calculations were carried out for the catapult-assisted takeoff process and the landing block process; in [7,8,9], the parameters affecting the catapult-assisted takeoff were analyzed, and the influence of the sudden extension of nose landing gear on the catapult process was studied; in [10], the minimum departure speed of F/A-18E/F during catapult-assisted takeoff was studied; in [11], a multi-agent based carrier-based aircraft catapult-assisted takeoff model under the effect of wind field environment was established; the paper in [12] investigated the rapid vibration phenomenon of the nose landing gear along the heading direction when the holdback load was suddenly unloaded and analyzed the loading condition of the nose landing gear. The work in [13] studied the impact of the launch bar’s restoring moment and weight on the dynamic performance of the launch bar itself; the work in [14] established a catapult dynamics model including the mass of catapult shuttle and analyzed the dynamic response of the towing process after the discharge of the holdback bar till the discharge of the launch bar; the works in [15,16] studied the dynamic change law during the catapult-assisted takeoff, and the influence of the acceleration and flight trajectory under different parameters on the catapult safety of the carrier-based aircraft; the work in [17] studied the influence of the carrier in different initial phase of vertical toss on the sinking of the carrier-based aircraft during the catapult-assisted takeoff process; the works in [18,19] analyzed the suitability of F-35 on aircraft carriers, as well as the catapult-assisted takeoff and blocking tests on aircraft carriers. The work in [20] investigated the effect of deck motion on the catapult takeoff characteristics of a carrier-based aircraft. In [21], an experimental study was conducted on the sudden extension performance of the nose landing gear of a naval aircraft. In [22], a variable topology solution method with real-time adjustment during the catapult takeoff of the carrier-based aircraft was studied. In [23], the effects of surface rocking of the aircraft carrier and side wind on the catapult takeoff of aircraft were investigated.
The catapult-assisted takeoff of a carrier-based aircraft mainly consists of three phases: the tensioning phase, the catapult gliding phase, and the departure phase. The above-mentioned literature mainly focuses on the dynamics and optimization of the catapult gliding phase and departure phase, analyzing the effects of various factors such as the sudden extension of the nose landing gear and the sudden release of the holdback load on the safety of catapult-assisted takeoff, and conducting relevant tests; the study on the factors influencing the release load of the holdback bar during the takeoff tensioning phase is less involved.
In this paper, the force analysis is carried out for the holdback bar tensioning state and the gliding state after the release of the carrier-based aircraft, and the mechanical equations are established separately for these two states to simulate the dynamics of the holdback bar release process. To ensure the stability of the holdback bar release load during catapult-assisted takeoff, the influence of the structural parameters and friction coefficient of the holdback bar on the release load is discussed, and the sensitivity study provides a theoretical basis and design reference for the accurate control of the release load.

2. Aircraft Mechanical Models of Holdback Bar Tension and Release Stages

The magnitude and accuracy of the holdback bar release load are important parameters that determine the performance of the carrier-based aircraft for catapult-assisted takeoff. In order to meet the catapult-assisted takeoff conditions, the aircraft needs to be pulled by the catapult through the holdback bar device. Moreover, to study the influence of the holdback bar release load on the catapult-assisted takeoff performance, the force analyses of the whole aircraft including landing gears in the catapult-assisted takeoff tensioning phase and gliding phase are carried out in accordance with the holdback bar’s requirements and the working conditions. According to the requirements of the catapult-assisted takeoff, the kinetic equations of the carrier-based aircraft in the catapult-assisted takeoff tensioning stage and gliding stage are established, and the simulation analysis model of the holdback bar device is established by using the kinetic simulation analysis software to study the influence of the holdback bar release load on the performance of catapult-assisted takeoff.

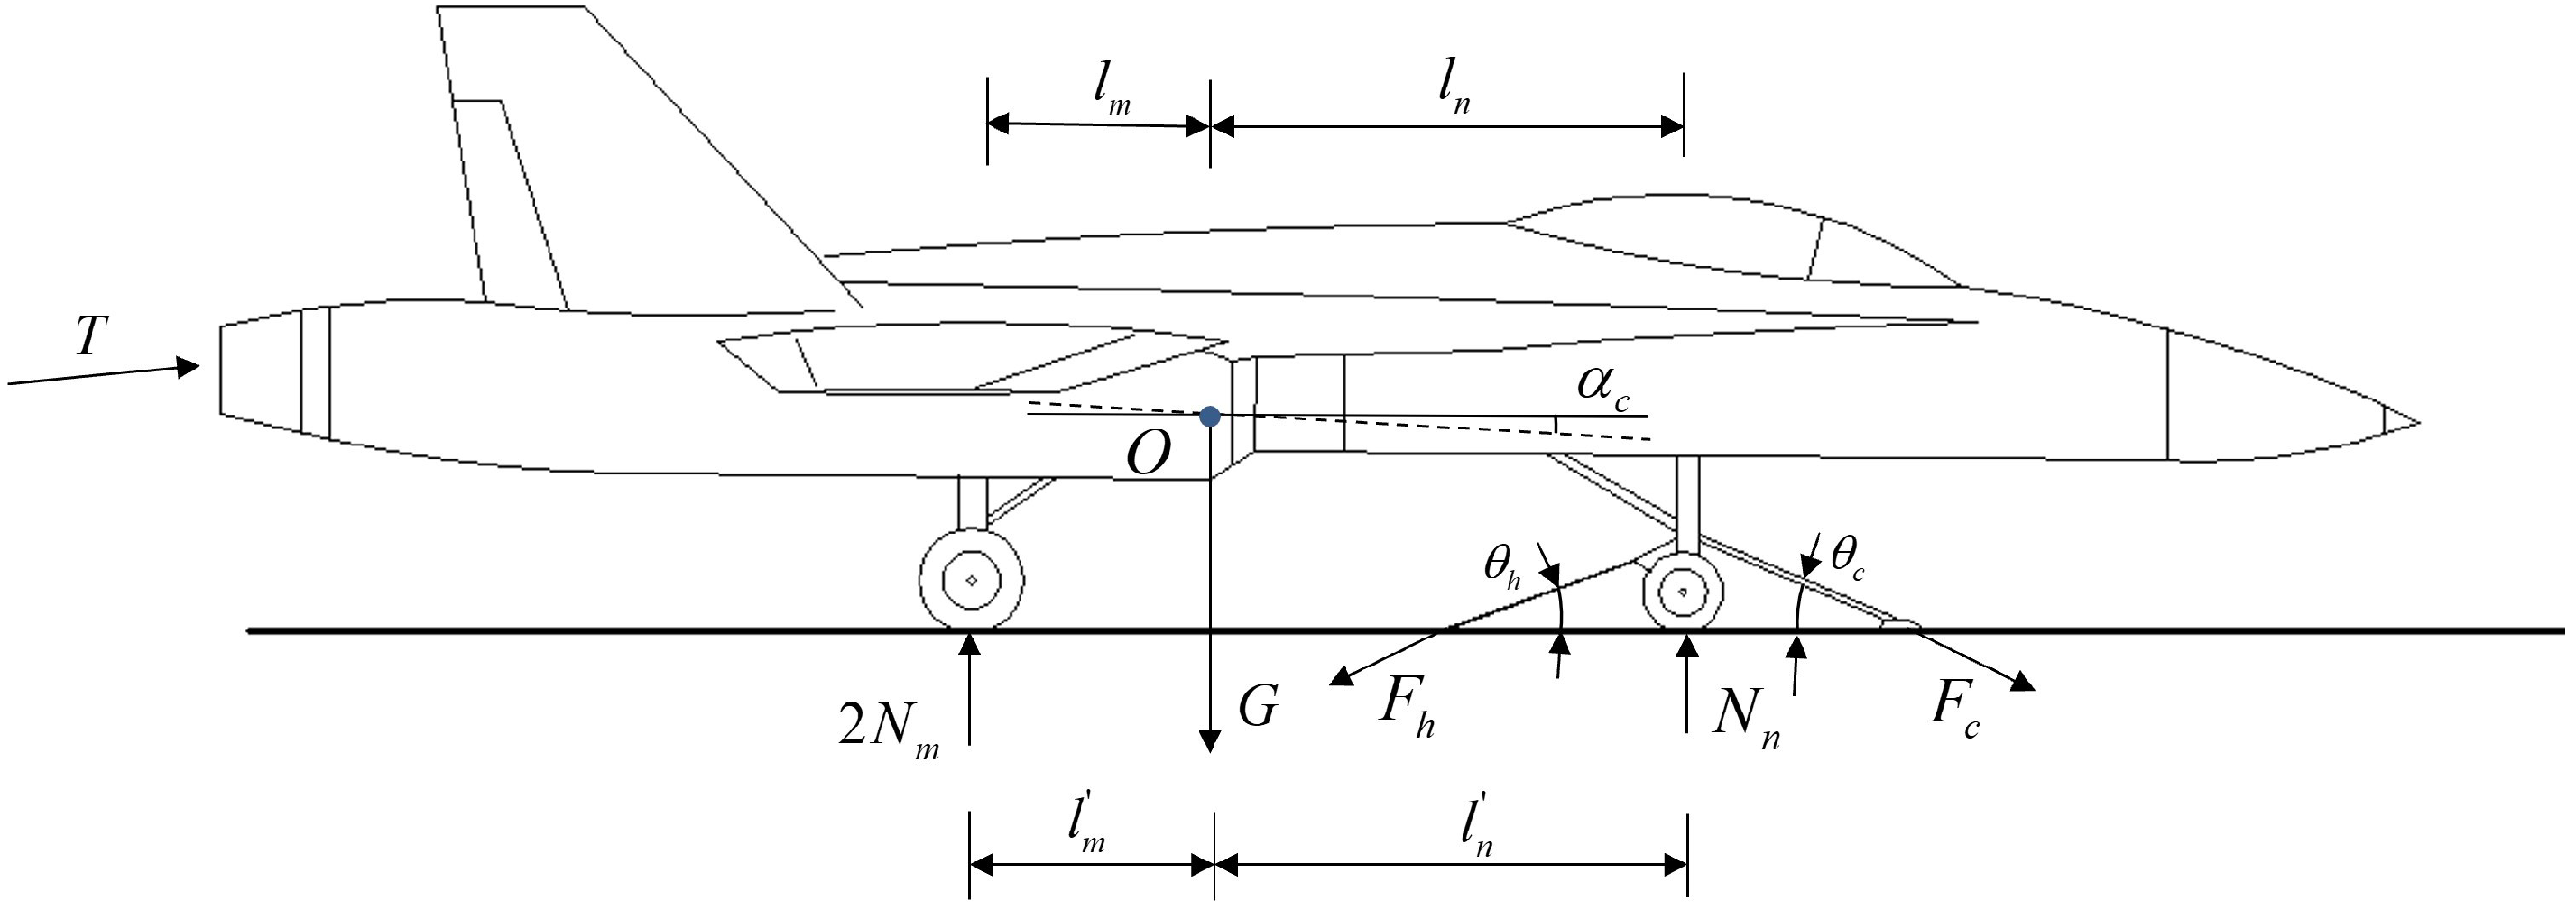
2.1. Aircraft Mechanical Model in Holdback Bar Tensioning State

During the catapult-assisted takeoff, the holdback bar starts to be slowly tensioned under the action of the launch bar traction force, and the holdback bar gets to a tension state under the combined effect of the catapult and the aircraft engine thrust. The aircraft force analysis in the holdback bar tension state is shown in Figure 1, where α c is the angle of attack of the aircraft in the tension state; l n is the horizontal distance from the nose landing gear to the aircraft center of gravity O when α c = 0 , l m is the horizontal distance from the main landing gear to the aircraft center of gravity O when α c = 0 ; l n is the horizontal distance from the nose landing gear tire contact point to the aircraft center of gravity, l m is the horizontal distance from the main landing gear tire contact point to the aircraft center of gravity O; G is the gravitational force of the aircraft, T is the total engine thrust; θ c is the catapult angle in tension, θ h is the angle of holdback bar in tension; F c is the catapult force of the launch bar, F h is the tension of the holdback bar; and N n is the ground force of the nose gear and N m is the ground force of the main gear on one side.
According to the aircraft force analysis in holdback bar tension state, the equilibrium equation matrix for the tension state of the aircraft is established. In Equation (1), l c is the horizontal distance from the point of application of the catapult force on the aircraft to the center of gravity O of the aircraft, l h is the horizontal distance from the point of application of the holdback force on the aircraft to the center of gravity O, H c is the vertical distance from the point of application of the catapult force on the aircraft to the horizontal line at the center of gravity O, and H h is the vertical distance from the point of application of the holding force on the aircraft to the horizontal line at the center of gravity O.
T c o s α c + F c c o s θ c 0 0 c o s θ h T s i n α c F c s i n θ c G 1 2 s i n θ h F c ( H c c o s θ c l c s i n θ c ) l n 2 l m l h s i n θ h H h c o s θ h 1 N n N m F h = 0
The calculation method for l n , l m , l c , l h , H c , and H h in Equation (1) are listed in Equation (2), where H n is the distance from the nose landing gear mounting point to the axle when α c = 0 , H m is the distance from the main landing gear mounting point to the axle when α c = 0 ; H c is the vertical distance from the point where the catapult force acts on the aircraft to the horizontal line at the center of gravity O when α c = 0 , and H h is the vertical distance from the point of action of the holding force on the aircraft to the horizontal line at the center of gravity O when α c = 0 .
l n = l n c o s α c + ( H n + l n s i n α c ) t g α c l n = l m c o s α c ( H m l m s i n α c ) t g α c l c = l n c o s α c + H c s i n α c l h = l n c o s α c + H h s i n α c H c = H c c o s α c l n s i n α c H h = H h c o s α c l n s i n α c

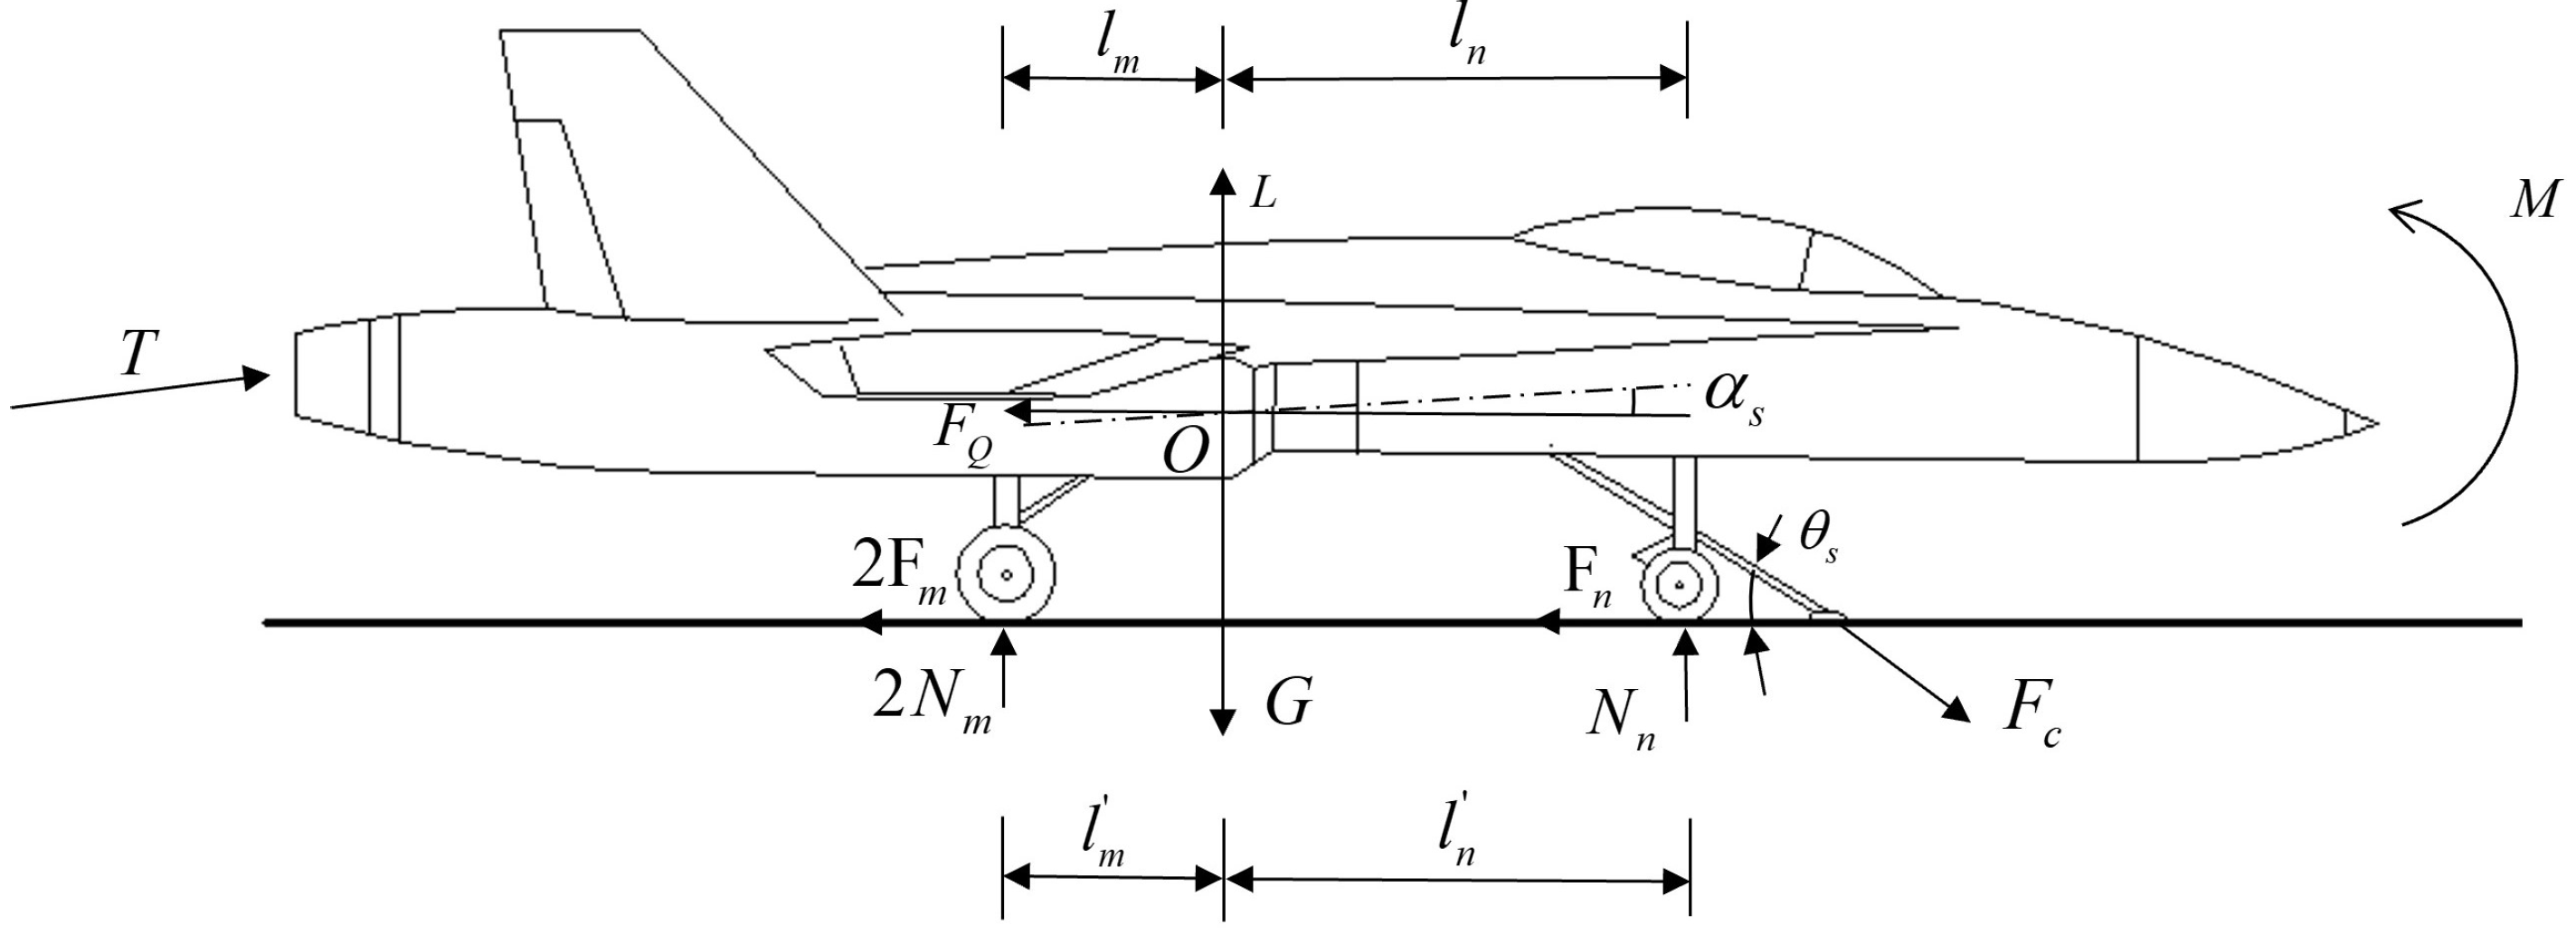
2.2. Aircraft Gliding Dynamics Model after Holdback Bar Release

When the load on the holdback bar reaches the release load, the holdback bar device discharges from the aircraft and the aircraft begins to accelerate and glide under the combined effect of the catapult and engine thrust. The force analysis of the gliding aircraft after the holdback bar release is shown in Figure 2, where N n is the nose gear ground force during the glide after catapult, N m is the unilateral main gear ground force during the glide, F n is the friction force between the nose gear and the ground, F n = μ N n , F m is the friction force between the unilateral main gear and the ground, F m = μ N m , α s is the aircraft angle of attack during the glide, θ s is the catapult angle during the glide, M is the aerodynamic pitching moment, F Q is the aerodynamic drag force, and L is the lift force.
Based on the force analysis, Newton’s law and the theorem of momentum, the dynamics equation matrix is established as follows.
m a x m a y I z ω z ˙ = T c o s α s + F c c o s θ s F Q μ 2 μ T s i n α s F c s i n θ s + L G 1 2 F c ( H c c o s θ c l c s i n θ c ) + M l n μ H n 2 l m μ H m 1 N n N m
In Equation (3), a x is the acceleration of the aircraft’s center of gravity along the horizontal direction; a y is the acceleration of the aircraft’s center of gravity along the vertical direction; I z is the rotational inertia of the aircraft rotating around the airframe; ω z ˙ is the angular acceleration of the aircraft rotating around the airframe axis. l n , l m , l c , l h , and H c are calculated in Equation (2), H n and H m are calculated in Equation (4), R n is the distance from the nose landing gear wheel axis to the ground, and R m is the distance from the main landing gear wheel axis to the ground.
H n = H n + R n H m = H m + R m

2.3. Effect of Holdback Bar Release Load on Catapult-Assisted Takeoff Velocity

To ensure the safety of catapult-assisted takeoff, the initial velocity of the aircraft when leaving the deck is very important. The initial velocity of the aircraft leaving the deck mainly depends on the output power of the catapult, the engine thrust and the release load of the holdback bar. The initial traction force when the aircraft catapults and takes off is also determined by the catapult device and the holdback bar release load. When the catapult output is determined, the magnitude of the holdback bar release load will directly affect the initial velocity when the aircraft leaves the deck. Therefore, the release load of the holdback bar is one of the main factors affecting the initial velocity of the catapult-assisted takeoff. From Equation (3), we have
m a x = m d v x d t = T c o s α s + F c c o s θ s F Q μ ( N n + 2 N m )
According to the kinetic energy theorem, the relationship between the catapult-assisted takeoff speed and the work done by the engine thrust, catapult force, etc. can be obtained.
1 2 m v x 2 = W T + W F c W F Q W F n 2 W F m
In Equation (6), m is the mass of the aircraft; v x is the takeoff speed with catapult assist; and W T , W F c , W F Q , W F n and W F m are the work done by the engine thrust, catapult force, aerodynamic drag, and ground friction drag during catapult, respectively. As with the engine thrust, aerodynamic drag and nose landing gear friction drag depend on the aircraft power, aerodynamic, structural, and other characteristics. The work done by the catapult force is determined by the initial catapult force when the holdback bar is released and the catapult force when the aircraft leaves the deck, and the magnitude of its initial catapult force is determined by the release load of the holdback bar. Thus, the change of the catapult-assisted takeoff speed is mainly determined by changing the magnitude of the holdback bar release load.

3. Holdback Bar Device Connection Relationship and Contact Mechanics Model

In order to study the tensioning process of the holdback bar during catapult-assisted takeoff and the release process when the release load is reached, the connection relationship of the holdback bar and the kinematic pairs, as well as the contact mechanics model of the kinematic pairs, are established according to the structural form of the holdback bar and the working conditions.

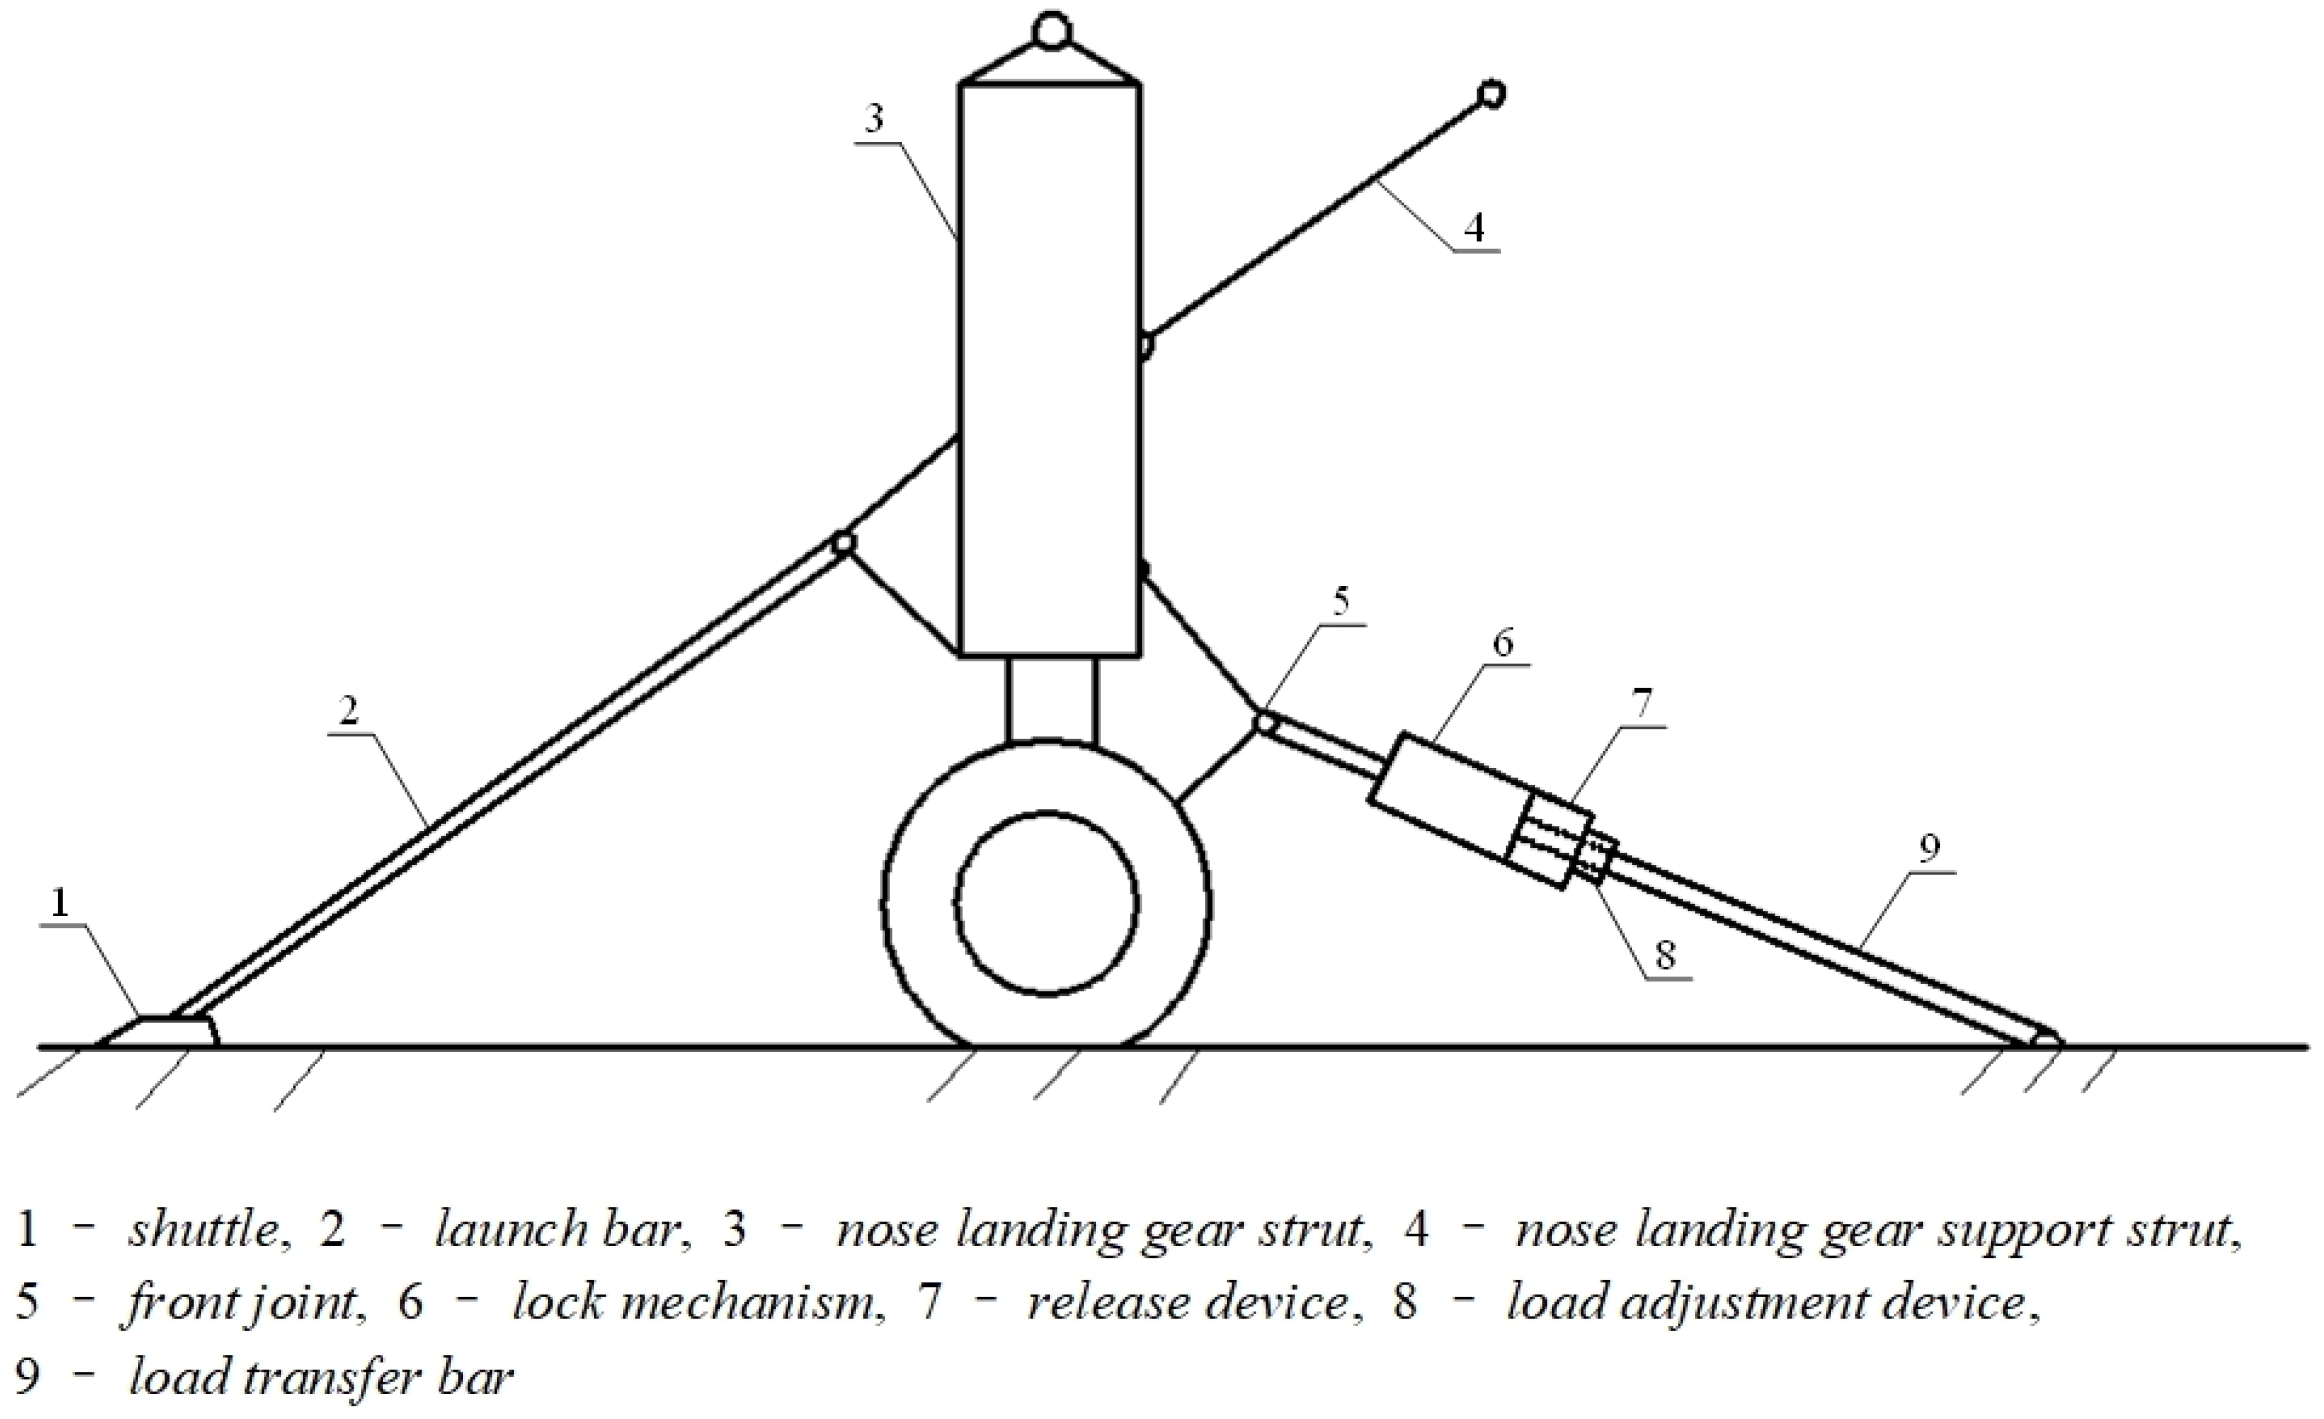
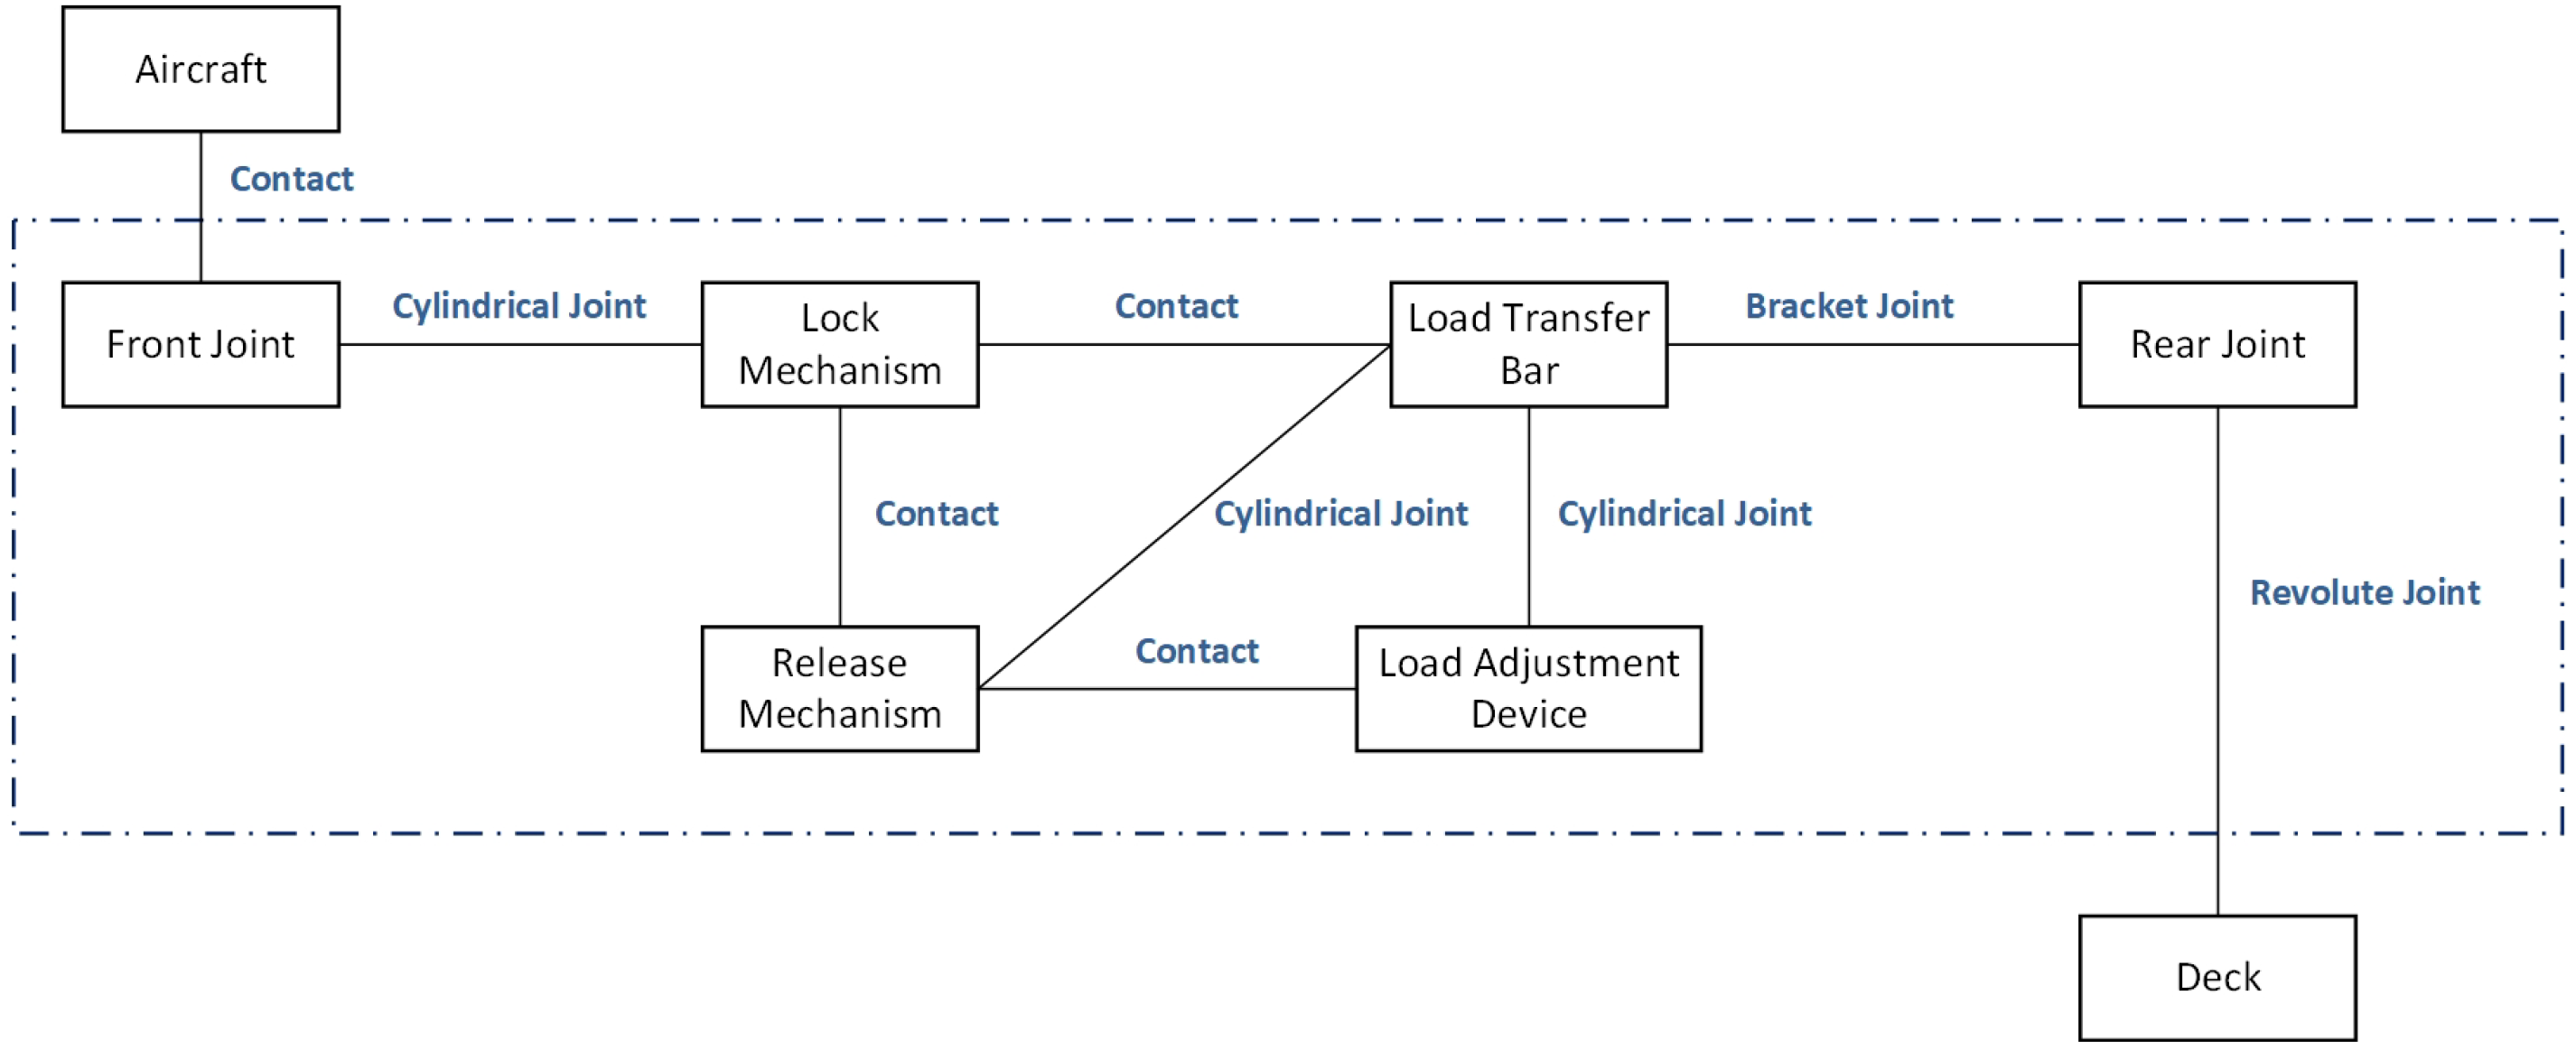
3.1. Connection Relationship of Holdback Bar Device

During catapult-assisted takeoff, the launch bar of the nose landing gear is connected to the catapult shuttle on the deck. To ensure the initial traction load during catapult-assisted takeoff, the nose landing gear of the aircraft is connected to the holdback bar device on the deck by the holdback bar, and the front joint of the holdback bar is connected to the hinge point of the nose landing gear torque arm, as shown in Figure 3.
To simulate the actual holdback bar release process, a dynamics simulation model is needed based on the constraint relationships between the mechanisms of the holdback bar device. Constraints can be used to describe the kinematic relationship between two components, and each independent component in the model can be linked by defining constraints. The kinematic relationship between the components is abstracted through the definition of constraints, and the appropriate constraint unit is selected for description of such relationship. In order to establish the kinematic pairs of the holdback bar device, it is necessary to analyze the connection relationship between the parts of the holdback bar device, which contains the kinematic pairs and the contact relationship. A sketch of the holdback bar connection relationship and kinematic pairs is shown in Figure 4.
According to the connection relationship between each mechanism of the holdback bar, the type of kinematic pairs that meets the motion needs is selected, and the kinematic pairs are defined in the dynamics simulation analysis software using the geometric coordinate system.
Cylindrical Joint is defined by choosing one axis of the two contact coordinate systems respectively. The cylindrical joint is used to connect the front joint with the lock mechanism, the release mechanism with the load transfer bar, and the load transfer bar with the load adjustment device.
The revolute joint is defined by choosing one axis of the two contact coordinate systems and the plane perpendicular to this axis, which means that the two coordinate systems share the same axis and one plane is always in contact. The revolute joint is used for rear joint and the deck.
The bracket joint is defined by selecting two coordinate systems in the corresponding position, respectively. The fixed joint is used to achieve a fixed connection between some components, the load transfer bar, and the rear joint.
The contact joint is defined by selecting two planes of contact coordinate system respectively. Contact Joint is used to contact two components, including locking mechanism and load transfer bar, locking mechanism and release mechanism, release mechanism and load adjustment device, etc.

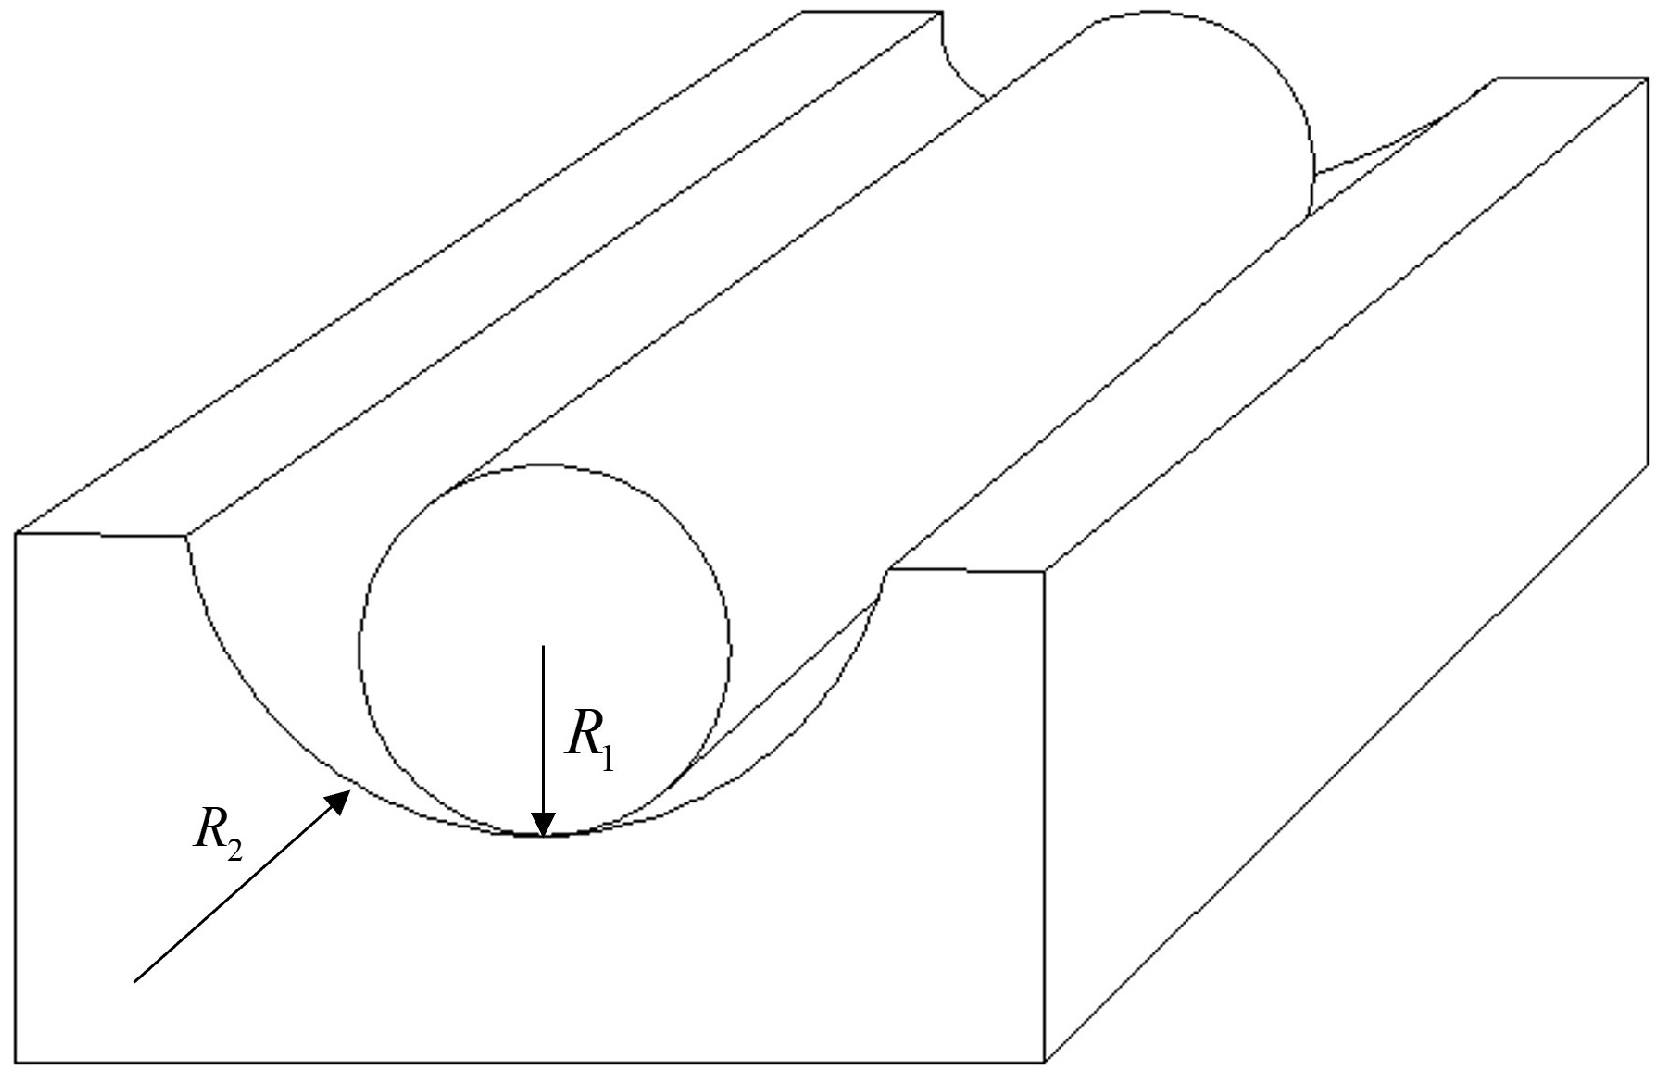
3.2. Contact Mechanics Model

In the dynamics simulation analysis software, various contact relations in the holdback bar are analyzed by the contact mechanics module. The contact model is used for holdback bar model building. The contact forces include: the normal force perpendicular to the contact surface, and the frictional force within the contact surface.
The normal force model of the contact surface is developed using Hertzian contact theory [24], in which the normal contact force is described by the contact stiffness and the displacement of the contacting object under the force. Here, a rigid sphere in contact with an elastic plane body of radius R is first considered. The Hertzian pressure distribution on the elastic surface is
p = p 0 1 x 2 R 2 1 / 2
When a cylinder with radius R 1 and a cylinder with negative radius R 2 are in parallel contact, as shown in Figure 5, the two cylinders in parallel contact are the same as two spheres in contact, and the relationship between the contact radius and the indentation deformation d is
a R d where:   R = R 1 R 2 R 2 R 1
The relationship between the normal force F between the two cylinders and the press-in deformation d is linear, and k is the contact stiffness.
F = π 4 E L d = k d where:   k = π 4 E L
The maximum normal contact pressure between two cylinders is:
p 0 = E d 2 a = π E 8 d R 1 / 2
If both objects are elastomers, E 1 and E 2 are the modulus of elasticity of the two objects, and v 1 and v 2 are the Poisson’s ratios of the two objects, then the expression E can be modified as follows
1 E = 1 v 1 2 E 1 + 1 v 2 2 E 2
The Karnopp friction model is uesd in the friction model of the contact surface [25], as shown in Figure 6, which is a simplified model of viscous-slip friction motion, making the expression of friction at both dynamic and static states more simplified, and the calculation of this model is simple and in line with the actual situation of friction motion when solving engineering problems.
When the velocity is within ± Δ V , the friction model is expressed as static, or viscous, and when the velocity V r > ± Δ V , the model will switch from the viscous state to the sliding state, and the friction force in the sliding state is smaller than that in the viscous state.

4. Simulation Analysis of Holdback Bar Release Process

According to the connection relationship of the holdback bar, kinematic pairs and release conditions, a holdback bar simulation analysis model is established to simulate the release process of the holdback bar device dynamically, focusing on the influence of the structural parameters of the holdback bar release mechanism on the release load and the influence of the different friction coefficients between the holdback bar lock mechanism and each mechanism on the release load. The parameters affecting the sensitivity of the release load are also identified, and a quantitative analysis of the influence trend of the release load is given out.
There are a variety of release methods of holdback bar, such as pull off by tension at single use only or shear off by shear force. A better release method is the repeatable form. To meet the need of repeat, the holdback bar device has a release mechanism that can be discharged when the release load is reached, and no parts of the holdback bar are damaged after release. The lock mechanism ensures that the release mechanism is locked, and when the load on the holdback bar reaches the specified release load, the release mechanism is unlocked, and the holdback bar is discharged from the aircraft.

4.1. Holdback Bar Simulation Analysis Model

4.1.1. Front Joint Contact Model

During the tension and release process of holdback bar, the aircraft’s nose landing gear torsion joint will contact the front joint of the holdback bar and move along the contact surface of the front joint. After the connection between the nose landing gear torsion arm joint and the front joint of the holdback bar is completed, the two joints make contact and the relative motion between the joints stops. When the two joints are discharged, the nose landing gear torsion arm joint moves along the front joint contact surface until it is discharged. The contact between the nose landing gear torsion arm joint and the front joint of the holdback bar is simulated by the surface contact model. The face contact model can simulate and model rigid members of arbitrary geometry. The solver will build the geometric features of the face contact model according to the customized parameters during the solving process. During the simulation analysis, the modulus of elasticity and the friction coefficient are defined for the calculation of the face contact.

4.1.2. Lock Mechanism Contact Model

The holdback bar lock mechanism is in contact with the load transfer bar and the release mechanism, respectively. The cylinder-rotating surface contact model is used to characterize the interaction relationship between each component. Karnopp friction model is applied for the cylindrical-rotating surface contact model, and static and dynamic friction coefficients are set. In the cylindrical-rotating surface contact model, the first component is designated as a cylinder and the second component is designated as a rotating body. The front face of the lock mechanism is in contact with the load transfer bar, and a cylinder-rotary contact is established at the front plane. The rear plane of the lock mechanism is in contact with the release mechanism and a cylinder-rotary contact is established at the rear plane. The Hertzian model is used for the normal force of the cylindrical-rotary contact force, and the modulus of elasticity and Poisson’s ratio are set according to the material of each component.

4.1.3. Release Mechanism Contact Model

The holdback bar release mechanism is in contact with the lock mechanism and the load adjustment device respectively. The cylindrical-rotating surface contact force model is used to characterize the interaction among each component. The Karnopp friction model is used for the cylinder-rotating surface contact force. In the contact model of the release mechanism, the front part of the release mechanism is in contact with the lock mechanism, and a cylinder-rotating surface contact is established at the front part of the release mechanism. The rear part of the release mechanism is in contact with the load adjustment device, and a cylinder-rotating surface contact is established at the rear part of the release mechanism. The Hertzian model is used for the normal force of the cylinder-rotary surface contact.

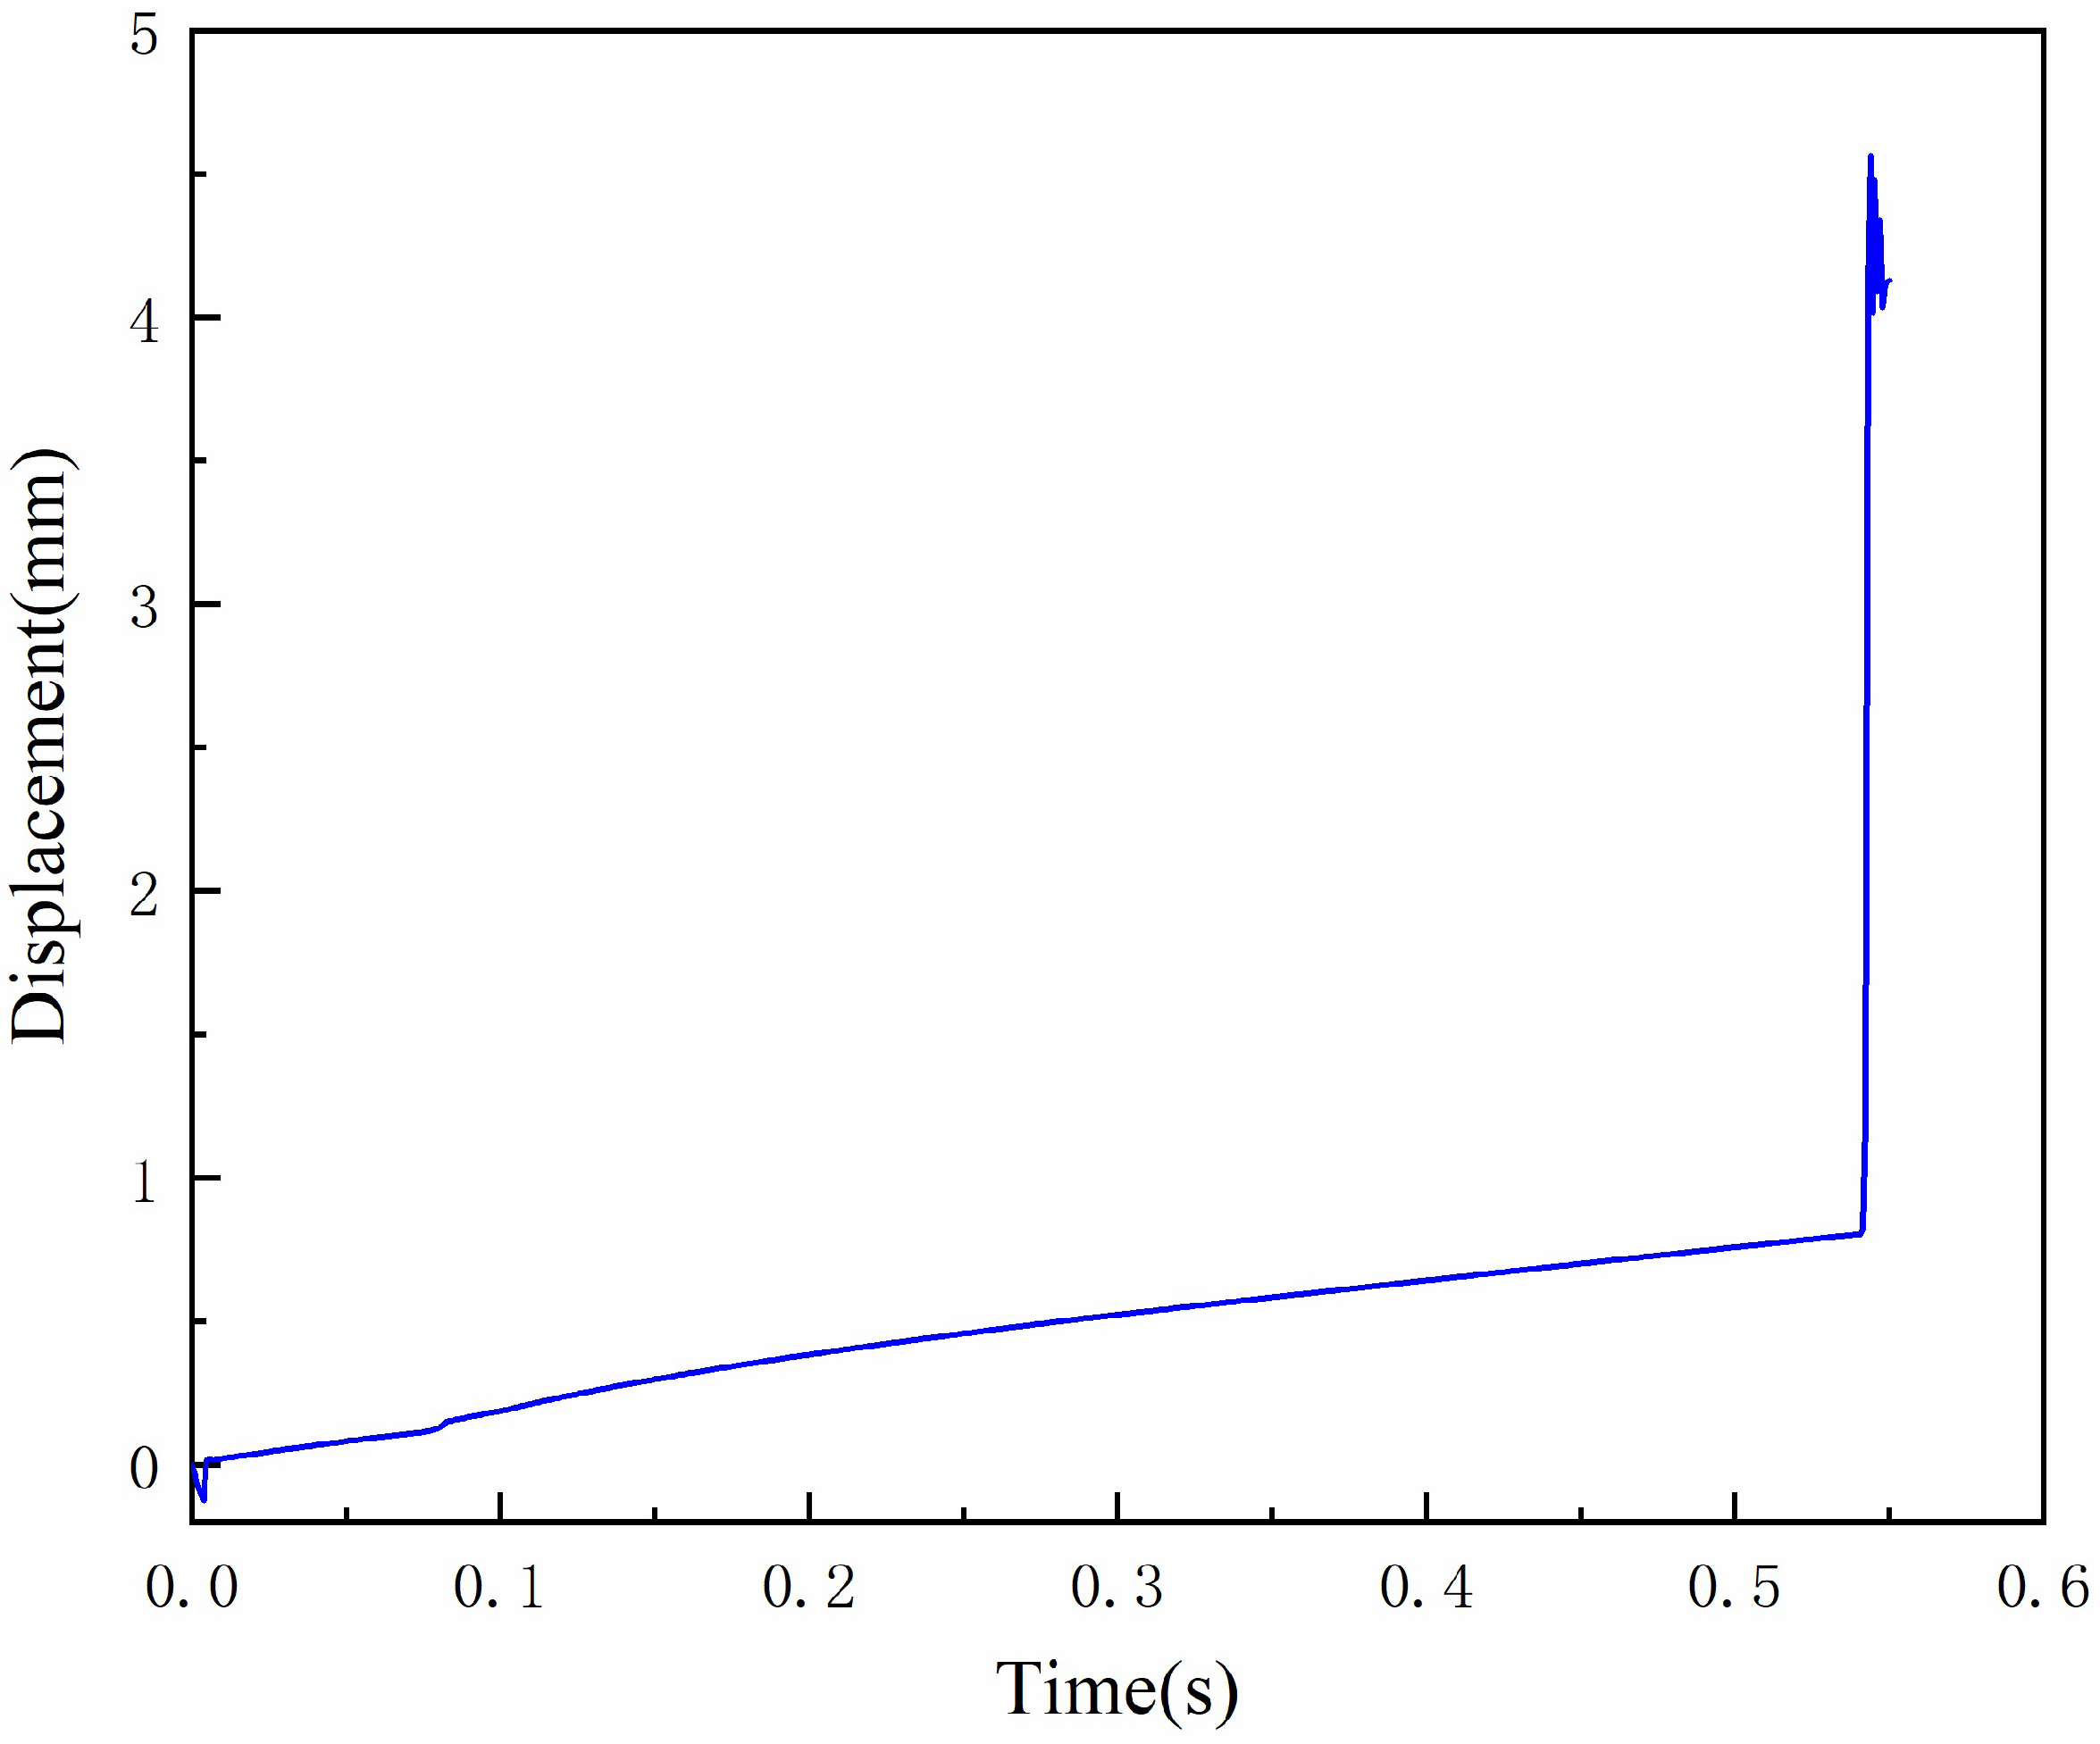
4.2. Simulation of Holdback Bar Release Process

The dynamics simulation of the holdback bar release process is performed by the dynamics simulation analysis software, and the load applied on the holdback bar is the hold back force in the simulation analysis model. The traction force of the catapult is applied to the nose landing gear through the launch bar, and then acts on the holdback bar through the joint on the torsion arm of the nose landing gear. When the load on the holdback bar reaches the specified value, the holdback bar lock mechanism is unlocked and the holdback bar is discharged from the nose landing gear joint, at which time the holdback load on the holdback bar becomes zero. The release process of the holdback bar can be divided into two stages.
In the first stage, when the traction force applied to the holdback bar is less than the unlocking force of the lock mechanism, the lock mechanism and the release mechanism move with the front joint under the application of the traction force. With the increasing traction force, the gap between the lock mechanism and the load transfer bar gradually decreases, and the lock mechanism of the holdback bar remains locked when the traction force acting on the holdback bar does not reach the released load.
In the second stage, as the traction force acting on the holdback bar increases, the lock mechanism is brought into contact with the load transfer bar. When the load acting on the load transfer bar reaches the release load, the release mechanism unlocks the lock mechanism. After the lock mechanism is unlocked, in a very short period of time, the front joint of the holdback bar discharges from the nose landing gear torque arm joint, the holdback bar releases the aircraft, and the aircraft achieves catapult-assisted takeoff.
Based on the theory of tribology and contact mechanics, a simulation model is established to analyze the holdback bar release process. From the start of tensioning of the lock mechanism to the phase before release, there is a small axial displacement between the lock mechanism and the load transfer bar due to the gap between them. After the lock mechanism finishes unlocking, the lock mechanism moves rapidly and reaches the maximum axial displacement, as shown in Figure 7.
The load is applied to the holdback bar front joint to simulate the aircraft catapult load on the holdback bar, as shown in Figure 8.
When the loading time counts from 0 to 0.55 s, the load increases from 0 to 19.5 tons, and the load is stabilized at 19.5 tons from 0.55 to 0.7 s, and then will be unloaded after 0.7 s. When the holdback bar is unlocked, the nose landing gear torque arm joint of the aircraft will be unloaded after the separation from the front joint of the holdback bar.

5. Result and Discussion

The release process simulation is carried out according to the above-mentioned model to obtain the release load of the holdback bar. In order to identify the parameters affecting the sensitivity of the release load, the factors influencing the release load are quantitatively analyzed. The focus here is on the impact of the structural parameters of the holdback bar on the release load and the influence of the friction coefficient of the contact surface of the holdback locking mechanism on the release load.

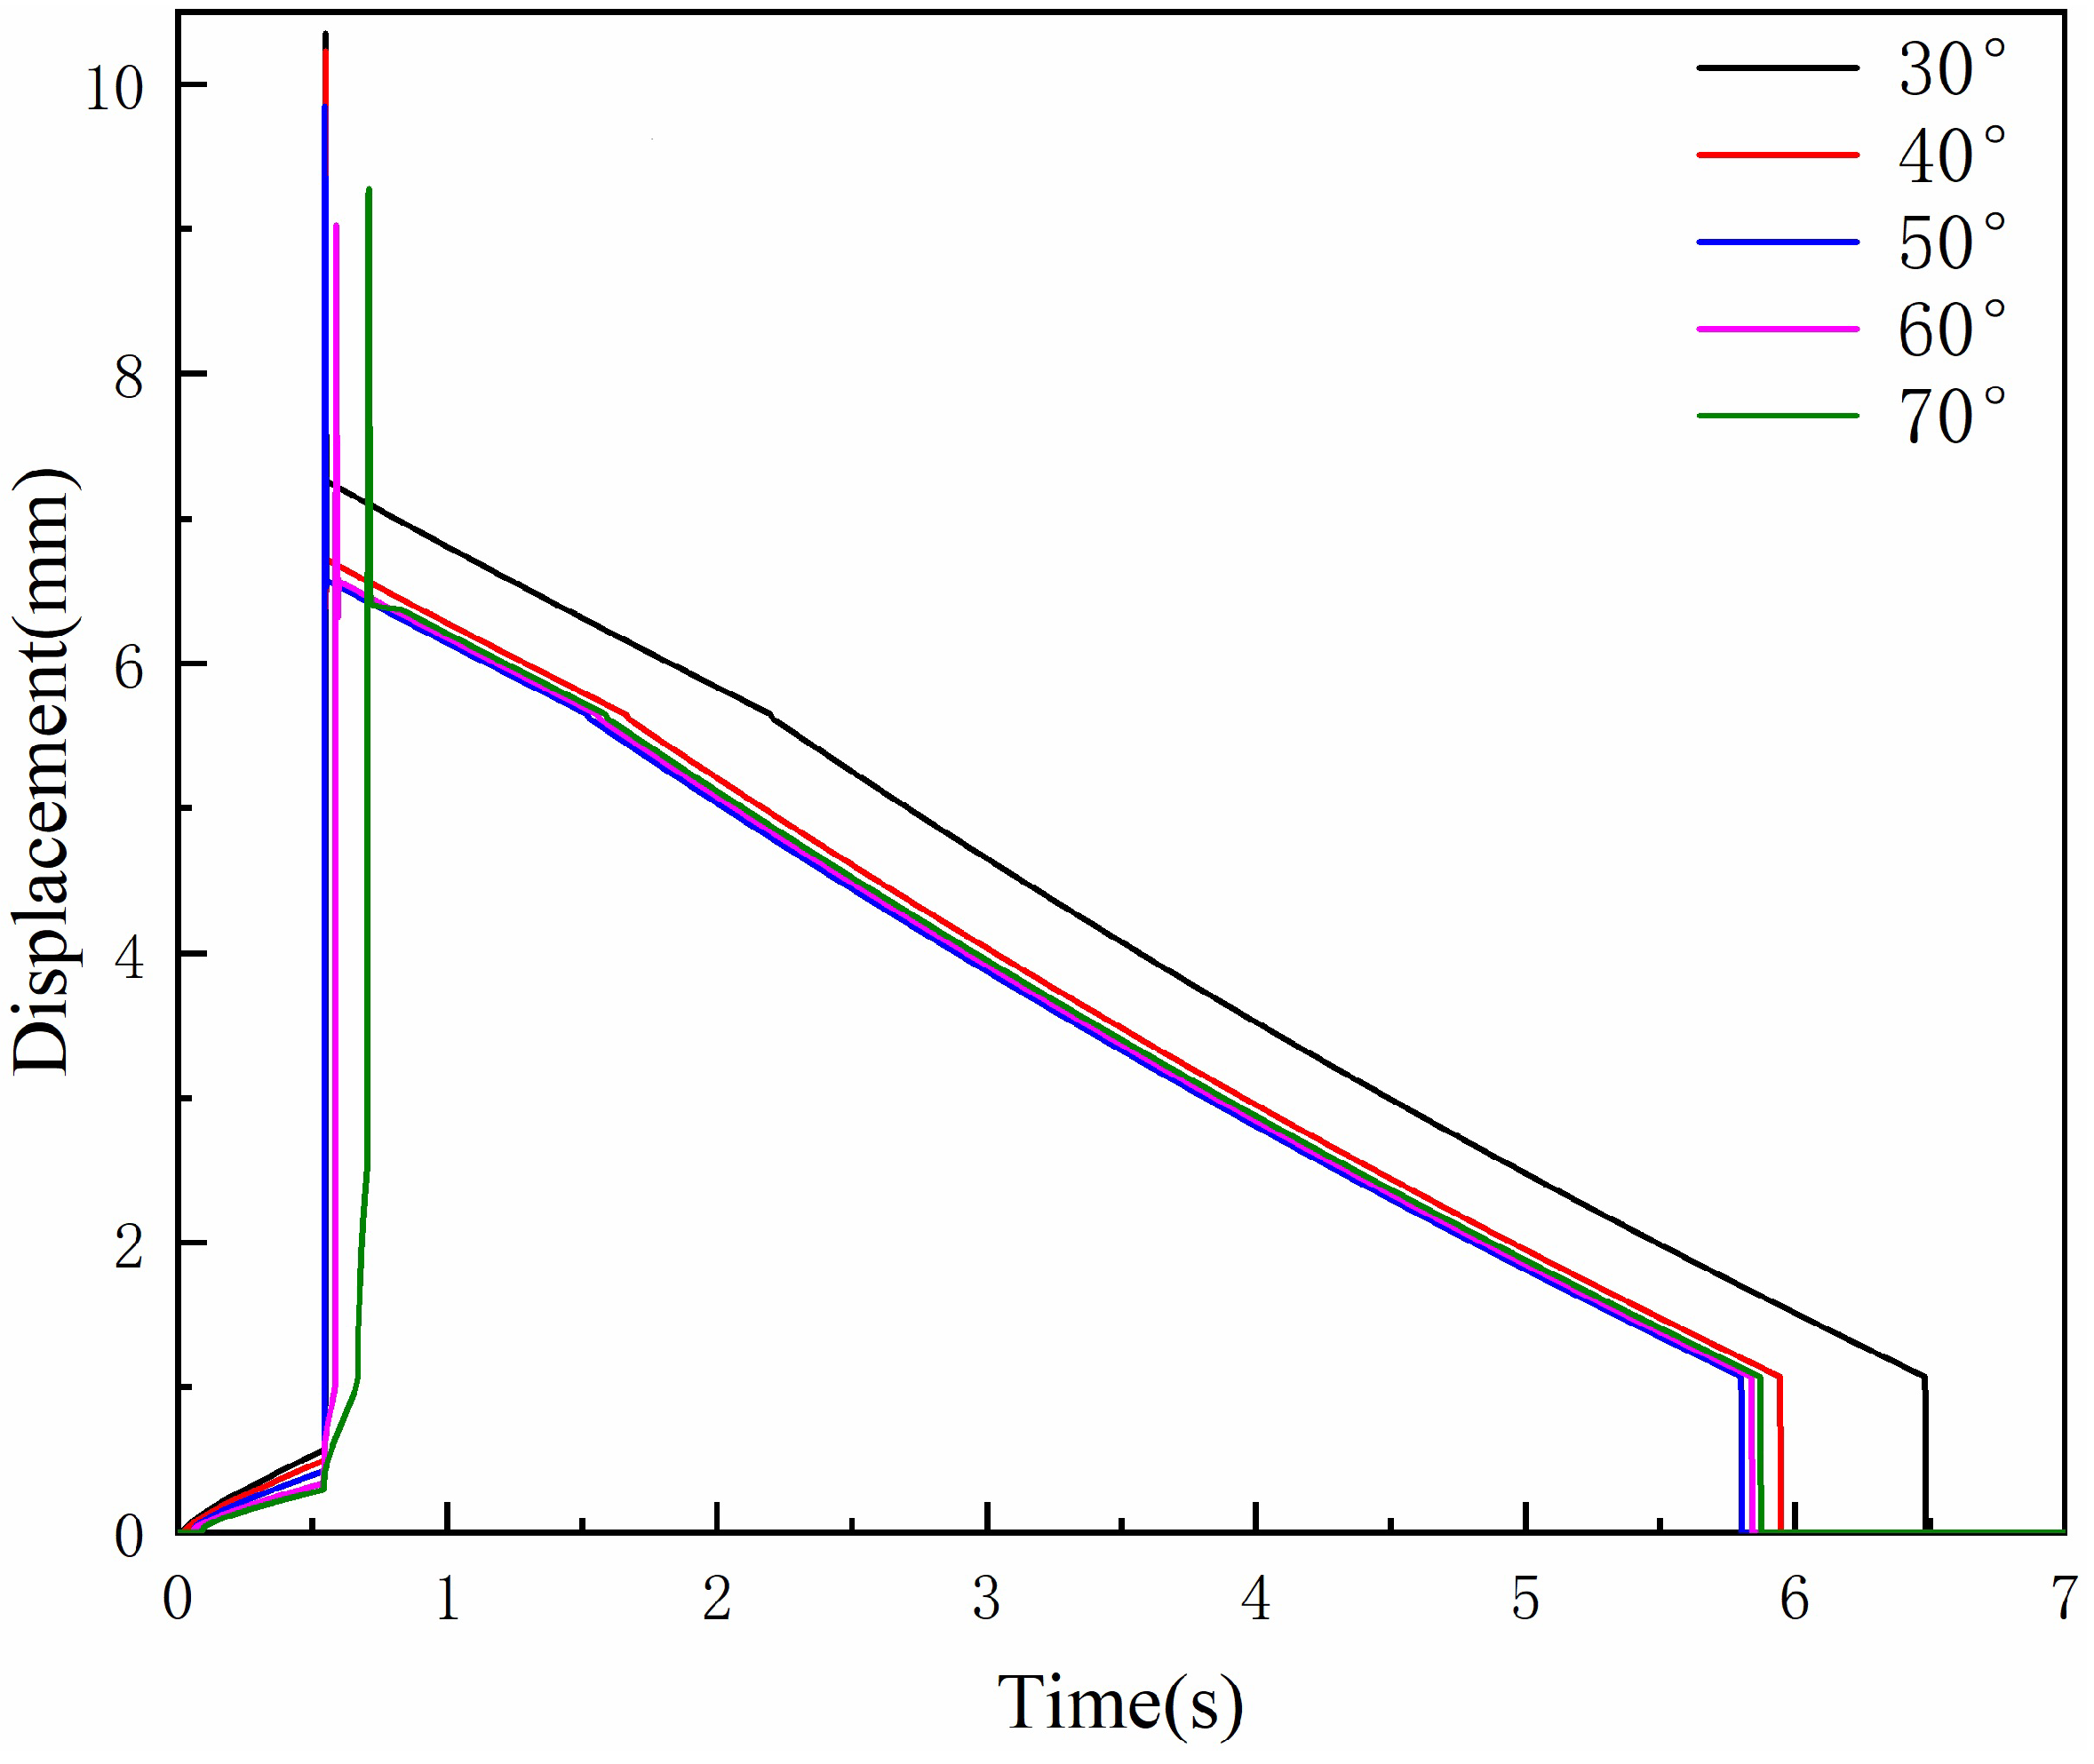
5.1. Influence of the Structural Parameters on the Release Load

The magnitude and accuracy of the release load of the holdback bar will affect the catapult-assisted takeoff performance of the aircraft, and the structural form and structural parameters of the holdback bar will affect the sensitivity of the release load. Here, according to the determined structural form, the influence of the structural parameters of the holdback bar on the release load is studied, and the angular parameters of the contact surface in the release mechanism are taken as the object of study. Five angles— 30 , 40 , 50 , 60 , and 70 —are selected to study the displacement changes of the release mechanism relative to the load transfer bar at different angles, as shown in Figure 9. When the load gradually increases from 0, the release mechanism has a small displacement relative to the load transfer bar; when the load reaches the release load, the lock mechanism unlocks and the displacement of the release mechanism reaches its maximum value; it can be seen from the figure that the holdback bar lock mechanism can be unlocked normally when the angle of the contact surface is taken from 30 to 70 .
To make out the release load of the contact surface in the holdback bar release mechanism at different angles, the contact surface angle was selected from 30 to 70 to study the change of the release load, as shown in Figure 10, which shows the release load curves at different angles. From the analysis results it is easy to find out that as the contact surface angle increases from 30 to 50 , the change of release load is small and remains around 19.5 tons, and when the angle increases from 50 to 70 , the release load increases significantly, from 19.5 tons to 30 tons.
The angle parameter of the contact surface of the holdback structure is between 30 and 50 , the change of the release load is small, and the impact on the sensitivity of the release load is small; when the angle is between 50 and 70 , the change of the release load is large, the release load increases gradually with the increase of the angle of the contact surface, and the impact on the sensitivity of the release load is large; in order to ensure the stability of the release load, the angle parameter should be selected between 30 and 50 , so that the precise release load of the drawbar can be controlled within the range of 0–6%.

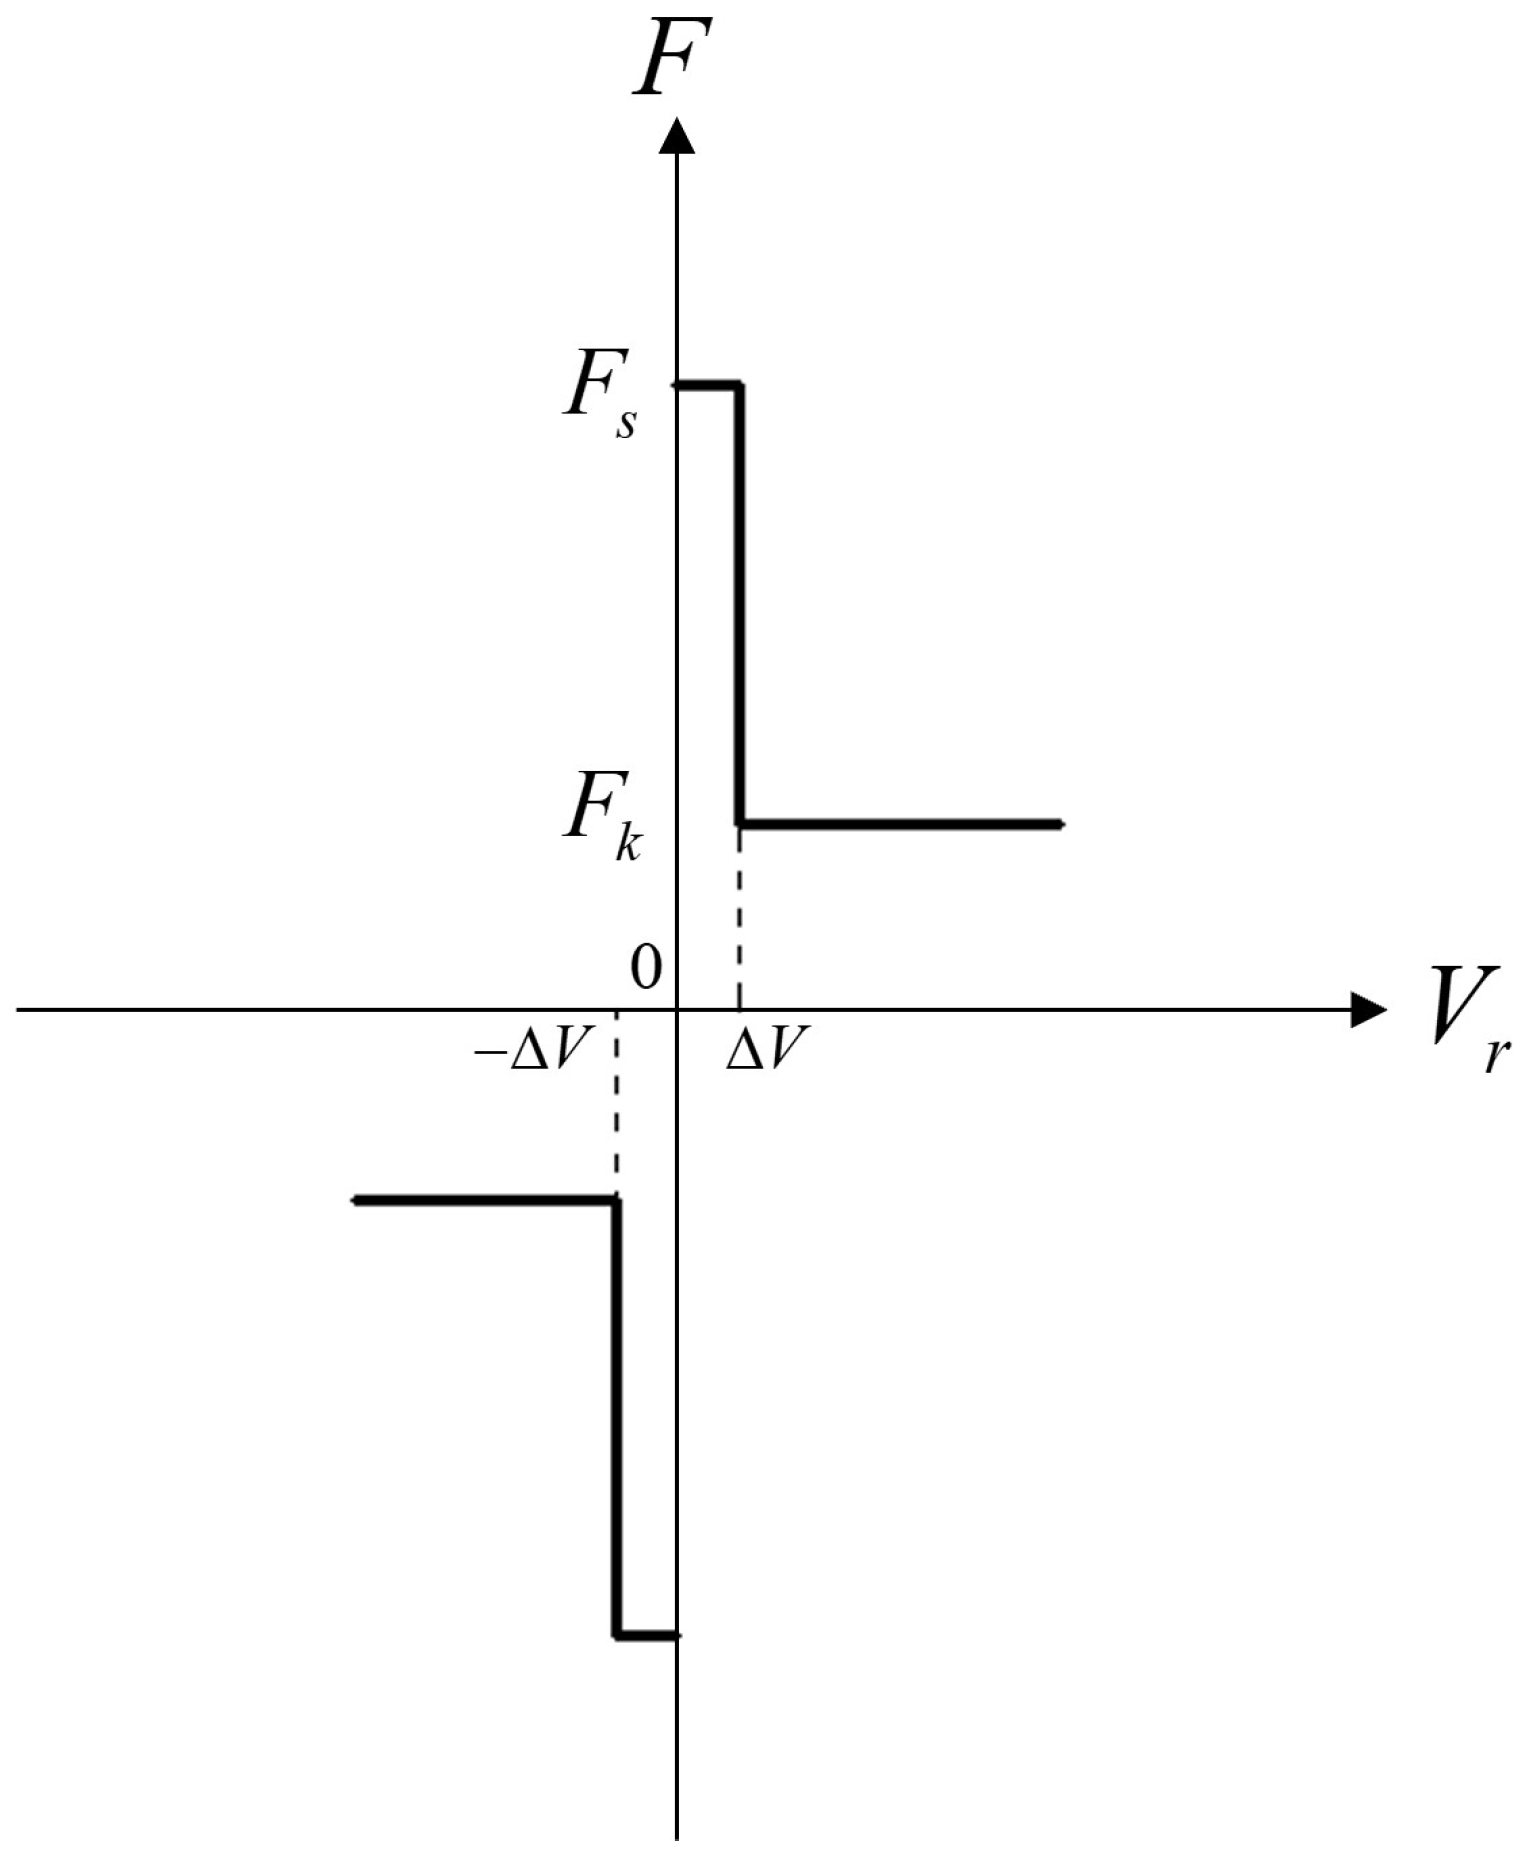
5.2. Effect of Contact Surface Friction Coefficient on Released Load

Friction exists between the lock mechanism of the holdback bar and the front joint, the load transfer bar, and the release mechanism. In the simulation analysis of the release load of the holdback bar, the friction force is set by the contact friction force module. The dynamic friction force is equal to the positive pressure multiplied by the friction coefficient, and the friction coefficients of the contact force are set to 0.1, 0.2, 0.3, and 0.4, respectively, and the corresponding release loads are obtained as shown in Table 1.
When the friction coefficient of the friction force of the holdback bar device is small, the variation of the release load with the friction coefficient is small, as shown in Figure 11, the larger the friction coefficient of the friction force between the contact surfaces of the holdback bar, the larger the release load.
When the friction coefficient of each contact surface of the holdback bar locking mechanism is between 0.1 to 0.3, the change of the release load is small, and the sensitivity of the release load is small; when the friction coefficient is greater than 0.3, the change of the release load is large, and the sensitivity of the release load is large. To ensure the stability of the release load, the friction coefficient should be controlled between 0.1 and 0.3.

6. Conclusions

By establishing the mechanical model of the carrier-based aircraft in the catapult-assisted takeoff tensioning state and release gliding state, as well as the dynamics model and friction model of the holdback bar device, the release process of the holdback bar was simulated and analyzed, and the effects of the structural parameters of the holdback bar and the friction coefficient on the sensitivity of the release load were studied. The following conclusions were obtained.
1.
The release load of the holdback bar is crucial to the catapult-assisted takeoff speed of the carrier-based aircraft, and the accurate control of the release load is the key to ensure the catapult-assisted takeoff performance.
2.
In determining the structural parameters of the contact surface of the holdback bar release mechanism, consideration should be given to the effect of changes in the angle of the contact surface on the sensitivity of the release load; when the angle of the contact surface is between 30 and 50 the effect on the sensitivity of the release load is small, in order to ensure the stability of the release load, the angle of the contact surface of the holdback bar should be selected within this range.
3.
The release load increases with the increase of friction coefficient of each contact surface of the holdback lock mechanism. When the friction coefficient is greater than the critical value of 0.3, the release load increases rapidly; in order to make the release load more stable, the friction coefficient should be selected in the range of 0.1 to 0.3, when the impact on the sensitivity of the release load is small.
4.
As for repeatable holdback bar, in order to ensure the stability of the release load when repeated, and to accurately control the magnitude of the release load, the factors affecting the sensitivity of the release load should be thoroughly considered in design and applications.

Author Contributions

Methodology, analysis, validation, writing—original draft, E.Z.; simulation Z.Z.; writing—review and editing H.N. All authors have read and agreed to the published version of the manuscript.

Funding

This research received no external funding.

Institutional Review Board Statement

Not applicable.

Informed Consent Statement

Not applicable.

Conflicts of Interest

The authors declare no conflict of interest.

References

  1. Helm, J.D.; Perry, H.H. The History and Development of the Repeatable Release Catapult Holdback Bar. SAE Trans. 1985, 94, 909–930. [Google Scholar]
  2. Systems Engineering and Standardization Department. Military Standard: Bar, Repeatable Release Holdback, Aircraft Launching, General Design Requirements for; MIL-B-85110A; Naval Air Engineering Center: Lakehurst, NJ, USA, 1991. [Google Scholar]
  3. Naval Air Warfare Center. Military Standard: Airplane Strength and Rigidity Ground Loads for Navy Acquired Airplanes; MIL-A-8863C(AS); Systems Requirements Department: Lakehurst, NJ, USA, 1993. [Google Scholar]
  4. Naval Air Engineering Center. Military Standard: Launching System, Nose Gear Type, Aircraft: MIL-L-22589D(AS); Naval Air Engineering Center: Lakehurst, NJ, USA, 1991. [Google Scholar]
  5. Lucas, C. Catapult Criteria for a Carrier-Based Aircraft; Ltv Aerospace Corp Dallas Tex Vought Aeronautics DIV: Dallas, TX, USA, 1968. [Google Scholar]
  6. Jin, C.J.; Hong, G.X. Dynamic problems of carrier aircraft catapult launching and arrest landing. Chin. J. Aeronaut. 1990, 11, 534–542. [Google Scholar]
  7. Zheng, B.W. The catapulting performance of the carrier-based airplane and the parameter study. Flight Dynam. 1992, 10, 27–33. [Google Scholar]
  8. Zheng, B.W. The influence of the nose gear fast-extension on the catapult trajectory for carrier-based airplane. Trans. Nanjing Univ. Aeronaut. Astronaut. 1994, 26, 7. [Google Scholar]
  9. Zheng, B.W. The study of the parameter optimization of catapult take-off for a carrier-based airplane. Flight Dynam. 1995, 13, 6. [Google Scholar]
  10. Wallace, M.M. F/A-18E/F Catapult Minimum End Airspeed Testing. Master’s Thesis, University of Tennessee, Knoxville, TN, USA, 2002; p. 12. [Google Scholar]
  11. Wang, W.J.; Qu, X.J.; Guo, L.L. Multi-agent Based Hierarchy Simulation Models of Carrier-based Aircraft Catapult Launch. Chin. J. Aeronaut. 2008, 21, 223–231. [Google Scholar]
  12. Yu, H.; Nie, H.; Wei, X.H. Analysis on the dynamic characteristics of carrier-based aircraft nose landing gear with sudden holdback load discharge. Chin. J. Aeronaut. 2011, 32, 1435–1444. [Google Scholar]
  13. Zhu, Q.D.; Lu, P.; Yang, Z.B.; Ji, X.; Han, Y.; Wang, L.P. Launch bar dynamics character analysis of carrier-based aircraft catapult launch. Appl. Sci. 2019, 9, 3079. [Google Scholar] [CrossRef] [Green Version]
  14. Fang, X.B.; Nie, H.; Zhang, Z.; Wei, X.H.; Zhang, M. Dynamic response analysis on carrier-based UAV considering catapult shuttle mass. Chin. J. Aeronaut. 2018, 39, 193–201. [Google Scholar]
  15. Yu, H.W.; Chen, D.W.; Gu, H.B. Dynamic modeling for carrier-based aircraft catapult takeoff. Aeronaut. Comput. Tech. 2018, 48, 4. [Google Scholar]
  16. Dong, A.P.; Li, S.; Zhu, W.G.; Wu, W.X. Influence factor analysis of catapult launch safety for carrier-based aircraft. J. Beijing Univ. Aeronaut. Astronaut. 2018, 44, 9. [Google Scholar]
  17. Feng, Y.P.; Chen, B.; Zhang, B.; Xia, B.; Li, R. Influence factor analysis on the catapult launch of the carrier-based aircraft by the aircraft carrier’s vertical toss. Flight Dynam. 2019, 37, 25–30. [Google Scholar]
  18. Murch, A.; Bolkcom, C. F-35 Lightning II Joint Strike Fighter (JSF) Program: Background, Status, and Issues; Congressional Research Service: Washington, DC, USA, 2004. [Google Scholar]
  19. Wilson, T. F-35 carrier suitability testing. In Proceedings of the 2018 Aviation Technology, Integration, and Operations Conference, Atlanta, GA, USA, 25–29 June 2018. [Google Scholar]
  20. Cai, L.Q.; Jiang, J.; Wang, X.H.; Pan, T.T. Effects of deck motion on carrier-based aircraft’s catapult launching performance. Flight Dynam. 2014, 32, 105–109. [Google Scholar]
  21. Dou, Q.B.; Chen, Y.; Ma, X.L.; Mu, R.K. Experimental study on the sudden-extension performance of carrier-based aircraft landing gear. J. Vib. Eng. 2018, 31, 102–109. [Google Scholar]
  22. Yang, Y.; Tang, K.B.; Fang, X.; Yao, X.H. Dynamic response analysis method and application of shipboard aircraft take-off structure. J. Nanjing Univ. Aeronaut. Astronaut. 2020, 52, 957–962. [Google Scholar]
  23. Chen, H.; Fang, X.B.; Nie, H. Analysis of Carrier-Based Aircraft Catapult Launching Based on Variable Topology Dynamics. Appl. Sci. 2021, 11, 9037. [Google Scholar] [CrossRef]
  24. Popov, V.L. Contact Mechanics and Friction: Physical Principles and Applications; Springer: Berlin/Heidelberg, Germany, 2017. [Google Scholar]
  25. Karnopp, D. Computer Simulation of Stick-slip Friction in Mechanical Dynamic Systems. ASME J. Dynam. Syst. Meas. Control 1985, 107, 100–403. [Google Scholar] [CrossRef]
Figure 1. Aircraft force analysis in holdback bar tension state.
Applsci 12 00785 g001
Figure 2. Force analysis of gliding aircraft after holdback bar release.
Applsci 12 00785 g002
Figure 3. Schematic diagram of the connection between the holdback bar and the nose landing gear and the deck.
Applsci 12 00785 g003
Figure 4. Sketch of holdback bar connection relationship and kinematic pairs.
Applsci 12 00785 g004
Figure 5. Two cylindrical objects in parallel contact.
Applsci 12 00785 g005
Figure 6. Karnopp friction model.
Applsci 12 00785 g006
Figure 7. Axial displacement curve of the lock mechanism.
Applsci 12 00785 g007
Figure 8. Holdback bar release load vs. loading time.
Applsci 12 00785 g008
Figure 9. Relative displacement of the release mechanism.
Applsci 12 00785 g009
Figure 10. Release load at different angles.
Applsci 12 00785 g010
Figure 11. Variation curve of released load with friction coefficient.
Applsci 12 00785 g011
Table 1. Release load corresponding to different friction coefficient.
No.Friction CoefficientRelease Load (t)
10.117.1
20.218
30.318.8
40.434.6
Publisher’s Note: MDPI stays neutral with regard to jurisdictional claims in published maps and institutional affiliations.

