Article

Numerical and Parametric Analysis for Enhancing Performances of Water Photovoltaic/Thermal System

by
Chaimae El Fouas
1,
Nelu Cristian Cherecheș
2,*,
Sebastian Valeriu Hudișteanu
2,*,
Bekkay Hajji
1,
Emilian Florin Țurcanu
2,* and
Monica Lilioara Cherecheș
3
1
Laboratory of Renewable Energy, Embedded System and Information Processing, National School of Applied Sciences, Mohammed First University, Oujda 60000, Morocco
2
Department of Building Services, “Gheorghe Asachi” Technical University of Iași, 700050 Iași, Romania
3
National Institute for Research and Development in Construction, Urban Planning and Sustainable Spatial Development, NR&DI URBAN-INCERC Iasi Branch, 700048 Iasi, Romania
*
Authors to whom correspondence should be addressed.
Appl. Sci. 2022, 12(2), 646; https://doi.org/10.3390/app12020646
Submission received: 16 November 2021 / Revised: 3 January 2022 / Accepted: 4 January 2022 / Published: 10 January 2022
(This article belongs to the Special Issue Urban Sustainability and Resilience of the Built Environments)

Abstract

:
Photovoltaic/thermal (PV/T) systems are innovative cogeneration systems that ensure the cooling of photovoltaic (PV) backside and simultaneous production of electricity and heat. However, an effective cooling of the PV back is still a challenge that affects electrical and thermal performance of the PV/T system. In the present work, a PV/T numerical model is developed to simulate the heat flux based on energy balance implemented in MATLAB software. The numerical model is validated through the comparison of the three-layer PV model with the NOCT model and tested under the operation conditions of continental temperate climate. Moreover, the effect of velocity and water film thickness as important flow parameters on heat exchange and PV/T production is numerically investigated. Results revealed that the PV model is in good agreement with the NOCT one. An efficient heat transfer is obtained while increasing the velocity and water film thickness with optimal values of 0.035 m/s and 7 mm, respectively, at an inlet temperature of 20 °C. The PV/T system ensures a maximum thermal power of 1334.5 W and electrical power of 316.56 W (258.8 W for the PV). Finally, the comparison between the PV and PV/T system under real weather conditions showed the advantage of using the PV/T.

1. Introduction

Increasing energy demand for industrial and domestic purposes has led to greater interest in renewable energy as a substitute for fossil fuels. Sun radiation is the primary source of all types of renewable energy sources. Photovoltaic (PV) technology is one of the common methods of direct converting the solar radiation into electricity [1]. Instead, the performance of PV panels falls by 0.5% for every degree rise in temperature, depending on the type of solar cells used [2]. Since the PV temperatures can reach as high as 80 °C in the summer, it is necessary to find efficient cooling methods to achieve higher heat dissipation rates from PV modules and increase his electrical efficiency and longevity.
An efficient version of the PV module is the photovoltaic–thermal (PV/T) module which uses cooling systems to remove the excess thermal energy. The commercially available technologies are classified into passive and active cooling systems [3]. Active cooling systems use forced circulation of air [4,5,6], water [7,8,9,10], or nanofluids [11] while the passive ones use natural circulation of working fluids in which no external source of power is needed as well as heat pipes [12] or phase change materials (PCMs) to naturally transport heat through a boiling–condensing process to the ambient air [13]. Some recent related review articles also provide updates on the important aspects of PV/T cooling systems [14,15,16,17,18].
Water cooling methods provide improved performance over air cooling methods due to the increase in heat-carrying capacity of water over air [19]. Nahar et al. [20] studied the performance of a PV/T module with parallel plate flow channel without absorber plate both numerically and experimentally at outdoor conditions. They observed that the overall efficiency increases numerically by 22.1% and experimentally by 20% with an increase in water inlet velocity from 0.0003 to 0.0007 m/s under an irradiation level of 1000 W/m2 and inlet water temperature of 34 °C.
A novel compound system through connecting a PV/T system with a solar collector in series was proposed by Kazemian et al. [21]. The results showed that using the optimum condition given by Taguchi-based gray relational optimization, electrical, thermal and total power generation of the system increased by 23.86%, 35.78%, and 34.75%, respectively.
A hybrid photovoltaic/thermal (PV/T) collector with serpentine exchanger was studied by Boumaarafa et al. [22] showing that combining both types of heat and electrical offers a better thermal performance with an overall thermal efficiency around 79.43%.
Different parameters for enhancing heat transfer performance of photovoltaic thermal systems was investigated by Nahar et al. [23]. Results revealed that PV/T electrical and thermal efficiency increase with both Reynolds and Prandtl number and a maximum reduction in cell temperature of 10.2 °C was achieved for increasing channel depth from 10 to 20 mm.
Even with the large number of papers related to the PV/T system, there is little research work that treats enhancement of flow parameters, e.g., the inlet velocity and water film thickness simultaneously for an effective cooling of PV cells. This paper presents a transient numerical PV/T model based on an energy balance equation developed in MATLAB software and resolved by the Runge–Kutta numerical method. This model is built based on the three layers PV model validated with the NOCT model. Moreover, the energy balance equations for the cooling unit (absorber 1, fluid, absorber 2) are driven from a PV/T model validated experimentally in previous work [24]. Thus, based on the developed model, a parametric study was conducted to determine the optimal flow parameters.

2. Methodology

2.1. Numerical Model

A numerical model was developed to evaluate the thermal and electrical behavior of a PV/T system, operating in dynamic conditions. The parametric analysis was performed by varying some PV/T key flow parameters, such as the water velocity from 0.01 m/s to 0.035 m/s, water film thickness from 3 mm to 10 mm, and water inlet temperature from 20 °C to 30 °C.
The PV/T system investigated in this work consists mainly of four solid components and cooling liquid (water). According to the PV/T system design shown in cross section in Figure 1a, six sub-numerical models were established as follows:
  • Sub-numerical model for the glass cover;
  • Sub-numerical model for the PV module;
  • Sub-numerical model for the Tedlar layer;
  • Sub-numerical model for the upper aluminum layer;
  • Sub-numerical model for the water film in channel;
  • Sub-numerical model for the lower aluminum layer.
Figure 1. Components (a) and heat exchange mechanism in the PV/T system (b).
Applsci 12 00646 g001
For the six PV/T system sub-models, a heat balance equation was done separately, based on the internal energy variation equation [25] and the heat transfer between layers as shown in Figure 1b. Moreover, the Runge–Kutta numerical method (RK4) was used for resolving the (ODE) governing equations in MATLAB Software. The main advantage of the developed numerical model is allowing the determination of the mean temperature of each PV/T layer (glass cover, PV cells, Tedlar, absorbers, and fluid), based on the different heat exchanges between these ones.
The main PV technical characteristics (applied to Standard Test Conditions of solar irradiance of 1000 W/m2 and ambient temperature of 25 °C) and the selected PV/T system properties are reported in Table 1 and Table 2. Moreover, the assumptions considered in developing the PV/T model due to its different components were [22,23,26]:
  • A (1D) numerical model is built since the layers thickness are very thin relative to the other dimensions. As a result, heat losses are considered to be neglected at the PV/T sides and average uniform temperature is determined for each layer;
  • The amount of absorbed solar irradiation that is not converted into electricity is transferred from the PV cells back to the rest of system;
  • The material properties remain constant in the PV/T system, for a temperature limited range;
  • The heat flux between PV cells and EVA is supposed to be negligible;
  • A perfect contact between PV/T components is supposed;
  • The effects of dust and partial shading were neglected.
Table 1. PV module technical characteristics applied to STC.
PV TypePmax
(W)
Vmp
(V)
Imp
(A)
Voc
(V)
Isc
(A)
ŋ e
(%)
NOCT
(°C)
AE320HM-60 Mono-crystalline32033.409.5940.9010.1519.3045 ± 2
Table 2. PV/T investigated parameters.
Dimensions1665 × 996 (mm × mm)
PropertiesGlazingPV CellsTedlarAluminum Absorber
Density (kg/m3)2300233015002700
Thermal conductivity (W/m·K)1.0168.00.2160
Specific heat (kJ/kgK)5007571200900
Thickness (m)0.0030.000350.00150.003

2.2. Heat Balance Governing Equations

In the present work, a PV/T transient model was conducted based on a heat balance established for solid and fluid domains. In all solid components (glass, PV module, Tedlar, aluminum absorbers), the heat exchange process occurs by conduction mechanism, while in the flow duct, the thermal transfer to fluid (water) is through the convection mode. For each PV/T layer, the energy balance equation is a function of the layer internal energy variation taking into account some external parameters, e.g., the solar irradiance, ambient temperature, wind speed, and mass flow rate. Thus, the energy governing equations for solid and fluid layers were obtained considering the selected thermo-physical proprieties summarized in Table 2.

2.2.1. Solid Layers

The heat flux for the PV/T solid layers can be obtained using Equation (1). It is a function of the density   ρ S , specific heat capacity   c p , S and the thickness δ s   of the selected layer as well the thermal heat exchange coefficient   h s :
ρ S   δ s c p , s   dT s dt = Σ   h s   Δ T s + α   E s u n ϑ E e
where Δ T s is the temperature gradient and E s u n is the absorbed solar irradiance for each solid layer. In fact, a significant part of the incident solar irradiance is absorbed by the PV cells and converted to electrical energy   E e while the remainder is lost with environment. Thus, the absorption and electricity production terms for PV cell are   α 0 ; ϑ = 1 and for the other solid layers are   α = 0 ; ϑ = 0.
The expression of heat exchange coefficient h s is directly dependent on the heat transfer mechanisms between layers. In case of solid layers i,j where heat is transferred by conduction,   h s   is given by:
h s   = h c i , j = 1 ( δ i λ i + δ j λ j ) A i , j
where: λi and δi are the thermal conductivity and thickness of the layer i; λj and δj are the thermal conductivity and thickness of the layer j and Ai,j is the exchange area between the layers i,j.
For the front of the PV/T system, three expressions of the heat exchange coefficient   h s 1 ,   h s 2 , and h s 3 are used, due to the heats transfer by radiation between the glass-sky, glass-ground and by convection between the glass-ambient:
h s 1   =   h r g , s k y   =   σ ε g F g , s k y   A ( T s k y + T g ) · ( T s k y 2 + T g 2 )
h s 2   =   h r g , gr   =   σ ε g F g , g r     A ( T g r + T g ) · ( T g r 2 + T g 2 )
h s 3   =   h v g , a   =   ( h v f o r c e d 3 + h v f r e e 3 ) 1 / 3
where ε g , is the glass emissivity; F g , s k y   and F g , g r   are the view factors [24].
The glass-ambient heat transfer coefficient h s 3 is determined as the sum of the forced and natural convective heat transfer coefficients h v f o r c e d and   h v f r e e . If Gr/Re2 << 1, the forced convection regime has been evaluated. Thus, the following correlation [27] based on the wind speed velocity   w is used:
h v f o r c e d = 2.8 w + 3
Otherwise, for Gr/Re2 >> 1, the correlation of Bejan et al. [28] depending on the air thermal conductivity   λ a and Nusselt number   N u f r e e is adopted:
h v f r e e = N u f r e e   λ a L
N u f r e e = 0.14 [ ( G r   P r ) 1 3 ( G r c r   P r ) 1 3 ] + 0.56 ( G r c r P r cos θ )
At the back side of the PV/T system, the heat losses by radiation between the absorber-sky, absorber -ground, and by convection between the absorber–ambient were considered. Moreover, three heat exchange coefficients h s 1 ,   h s 2 , and h s 3 can be expressed as follows:
h s 1 = h r a b s l , s k y = σ ε a b s l F s k y , a b s l   A ( T s k y + T a b s l ) · ( T s k y 2 + T a b s l 2 )
h s 2 = h r a b s l , g r   σ ε a b s l F a b s l , g r     A ( T g r + T g ) · ( T g r 2 + T g 2 )
h s 3   = h v a , a b s l
where εabsl, is heat transfer between the absorber and the ambient.
The heat exchange coefficient h s 3 = h v a b s l , a could be calculated as function of the forced or the free convection regime using the following correlations considered in [29].
In case of forced convection:
h v a b s l , a = 5.7   w
While in free convection is determined by:
h v a b s l , a = N u f r e e   λ a L
N u f r e e = { 0.825 + 0.387 R a 1 / 6 [ 1 + ( 0.492 P r ) 9 / 16 ] 8 / 27 } 2
For the duct formed by the two aluminum plates, the heat exchange coefficient h s   is due to the radiation mechanism as expressed in [30].
Table 3 shows the set of governing equations introduced in the numerical model for the solid PV/T layers.

2.2.2. Fluid Layers

For the cooling fluid flows in the duct of the PV/T system, the energy balance equation is given as:
( ρ f δ f   C f ) d T f dt = h c f , a b s 1 ( T a b s 1 T f ) + h c a b s 2 , f ( T a b s 2 T f ) m ˙ C f   ( T o u t T i n t )
where   m ˙ , C f ,   and   T i n t   and T o u t are respectively the fluid mass flow rate, the fluid specific heat capacity, and the temperature at the inlet and outlet of the PV/T system.
The heat transfer coefficients h c f , a b s 1 and h c f , a b s 2   characterize the convection between the two absorbers and fluid and can be evaluated as a function of the fluid thermal conductivity λ f , duct hydraulique diameter D h , and Nusselt number N u f :
h c f , a b s 1 = h c f , a b s 2 = N u f   λ f D h
The Nusselt number for water cooling flow between absorber plates is deduced from the correlations of Kudish et al. [31]:
N u f = 1.86   [ R e   P r ( D h L ) ]   1 3   ( μ f μ f ) 0.14 ,   case   of   laminar   flow
N u f = 0.023   [   R e   0.8 P r   0.33 ] ,   case   of   turbulent   flow
where R e   ,   P r , and μ f are respectively the Reynolds number, Prandlt number, and fluid dynamic viscosity; μ f = μ f ( T p ) [32].
By rearranging the governing Equations (15)–(20), a set of energy differential equations was built. Thereafter, a MATLAB solution program was developed where the Runge–Kutta (RK4) numerical method was used to solve the energy balance system. Finally, the basic simulation allowed to determine the temperature profile as well as the thermal, electrical, and global performances. The calculation steps in MATLAB software are summarized in flow chart form as shown in Figure 2.

2.3. Energy Analysis Method

In order to analyze the developed numerical model for the PV/T system, a performance evaluation is required. Therefore, the solar irradiance as an energy source was supposed uniform and perpendicular on the PV/T surface. Absorber solar irradiance by the PV cells layer was given as function of the glass layer transmittance τ g , the cell absorptivity   α PV , and the incident solar irradiance E s u n by [33]:
E s u n = τ g α P V     E s u n
The electrical production from the PV cells is determined by Equation (24):
E e = A p v   η e E s u n
For evaluation of the electrical performance, the following expression was used [30]:
η e = η r e f [ 1 β ( T P V T S T c ) ]
where η r e f is the reference efficiency; β is the temperature coefficient; TPV is the PV cells temperature; and T S T c is PV cells temperature at STC conditions equal to 25 °C. According to the AE320HM-60 PV commercial unit with characteristic reported in Table 1, the η r e f is about 19.30% and β is equal to 0.0045 C−1 [34].
The thermal production of PV/T system is a function of fluid mass flow rate   m ˙ , fluid specific heat capacity C f   , and the temperature difference of the fluid at the inlet and outelt of the PV/T system [35]:
E t h = m ˙ C f   ( T o u t T i n t )
For assessment of thermal efficiency, the fraction of the thermal production on the absorbed solar irradiance was conducted according to Equation (28):
η t h = E t h E s u n
Combining both electrical and thermal efficiencies, the PV/T global performance was obtained by:
η g = η e + η t h

3. Results and Discussion

In this section, the set of obtained results is presented and discussed. To test the accuracy of the developed PV/T model allowing the prediction of both thermal and electrical behavior of the system, a model validation is processed. Based on the same thermal model, a comprehensive analysis is further performed to assess the effect of some PV/T key parameters on its outputs. Finally, the PV/T optimized model is tested under the real weather data of Iasi, Romania and performance comparison with conventional PV panel is conducted.

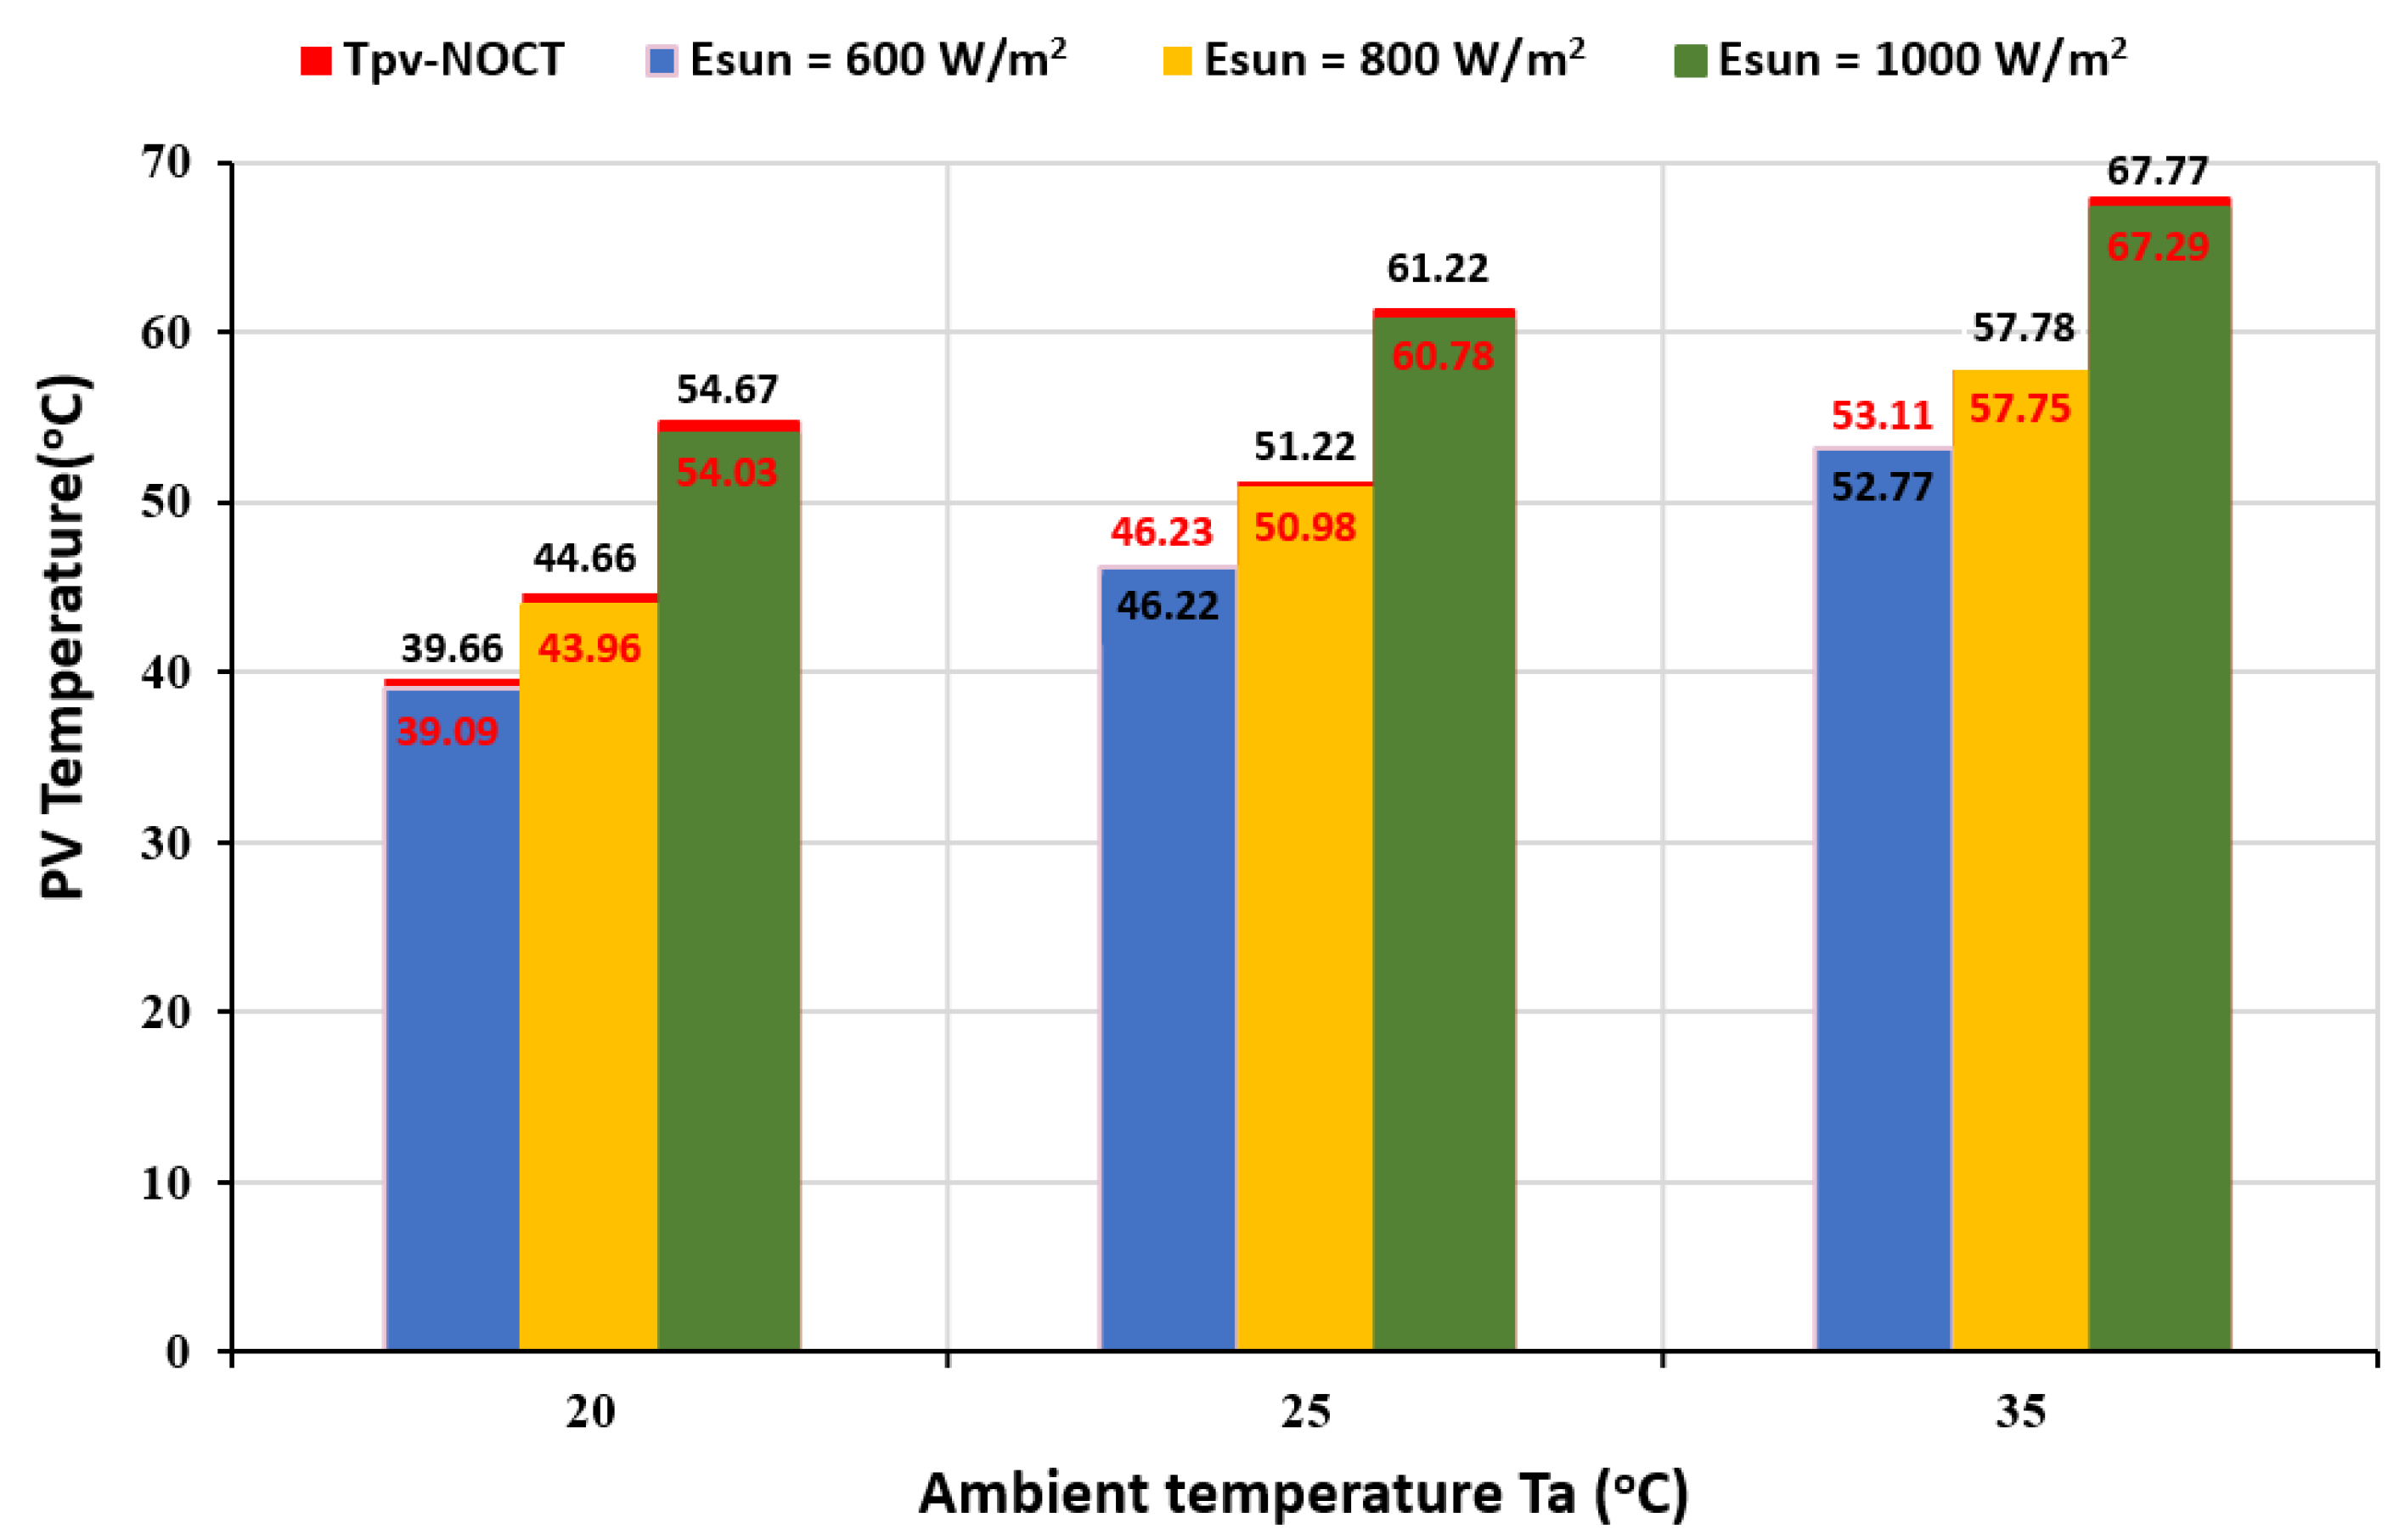
3.1. Model Validation

The validation process included the model of the PV unit, mainly formed by the glass, PV cells, and Tedlar (Equations (15)–(17)). This model was tested under different operating conditions, e.g., solar irradiance and outdoor temperature. Furthermore, the results were compared with the data for Nominal Operating Cell Temperature conditions (NOCT: Esun = 800 W/m2, Ta = 20 °C and w = 1 m/s). In Figure 3, the PV cells temperature is evaluated for different solar irradiances of 600 W/m2, 800 W/m2, and 1000 W/m2 with an ambient temperature of 20 °C, 25 °C, and 35 °C, respectively. From this figure, the effect of environmental conditions on a PV temperature is clearly shown (a minimum PV temperature was noted at about 39 °C when solar radiation and ambient temperature were lower, about 600 W/m2 and 20 °C). It can be also observed that the difference between PV temperature values and NOCT is quite negligible. According to the commercial PV datasheet characteristic summarized in Table 1, the NOCT value was 45 ± 2 °C, while for the three layers model, the PV temperature was 43.96 °C, which proves the effectiveness of PV developed model. For the rest of the PV/T system (absorber 1, fluid and absorber 2), the developed Equations (18)–(20) were written based on the PV/T model validated experimentally in [24].

3.2. Parametric Analysis

3.2.1. Effect of Water Velocity

Based on the developed numerical model, the effect of water velocity on the PV/T performance was analyzed. The environmental conditions involved in this analysis were a solar irradiance of 1000 W/m2, an outdoor temperature of 35 °C, and a wind speed of 1 m/s. The fluid velocity as a flow control parameter had a significant effect on the cooling of the PV unit. Hence, Figure 4 investigates the PV temperature evolution as function of water inlet temperature for different water velocities of 0.010 m/s, 0.015 m/s, 0.02 m/s, 0.025 m/s, 0.030 m/s, and 0.035 m/s. As result, it is depicted that by increasing water velocity from 0.010 m/s to 0.035 m/s, a drop in the PV temperature was observed in the four cases, where the water film thickness was 3 mm, 5 mm, 7 mm, and 10 mm. In addition, a minimum value of PV operating temperature about 27.7 °C was observed for an inlet water temperature of 20 °C, water thickness of 7 mm, and highest velocity of 0.035 m/s. This underlines the effective cooling of the PV cells, where a significant heat is extracted from the PV back side while increasing the water velocity.

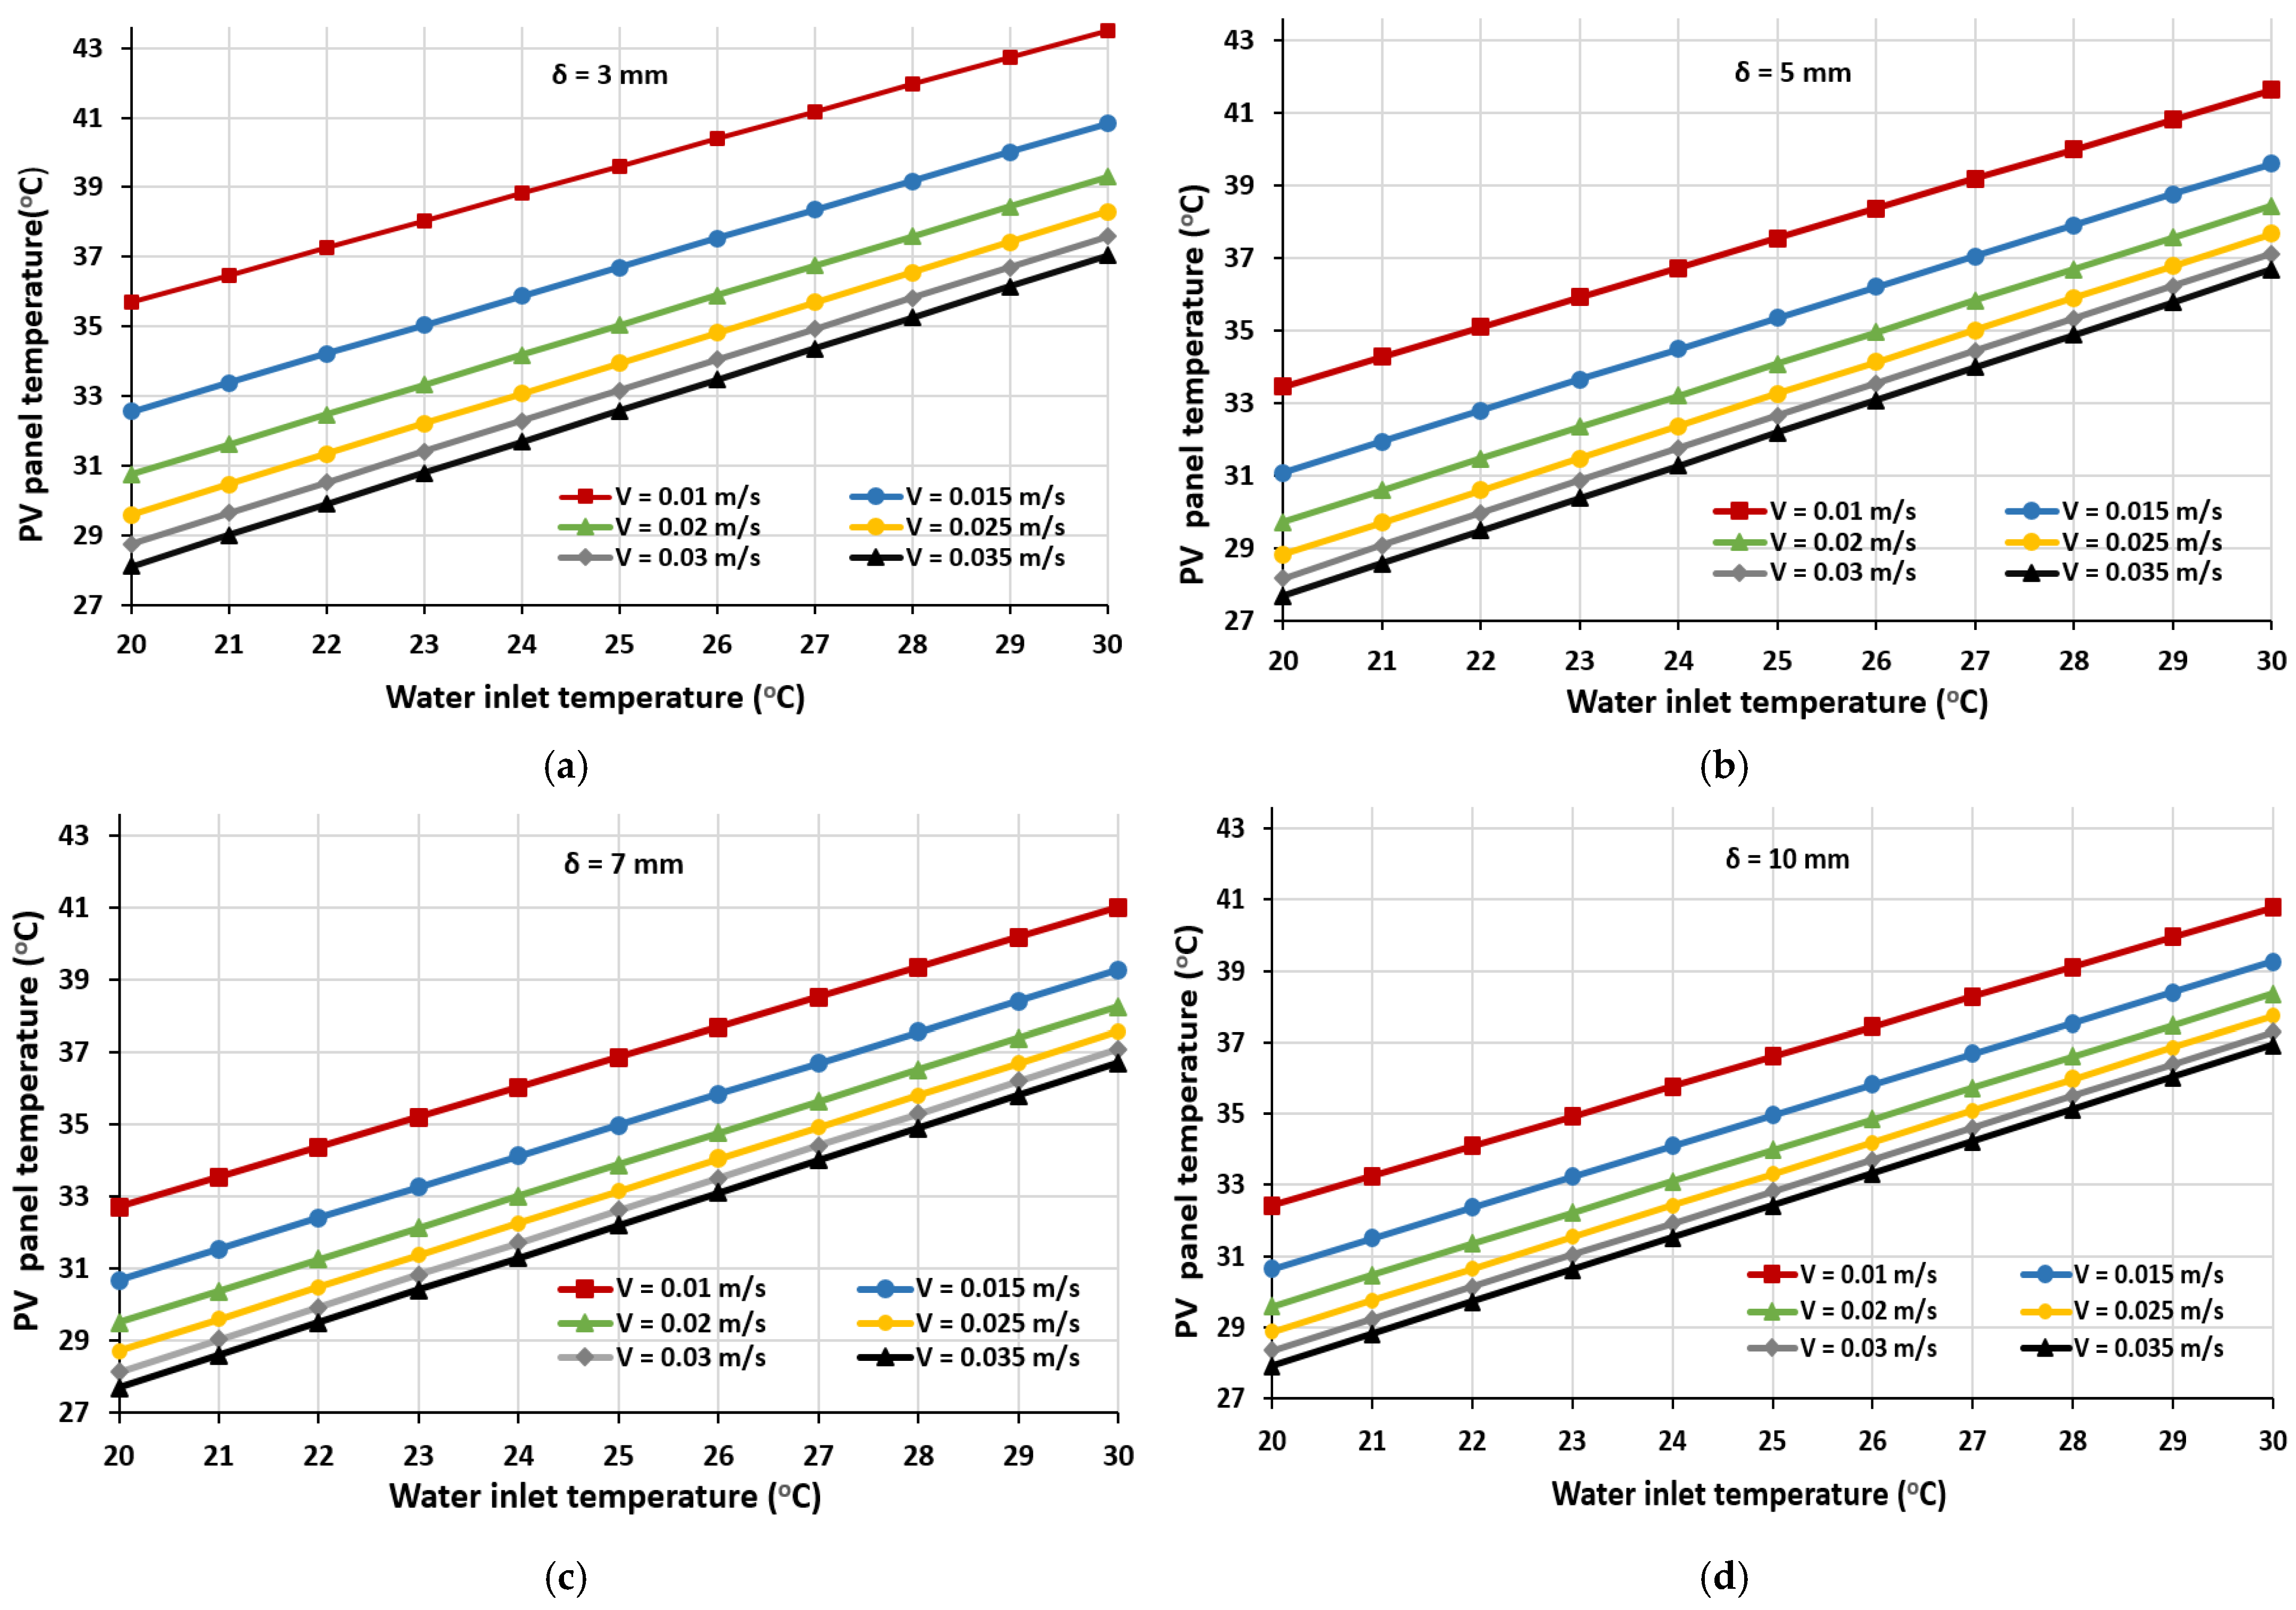
3.2.2. Effect of Water Film Thickness

Among the other geometry parameters for flow, the water film thickness presented an important effect on the optimized cooling of the PV cells and the PV/T electrical and thermal performances. Hence, four water thicknesses of 3 mm, 5 mm, 7 mm, and 10 mm were selected to investigate its impact on the cooling of the PV cells with water velocity and inlet temperature ranging from 0.010 to 0.035 m/s and 20 to 30 °C, respectively. The study was carried out under the same weather conditions mentioned above (solar irradiance of 1000 W/m2, outdoor temperature of 35 °C, and wind speed of 1 m/s).
As illustrated in Figure 5, as the water film thickness increased (3 mm, 5 mm, 7 mm) for the different water velocity cases, the PV temperature decreased. This is due to the important heat removed from the PV panel, while by further increasing the water film thickness from 10 mm the PV temperature start increasing (inflexion point). As a result, a minimum value of PV temperature was noted to be 27.7 °C for an optimal water film thickness of 7 mm (water inlet temperature and velocity of 20 °C and 0.035 m/s, respectively).
In Figure 6, the effect of the water film thickness on the fluid heat transfer coefficient and thermal power is illustrated for variable water velocity and inlet temperature. From this figure, it can be seen that with the increase in water thickness, the heat exchange coefficient dropped which decreases the fluid outlet temperature. However, the thermal power increased and reached a maximum value of 1334.5 W at water thickness of 7 mm (water velocity of 0.035 m/s, inlet temperature of 20 °C, and outer temperature of 21.31 °C), Table 4.
According to Equation (27), the thermal power was not only depending on difference between the inlet and the outlet temperature, but also a function of the water mass flow rate. At a fixed value of water inlet temperature and velocity, the thermal power is related to the water mass flow rate and the outlet temperature. In this study, the water film thickness increase clearly affected the cooling of the PV unit and the heat gain. Noting that, further increase of water thickness will also affect the cost and the PV/T system heavy weight. Consequently, the PV/T system with a coupled optimum water velocity and thickness of 0.035 m/s and 7 mm provided the best cooling effect and highest electrical and thermal performances (Table 4).
The PV and PV/T performances were also depicted and compared under real weathers conditions of Iasi, Romania. A daily simulation was conducted for a typical day of summer (28 July 2016), with weather data involving solar irradiance Esun and ambient temperature Ta reported by the PVGIS data [36] as shown in Figure 7. During this day, a maximum solar irradiance about 1022 W/m2 and ambient temperature of 27.6 °C were noted at 13:00. The simulation was done supposing the inlet water temperature for PV cooling equal to the ambient one with a maximum temperature of 27.6 °C. The optimum case of PV/T system was chosen in terms of water velocity of 0.035 m/s and water film thickness of 7 mm.
Given these weather conditions, the evolution of PV and PV/T temperatures (PV/T at Tint = Ta) is illustrated in Figure 8. It can be clearly observed that both temperatures presented the same trend during this day. Moreover, the PV/T system provided a lower PV cell temperature of 33.8 °C at 13:00, due to the cooling effect compared with the conventional PV unit (61 °C). According to the negative dependence between electrical production and operating temperature of the PV cells, an effective cooling enhances electrical power. As shown in Figure 9 and Figure 10, the PV/T system provide a better electrical power and efficiency of about 313 W and 18.54% at 13:00, compared with the conventional PV panel.

4. Conclusions

This work proposes an improved dynamic numerical model for PV/T system based on the heat balance equations established for each layer and solved in MATLAB software. The main obtained outputs of the PV/T model are respectively the temperatures and the electrical and thermal power used for evaluating the advantages of using the PV/T system instead of PV conventional one.
This developed model was built regarding the other models presented in literature [37] and validated through comparison of the three layer PV model with the NOCT model and using the equations of the cooling unit, derived from a previous PV/T model validated experimentally in [24]. Consequently, results revealed good agreement. Thus, the model is considered a useful tool for other research works aiming to investigate the PV/T system and analyze its energy yield.
Thereafter, the PV/T model was used to investigate the effect of the water velocity and thickness on the cooling of the PV cells. Next, the improved PV/T model with optimum parameters values was applied in case operating conditions of Iasi, Romania, where the input variables, e.g., solar irradiance and ambient temperature, were given by PVGIS data [36]. Important conclusions of this work can be drawn as below:
-
The effectiveness of the developed PV/T model based on the three layer PV model tested at different of solar irradiance and ambient temperature was proven.
-
Inlet water temperature had a significant effect on the cooling of the PV panel. A lower PV temperature was noted when the inlet temperature was about 20 °C.
-
As the water velocity ranged from 0.010 to 0.035 m/s, the cooling process improved. A lower PV temperature was obtained for water velocity of 0.035 m/s.
-
The temperature of the PV panel decreased while increasing the water film thickness from 3 mm to 7 mm and started increasing by 10 mm.
-
Optimal cooling of the PV cells (27.7 °C) was ensured, adopting optimum values of water velocity and thickness of 0.035 m/s and 7 mm, respectively, at inlet temperature of 20 °C.
-
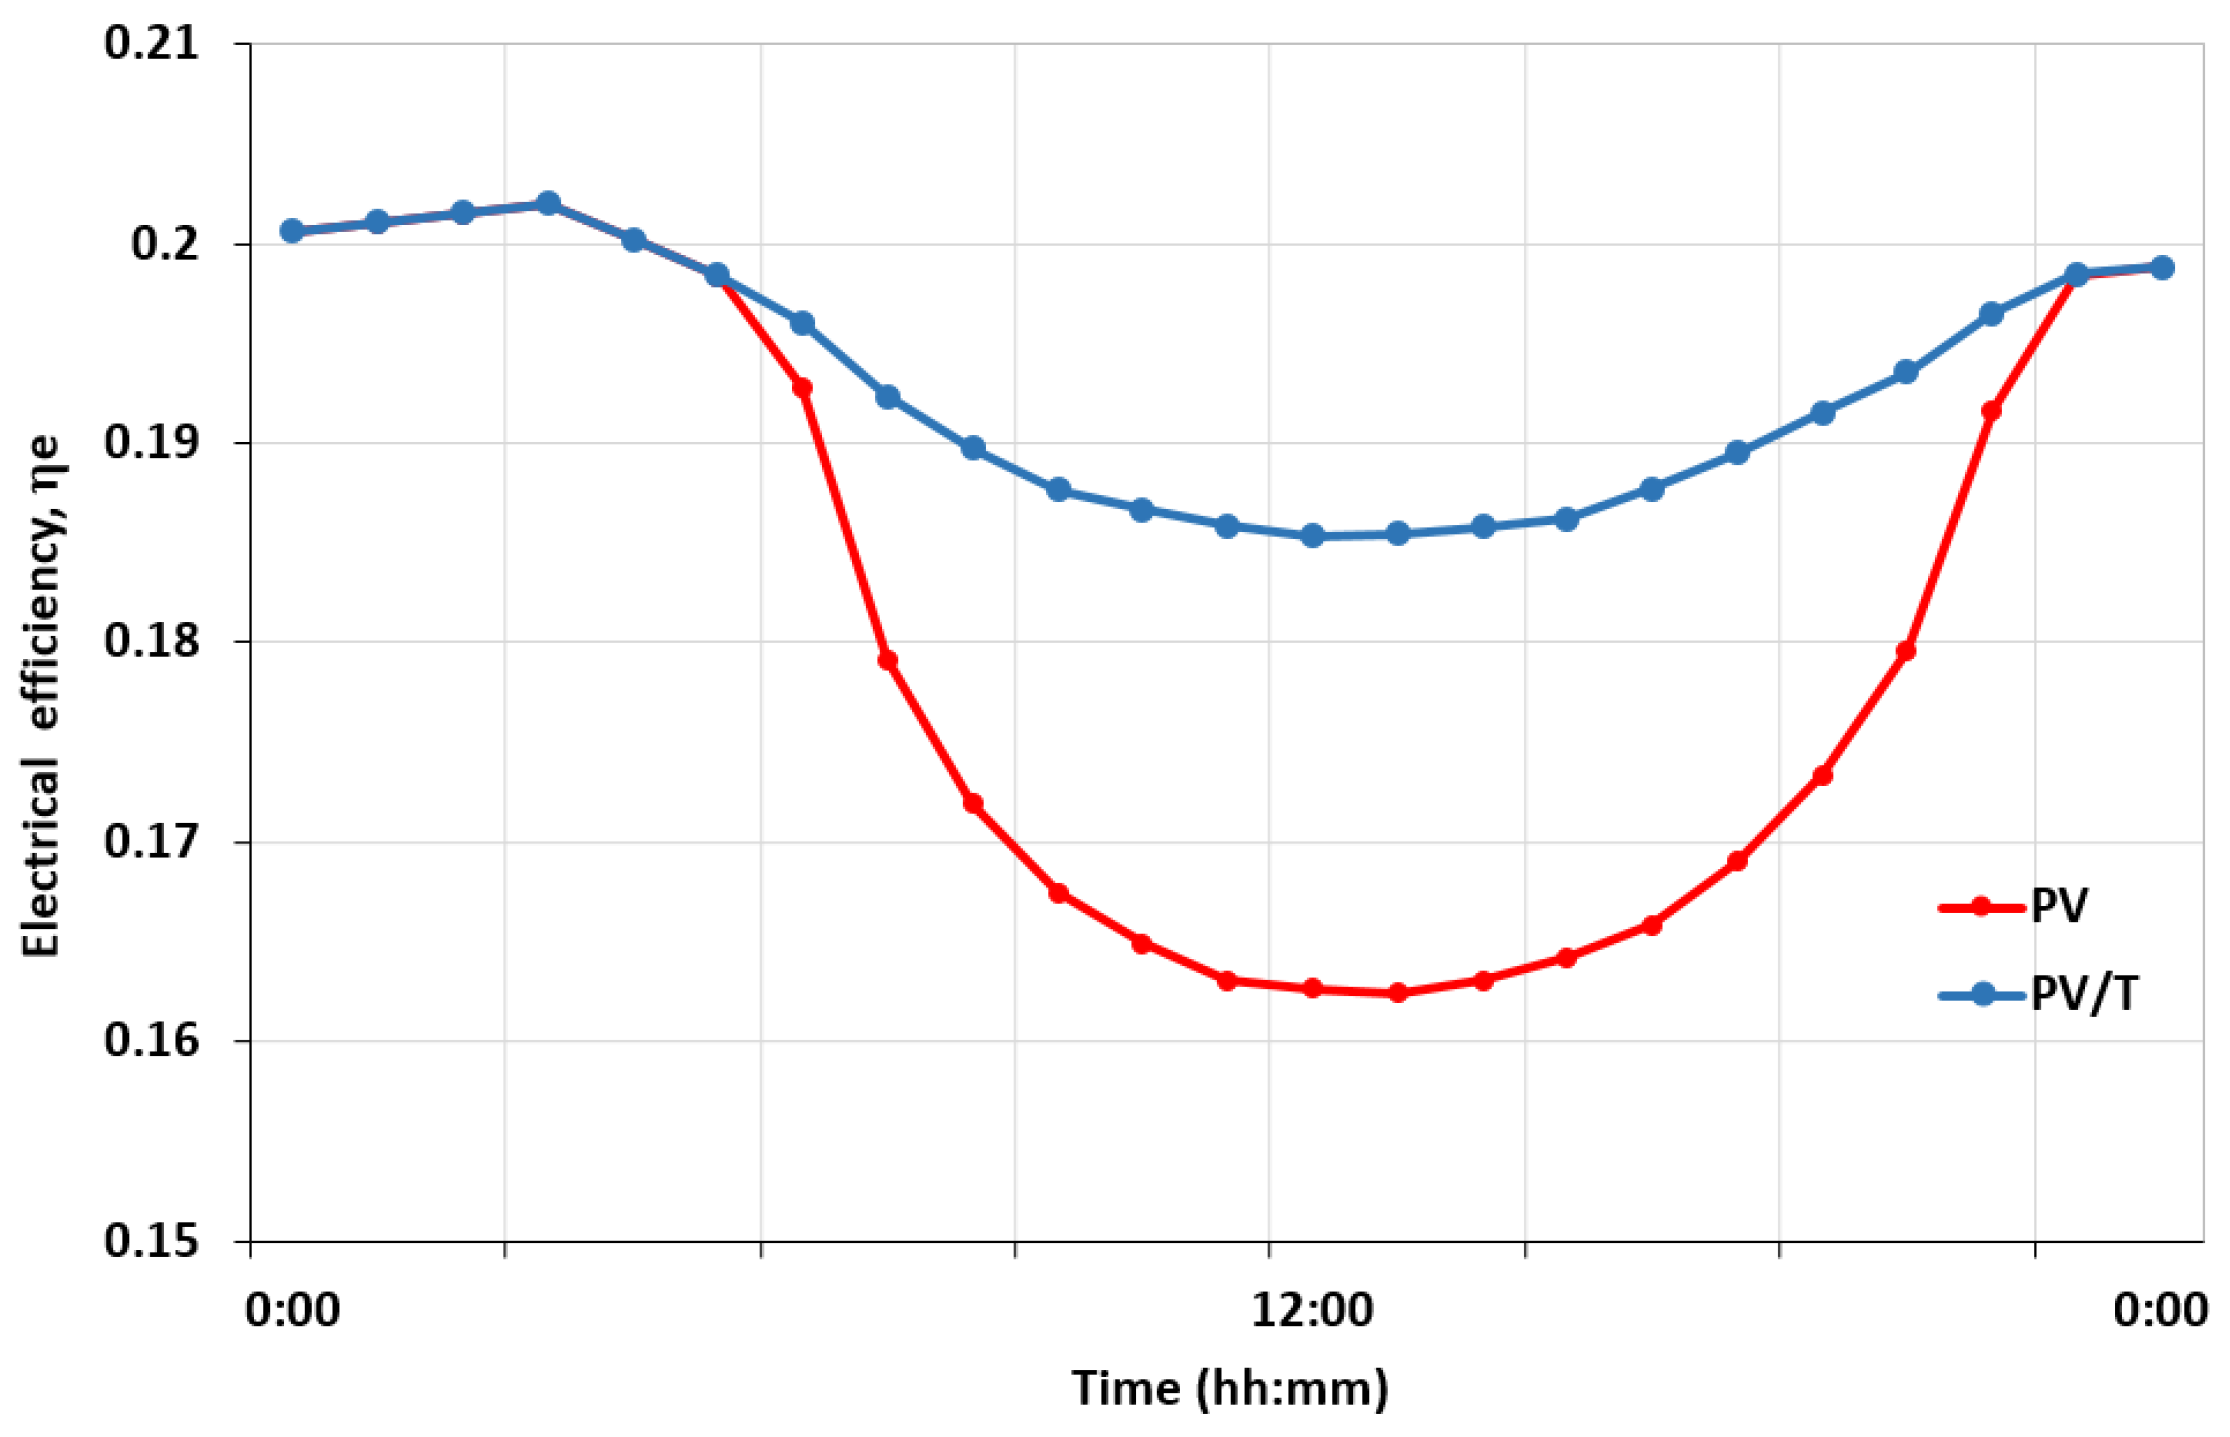
The improved PV/T model showed a better electrical performance (316.56 W) compared with the conventional PV panel (258.8 W). Furthermore, an important gain of 1334.5 W of thermal production was obtained.
Therefore, the PV/T system designing based on the optimum functional parameters can be an efficient way to produce electrical and thermal energy simultaneously where the electrical and thermal efficiency can reach 19.07% and 80.3%, respectively. Moreover, similar results found in literature [20,21] show economic advantages for implementing such systems in the same climate conditions, where the investment return can be up to 4.25 years with a 75% subsidy in the initial investment and six PV/T modules installed [38].
Future works foresee experimental programs for developing the PV/T model using a real experimental PV/T prototype that is installed on the roof of the Building Services Department, “Gheorghe Asachi” Technical University of Iași, Romania, in order to consider more climatic parameters, such as the wind speed and direction, which also affect the electrical and the thermal energy outputs of the PV/T system.

Author Contributions

Conceptualization, C.E.F., S.V.H., N.C.C. and B.H.; methodology, C.E.F. and B.H.; software, C.E.F.; validation, C.E.F., S.V.H. and E.F.Ț.; formal analysis, C.E.F., S.V.H. and M.L.C.; investigation, C.E.F., N.C.C., S.V.H., B.H., E.F.Ț. and M.L.C.; resources, N.C.C. and M.L.C.; data curation, C.E.F., N.C.C. and B.H.; writing—original draft preparation, C.E.F. and S.V.H.; writing—review and editing, C.E.F. and N.C.C.; supervision, N.C.C. and B.H.; project administration, N.C.C.; funding acquisition, N.C.C. All authors have read and agreed to the published version of the manuscript.

Funding

This paper was financed by the program Internal Grants—Publications granted by the “Gheorghe Asachi” Technical University of Iasi, Romania, project number GI/P35_Publications/2021.

Institutional Review Board Statement

Not applicable.

Informed Consent Statement

Not applicable.

Data Availability Statement

Data are contained within the article.

Acknowledgments

We would like to acknowledge the invaluable support provided by the FCI-TUIASI infrastructure in writing this article. The authors also acknowledge AUF for the support received through the postdoc scholarship for Chaimae El Fouas.

Conflicts of Interest

The authors declare no conflict of interest.

Nomenclature

AArea (m2)
CSpecific heat capacity (kJ/kg°C)
EeElectrical power (W)
EthThermal power (W)
Fj,kView factor between layer i and j
EsunSolar irradiance (W/m2)
GrGrashof number
hc,i,jConductive heat exchange coefficient between components i and j (W/m2K)
hr,j,kRadiative heat exchange coefficient between components i and j (W/m2K)
hv,i,jConvective heat transfer coefficient between components i and j (W/m2K)
IscShort circuit current (A)
ImpMaximum current (A)
LLength (m)
NOCTNominal operating cell temperature
NuNusselt number
PrPrandlt number
PmaxMaximum power (W)
PFPacking factor
RaRayleigh number
ReReynolds number
STCStandard test conditions
tTime step (s)
TiTemperature of layer i (°C)
TaAmbient temperature (°C)
VWater velocity (m/s)
VOCOpen circuit voltage(V)
VmpMaximum voltage (V)
wWind speed (m/s)
Greek symbols
αAbsorptivity
βReference temperature coefficient for efficiency
ηeElectrical efficiency (%)
ηthThermal efficiency (%)
λThermal conductivity (W/m K)
ρMaterial density (kg/m3)
σStefan–Boltzmann constant
Scripts
AbsAbsorber
fFluid
gGlass
grGround
PVPhotovoltaic
PV/TPhotovoltaic/thermal
TedTedlar

References

  1. Markvart, T. Solar Electricity, 2nd ed.; John Wiley & Sons: Chichester, UK, 2000. [Google Scholar]
  2. Chandrasekar, M.; Rajkumar, S.; Valavan, D. A review on the thermal regulation techniques for non integrated flat PV modules mounted on building top. Energy Build. 2015, 86, 692–697. [Google Scholar] [CrossRef]
  3. Makki, A.; Omer, S.; Sabir, H. Advancements in hybrid photovoltaic systems for enhanced solar cells performance. Renew. Sustain. Energy Rev. 2015, 41, 658–684. [Google Scholar] [CrossRef]
  4. Elminshawy, N.A.S.; Mohamed, A.M.I.; Morad, K.; Elhenawy, Y.; Alrobaian, A.A. Performance of PV panel coupled with geothermal air cooling system subjected to hot climatic. Appl. Therm. Eng. 2019, 148, 1–9. [Google Scholar] [CrossRef]
  5. Hudisteanu, S.V.; Turcanu, F.E.; Chereches, N.C.; Popovici, C.G.; Verdes, M.; Huditeanu, I. Enhancement of PV Panel Power Production by Passive Cooling Using Heat Sinks with Perforated Fins. Appl. Sci. 2021, 11, 11323. [Google Scholar] [CrossRef]
  6. Hudisteanu, S.V.; Popovici, C.G.; Mateescu, T.D.; Chereches, N.C. Efficiency analysis of BIPV systems for different locations in Romania. In Sustainable Solutions for Energy and Environment, Proceedings of the EENVIRO, Bucharest, Romania, 26–28 October 2016; Elsevier: Amsterdam, The Netherlands, 2017; Volume 112, pp. 404–411. [Google Scholar]
  7. Siecker, J.; Kusakana, K.; Numbi, B.P. Optimal switching control of PV/T systems with energy storage using forced water circulation: Case of South Africa. J. Energy Storage 2018, 20, 264–278. [Google Scholar] [CrossRef]
  8. Nizetic, S.; Coko, D.; Yadav, A.; Grubisic-Cabo, F. Water spray cooling technique applied on a photovoltaic panel: The performance response. Energy Convers. Manag. 2016, 108, 287–296. [Google Scholar] [CrossRef]
  9. Hudisteanu, V.S.; Chereches, N.C.; Verdes, M.; Ciocan, V.; Popovici, C.G.; Turcanu, F.E.; Balan, M.C. Analysis of an innovative water-cooling solution for photovoltaic-thermal systems IOP Conference Series: Earth and Environmental Science. IOP Sci. 2021, 664, 1–10. [Google Scholar] [CrossRef]
  10. Hudișteanu, S.V.; Cherecheş, N.C.; Popovici, C.G.; Verdeș, M.; Ciocan, V.; Balan, M.C.; Țurcanu, F.E.; Scurtu, I.C. Effect of cooling on power generated by photovoltaic panels IOP Conference Series: Materials Science and Engineering. IOP Sci. 2021, 1141, 1–12. [Google Scholar] [CrossRef]
  11. Rostami, Z.; Rahimi, M.; Azimi, N. Using high-frequency ultrasound waves and nanofluid for increasing the efficiency and cooling performance of a PV module. Energy Convers. Manag. 2018, 160, 141–149. [Google Scholar] [CrossRef]
  12. Senthil, R.; Elavarasan, R.M.; Pugazhendhi, R.; Premkumar, M.; Vengadesan, E.; Navakrishnan, S.; Islam, M.R.; Natarajan, S.K. A holistic review on the integration of heat pipes in solar thermal and photovoltaic systems. Sol. Energy 2021, 227, 577–605. [Google Scholar] [CrossRef]
  13. Chandel, S.S.; Agarwal, T. Review of cooling techniques using phase change materials for enhancing efficiency of photovoltaic power systems. Renew. Sustain. Energy Rev. 2017, 73, 1342–1351. [Google Scholar] [CrossRef]
  14. Hamzat, A.K.; Sahin, A.Z.; Omisanya, M.I.; Alhems, L.M. Advances in PV and PVT cooling technologies: A review. Sustain. Energy Technol. Assess. 2021, 47, 1–31. [Google Scholar] [CrossRef]
  15. Bhakre, S.S.; Sawarkar, P.D.; Kalamkar, V.R. Performance evaluation of PV panel surfaces exposed to hydraulic cooling-A review. Sol. Energy 2021, 224, 1193–1209. [Google Scholar] [CrossRef]
  16. Maleki, A.; Haghighi, A.; Assad, M.E.; Mahariq, I.; Nazari, M.A. A review on the approaches employed for cooling PV cells. Sol. Energy 2020, 209, 170–185. [Google Scholar] [CrossRef]
  17. Verma, S.; Mohapatra, S.; Chowdhury, S.; Dwivedi, G. Cooling techniques of the PV module: A review. Mater. Today-Proc. 2021, 38, 253–258. [Google Scholar] [CrossRef]
  18. Reddy, S.R.; Ebadian, M.A.; Lin, C.X. A review of PV-T systems: Thermal management and efficiency with single phase cooling. Int. J. Heat Mass Transf. 2015, 91, 861–871. [Google Scholar] [CrossRef]
  19. Gomaa, M.R.; Hammad, W.; Al-Dhaifallah, M.; Rezk, H. Performance enhancement of grid-tied PV system through proposed design cooling techniques: An experimental study and comparative analysis. Sol. Energy 2020, 211, 1110–1127. [Google Scholar] [CrossRef]
  20. Nahar, A.; Hasanuzzaman, M.; Rahim, N.A. Numerical and experimental investigation on the performance of a photovoltaic thermal collector with parallel plate flow channel under different operating conditions in Malaysia. Sol. Energy 2017, 144, 517–528. [Google Scholar] [CrossRef]
  21. Kazemian, A.; Parcheforosh, A.; Salari, A.; Ma, T. Optimization of a novel photovoltaic thermal module in series with a solar collector using Taguchi based grey relational analysis. Sol. Energy 2021, 215, 492–507. [Google Scholar] [CrossRef]
  22. Boumaaraf, B.; Boumaaraf, H.; Slimani, M.E.A.; Tchoketch-Kebir, S.; Ait-cheikh, M.S.; Touafek, K. Performance evaluation of a locally modified PV module to a PV/T solar collector under climatic conditions of semi-arid region. Math. Comput. Simul. 2020, 167, 135–154. [Google Scholar] [CrossRef]
  23. Nahar, A.; Hasanuzzaman, M.; Rahim, N.A.; Parvin, S. Numerical investigation on the effect of different parameters in enhancing heat transfer performance of photovoltaic thermal systems. Renew. Energy 2019, 132, 284–295. [Google Scholar] [CrossRef]
  24. El Fouas, C.; Hajji, B.; Gagliano, A.; Tina, G.M.; Aneli, S. Numerical model and experimental validation of the electrical and thermal performances of photovoltaic/thermal plant. Energy Convers. Manag. 2020, 220. [Google Scholar] [CrossRef]
  25. Barbu, M.; Siroux, M.; Darie, G. Numerical model and parametric analysis of a liquid based hybrid photovoltaic thermal (PVT) collector. Energy Rep. 2021. [Google Scholar] [CrossRef]
  26. Rejeb, O.; Dhaou, H.; Jemni, A. A numerical investigation of a photovoltaic thermal (PV/T) collector. Renew. Energy 2015, 77, 43–50. [Google Scholar] [CrossRef]
  27. El Fouas, C.; El Manssouri, O.; Hajji, B.; Bouselham, L.; Marco Tina, G.; Gagliano, A. Modeling of Dust Deposition Impact on PV/T Hybrid Collector Performances. In Proceedings of the 7th International Renewable and Sustainable Energy Conference (IRSEC), Agadir, Morocco, 27–30 November 2019; pp. 1–6. [Google Scholar] [CrossRef]
  28. Bejan, A.; Kraus, A.D. Heat Transfer Handbook; John Wiley & Sons: Hoboken, NJ, USA, 2003. [Google Scholar]
  29. Incropera, F.P.; DeWitt, D.P. Fundamentals of Heat and Mass Transfer; John Wiley & Sons: Hoboken, NJ, USA, 2002. [Google Scholar]
  30. El Hocine, H.B.; Touafek, K.; Kerrour, F.; Haloui, H.; Khelifa, A. Model Validation of an Empirical Photovoltaic Thermal (PV/T) Collector. Energy Procedia 2015, 74, 1090–1099. [Google Scholar] [CrossRef] [Green Version]
  31. Kudish, A.I.; Evseev, E.G.; Walter, G.; Leukefeld, T. Simulation study of a solar collector with a selectively coated polymeric double walled absorber plate. Energy Convers. Manag. 2002, 43, 651–671. [Google Scholar] [CrossRef]
  32. Rabl, A. Active Solar Collectors and their Applications; Oxford University Press: New York, NY, USA, 1985; p. 503. [Google Scholar]
  33. Kazemian, A.; Salari, A.; Hakkaki-Fard, A.; Ma, T. Numerical investigation and parametric analysis of a photovoltaic thermal system integrated with phase change material. Appl. Energy 2019, 238, 734–746. [Google Scholar] [CrossRef]
  34. Kazemian, A.; Salari, A.; Ma, T. A year-round study of a photovoltaic thermal system integrated with phase change material in Shanghai using transient model. Energy Convers. Manag. 2020, 210. [Google Scholar] [CrossRef]
  35. Salari, A.; Taheri, A.; Farzanehnia, A.; Passandideh-fard, M.; Sardarabadi, M. An updated review of the performance of nanofluid-based photovoltaic thermal systems from energy, exergy, economic, and environmental (4E) approaches. J. Clean. Prod. 2021, 282. [Google Scholar] [CrossRef]
  36. EU SCIENCE HUB. Available online: https://ec.europa.eu/jrc/en/pvgis (accessed on 15 November 2021).
  37. El Fouas, C.; Hajji, M.; Bouselham, L.; Hajji, B.; El Mehdi, A.; Bouali, H. Analysis and Design of an Energy System Based on PV/T Water Collector for Building Application. In Proceedings of the 2017 International Renewable and Sustainable Energy Conference (IRSEC), Agadir, Morocco, 4–7 December 2017; pp. 1–5. [Google Scholar] [CrossRef]
  38. Aguilar-Jimenez, J.A.; Hernandez-Callejo, L.; Alonso-Gomez, V.; Velazquez, N.; Lopez-Zavala, R.; Acuna, A.; Mariano-Hernandez, D. Techno-economic analysis of hybrid PV/T systems under different climate scenarios and energy tariffs. Sol. Energy 2020, 212, 191–202. [Google Scholar] [CrossRef]
Figure 2. Flow chart of the PV/T numerical modeling.
Applsci 12 00646 g002
Figure 3. Comparison of the developed PV model and NOCT model.
Applsci 12 00646 g003
Figure 4. Effect of water velocity on the cooling of the PV cells for different thicknesses: (a) δ = 3 mm, (b) δ = 5 mm, (c) δ = 7 mm, (d) δ = 10 mm.
Applsci 12 00646 g004
Figure 5. Effect of water thickness on the cooling of the PV cells for different velocities: (a) V = 0.01 m/s, (b) V = 0.015 m/s, (c) V = 0.02 m/s, (d) V = 0.025 m/s, (e) V = 0.03 m/s, (f) V = 0.035 m/s.
Applsci 12 00646 g005
Figure 6. Effect of water thickness on fluid transfer coefficient and thermal power for different inlet temperatures: (a,b) Tint = 20 °C; (c,d) Tint = 25 °C; (e,f) Tint = 30 °C; (g,h) Tint = 35 °C.
Applsci 12 00646 g006
Figure 7. Variation of solar irradiance and ambient temperature (28 July 2016).
Applsci 12 00646 g007
Figure 8. Comparison of PV and PV/T temperatures.
Applsci 12 00646 g008
Figure 9. Comparison of PV and PV/T electrical power.
Applsci 12 00646 g009
Figure 10. Comparison of PV and PV/T electrical efficiency.
Applsci 12 00646 g010
Table 3. Governing equations for the PV/T solid layers.
LayersEquations
Glass ( ρ g δ g C g ) d T g dt = α g E s u n + h r g , s k y ( T s k y T g ) + h r g , g r ( T g r T g ) + h v g , a ( T a T g ) + h c P V , g P F ( T P V T g ) + + h c T e d , g ( 1 P F ) ( T T e d T g ) (15)
PV cells P F ( ρ PV δ PV C PV ) d T P V dt = [ ( τ g α PV η e )   E s u n + h c P V , g ( T g T P V ) + h c T e d , P V ( T T e d T P V ) ] P F (16)
Tedlar ( ρ Ted δ Ted C Ted ) d T T e d dt = ( 1 P F ) τ g α Ted + ( 1 P F ) h c T e d , g ( T g T T e d ) + P F · h c T e d , P V ( T P V T T e d ) + h c a b s 1 , T e d ( T a b s 1 T T e d ) (17)
Absorber 1 ( ρ abs   δ abs   C abs ) d T a b s 1 d t = h c a b s 1 , T e d ( T T e d T a b s h ) + h r a b s 1 , a b s 2 ( T a b s l T a b s h ) + h c f , a b s 1 ( T f T a b s h ) (18)
Absorber 2 ( ρ abs δ abs C abs ) d T a b s 2 dt = h c a b s 2 , f ( T f T a b s 2 ) + h r a b s 1 , a b s 2 ( T a b s 2 T a b s 1 ) + h r a b s 2 , s k y ( T s k y T a b s 2 ) + h r a b s 2 , g r ( T g r T a b s 2 ) + h v a , a b s l ( T a T a b s 2 ) (19)
Table 4. Comparison of PV and PV/T performances at Esun = 1000 W/m2, Ta = 35 °C, and Tint = 20 °C.
TPV (°C)Tout(°C)Ee (W)Eth (W)
ŋ e   ( % )
ŋ th   ( % )
PV67.7-258.8-15.60-
PV/T27.721.31316.561334.519.0780.3
Publisher’s Note: MDPI stays neutral with regard to jurisdictional claims in published maps and institutional affiliations.

