Article

Effect of Lead Ion Contamination on the Microstructure of Guilin Red Clay

1
College of Civil and Architectural Engineering, Guilin University of Technology, Guilin 541004, China
2
Guangxi Key Laboratory of Geomechanics and Geotechnical Engineering, Guilin 541004, China
*
Author to whom correspondence should be addressed.
Appl. Sci. 2022, 12(19), 9888; https://doi.org/10.3390/app12199888
Submission received: 28 August 2022 / Revised: 20 September 2022 / Accepted: 26 September 2022 / Published: 1 October 2022
(This article belongs to the Special Issue Mechanical Properties and Engineering Applications of Special Soils)

Abstract

:
The heavy metal contamination of red clay in Guilin is a serious problem. Lead ions pollute red clay and have a series of effects, which affect the macroscopic properties of red clay. However, fundamentally, the effects occur because the internal microstructure of red clay is eroded by Pb2+, which results in the change in the macroscopic properties of red clay. Therefore, we adopted a mercury injection experiment and used electronic microscope Pb2+ to explore the microscopic mechanism through which red clay is internally influenced. From the mercury injection experiment, we found that an increase in the concentration of Pb2+ increased soil pore diameter and volume, and that a higher heavy metal content of Pb2+ had a greater effect on red clay cementation. Using scanning electron microscopy, we found that when the micro-image magnification was 500 and 20,000 times, the inside of the red clay pore increased with the increase in the concentration of Pb2+, showing that the heavy metal within the microstructure damaged the red clay. The above two experiments showed that heavy metal ions increase the intergranular fractures of red clay, and the thickness of the double layer reduces, which results in the weakening of the interaction force between particles.

1. Introduction

Red clay has a high porosity ratio, water content, and liquid limit; at the same time, it has high strength and low bearing capacity for the compressibility of special clay. It is mainly distributed in two broad areas in Guangzhou, Guangxi Zhuang Autonomous Region, Guizhou, Yunnan, and other places. Its unique engineering properties have also attracted wide attention from experts, scholars, and researchers. In 2012, Lv used X-ray diffraction, total chemical element analysis, and other methods to analyze the minerals of local red clay in Guilin, and research results showed that kaolinite, trilbite, and quartz were the main mineral components of red clay [1]. In 2015, Dong Wei explored the effect of different dispersants on the particle size analysis test results of red clay and found the unique aggregate cementation structure produced by the joint attraction of particles and free iron oxide [2].
The Guangxi Zhuang Autonomous Region is known as the “hometown of nonferrous metals”, with rich nonferrous metal resources, such as lead, zinc, antimony, mercury, silver, and other heavy metals. However, due to unadvanced mining technology and improper personnel management, the environment inside and outside the mines are polluted; the soil is especially polluted with heavy metal ions. For example, Wang Yinghui investigated the waste soil of the Saiding lead–zinc mine in Guangxi and found that the lead content in the soil was high [3]. Li Jincheng conducted an investigation on the Daxin zinc mining area in Guangxi, and the results showed that the contents of heavy metals in the waste area significantly changed, and the main pollution factor, in addition to Zn, was Pb [4]. Chen Xuejun added lignin to red clay in 2021, which improved the particle structure of soil [5]. In 2020, Li Jiaming found that the influence of heavy metals on the mineral composition of red clay changed, which reduced the viscosity of red clay and damaged the structure of red clay particles [6].
In 1983, Tan Luorong made a developmental summary of the previous soil microstructure [7]. In 1994, Liao Yiling and Yu Peihou reported the intergranular bonding and van der Waals forces of red clay and constructed a generalization model of the microstructure of red clay [8]. Zhou Xunhua found in 2004 that the microstructure change in red clay was caused by the change in the cementation of free iron oxide [9]. In 2014, Lu Haijun’s SEM results showed that heavy metal Pb2+ promoted the increase in soil pores, and the pore size also increased with the increase in pollution concentration [10]. Jiang’s research in 2015 showed that under the influence of lead ions, the cohesion degree of clay minerals in the soil and the thickness of the double electric layer significantly changed, thus changing the microstructure of the soil [11]. Zhang Tingting’s mercury injection test in 2016 showed that the pore structure of soil polluted by nonferrous heavy metals was reduced, the agglomeration of soil particles was obvious, the soil bond strength was improved, and the aggregation of soil particles was increased [12]. According to the mercury injection test results, Lv Haibo in 2020 compared the pore size distribution curves of soil samples and found that the partial pores with constant pore size represented the internal pores of the aggregates [13]. Jin Pan, in 2020, obtained the pore distribution through mercury injection experiments, indicating that dry density has a good water retention behavior for red clay within a wide suction range [14].
To explore the effects of heavy metal pollution on the microstructure of the red clay in guilin, we studied lead ion pollution, for example, under different lead ion concentrations and action times, prepared lead ions in indoor artificial pollution, reshaped guilin red clay, and performed electron microscope tests. The results of the mercury injection experiment showed that lead ion pollution reshapes the influence of the microscopic mechanism of guilin red clay.

2. Experimental Method

The source of the red clay was Yanshan District, Guilin City; its physical properties are shown in Table 1.
The specimens for this test were prepared in accordance with the Geotechnical Test Procedure (GB/T50123--1999). The soil samples were air-dried and milled through a 2 mm sieve to keep the soil in reserve. The indoor test simulated the heavy metal lead ion contaminated red clay soil, and the concentration of lead ion contaminated soil was taken as 0%, 0.1%, 0.5%, and 1.0%, which we mixed into the red clay soil by spraying. The moisture content was measured after 24 h of sealing with sufficient mixing and controlled at 30 ± 1%. The reaction time of the solution with the soil was 5 days. After the mercury injection test, the sample was cut into small soil strips about 2 cm3 in size. Before the test, the small soil strips were cut into 1 cm3 soil blocks. In this process, the fresh section of the sample had to be kept from being worn. A conductive glue was affixed to the surface of the metal base of the sample, and then a small soil block was fixed on the conductive glue with tweezers, keeping the fresh section upward. Then, the sample was evacuated, and a layer of gold film was plated on the surface of the sample with a gold spray instrument to prevent the image from being unclear when the charge was accumulated and discharged.
Mercury injection test using the POREMASTER 33GT automatic mercury injection meter from the United States of America produced by Konta Instruments. The POREMASTER 33GT instrument’s measured pressure was in the range of 140 KPa~231 MPa. This type of instrument was used to determine the pore diameter range of 0.007 μm~1000 μm. The sample was prepared using the Geotechnical Test Procedures (GB/T50123--1999), adding Pb2+ to the sample at a passivation time of 5 days. The experiment was set for a total of 4 groups, each group consisting of 2 parallel experimental specimens for a total of 8 test specimens. The 8 specimens were vacuum-saturated, and the central soil body was extracted; the size of the long strip was 1 × 1 × 2 cm. The specimens were then cooled by liquid nitrogen for 1 h, dried for 24 h, and taken out for mercury compression.
The SEM test equipment used in this study was an S-4800-type field emission scanning electron microscope jointly produced by Oxford Company and Japanese High-tech Company. Its basic parameters were as follows: the maximum accelerating voltage was 30 kV, the maximum magnification was up to 800,000 times, and the resolution was extremely high. The line resolution and point resolution were 0.14 nm and 0.19 nm, respectively. Four soil samples were available in total. This test involved magnifications of 500×, 5000×, and 20,000×.

3. Experimental Results and Analysis

3.1. Mercury Pressure Test and Analysis of Results

The basic principle of the mercury pressure test involves assuming a cylindrical pore of radius r. Mercury is pressed into the pore by pressure, and when equilibrium is reached, the pressure P · πr2 acting in the direction normal to the mercury contact ring cross-section is equivalently reversed with the component 2πr2 · cosα of the tension on the same cross-section normal to that surface, i.e., we have:
P π r 2 = 2 π R 2 α cos α
The above equation yields:
p = 2 σ cos α r
where p is the required pressure; r is the pore radius; σ is the surface tension coefficient of mercury; α is the infiltration angle of mercury on the material.
The mercury pressure test is one of the most commonly used methods for conducting tests, such as for studying soil microstructure. The mercury intake versus pore distribution curve and cumulative mercury intake curve can be obtained, and microstructure pore distribution can be visualized through images. Because of metallic mercury’s inability to enter closed pores, part of the fine pores can be easily overlooked. The results of the mercury pressure test on red clay contaminated with different concentrations of Pb2+ in soil samples contaminated for five days are plotted in Figure 1 and Figure 2.
As can be seen in Figure 1a, the pore distribution of the red clay soil that was not contaminated with Pb2+ consisted of two peaks: the first peak area occurred at 0.01 μm~0.1 μm, and the second peak area occurred at 4 μm~20 μm. The pores in the 0.01 μm~0.1 μm region did not considerably change as the Pb2+ concentration in the soil rose, whereas the pores in the 4 μm~20 μm region dramatically changed as the Pb concentration in the soil rose. The magnified image in the range of 0.1 μm to 100 μm is a cut-off of Figure 1b from Figure 1a. The number of pores within the range of 0.2 μm~4 μm decreased as the heavy metal (Pb2+) concentration inside the red clay grew, whereas the number of pores within the range of 4 μm~20 μm accordingly increased. This demonstrated that the heavy metal Pb2+ had a significant impact on the microstructure of the red clay, and that the complex physical and chemical properties of red clay cause the cementation of the soil to be eroded between the particles, and increased agglomeration and particle clusters, resulting in a smaller and gradually disappearing cementation structure between the particles. Therefore, the original small pores gradually enlarged into larger pores, and there was a significant increase in pores in the region of 4~20 μm, which also indicated that the microstructure was limited by the influence of heavy metal ions, and heavy metal ions were incapable of eroding the finer pore structure.
Figure 2 depicts the relationship between the pore size of red clay and the accumulated mercury input volume for various concentrations of Pb2+, which was mercury pressed into a long strip of the soil sample with external pressure. The accumulated mercury input volume corresponds to the unit horizontal coordinate in the figure, which is expressed as the incremental magnitude. With the increase of mercury injection pressure, the content of metal mercury in soil increases, which is consistent with this phenomenon. As shown in the figure, the initial stage occurred when the pore space (100~1000 μm) was large, and the volume of mercury in the soil contaminated with different concentrations of heavy metals was the same; during the rising stage, the increase in pressure in the pore space distribution range of 0.01~100 μm as accompanied by a large amount of mercury leaching into the red clay contaminated by Pb2+. In the stable stage, the level of mercury pressure gradually reached its maximum and tended to stabilize. The metallic mercury injected into the red clay contaminated with various concentrations of heavy metals eventually stabilized and approached the nanoscale pores (range < 0.01 μm). Additionally, due to the increase in heavy metal (Pb2+) concentration in the red clay, the accumulated mercury input in the red clay that was not contaminated with Pb2+ was less than that in the red clay contaminated with Pb2+. This finding coincides with that depicted in Figure 1, where the pore space decdreased in the range of 0.2–4 μm and grew in the range of 4–20 μm. We confirmed that various concentrations of the heavy metal Pb2+ cause different internal pore damage in Guilin red clay. The principle is that Pb2+ erodes a portion of the cemented material within the red clay, causing the original small pores to enlarge. The result is an increase in the total pore volume of the soil.

3.2. Scanning Electron Microscopy Test and Analysis of Results

Secanning lectron microscopy (SEM) uses a fine beam of electron probe, irradiates the surface of a sample, and accepts the reflected secondary electrons, which are transformed through a series of processing into a picture of the microstructure of the sample. It is a common method used for studying microstructure, and the SEM process is much easier to perform due to the ease of the sample preparation. SEM has a higher resolution and has been widely used in major disciplines. For the mercury pressure test, we used the same specimens, and liquid nitrogen was used to freeze-dry the test soil. Samples were directly taken around the mercury pressure soil samples. The more flat and uniform small pieces of soil were used for the electron microscope scanning test. The sample is illustrated in Figure 3.
Figure 3 depicts the microstructure map of Pb2+-contaminated soil under the action of different concentrations for 5 days using electron microscopy, when the soil was magnified to 500 times. Soil is a complex three-phase soil (solid–liquid–gas); the solids in the soil are different; the size of different substances and their different nature result in the conductivity of the soil also varying, so it was necessary to spray high-conductivity substances on the soil. The surface of the soil contained some potholes and inequalities. These factors affected the final imaging effect of the microscopic result map. As seen in Figure 3, the corresponding black areas were produced in the corners of the image, which were also caused by the aforementioned factors. Even though it was not possible to binarize the image of the electron microscope at 500 times magnification, in general, the phenomenon of fissures in Guilin red clay increased with the increase in heavy metal Pb2+ concentration when the image was magnified to 500 times, which was caused by the erosion of the cementing material in the soil caused by the entry of Pb2+ into the interior of the soil. This is consistent with the results of the previous mercury pressure test described in Equation (1). When the soil sample was magnified 20,000 times with an electron microscope, it resulted in the original and binarized processed images depicted in Figure 4.
Figure 4 shows that when the electron microscope was magnified 20,000 times, the concentration of lead increased, the pores on the clay surface gradually developed and arranged in a point-to-point manner, and the soil particles were loosely arranged. The unit presented in the figure is at the particle level, which represents the spacing between clay particles and the tightness of the arrangement. The microstructure of the remodeled red clay soil was relatively complex. Because the main mineral components of Guilin red clay are kaolinite, trilbite, goethite, and quartz, the bulk, strip, and scale shapes could be seen in the electron microscope scanning. Using MATLAB to select different gray levels of the original image in Figure 4a,c,e,g, binarization processing for the image Figure 4b,d,f,h, and two functions Figure 4b,d,f,h, we concluded that the porosity was the black and white pixels in the binary images. The number calculated according to the proportion of its porosity is shown in Table 2.
As seen in Table 2, with the increase in heavy metal ion concentration, the binary porosity data of Guilin remolded red clay at 20,000 times magnification obtained by SEM represented the spacing relationship between the clay minerals. According to the theory of electric double layers, the electric double layer is formed by a fixed layer and a diffusion layer [15]. When heavy metals enter the soil, the chemical composition of the soil internally changes, the ionic balance is broken, the negative charge on the surface of the soil particles of heavy metal cations increases, the negative charge on the surface of the soil particles of heavy metal cations increases,, and the thickness of the electric double layer diffusion is affected. and the thickness of the electric double layer diffusion is affected. The attraction between soil particles weakens; that is, the distance between clay minerals increases with the increase in heavy metal ion concentration, proving that Guilin red clay is reshaped when heavy metal ions enter it. Due to the internal changes, the original ion balance inside the body of the soil breaks, decreasing the particle zeta potential. The thickness of the electric double layer diffusion and the attraction between soil particles decreased, and the distance between the soil particles increased. The result is similar to the role of lubrication under the same effect of normal stress. The friction between the particles weakened.
(1)
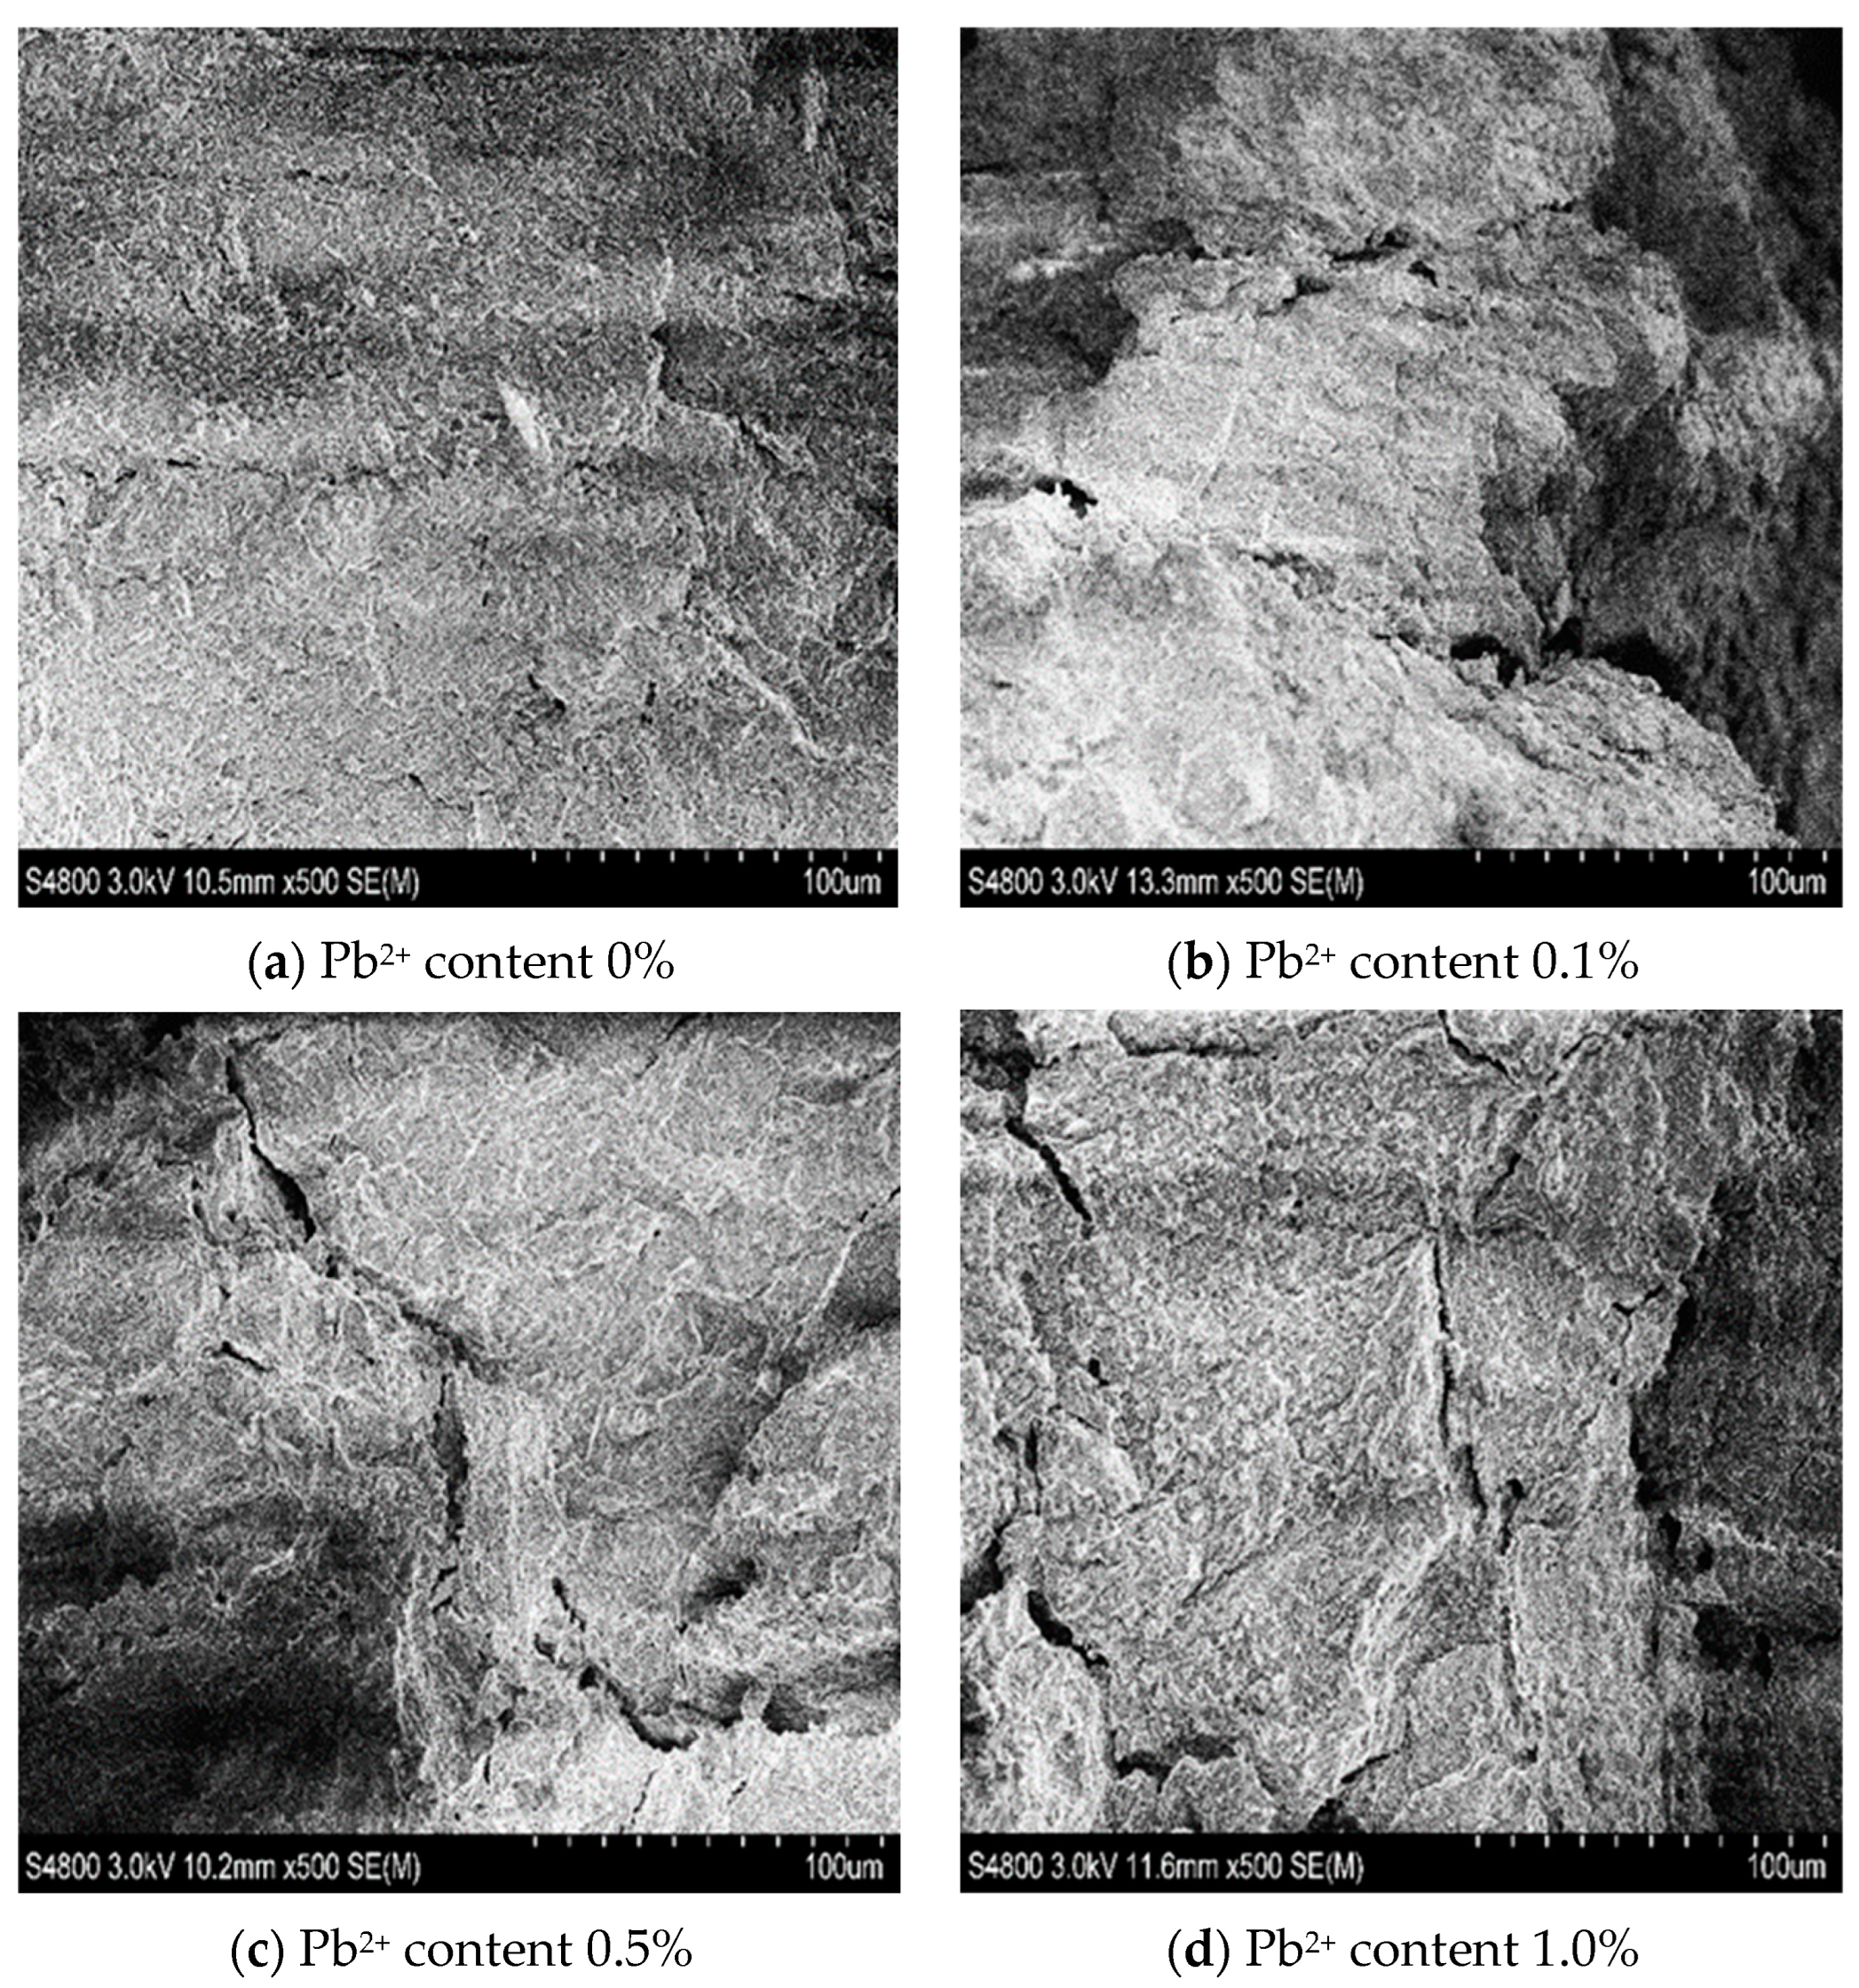
The results of the mercury pressure test indicated that the heavy metal (Pb2+) has a significant effect on destroying the microstructure of the soil. In addition, as the concentration of Pb2+ increases, the pore space continuously expands, and the small pore space gradually becomes large pore space, thereby increasing the volume of the soil unit. The smaller the pore structure, the weaker the erosion effect.
(2)
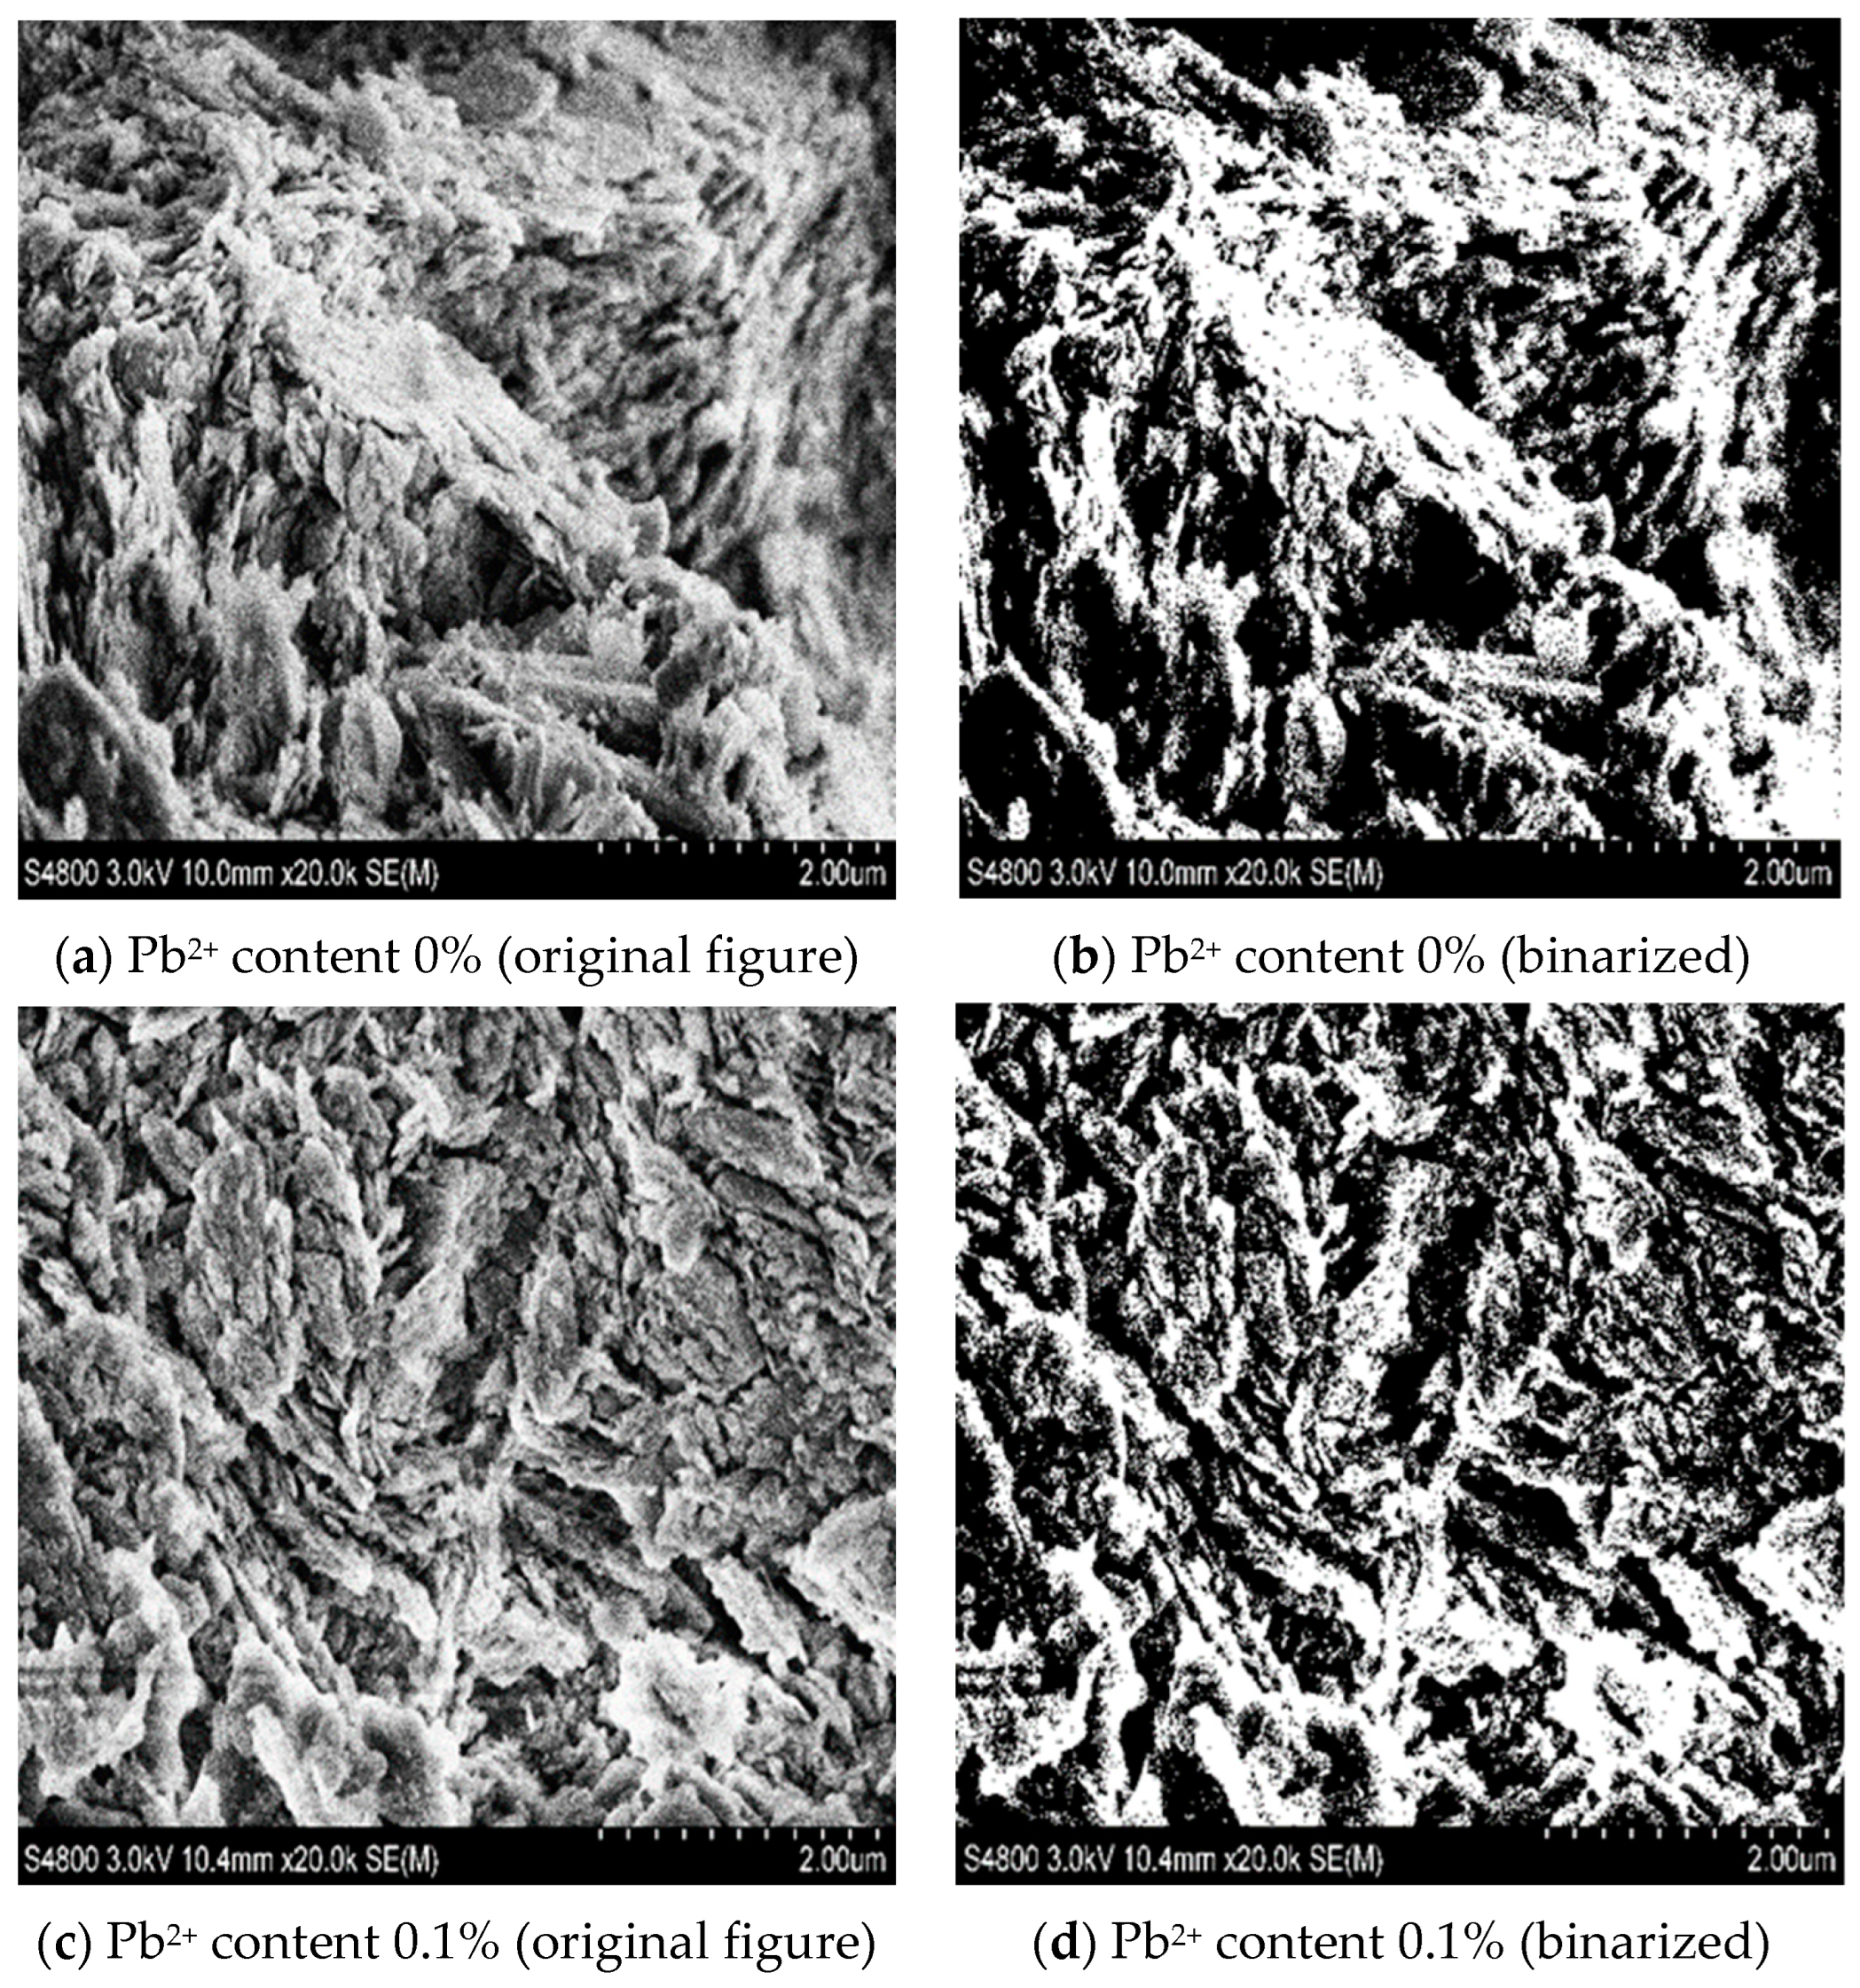
The results of the electron microscope scanning test further illustrated the results of the mercury piezoelectric test. Under the influence of Pb2+, an increase in the concentration of Pb2+ reduces the thickness of the red clay’s double electric layer, and the interparticle interaction force likewise becomes weaker as a result, producing a similar lubricating effect.
(3)
The results of the above two preceding experiments indicate that the microscopic mechanism of Pb2+ contaminated Guilin red clay is as follows: on the one hand, when the heavy metal ions enter the soil body, the soil body generates fissures, which increases the pore volume and causes the structure to loosen; on the other hand, the thickness of the double electric layer on the surface of the soil particles decreases, which weakens the particle-particle interaction. In conclusion, the macroscopic mechanical properties of the Pb2+ contaminated Guilin red clay are affected by two aspects.

Author Contributions

Y.S., S.D. (Shuaishuai Dong), S.D. (Song Ding), Y.G., Y.H. and H.L. conceived the presented ideas and elaborated the method. Y.S., S.D. (Shuaishuai Dong) and Y.H. wrote the manuscript. S.D. (Shuaishuai Dong), S.D. (Song Ding) and Y.G. implemented the methods and performed the experiments. Y.H. and H.L. supervised the research. All authors have read and agreed to the published version of the manuscript.

Funding

1. Guangxi Innovation-Driven Development Special Project “Research and Development and Experimental Demonstration of Key Technologies for the Synergistic Development of Water Resources Utilization and Water Ecological Industry in Typical Karst Wetlands of Lijiang River Basin” (Guik AA20161004-1). 2. National Key Research and Development Program Project “Research and Development and Experimental Demonstration of Key Technologies of Water Resources Regulation in Karst Wetland of Lijiang River Basin” (2019YFC0507502). 3. National Natural Science Foundation of China “Study on Collapse Mechanism of Karst Soil and water coupling in Guilin under extreme Climate Conditions” (41967037).

Institutional Review Board Statement

Not applicable.

Informed Consent Statement

Not applicable.

Data Availability Statement

Not applicable.

Acknowledgments

All individuals have agreed to confirm.

Conflicts of Interest

The authors declare no conflict of interest.

References

  1. Haibo, L.V.; Zhaotian, Z.E.; Guoqiang, Y.I.; Yanlin, Z.H. Analysis of mineral composition of Guangxi red clay. J. Eng. Geol. 2012, 20, 651–656. [Google Scholar]
  2. Dong, W.; Wang, B.; Yao, Y.; Tian, P. Effect of different dispersants on the analytical test of red clay particles. Sci. Technol. Eng. 2015, 19, 165–168+187. [Google Scholar]
  3. Wang, Y.; Chen, X.; Zhao, Y.; Qi, S. Characteristics of heavy metal contamination and dominant plant accumulation in soils of lead and zinc mining areas. Zinc mining areas. J. China Univ. Min. Technol. 2007, 36, 487–493. [Google Scholar]
  4. Li, J.; Yin, R.; Luo, Y.; Lu, Y.; Zhang, L. Evaluation of soil heavy metal pollution in the Daxin manganese mining area of Guangxi. Environ. Sci. Technol. 2010, 33, 183–190. [Google Scholar]
  5. Chen, X.; Ding, X.; Song, Y. Effects of lignin on physical and mechanical properties of red clay. Sci. Technol. Eng. 2021, 21, 5922–5928. [Google Scholar]
  6. Li, J.; Chen, X.; Huang, X.; Xu, K. Mechanical properties and microstructure test of zinc-contaminated red clay. J. Henan Univ. Sci. Technol. 2020, 41, 99–104. [Google Scholar]
  7. Tan, L. Overview and development of research on microstructure of soils. Geotech. Mech. 1983, 1, 73–86. [Google Scholar]
  8. Liao, Y.; Yu, P. Microstructure of red clay and its probabilistic model. J. Eng. Geol. 1994, 1, 27–37. [Google Scholar]
  9. Zhou, X.; Liao, Y. Colloidal chemical characteristics of structural linkages between red clay particles. J. Guizhou Univ. Technol. 2004, 1, 26–29. [Google Scholar]
  10. Lu, H.; Liao, Z.; Wang, Q.; Zhao, Y.; Chen, W. Microstructure and deformation strength properties of lead-contaminated clay. J. Rock Mech. Eng. 2014, 33 (Suppl. S2), 4252–4257. [Google Scholar]
  11. Jiang, S.L.; Qiang, X.; Ping, W. Effect of lead (II) on the mechanical behavior and microstructure development of a Chinese clay. Appl. Clay Sci. 2015, 105–106, 92–199. [Google Scholar]
  12. Zhang, T.; Li, J.; Wang, P.; Huang, X.; Xue, Q. Experimental study on the mechanical properties and microscopic mechanism of lead-contaminated soil cured by magnesium phosphate cement. Geotechnics 2016, 37 (Suppl. S2), 279–286. [Google Scholar] [CrossRef]
  13. Lv, H.; Xue, X.; Jiang, Y.; Yin, G.; Zeng, Z. Microstructure analysis of Liuzhou red clay based on mercury injection test and nitrogen adsorption test. Sci. Technol. Eng. 2020, 20, 14619–14624. [Google Scholar]
  14. Jin, P.; Zhen, W.; Chen, B.; Sun, D.A.; Gao, Y.; Xiong, Y. Effect of microstructure on water retention behavior of lateritic clay over a wide suction range. Geomech. Eng. 2021, 25, 417–428. [Google Scholar]
  15. Song, Y.; Wang, J.Q.; Chen, X.J.; Yu, S.Z.; Ban, R.L.; Yang, X.; Zhang, X.; Han, Y. Study the effects of dry-wet cycles and cadmium pollution on the mechanical properties and microstructure of red clay. Environ. Pollut. 2022, 302, 119037. [Google Scholar] [CrossRef] [PubMed]
Figure 1. Pore distribution of Guilin red clay under the effect of different Pb2concentrations. (b) is an enlarged view of the 0.1–100 μm segment in (a).
Applsci 12 09888 g001
Figure 2. Pore size–cumulative mercury input relationship curve of Guilin red clay under the effect of different concentrations of heavy metal ions.
Applsci 12 09888 g002
Figure 3. Microstructure of soil after 5 days of Pb2+ contaminations at different concentrations (500×).
Applsci 12 09888 g003
Figure 4. Microstructure of soil after 5 days of contamination with different concentrations of lead ions (20,000×).
Applsci 12 09888 g004aApplsci 12 09888 g004b
Table 1. Basic physical properties of red clay.
Natural Moisture
Content (%)
Soil Particle
Relative Density
Liquid Limit (%)Plastic Limit
(%)
Maximum Dry
Densityg·cm−3
Optimum Moisture Content (%)
27.32.6962471.5530
Table 2. Porosity of Pb2+-contaminated Guilin red clay.
Heavy Metal Pollution
Concentration
0%0.1%0.5%1.0%
Porosity56.82%59.62%62.97%63.73%
Publisher’s Note: MDPI stays neutral with regard to jurisdictional claims in published maps and institutional affiliations.

