Article

Detection of Pits by Conjugate Lines: An Algorithm for Segmentation of Overlapping and Adhesion Targets in DE-XRT Sorting Images of Coal and Gangue

School of Mechanical Engineering, Anhui University of Science and Technology, Huainan 232001, China
*
Author to whom correspondence should be addressed.
Appl. Sci. 2022, 12(19), 9850; https://doi.org/10.3390/app12199850
Submission received: 25 August 2022 / Revised: 18 September 2022 / Accepted: 27 September 2022 / Published: 30 September 2022
(This article belongs to the Topic Applications in Image Analysis and Pattern Recognition)

Abstract

:
In lump coal and gangue separation based on photoelectric technology, the prerequisite of using a dual-energy X-ray to locate and identify coal and gangue is to obtain the independent target area. However, with the increase in the input of the sorting system, the actual collected images had adhesion and overlapping targets. This paper proposes a pit point detection and segmentation algorithm to solve the problem of overlapping and adhesion targets. The adhesion forms are divided into open and closed-loop adhesion (OLA and CLA). Then, an open- and closed-loop crossing algorithm (OLCA and CLCA) is proposed. We used the conjugate lines to detect the pit and judge the position and distance of the pixel point relative to the conjugate lines. Then, we set the constraint of the distance of the pixel point and the relatively straight line position to complete the pit detection. Finally, the minimum distance search method was used to obtain the dividing line corresponding to the pit to complete the image segmentation. The experiment results demonstrate that the segmentation accuracy of the overlapping target was 90.73%, and the acceptable segmentation accuracy was 94.15%.

1. Introduction

Coal mined underground is frequently accompanied by many gangues, which need sorting [1,2,3]. Using dual-energy X-ray transmission (DE-XRT) technology to remove gangue from coal can improve coal quality and reduce environmental pollution [4]. DE-XRT photoelectric equipment for lump coal separation can manage this issue while consuming no water resources and producing no pollution, which is highly efficient and energy saving [5]. Photoelectric equipment can measure and position coal and gangue through image segmentation and other technologies [6]. However, the premise is that the images of coal and gangue must be independent targets; otherwise, the algorithm will make wrong decisions and obtain inaccurate position information [7]. The overlapping probability of coal and gangue will significantly increase with the increase in treatment capacity.
The image segmentation algorithms for adhesion and overlapped targets contain watershed algorithms (WA) [8,9,10] and pit detection and matching algorithms [11,12,13,14]. Before the WA divides the target, it is necessary to mark the seed points in advance [15]. The standard methods for finding seed points consist of the distance transformation method [16,17] and limit corrosion [18,19]. The marking results of seed points directly affect the segmentation results, and the difficulty of marking seed points is highly improved for targets with irregular shapes such as coal and gangue. Wrong marked seed points will cause over-segmentation and under-segmentation and impact the accuracy of the ridgeline [20]. To weaken the over-segmentation caused by WA, some researchers employed machine learning methods such as nearest neighbor and BP neural network [13,21,22,23] to merge the over-segmented regions. In this way, the algorithm will become very complicated, and the time cost sharply increases. Wang et al. [23] proposed the use of the VGG net network model to extract the image features of coal dust particles and segment the conglutinated particles by up-sampling on un-pooling. This method requires many learning samples in the early stage and takes much time. Compared with the WA, the pit detection and matching algorithm are more controllable. The segmentation of adhesion targets can be well completed by improving the accuracy of pits through algorithm design and combining with the principle of matching pits [24]. However, the pit detection accuracy and matching principle are difficult to meet the requirements of multi-scale, multi-target, and multi-adhesion segmentation of coal and gangue images.
Lin et al. [25] and Zhang et al. [26] adopted a chain code coding algorithm to calculate the change in the edge curvature of the adhesion target and set the curvature threshold to select the pit. Sun et al. [11] and Bai et al. [27] segmented overlapping targets by obtaining concave defects [28] of overlapping targets and then connecting the minimum distance between concave defects. Zhang et al. [29], Gao et al. [30], and Tan et al. [13] traversed the non-zero-pixel area of the peripheral square area (n × n) or circular area (r = l) of the binary edge pixels of the adhesion target. They set the area threshold to select the pit. By calculating and judging the included angle between the binary edge pixels of the adhesion target and its front point and back point, Wu [31] set the angle threshold to select the pit. Because there are different degrees of concave areas in the circumferential direction of irregular-shaped coal and gangue, the above method uses a simple threshold to filter and select pit points. Eventually, the number of pits detected is inaccurate. He et al. [32] used a single straight line to detect pits. This pit detection method is still subject to the influence of the adhesion form; for example, in the case where a single concave defect has multiple pits, a straight line will not detect all of the pits. In the prior art, the detection rate of pits is low. Affected by the irregular shape of coal and gangue, the compatibility decreases. Generally, too many or too few pits are detected.
For this reason, to solve the problem of segmentation and location of overlapping images of coal and gangue with multi-scale, multi-objective, and various adhesion forms, this paper proposes an algorithm for detecting pit points and segmenting images by conjugate lines. Moreover, the adhesion forms are divided into closed-loop and open-loop adhesions (CLA and OLA), and the discrimination method of adhesion forms is provided. Furthermore, concave defects are divided into concave defects at convex hull edge and concave defects at non-convex hull edge, while open- and closed-loop pit detection algorithms are designed. This algorithm judges the pit with the set constraint by detecting the position relationship and distance of the pixel point relative to conjugate lines. It can accurately detect all pits. Finally, the minimum distance search method is adopted to acquire the dividing line corresponding to the pits to complete the image segmentation.
The primary objectives and contributions of this paper are as follows:
(1)
This paper defines the adhesion form of the coal and gangue image target and provides the judgment method. Concave defects are classified according to different adhesion forms, and a pit point detection algorithm is designed for the concave defects.
(2)
It is proposed for the first time that conjugate lines be used to detect the pit point of the concave defect. The overlapping and adhesion target segmentation problem is solved with the minimum distance search method. It lays a foundation for further identification and positioning of coal and gangue.
(3)
The algorithm’s applicability is verified through experiments, and the algorithm’s limitations are analyzed.

2. Materials and Methods

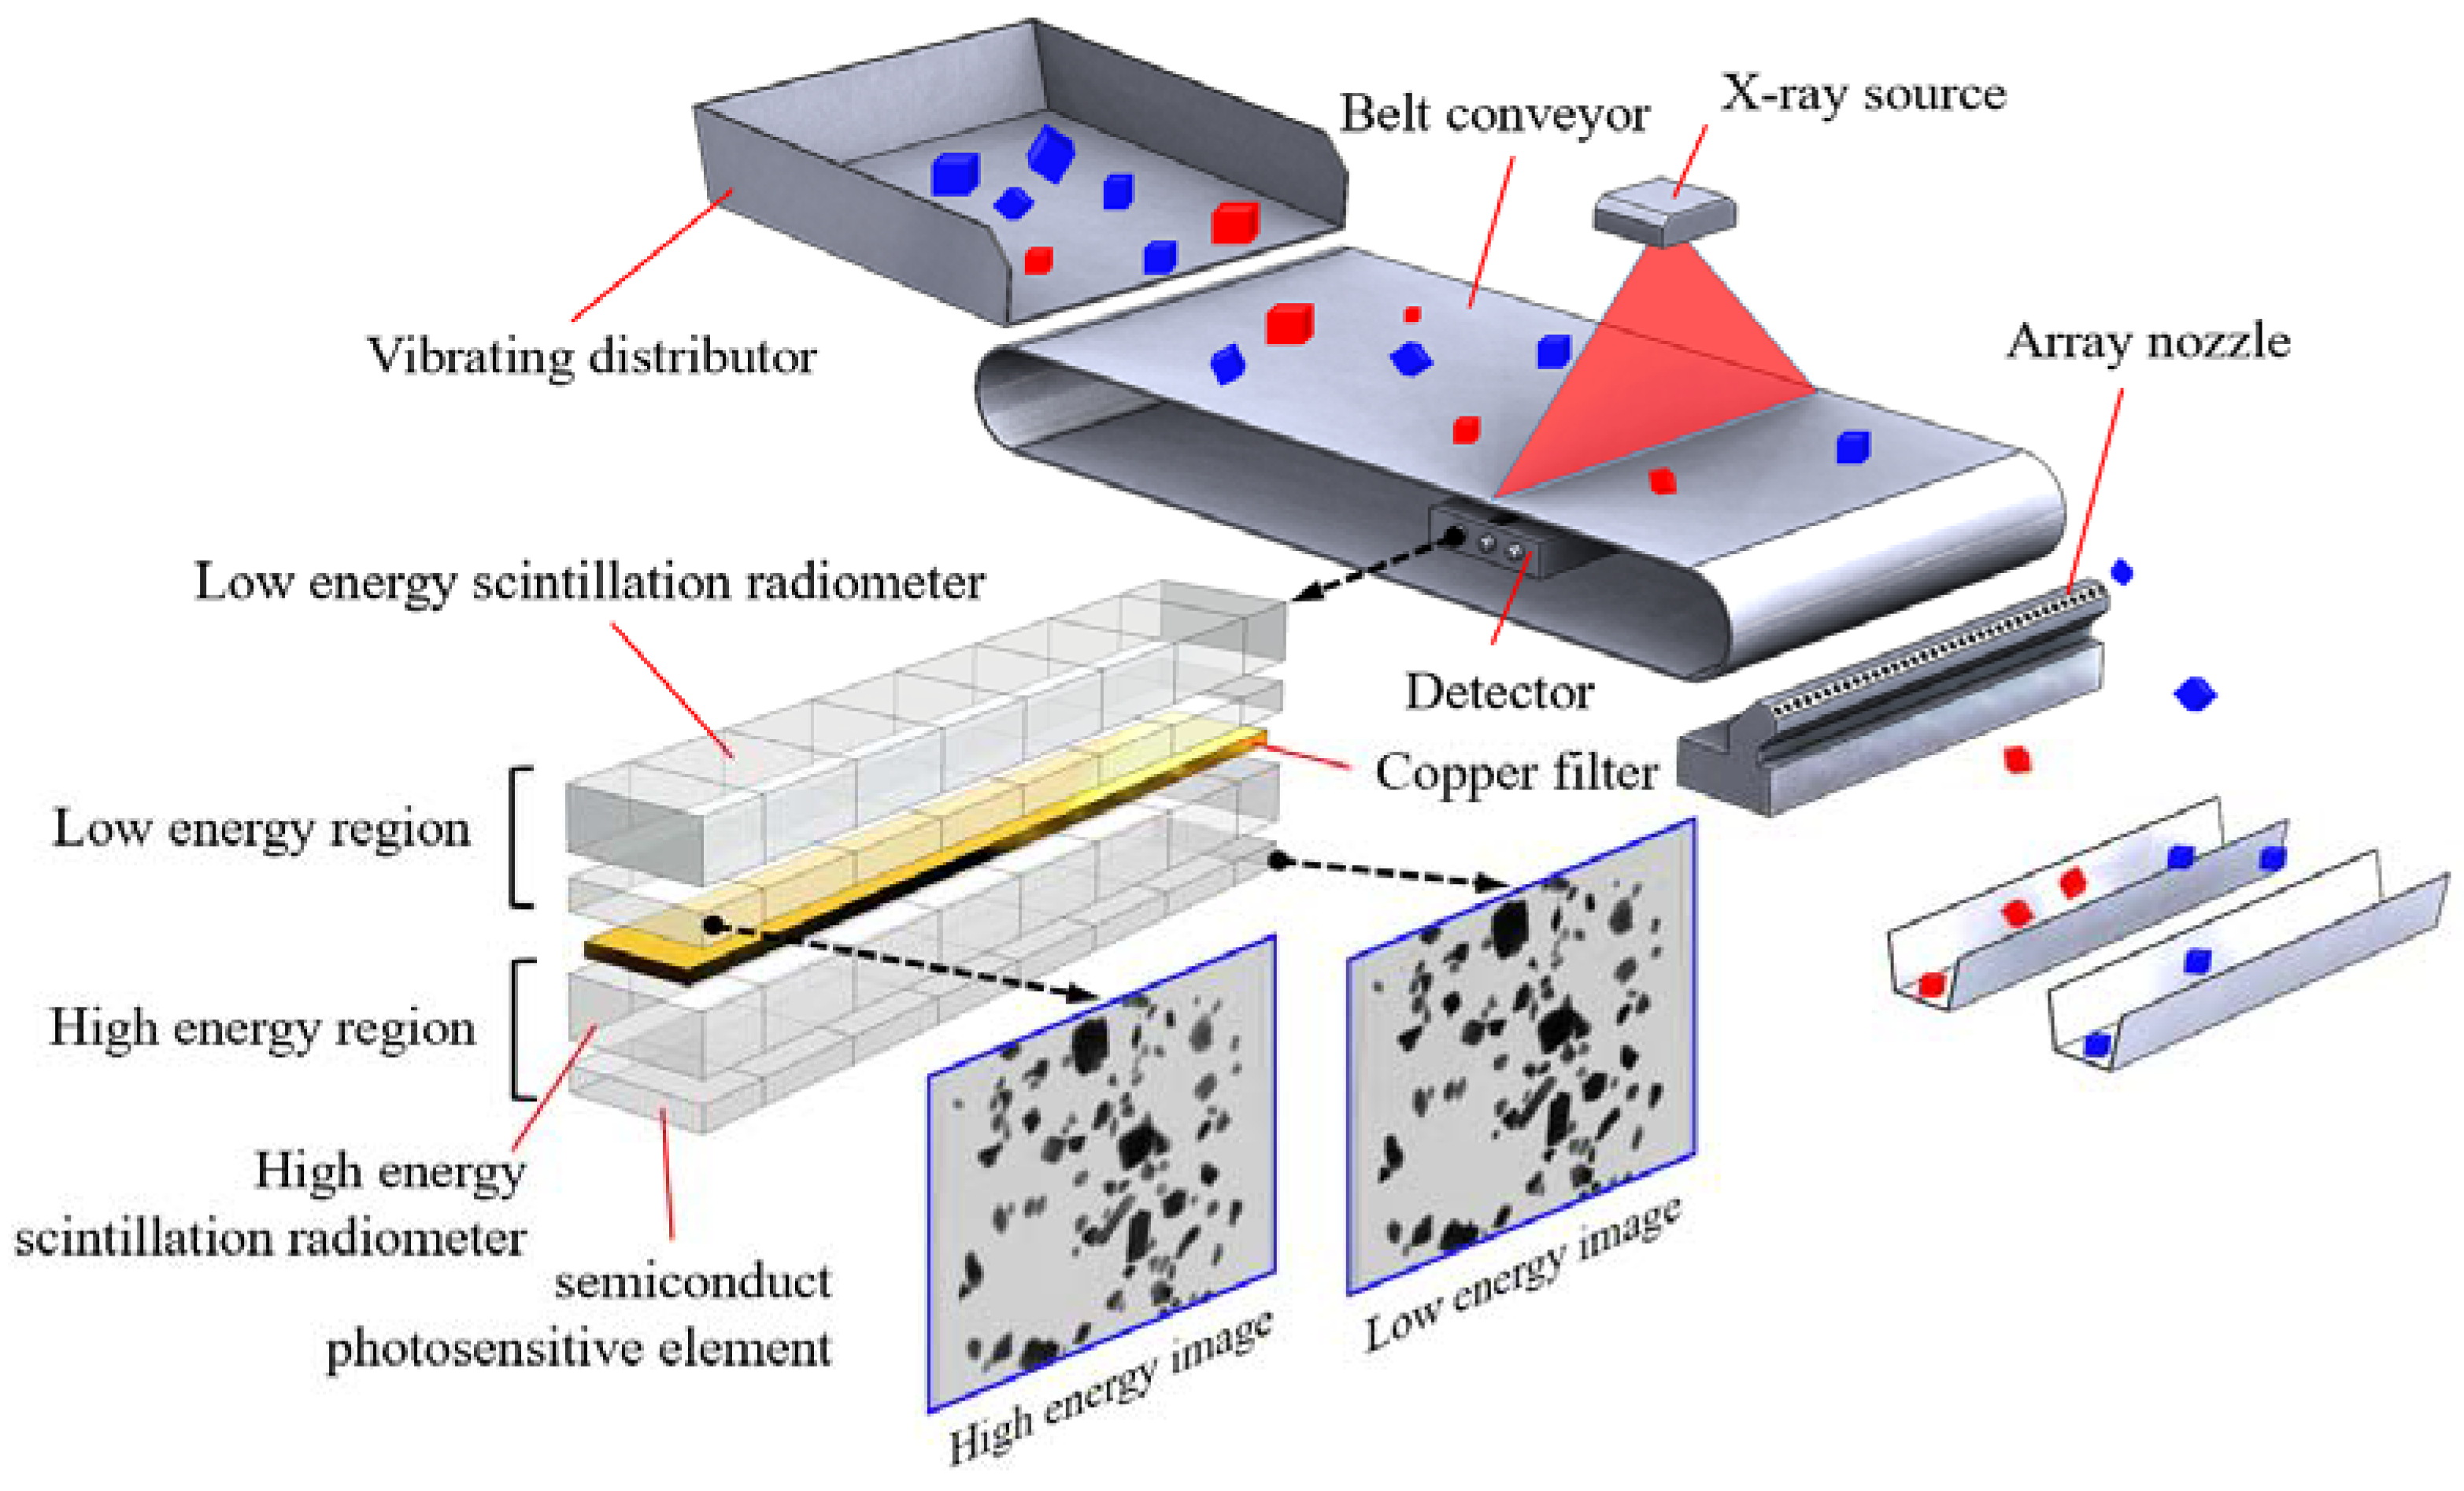
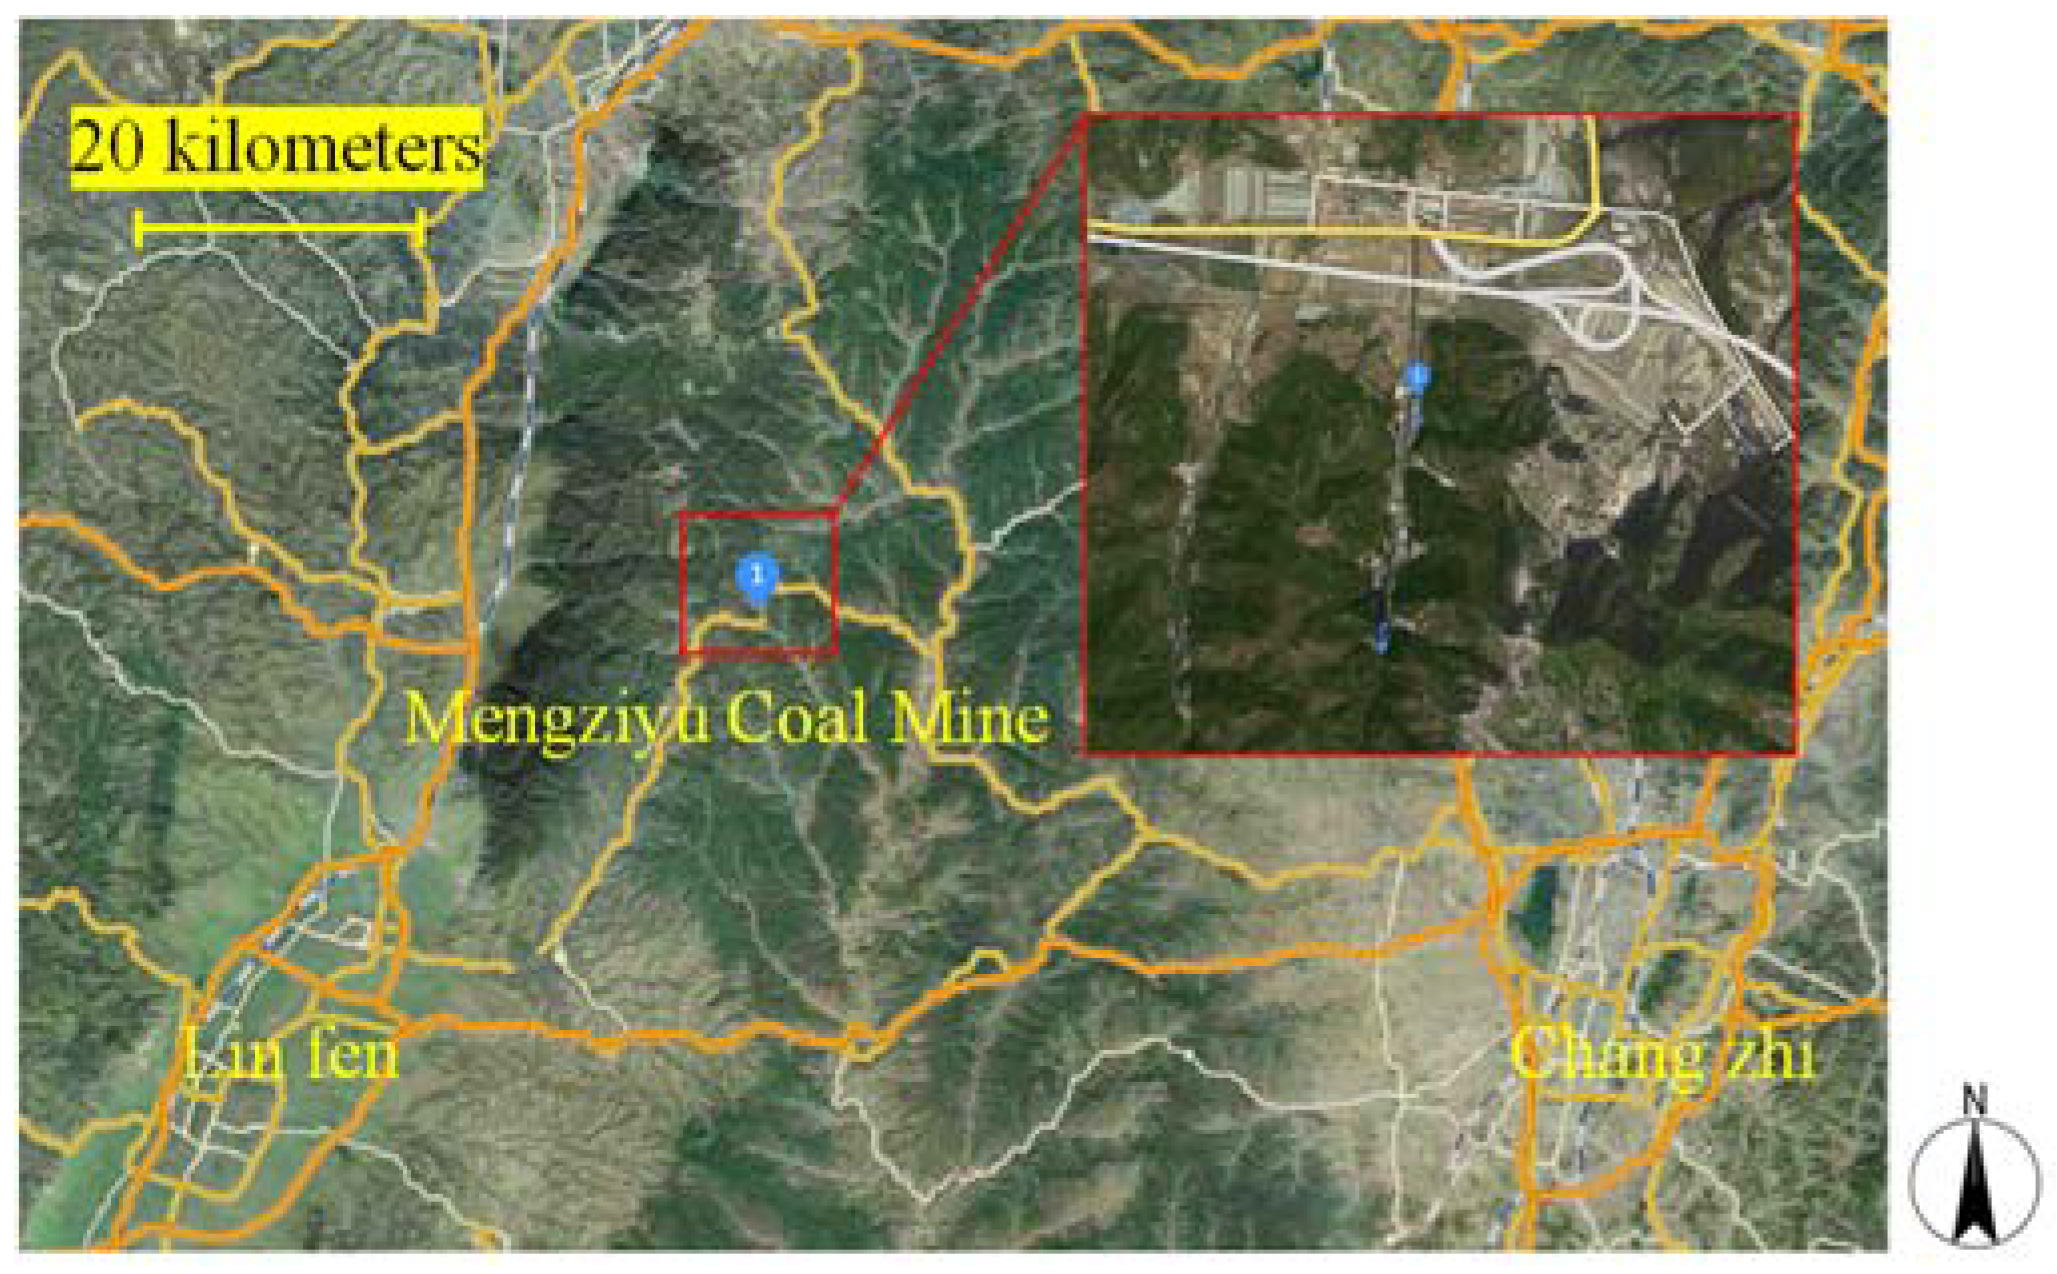
2.1. Experimental Platform and Materials

As illustrated in Figure 1, the vibrating distributor evenly arranges the materials and sends them to the belt conveyor. The belt conveyor transports the materials to the lower part of the X-ray for transmission imaging. The running speed of the belt conveyor is 3.0 m/s, the power supply voltage of the vibrating distributor is 380 V, the frequency conversion frequency is 50 Hz, and the vibration amplitude is 5 mm.
The DE-XRT detection system consists of an X-ray source and two groups of detectors, wherein the two groups of detectors separately detect the high-energy and low-energy parts of the X-ray. The low-energy part is in front, the high-energy part is in the rear, and the middle group of cop filters is used for filtering out the low-energy part of the X-ray. After the X-ray beam transmits through the object, the low-energy part of the attenuated ray is firstly detected and imaged by the low energy. Then, the ray passes through the copper filter so that the low-energy signal is filtered out, and the remaining high-energy X-rays are detected and imaged by the high energy.
Figure 1 illustrates that the image data of Mengziyu Coal Mine in a real-time operation state is collected, and the particle size distribution of the material is 5~500 mm. There are many aggregate areas, namely, target adhesion areas. As shown in Figure 2, Mengziyu Coal Mine mainly produces coking coal with complex geological conditions located in Changzhi City, Shanxi Province, and the northern mountainous area of Linfen City. In 2021, Mengziyu Coal Mine introduced the DE-XRT separation system, which was used to pre-remove gangue from raw coal.

2.2. Image Processing Methods

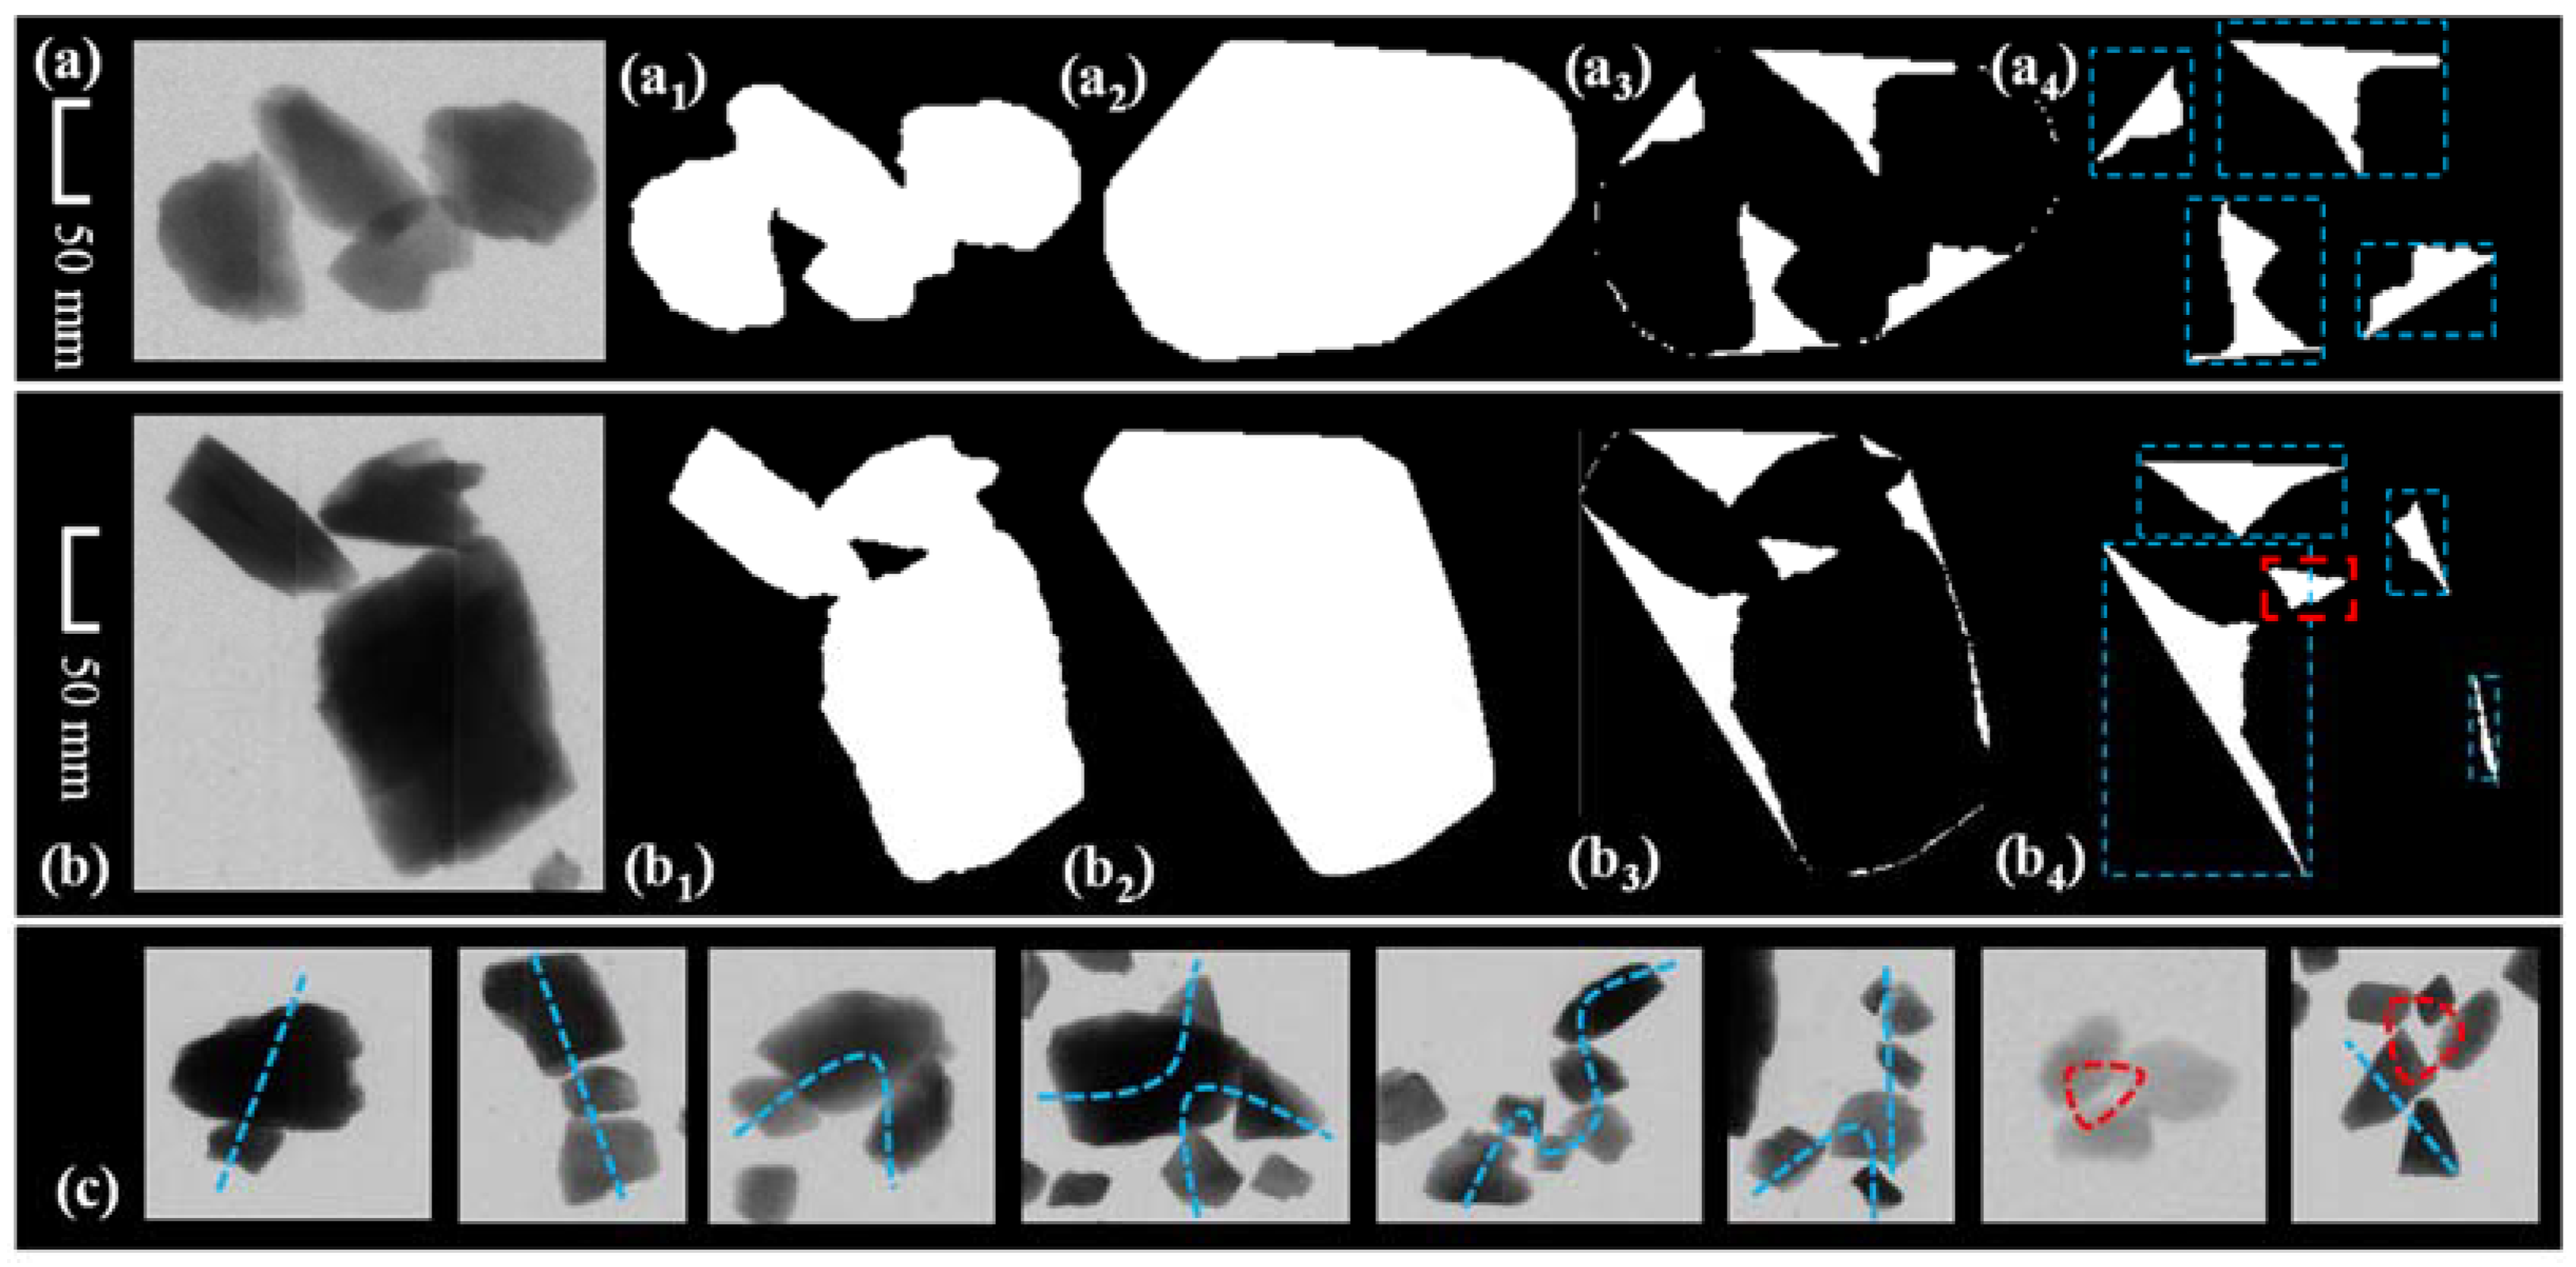
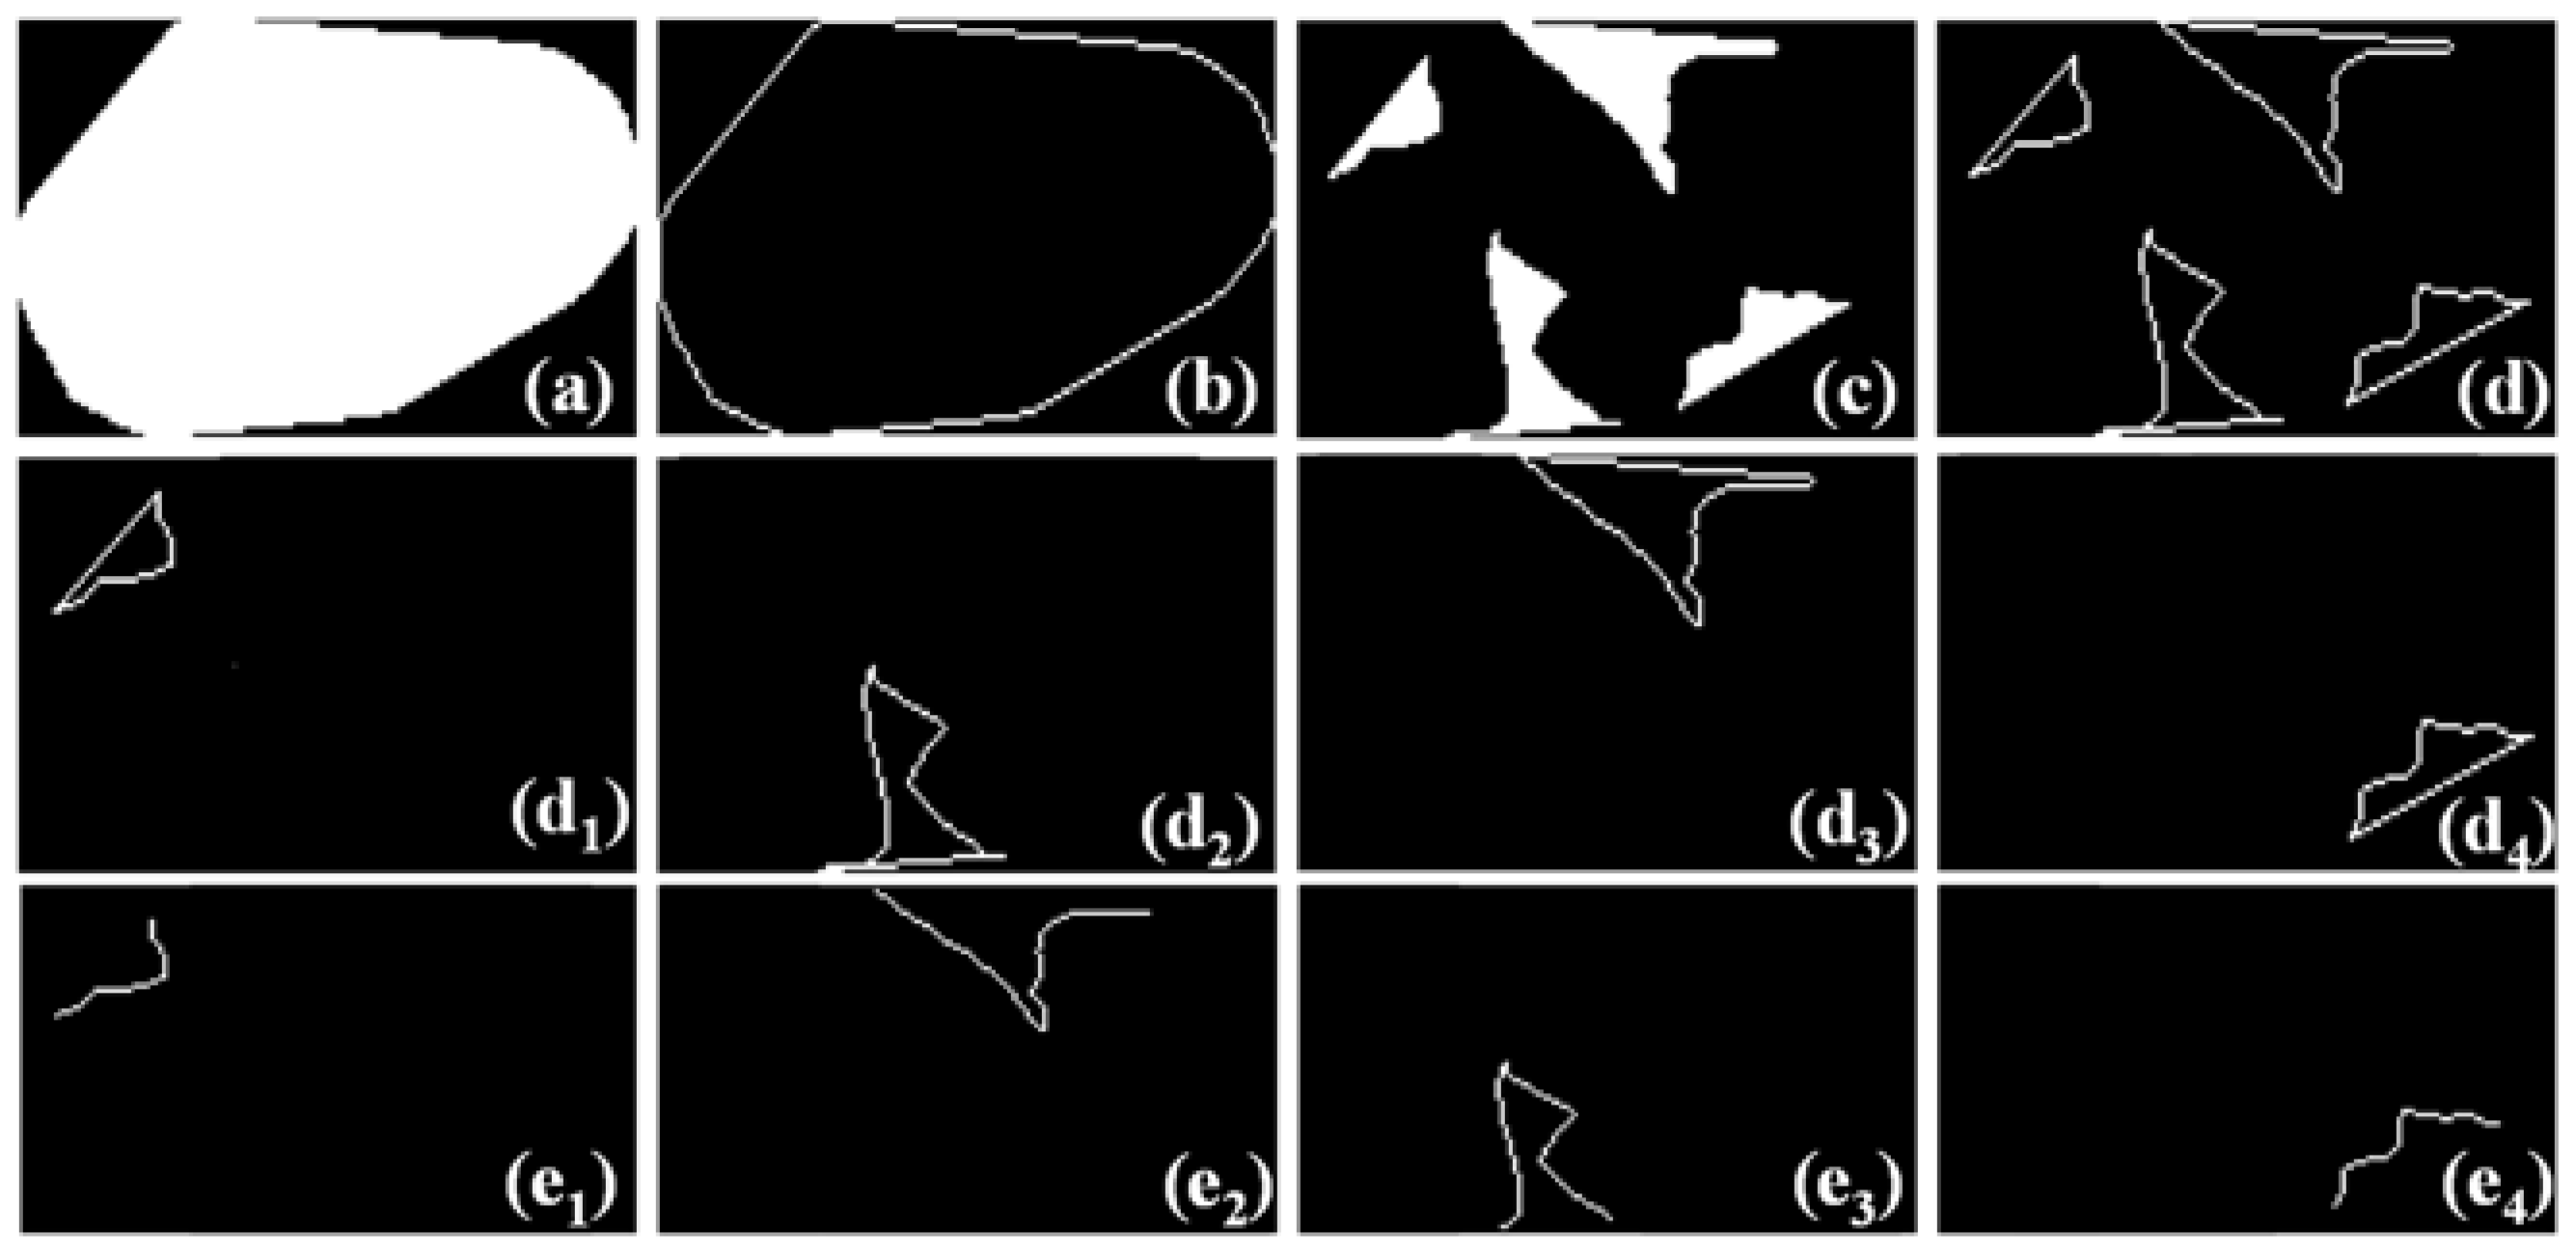
2.2.1. Types of Concave Defects and Adhesion Targets

As shown in Figure 3, a grayscale image I (a) of the adhesion target area is obtained. The binary image bw (a1) is accepted by the binarizing image I (a) by threshold segmentation, and the threshold is the minimum gray value of the background pixel. The minimum circumscribed convex hull of the image bw (a1) is calculated and filled. The filled pixel value is one so that the convex hull binary image bw1 (a2) is obtained. Subtracting the binary image bw1 (a2) from the binary image bw (a1) obtains concave defect binary image bw2 (a3). Then, a small white area is deleted from bw2 (a3) with a threshold of 50 pixels, and an image bw3 (a4) is obtained. The area distribution of concave defect areas is shown in Figure 4. Set that area threshold of the concave defect pixel to 50, and 99% of concave defect areas can be retained.
As shown in Figure 3, concave defects are defined as two types:
(1)
Concave defects at the edge of the convex hull (CDECH). Close to the edge of the bw (a1).
(2)
Concave defect at the edge of the non-convex hull (CDENCH). Not close to the edge of the bw (a1).
Therefore, the concave defects in (a4) are CDECH. In (b4), the red dotted line box selects concave defects as CDENCH, and the rest are CDECH.
Furthermore, all adhesion forms can be defined as two types:
(1)
If the concave defects in the adhesion target are all CDECH, the adhesion is OLA.
(2)
If there is a CDENCH in the adhesion target, the adhesion is CLA.
Figure 3c reflects that the blue and red dotted lines indicating OLA and CLA, respectively.

2.2.2. Method for Judging OLA and CLA

As demonstrated in Figure 5, image processing is described in the following.
The edge binarization images by1 (b) and by2 (d) of convex hull binarization image bw1 (a) and concave defect binarization image bw2 (c) are obtained. by2 (d) is separated from the connected domain:
by2 = by21 + by22 + ⋯ + by2p
where p denotes the number of connected domains of by2 (d). In Figure 5d, we have p = 4 [32].
by21 (d1), by22 (d2), by23 (d3), by24 (d4), …, by2p are subtracted from the edge image by1 (b):
by 3 1 = by 2 1 by 1 by 3 2 = by 2 2 by 1 by 3 p = by 2 p by 1
Assign the pixel value less than zero to zero to obtain the edge by4:
by4 = by41 + by42 + ⋯ + by4p
where by41, by42, by43, and by44 correspond to (e1), (e2), (e3), and (e4) in Figure 5, respectively.
by41, by42, …, by4p are related to by21, by22, …, by2p, respectively. If the number of pixels with 1 in the image of the q-th connected domain is equal to the number of pixels with 1 in by2q, the adhesion type is considered CLA; otherwise, it is OLA. by4q is CDENCH.

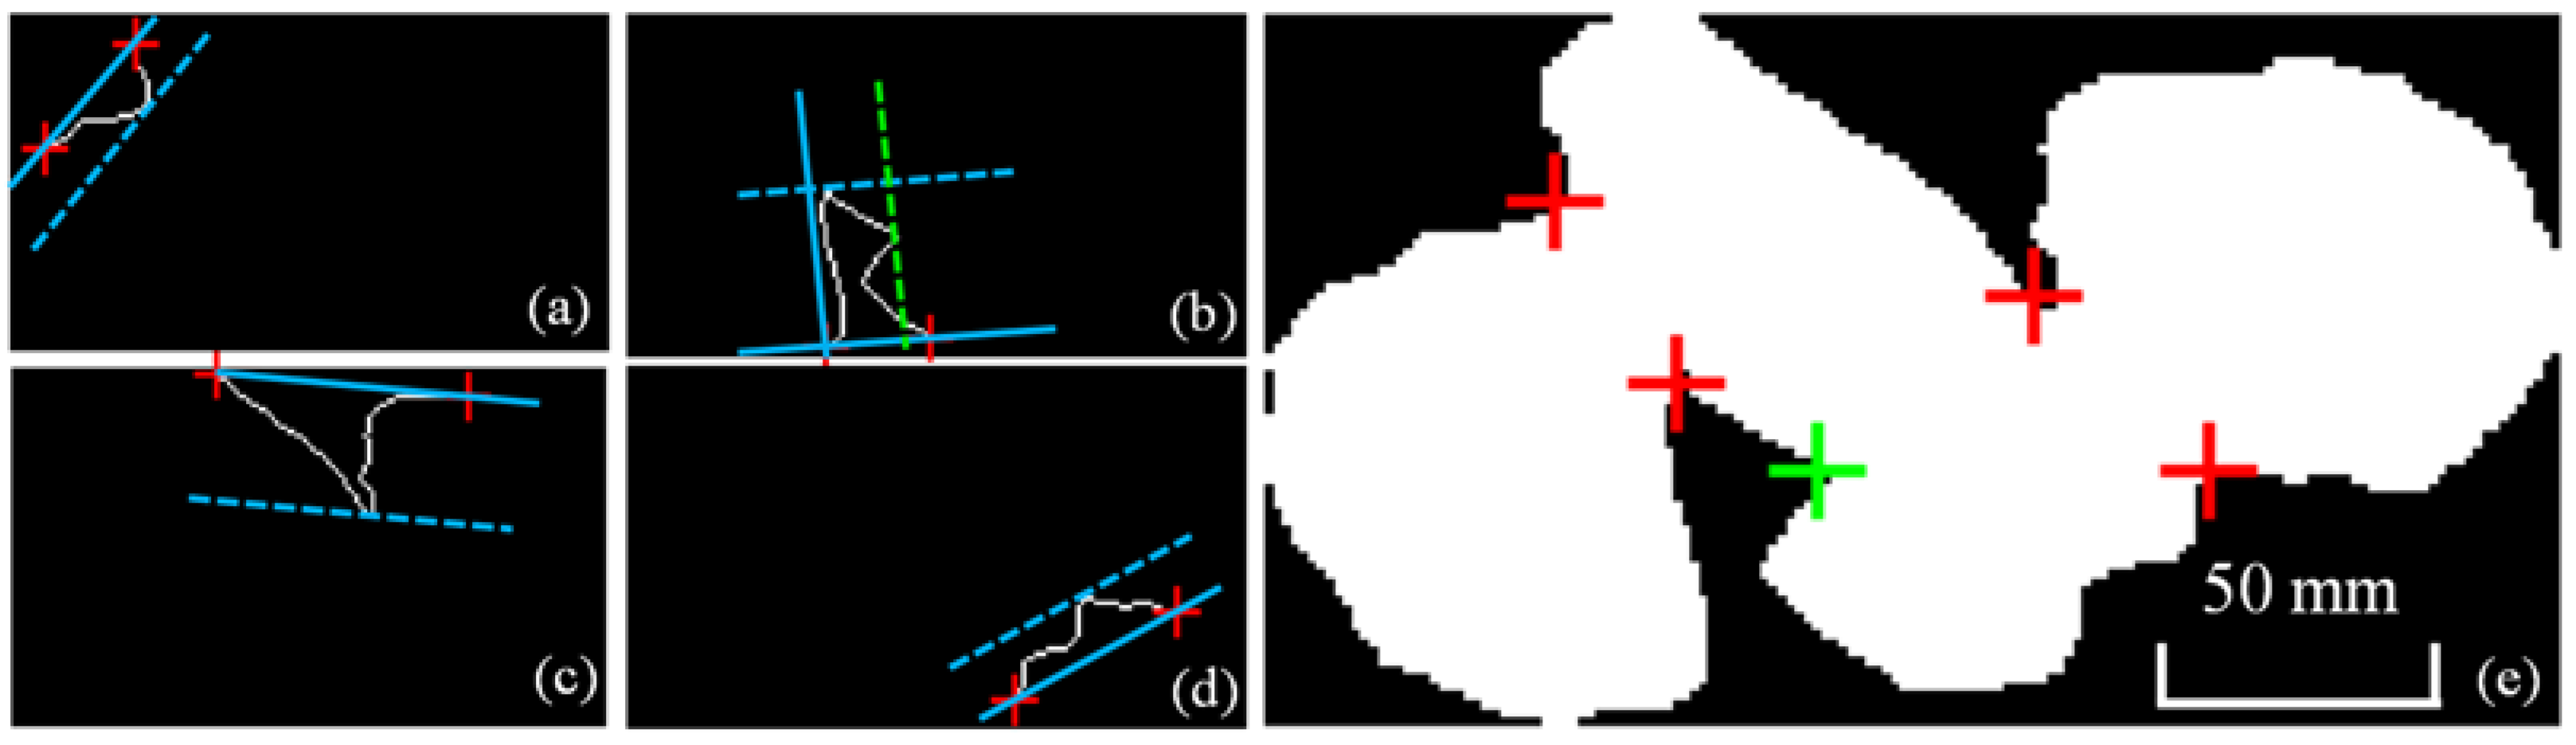
2.3. Pit Detection Method

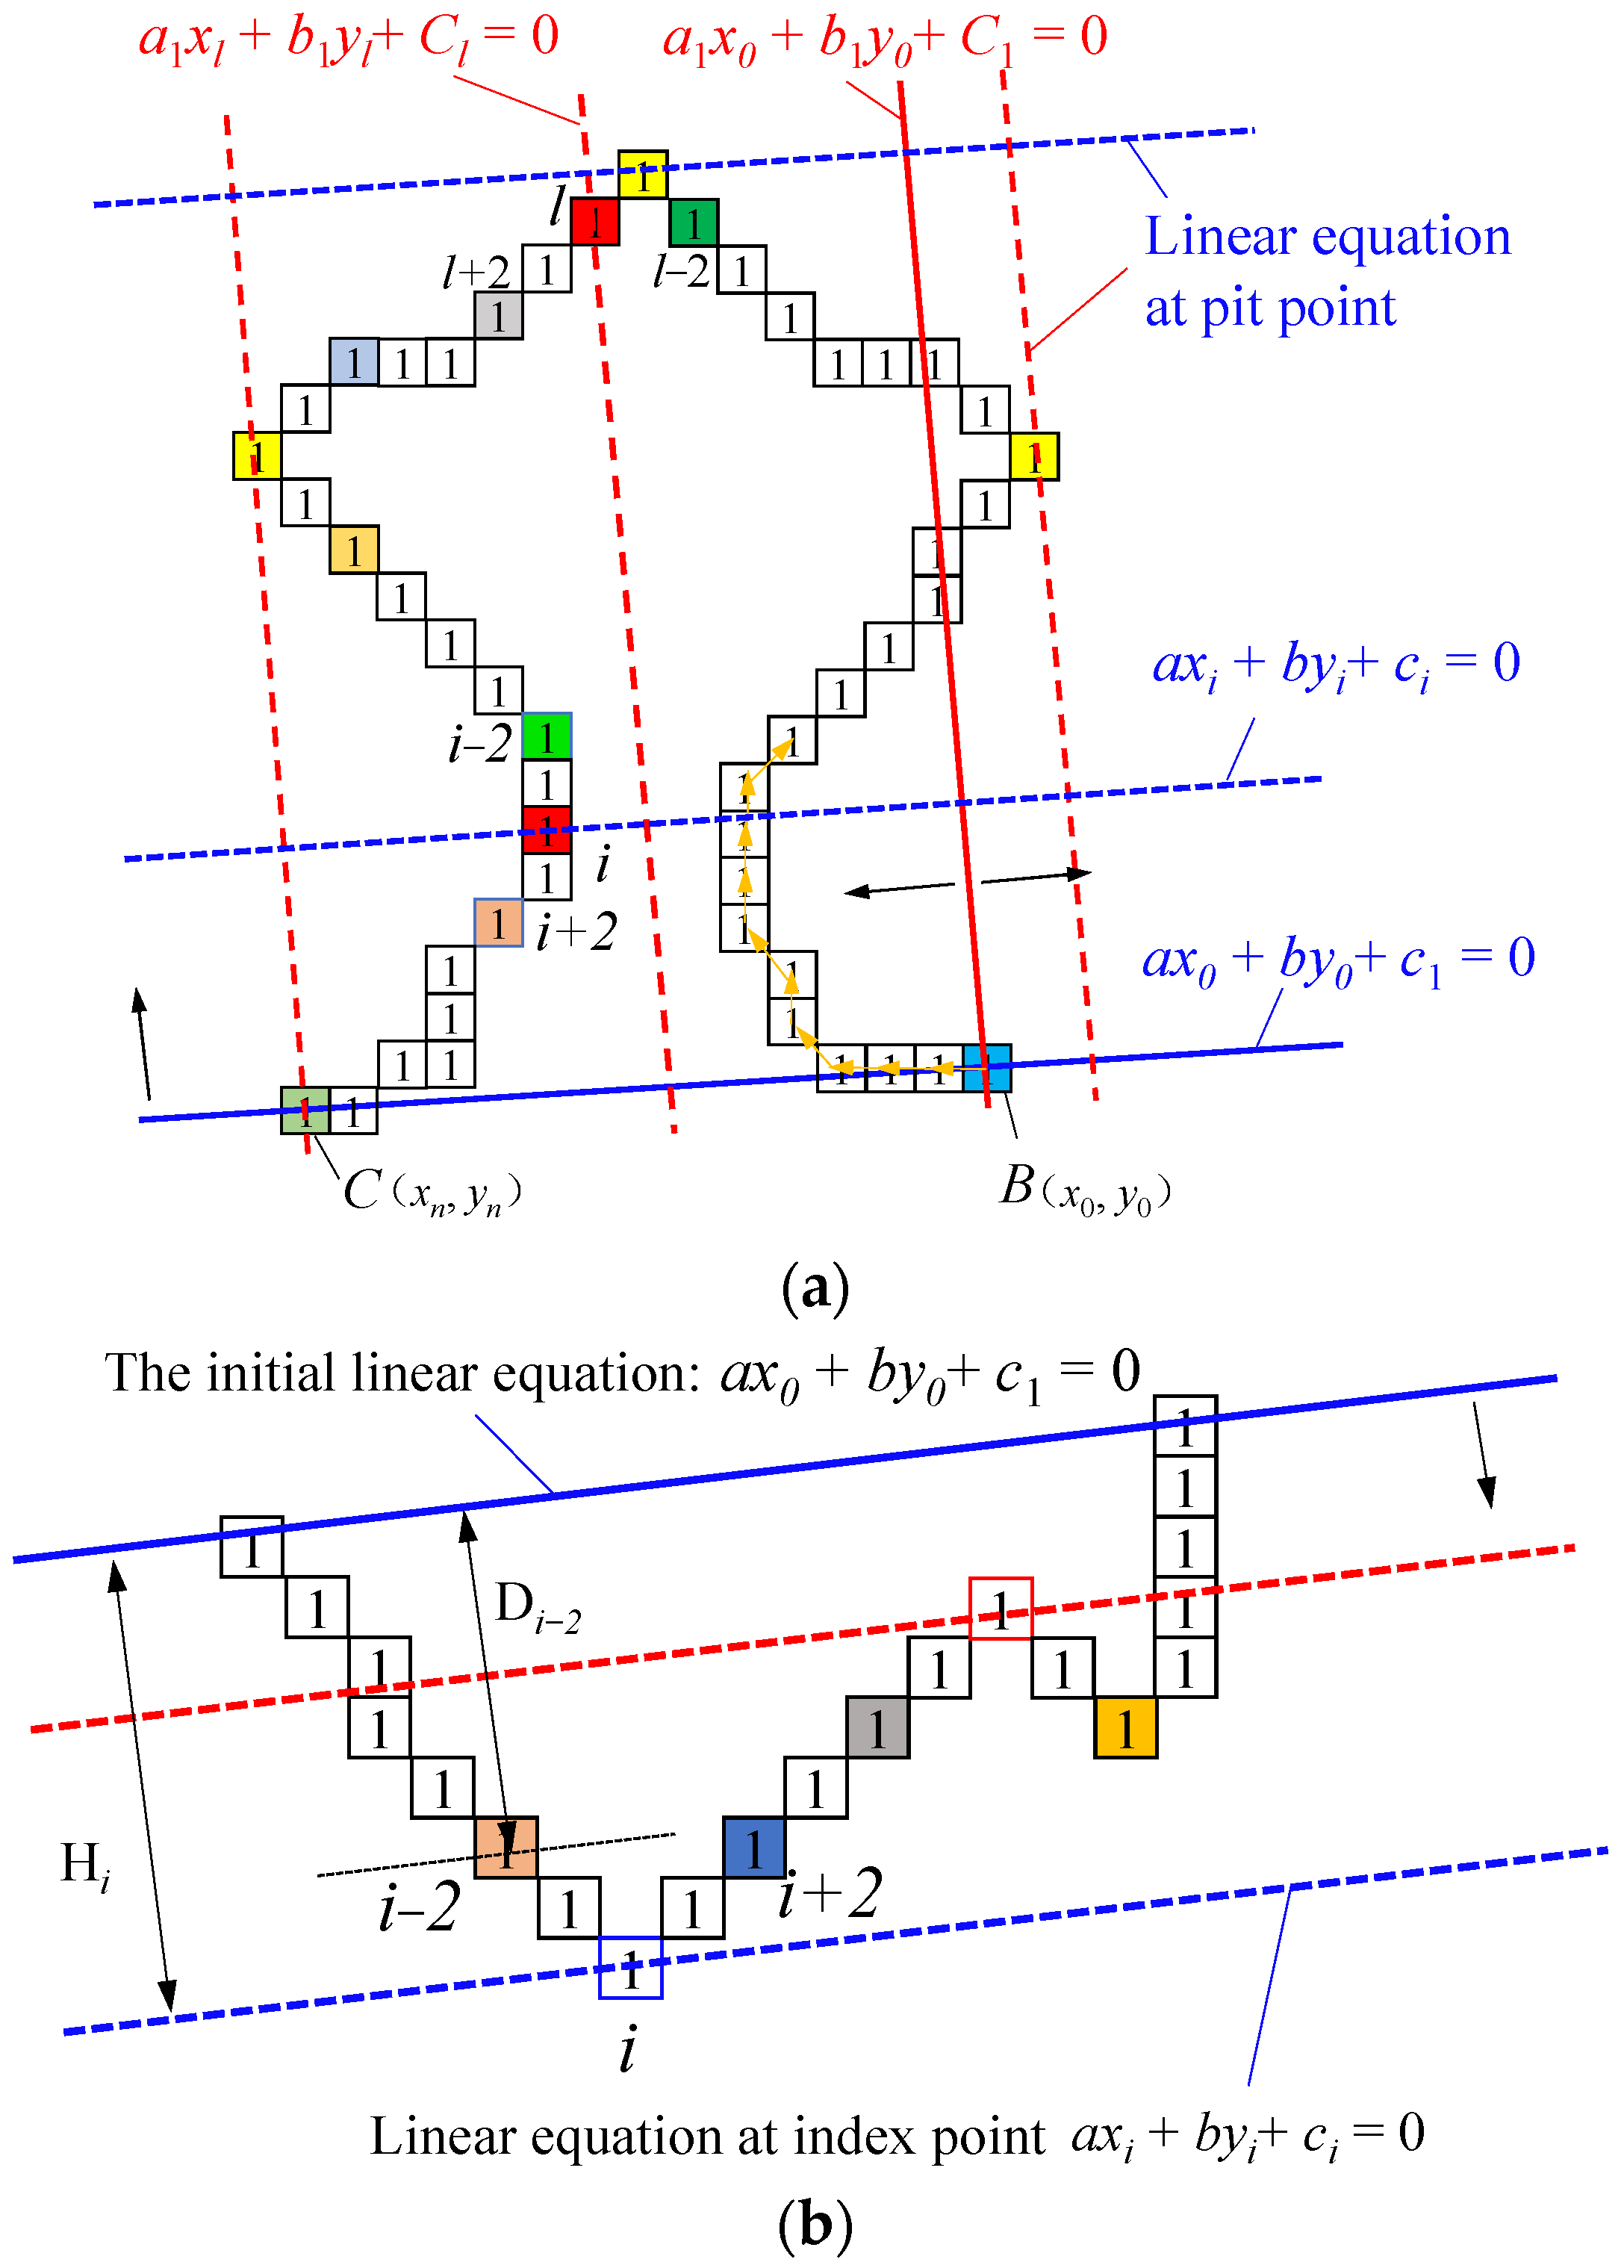
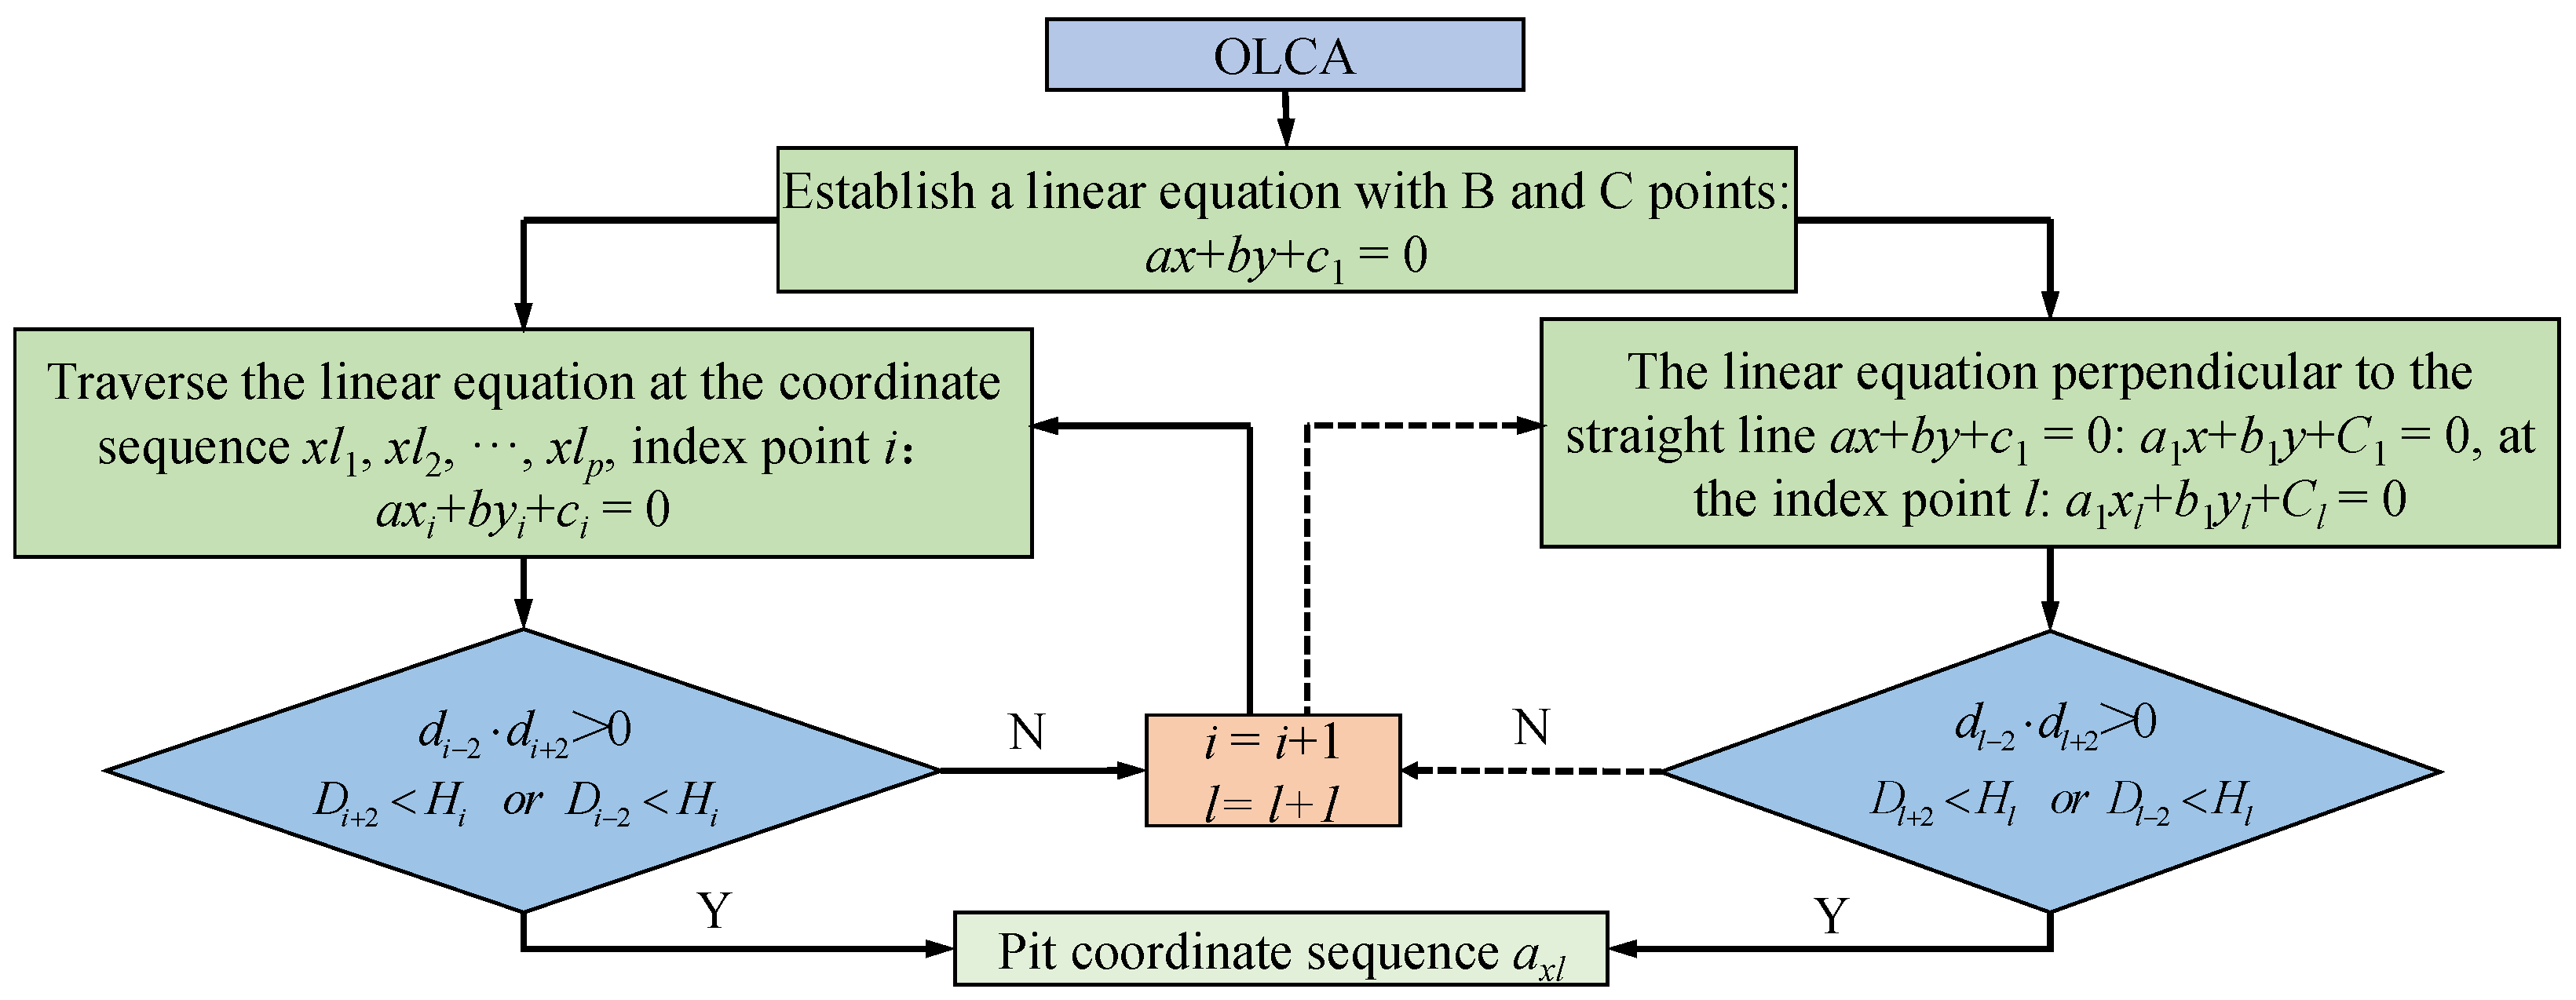
2.3.1. Open-Loop Crossover Algorithm (OLCA)

The OLCA is illustrated in Figure 6. First, as shown in Figure 6a, an end point B of the edge is calculated. Then, starting from point B, the coordinate vector sequence of all non-zero pixels is tracked. By41, by42, …, by4r, …, by4p are remembered, and the corresponding coordinate sequences are xl1, xl2, …, xlr, …, xlp, respectively. The other endpoint of the edge is marked as C, and the r-th coordinate sequence can be expressed as xlr [32].
x l r = x 0 y 0 x 1 y 1 x n y n
where B(x0, y0), C(xn, yn), and n denote the sequence length. Then, a linear equation is established through two points, B and C:
ax + by + c1 = 0
Through point B, establish the initial straight line equation conjugates with the straight line of Formula (5):
a1x + b1y + C1 = 0
Keep the slopes of the two vertical lines constant, traverse the xlr sequence, and update the two linear equations at the index pixels:
( x 2 , y 2 ) a x 2 + b y 2 + c 2 = 0 , a 1 x 2 + b 1 y 2 + C 2 = 0 ( x 3 , y 3 ) a x 3 + b y 3 + c 3 = 0 , a 1 x 3 + b 1 y 3 + C 3 = 0 ( x n 2 , y n 2 ) a x n 2 + b y n 2 + c n 2 = 0 , a 1 x n 2 + b 1 y n 2 + C n 2 = 0
As seen in Figure 6a, the pixel at any index position i, l (2 ≤ i, ln − 2) is substituted into the linear equation axi + byi + ci = 0, a1xi + b1yi + Ci = 0, and the ci, Cl is solved. The position constraint conditions for judging whether the index position point is a pit can be described as
d i 2 = a x i 2 + b y i 2 + c i , d l 2 = a 1 x l 2 + b 1 y l 2 + C l
d i + 2 = a x i + 2 + b y i + 2 + c i , d l + 2 = a 1 x l + 2 + b 1 y l + 2 + C l
d i 2 d i + 2 > 0 , d l 2 d l + 2 > 0  
This sufficient condition constrains the index position i + 2 (or l + 2) of the front point and the index position i − 2 (or l − 2) of the back point to the same side of the linear equation.
As shown in Figure 6b, another sufficient condition for judging that an index point is concave is the distance constraint, which is described as follows:
D i 2 = a x i 2 + b y i 2 + c i a 2 + b 2 , D l 2 = a 1 x l 2 + b 1 y l 2 + C l a 1 2 + b 1 2
D i + 2 = a x i + 2 + b y i + 2 + c i a 2 + b 2 , D l + 2 = a 1 x l + 2 + b 1 y l + 2 + C l a 1 2 + b 1 2
H i = c i c 1 a 2 + b 2 , H l = C l C 1 a 1 2 + b 1 2
D i + 2 < H i o r D i 2 < H i , D l + 2 < H l o r D l 2 < H l  
This constraint condition indicates that the index point must be far from the initial linear equation. The distance between the front point and the back point of the index point and the initial linear equation should not exceed the distance between the index point and the initial linear equation. As shown in the red dotted line in Figure 6b, although the front and back points of the index point are on the same side of the linear equation at the index point, this index point is not a pit point. The front and back points of the blue dotted index point are between the initial linear equation and the linear equation at the index point. We think this index point is a pit point. Therefore, in Formula (14), we calculate the distances Di−2 and Di+2 from the front point i − 2 and the back point i + 2 to the linear equation. Due to the constraint of Formula (10), in Formula (14), there is only one pixel whose distance from the initial linear equation is less than Hi. Hi is the distance between the index point linear equation and the initial linear equation. Similarly, the same is true of the linear equation corresponding to the index point of l.
This point can be judged as a pit if the above two constraints are met. The pits detected on the edge form a set of pit coordinate sequence axl. The flow chart of the OLCA algorithm is shown in Figure 7.
In summary, OLCA synchronously traverses the edge coordinates with conjugate lines. Under that judgment of two constraint conditions, the pit detection is complete.

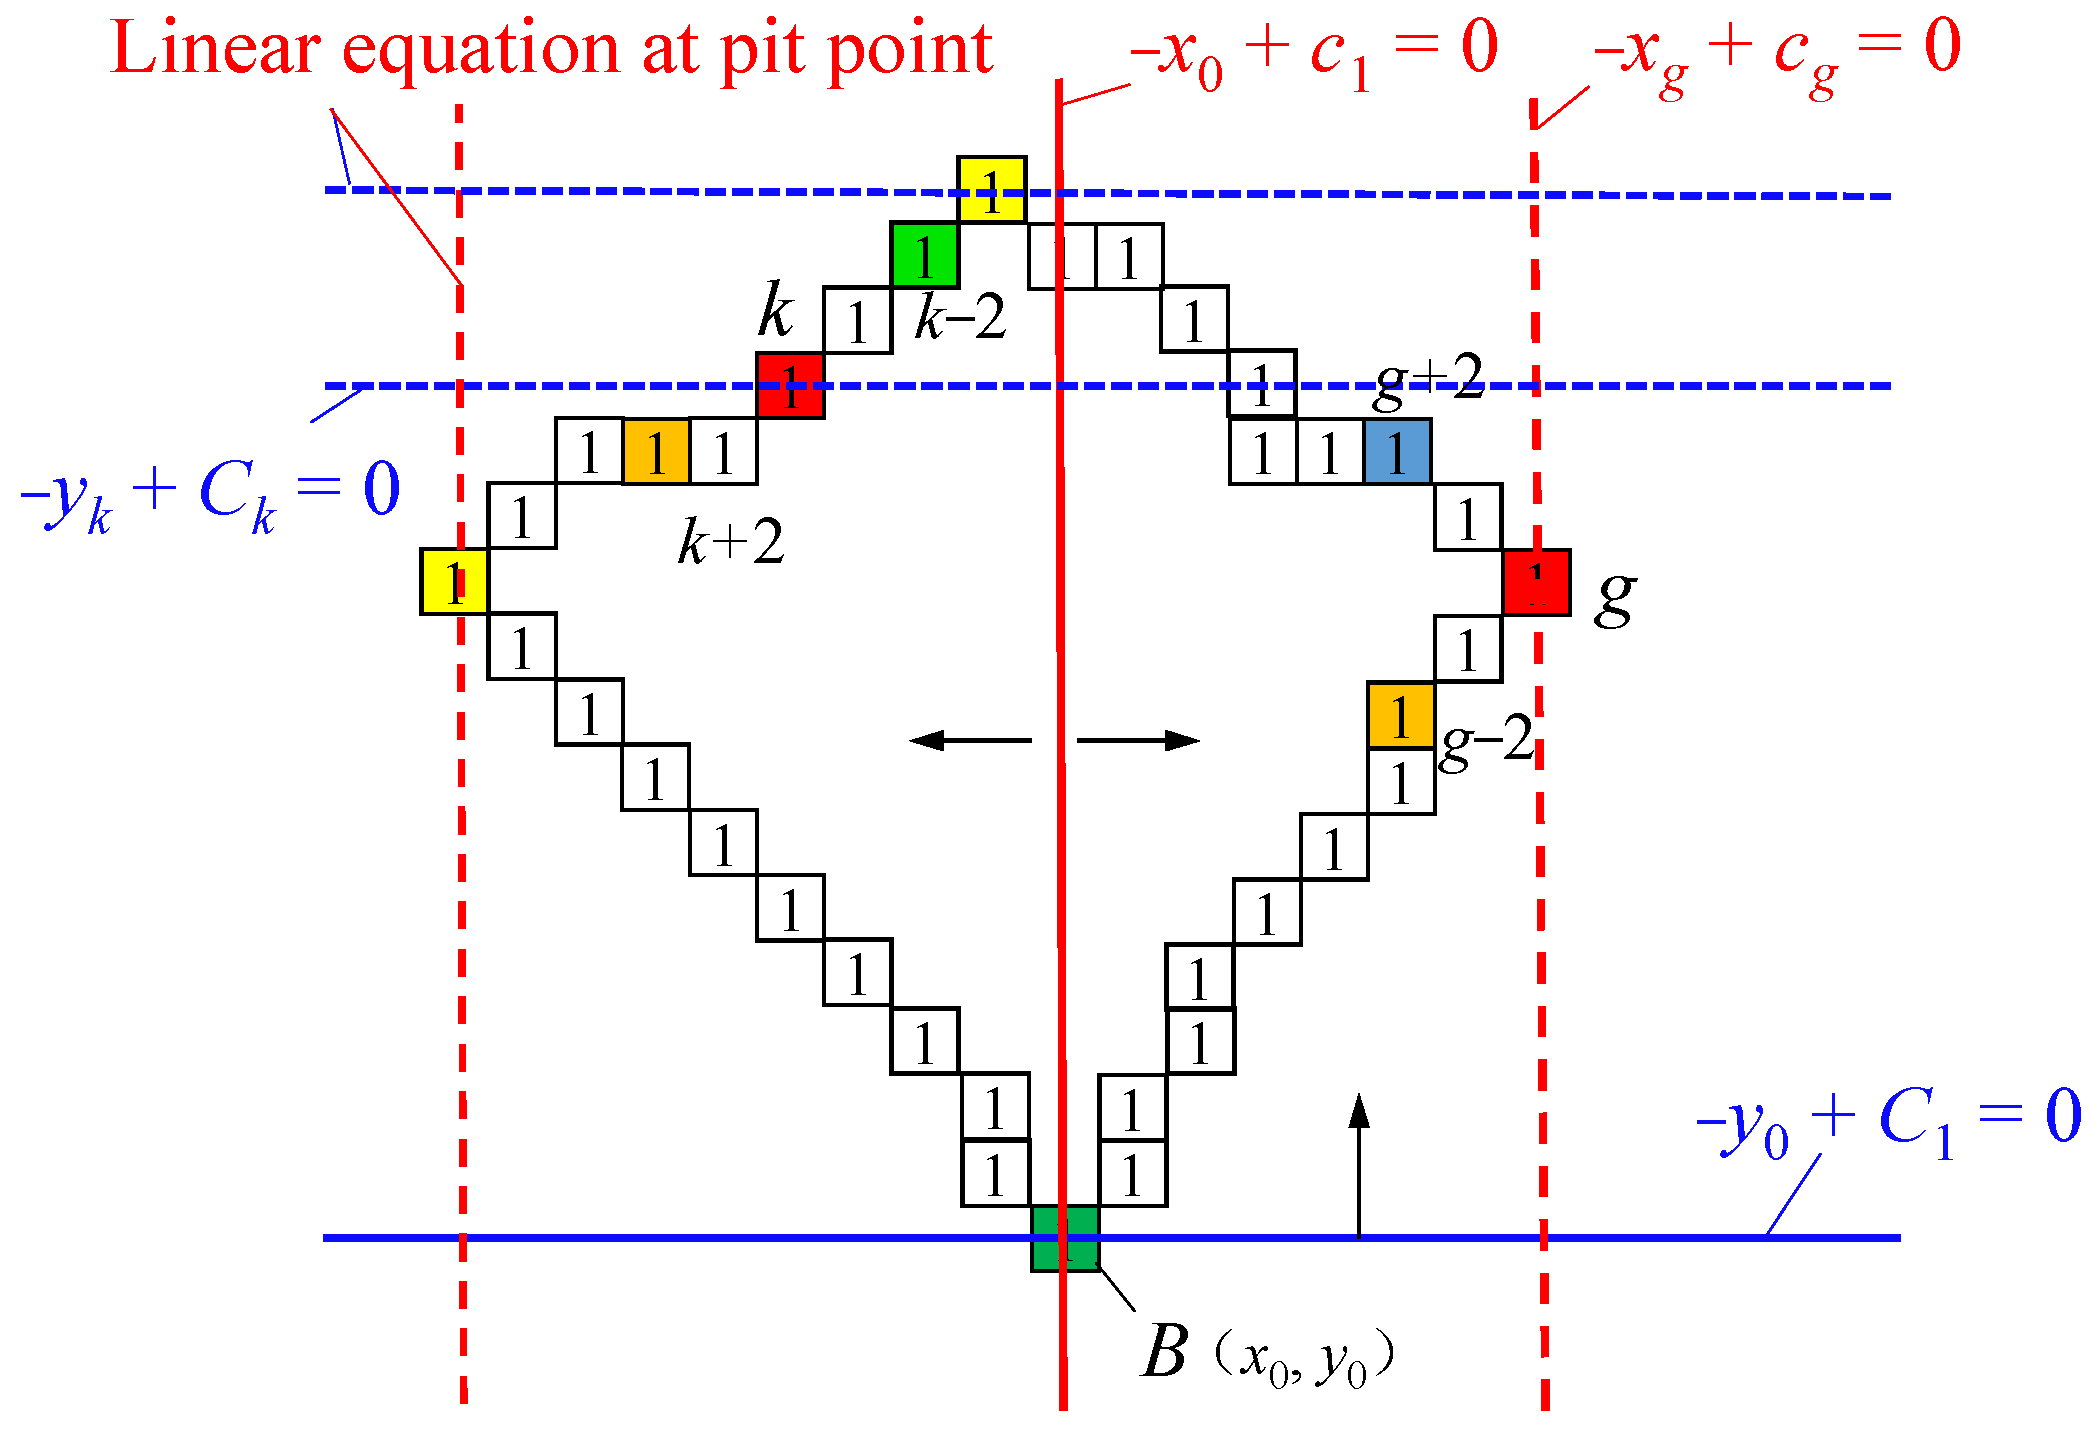
2.3.2. Closed-Loop Crossover Algorithm (CLCA)

Similarly, the coordinates of point B are obtained, and the edge coordinate sequence is obtained by taking point B as the initial point. The conjugate lines are established at the position of point B:
−x + c1 = 0
−y + C1 = 0
Traverse the coordinate sequence and update the conjugate linear equation at the index point. As shown in Figure 8, we substitute the coordinates of arbitrary index positions k and g (2 ≤ k, gn − 2) into −xk + ck = 0 and −yg + Cg = 0, respectively, and solve ck and Cg. The constraint conditions for judging whether an index point is a pit can be described as
d k 2 = x k - 2 + c k , d g 2 = y g 2 + C g
d k + 2 = x k + 2 + c k , d g + 2 = y g + 2 + C g
d k 2 d k + 2   >   0 , d g 2 d g + 2   >   0
Notably, the position of point B should be included in the index. Now, the predecessor point is k, g = 2, and the successor point is k, g = n − 2. Thus, a set of pit coordinate sequences axl is output, the pit sequence detected by the CLCA. The flow chart of the CLCA algorithm is shown in Figure 9.

2.3.3. False Pit Rejection and Image Segmentation Methods

axl includes true and false pits [32]. False pits include: ① Pits caused by circumferential concave defects of coal and gangue. Suppose the edge of irregular coal and gangue has a concave defect area of more than 50 pixels. More pits will be calculated in that case, as shown in Figure 10a. ② Calculate more pits on both sides of proper holes. The interval between the index point and the front and back points is 2-pixel steps. The pixels meeting the constraint conditions in these two steps are considered pits, as shown in Figure 10b.
Given the problem ①, the number S of non-zero pixels in the 11 × 11 area of the bw image of pits in axl is calculated to determine whether pits are retained—retained greater than S1, deleted less than S1, where S1 = 70. The bw image is shown in Figure 10a. Given the problem ②, the distance L between the coordinates of two adjacent pixels in the pit sequence axl is calculated to judge whether to retain the holes—greater than L1 reserved, less than L1 deleted, where L1 = 5 [32].
All the proper pits are calculated, and the segmentation line is obtained using the search method with the smallest distance from the pit to the edge to complete the image segmentation. If only one pit is detected, more concave defects are retained by reducing the area threshold for filtering concave defects. Then, we calculate the minimum distance between the pit and the concave defect to find a dividing line. The specific process is shown in Figure 11. The other side concave defect occurs when continuously reducing the concave defect threshold. Then, we calculate the minimum distance from the pit to the concave defect to obtain the dividing line.
Figure 12 displays the flowchart of the algorithm in this paper.

3. Results and Discussion

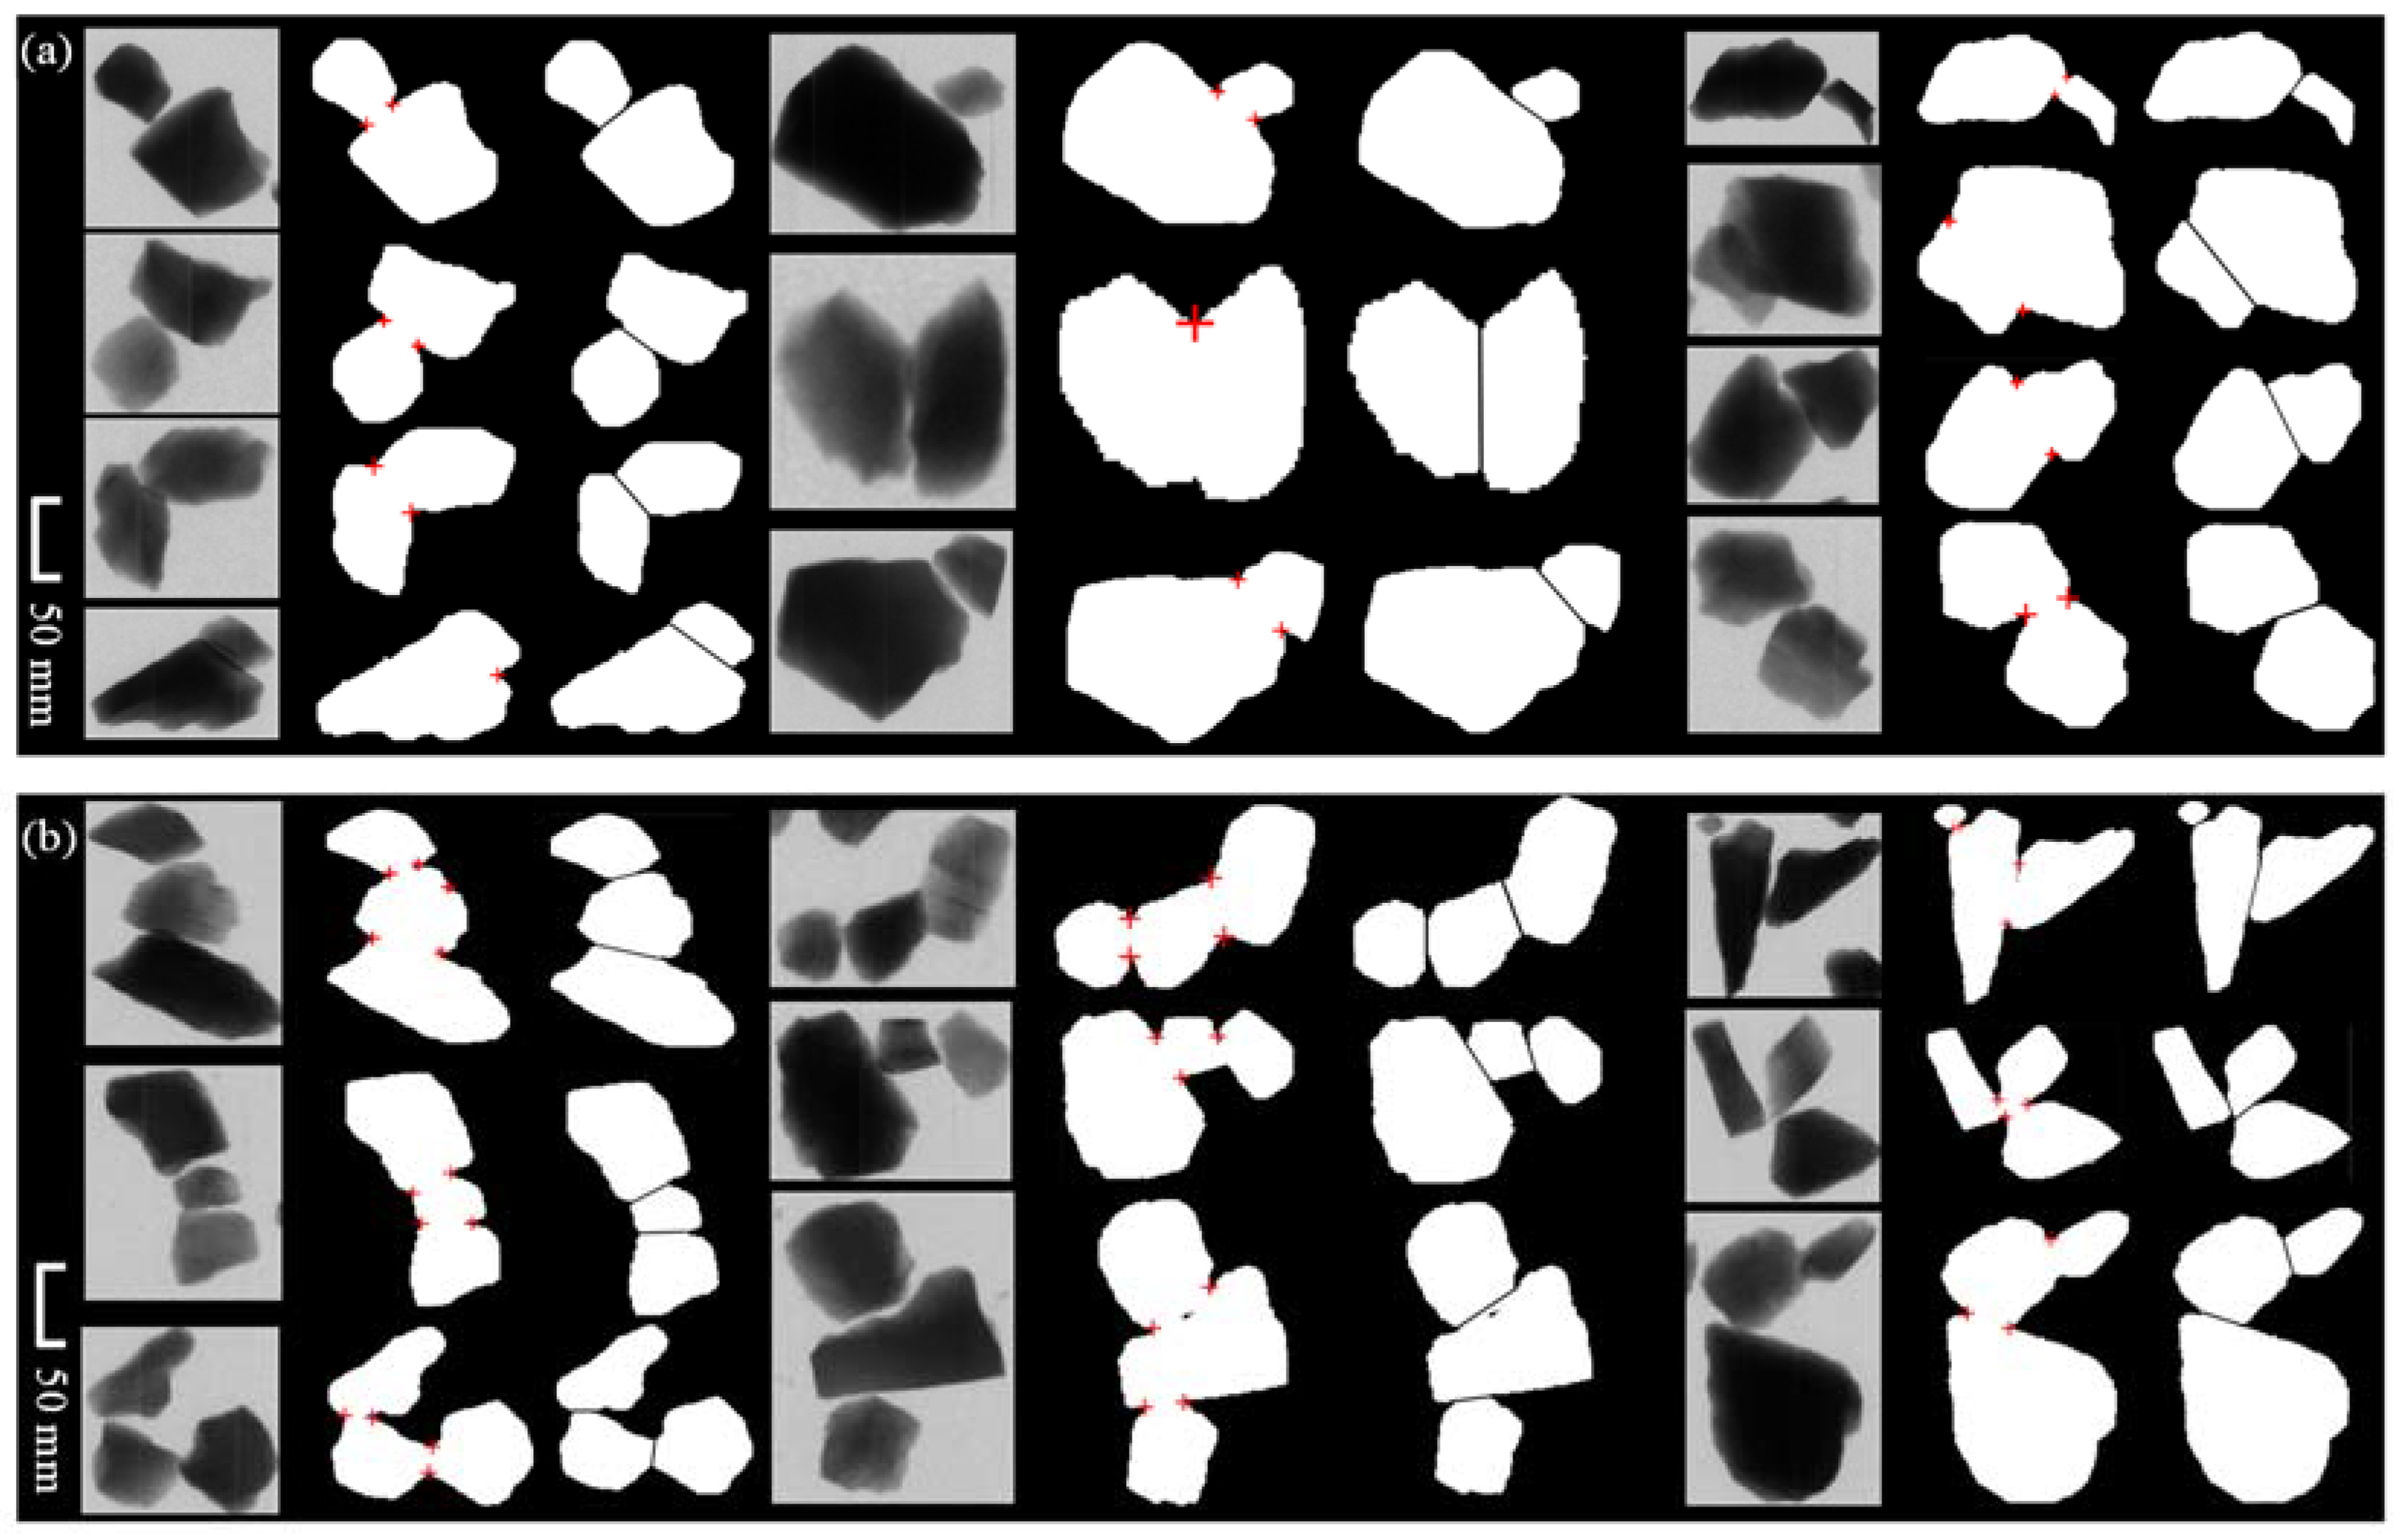
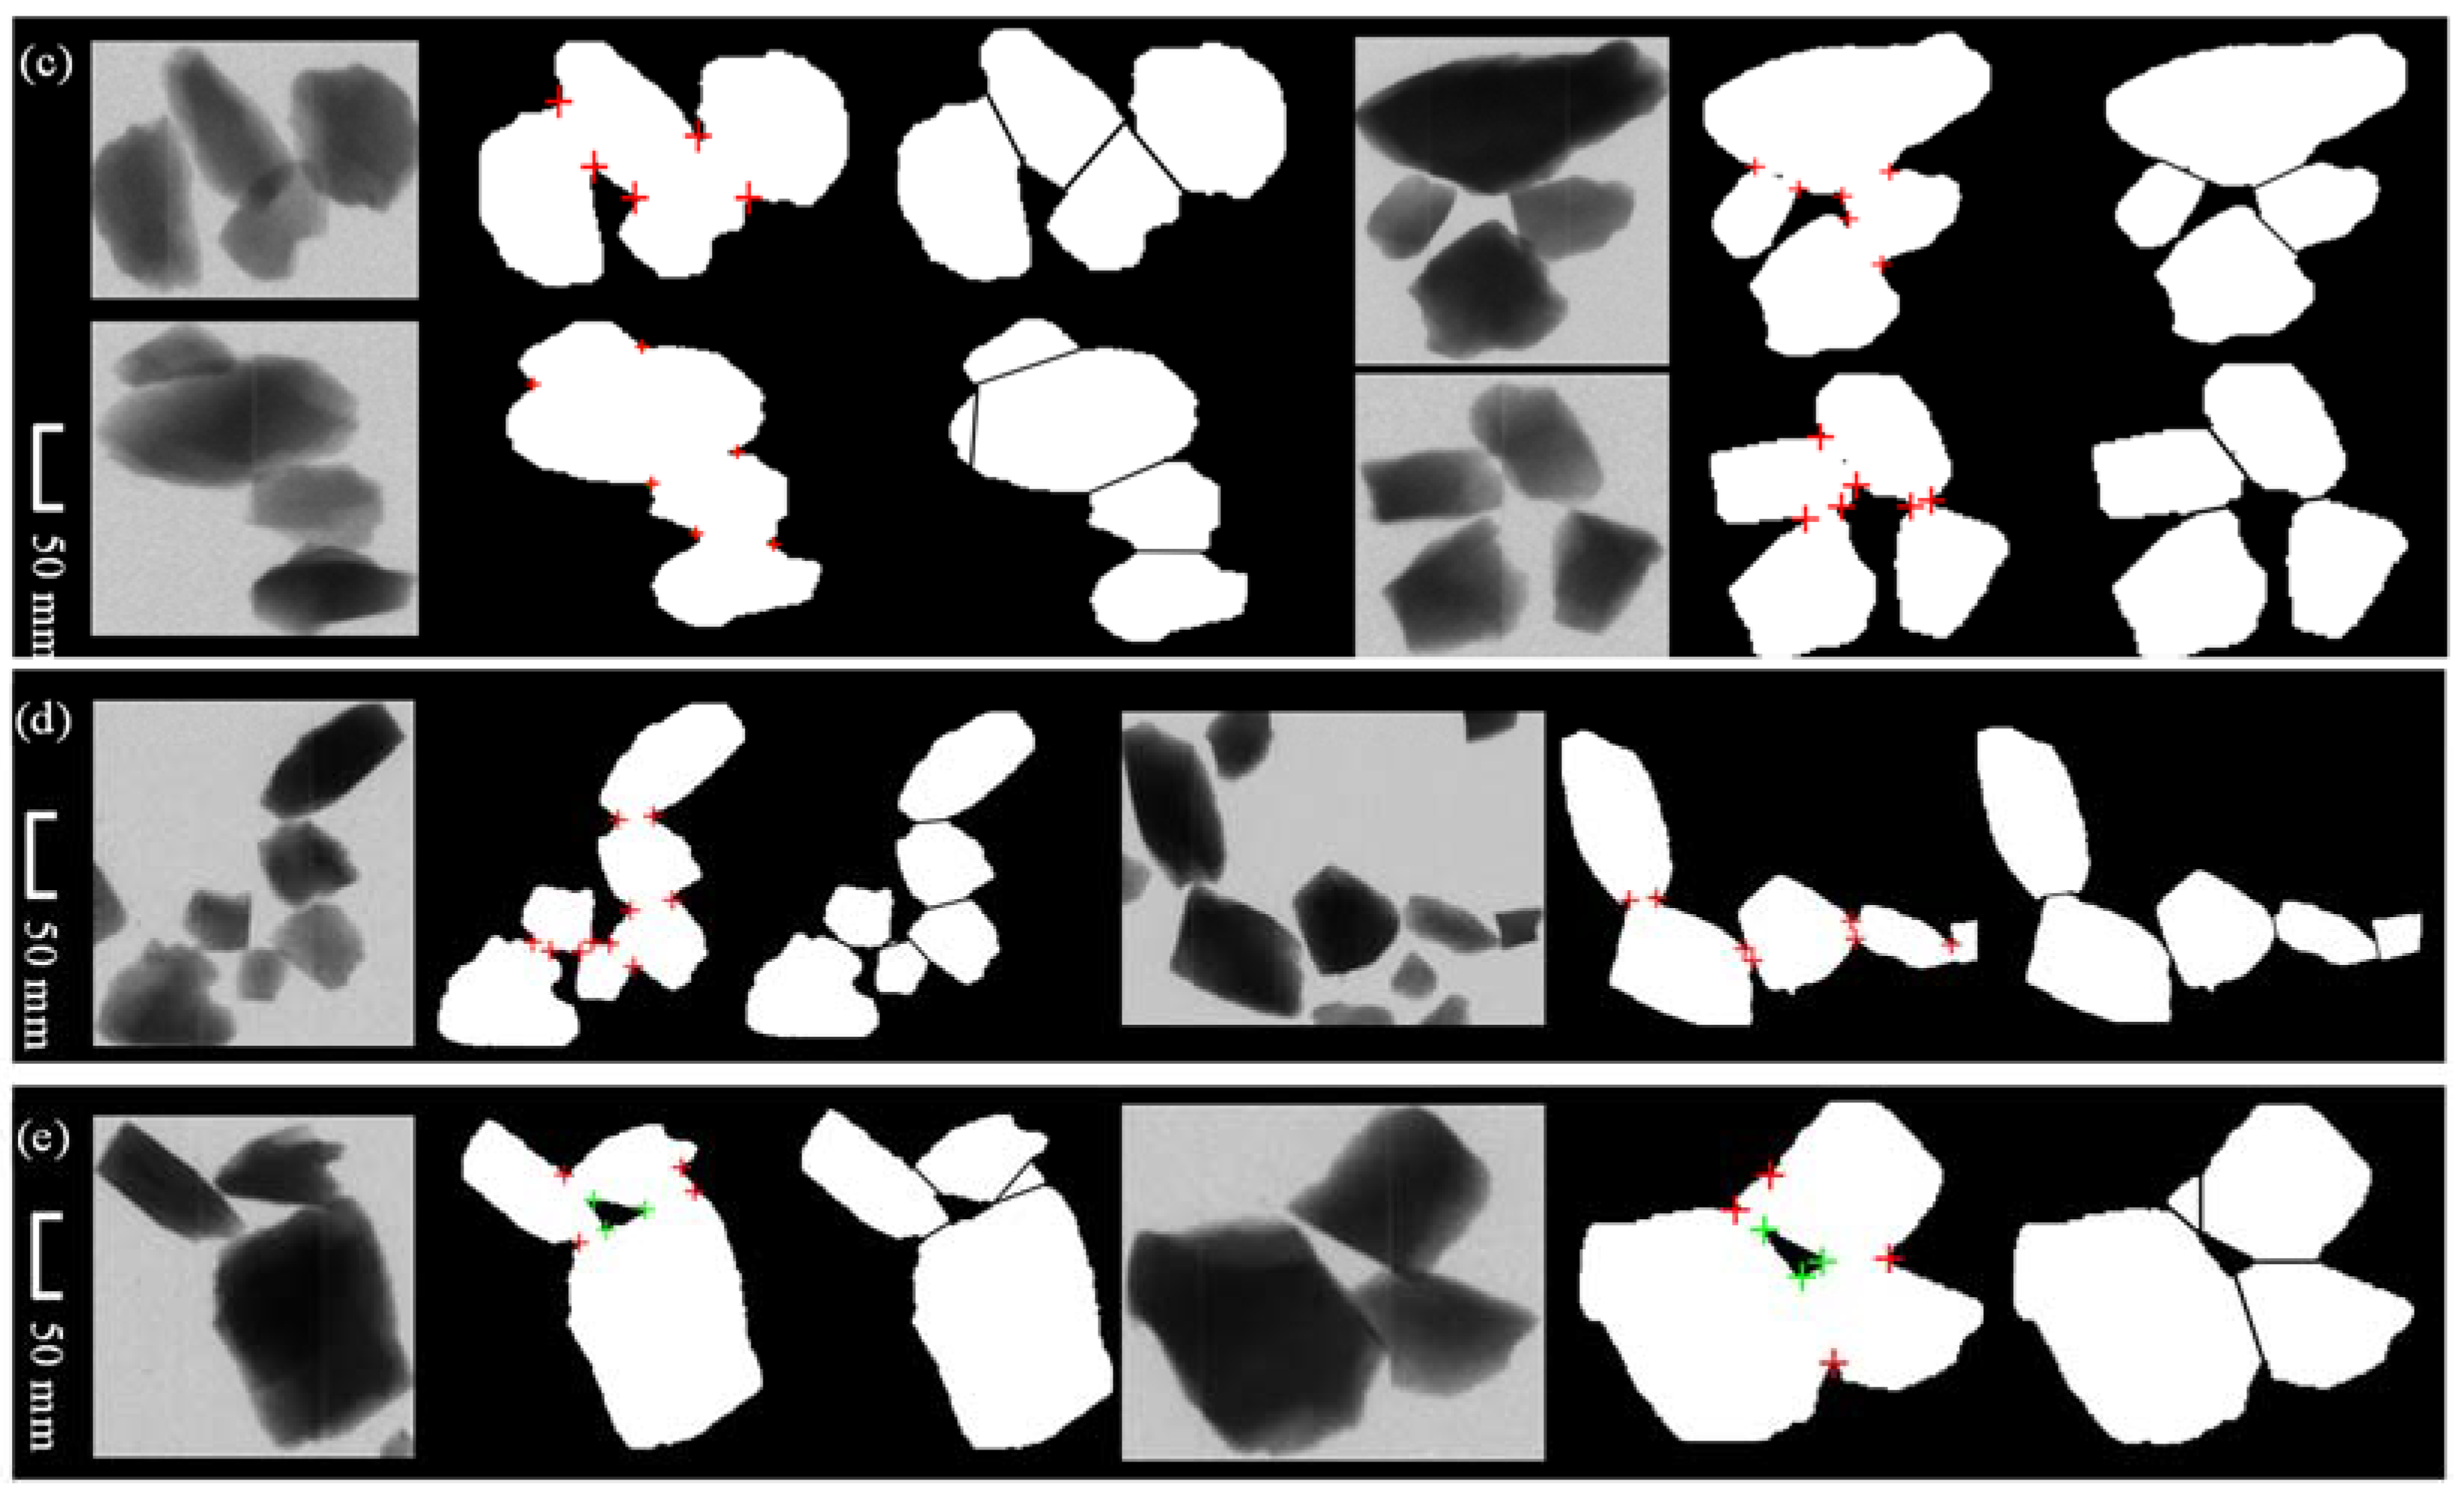
3.1. Pit Detection and Segmentation

As shown in Figure 13, detecting as many pits as possible is possible by using conjugate lines to cross-detect pits.
Figure 14 demonstrates the detection of the pits of two target adhesions (Figure 14a), three target adhesions (Figure 14b), four target adhesions (Figure 14c), more than four target adhesions (Figure 14d), and CLA (Figure 14e). The pit detection and segmentation effect verify that this algorithm can better detect coal and gangue pit positions with multi-scale, multi-target, and multi-adhesion types and can better complete the target segmentation. Although some pits are missing in the adhesion, the image segmentation method can segment accurately.
Notably, the minimum distance method for each pit was employed to reveal the dividing line. As a result, the pits that should have been connected will not be connected, contributing to the formation of some over-divided, small-area-connected domains. At this time, it is only necessary to set a threshold and delete the small, connected area, which will not severely impact the further calculation of the centroid and sorting parameters of the target. Therefore, there is no follow-up treatment for this situation in this paper. Figure 14 illustrates that two pits were not connected, and one pit corresponded to the dividing line.

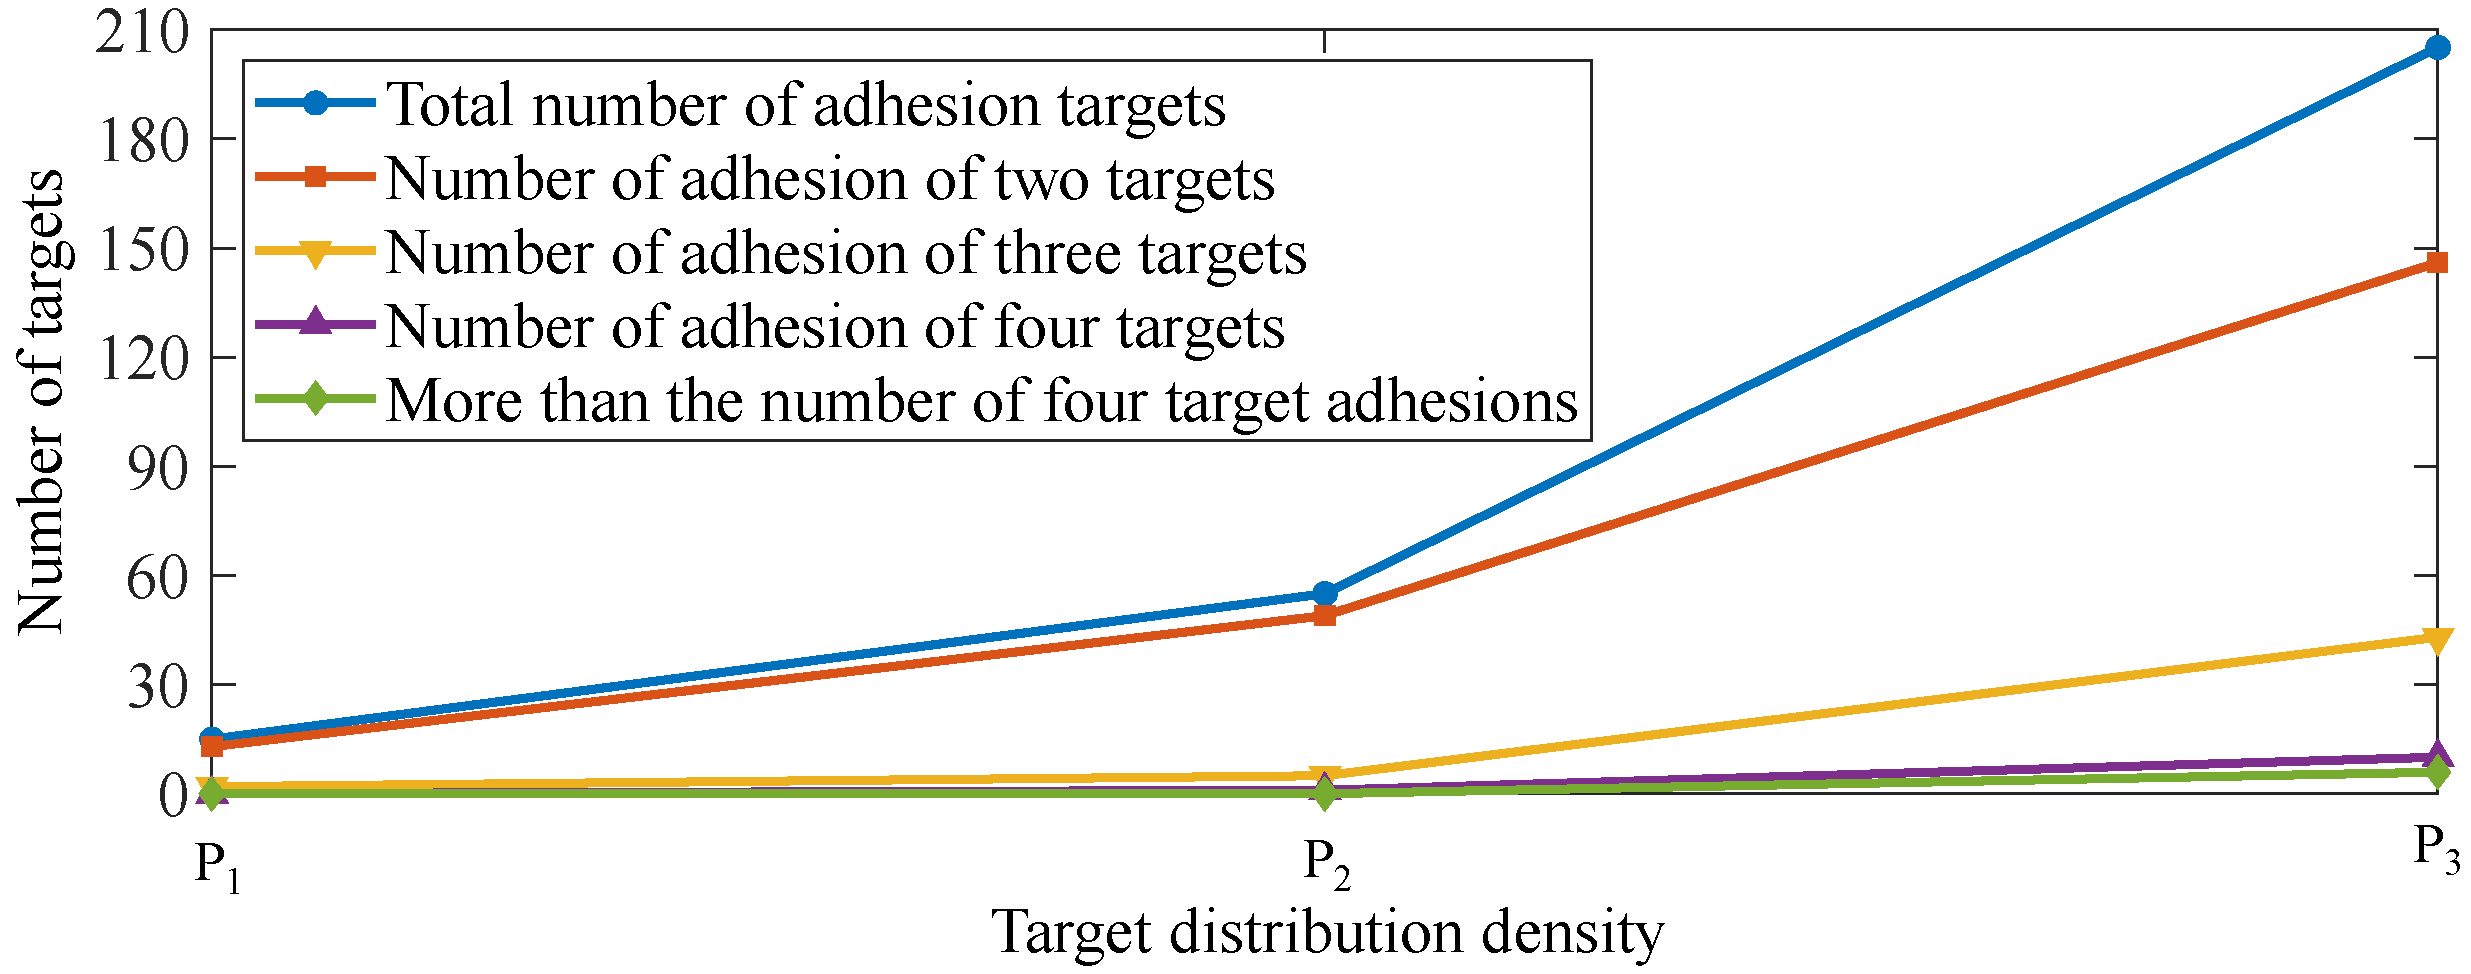
3.2. Experimental Validation

The amplitude of the vibrating distributor was adjusted. Specifically, the feeding amount was adjusted, and the image data in three different feeding states were obtained. Three groups of data sets were randomly selected. Each group of data sets contained 30 high-energy images, and each group of images corresponded to its feeding state. The number of coal and gangue in each data set was calculated through manual statistics, and the density distribution was represented by p = num/30. The distribution densities of the three data sets were recorded as P1, P2, and P3, individually. Calculated: num1 = 408, num2 = 754, num3 = 1643, P1 = 13.6, P2 = 25.13, P3 = 54.76.
The statistical results of overlapping and adhesion targets of data sets are shown in Figure 15.
When the feeding amount was small, the number of adhesion targets was small, and almost no adhesion occurred with more than four targets, as suggested in Figure 15. With the increase in feeding amount (distribution density p), the number of adhesion targets increased correspondingly, and the proportion of adhesion between two targets was the highest. Owing to no CLA in all statistical adhesion targets, the probability of CLA was extremely low. The algorithm in this paper was adopted to segment the adhesion targets with three different density distributions, and the segmentation results were counted (Figure 16 and Figure 17).
As shown in Figure 16, when the feed rate was low, the adhesion ratio of the two targets was high, and the segmentation accuracy was high. It shows that the algorithm had a good application effect on the overlapping and adhesion of two targets. Under P3 density distribution, the segmentation quasi-curvature for two targets can reach 97.26%. With the increase in feeding amount, the probability of multi-target adhesion increased, and the segmentation accuracy decreased. Meanwhile, the overall segmentation accuracy can reach 90.73%. The OLCA and CLCA proposed in this paper can improve the segmentation accuracy when multiple targets are stuck together.
As suggested in Figure 17a,b, the cases of wrong segmentation can be divided into over-segmentation and under-segmentation. There were three over-segmentations and two under-segmentations when the density distribution was P2; there were 7 over-segmentations and 12 under-segmentations when the density distribution was P3.
According to the above experiments, two kinds of error segmentation are summarized.
(1)
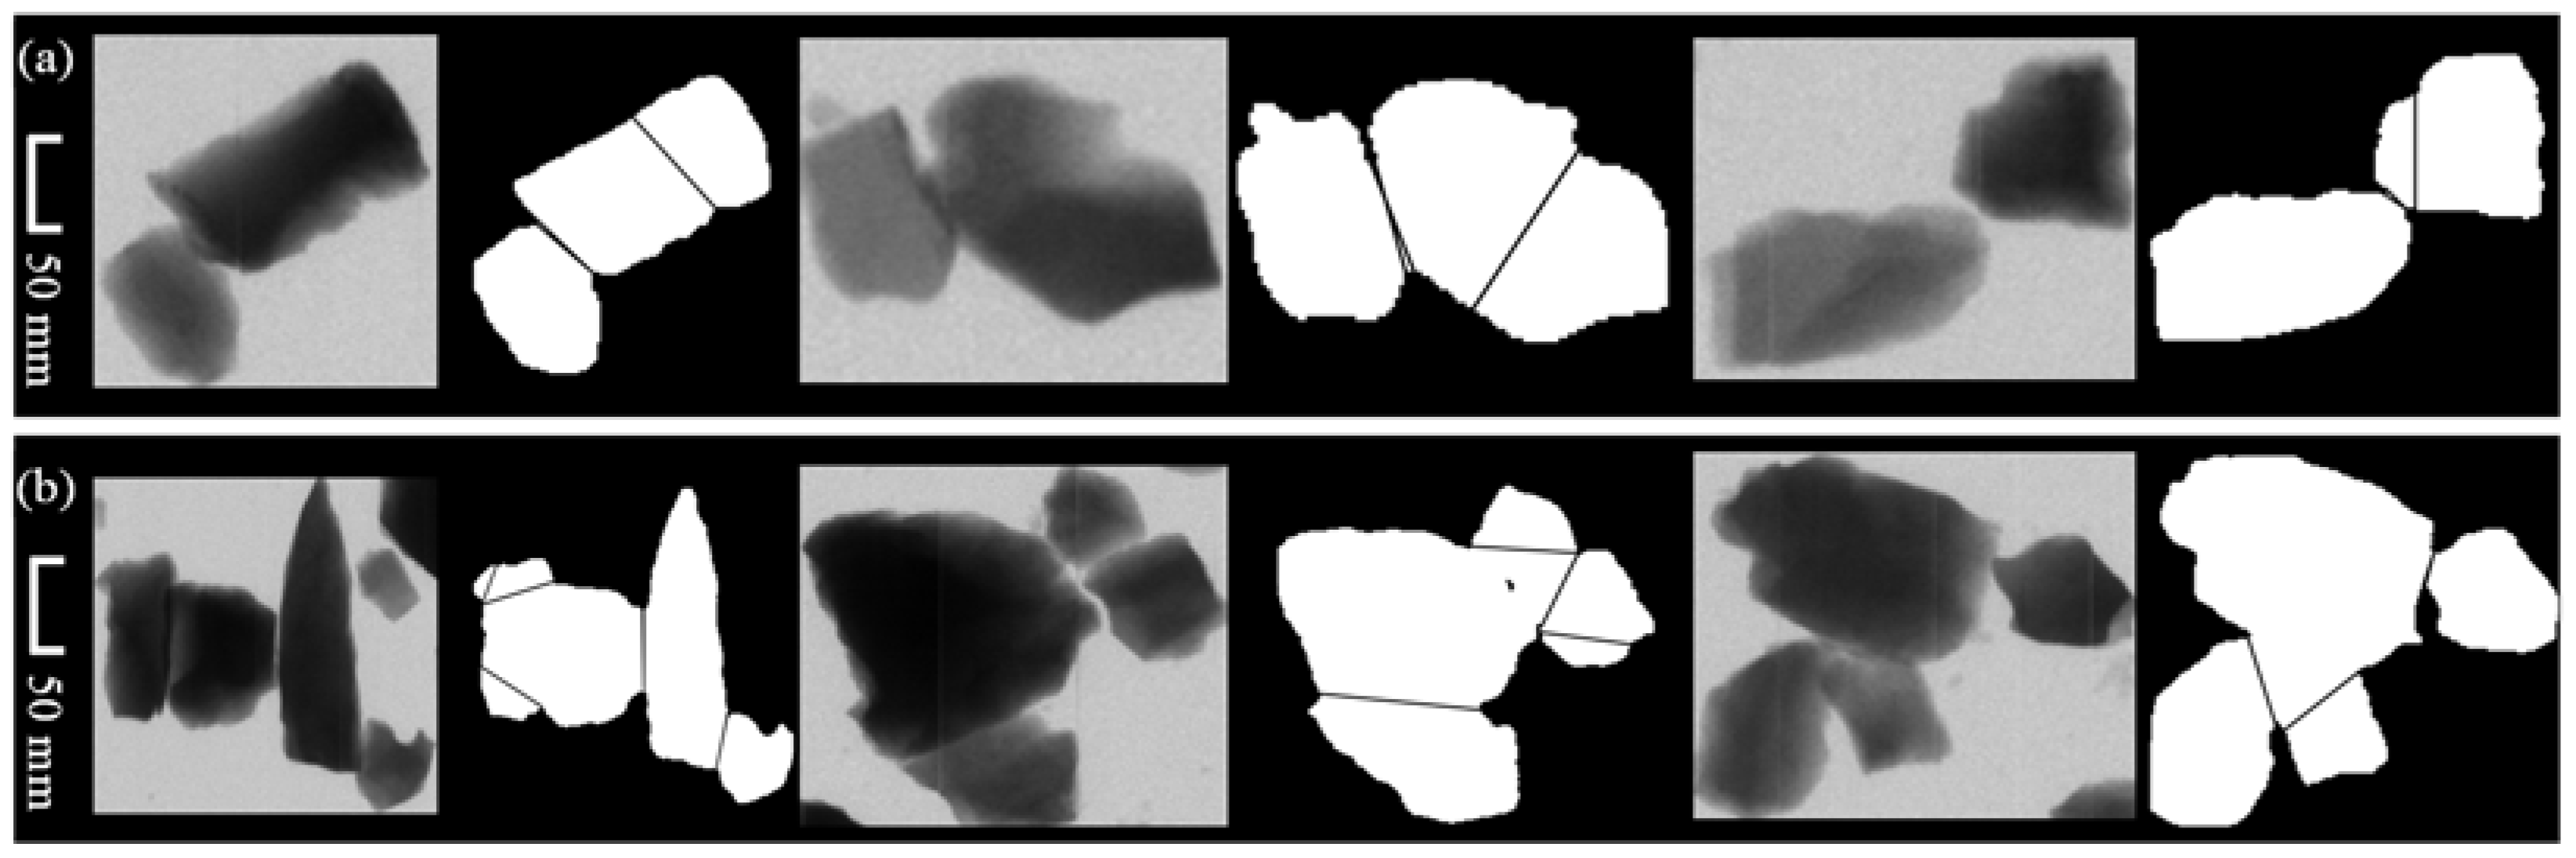
Irregular-shaped coal and gangue had concave defects, and more pits were detected, resulting in over-segmentation errors (Figure 18a);
(2)
Pit detection or minimum distance search method was adopted to obtain the wrong pit position and wrong dividing line (Figure 18b).
Additionally, the wrong segmentation in Figure 18a generally occurred in a target area. This over-segmentation did not influence the subsequent recognition and location elimination. Therefore, it was still within the acceptable range. Regarding the adhesion targets with a density of P3, there were only 12 severe false segmentations, with a total adhesion target of 205 and an acceptable segmentation accuracy of 94.15%.

3.3. Experimental Comparison

This paper verifies the algorithm’s performance by setting contrast experiments. Various methods processed a group of image data, and the final segmentation results were compared. Method 1: a watershed algorithm based on distance transformation, method 2: Method proposed by reference [11], method 3: Method proposed by reference [32], and method 4: The algorithm in this paper. The processed data include 274 adhesion targets, among which 127 are adhered by two targets, 103 by three targets, 31 by four targets, 13 by more than four targets, and 4 by a closed loop. The specific segmentation results are shown in Table 1.
As seen in Table 1, the algorithm proposed in this paper can segment 274 adhesion target areas with an accuracy of 91.24%. Its advantage is that it can better find all pits, thus completing the segmentation of multi-target adhesion. Conjugate lines to detect pits can improve the overall segmentation accuracy by 6.57% compared with a single line. Significantly, the segmentation accuracy of the three targets can be improved by 5.83%. Still, the segmentation accuracy of double target adhesion was not greatly improved. Compared with the WA and the method proposed in reference [11], this method can solve the segmentation problem of multi-objective, multi-scale, and multi-type irregular coal and gangue overlapping and adhesion images.
Some of the ubiquitous under-segmented objects can be segmented again after the second recognition is confirmed as a stuck object, as shown in the feedback loop process in Figure 12. Finding the dividing line on the basis of the minimum distance search method can compensate for the segmentation problem of missing pits in partial pit detection. Still, when multiple targets are stuck together, it is easy to be affected by concave defects. The wrong dividing line was found, which led to the incorrect segmentation or under-segmentation of the image. The principle of filtering unwanted concave defects and matching pits will still be an essential issue to improve the segmentation accuracy further.

3.4. Application in Research and Industry

The method of pit point detection based on the conjugate lines proposed in this paper can be applied to image-based measurement. In this paper, after the overlapping and adhesion, coal and gangue targets were segmented, the centroid of the targets could be calculated by the segmented binary image, and the location could be completed. As shown in Figure 1, after the target was positioned, the gangue was able to be separated by injection through the nozzle. In addition, the segmentation of overlapping and adhesion target areas was the basis for further material identification and judgment. The algorithm in this paper can be applied not only in coal and gangue separation on the basis of photoelectric technology but also in the product segmentation and positioning of other optical separations, for example, in the field of sorting and recycling crops, ores, garbage, and scrap metals.

4. Conclusions

(1)
Adhesion targets can be divided into OLA and CLA. Furthermore, OLA and CLA concave defects can be classified into CDECH and CDENCH. The method of judging OLA and CLA is proposed in this paper.
(2)
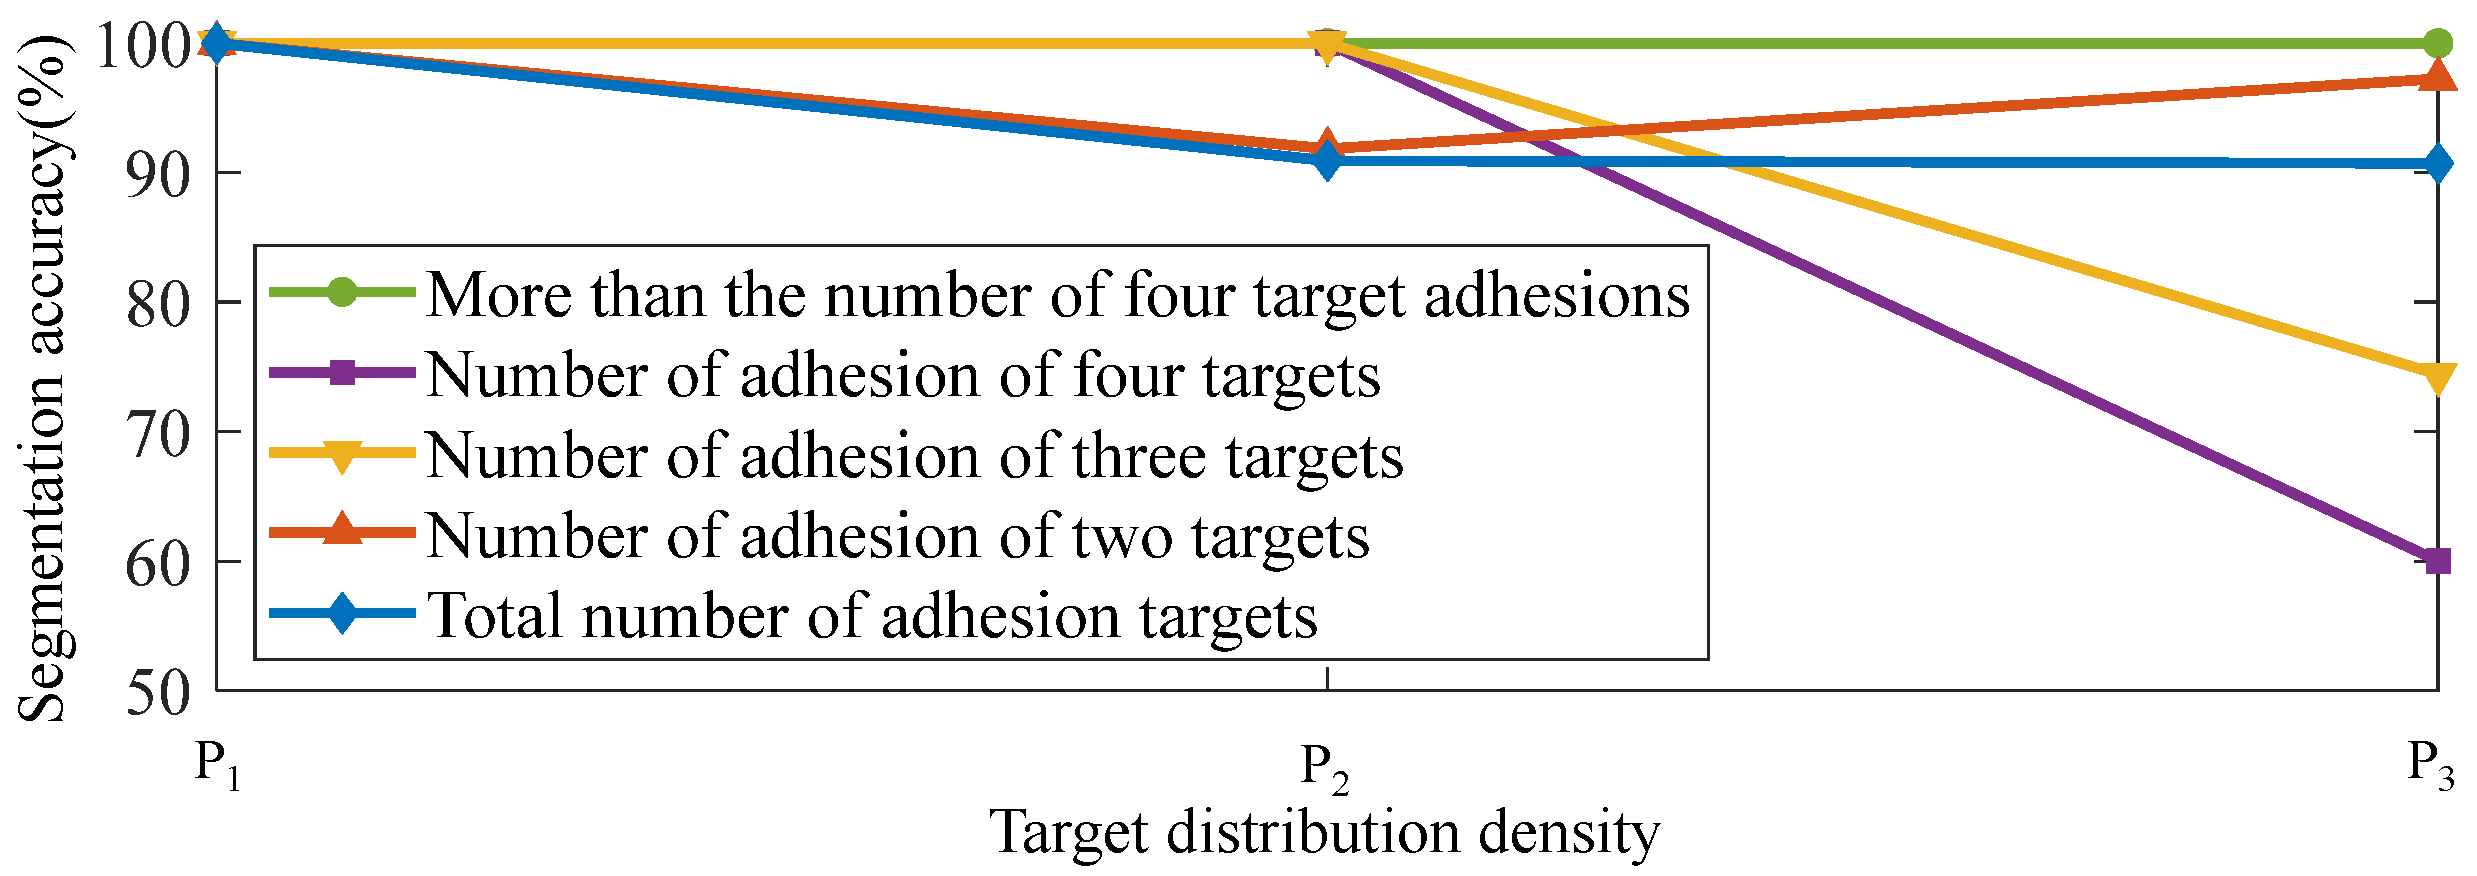
A pit detection and segmentation algorithm for overlapping and sticking targets is proposed. OLCA and CLCA are established, and conjugate lines detect pits. OLCA and CLCA detect CDECH and CDENCH, which can catch as many pits as possible. The minimum distance search method obtains the dividing line to complete the segmentation. The segmentation accuracy of the adhesion target was found to be 90.73%. It is especially suitable for the segmentation of double-target adhesion, and the highest segmentation accuracy reached 97.26%.
(3)
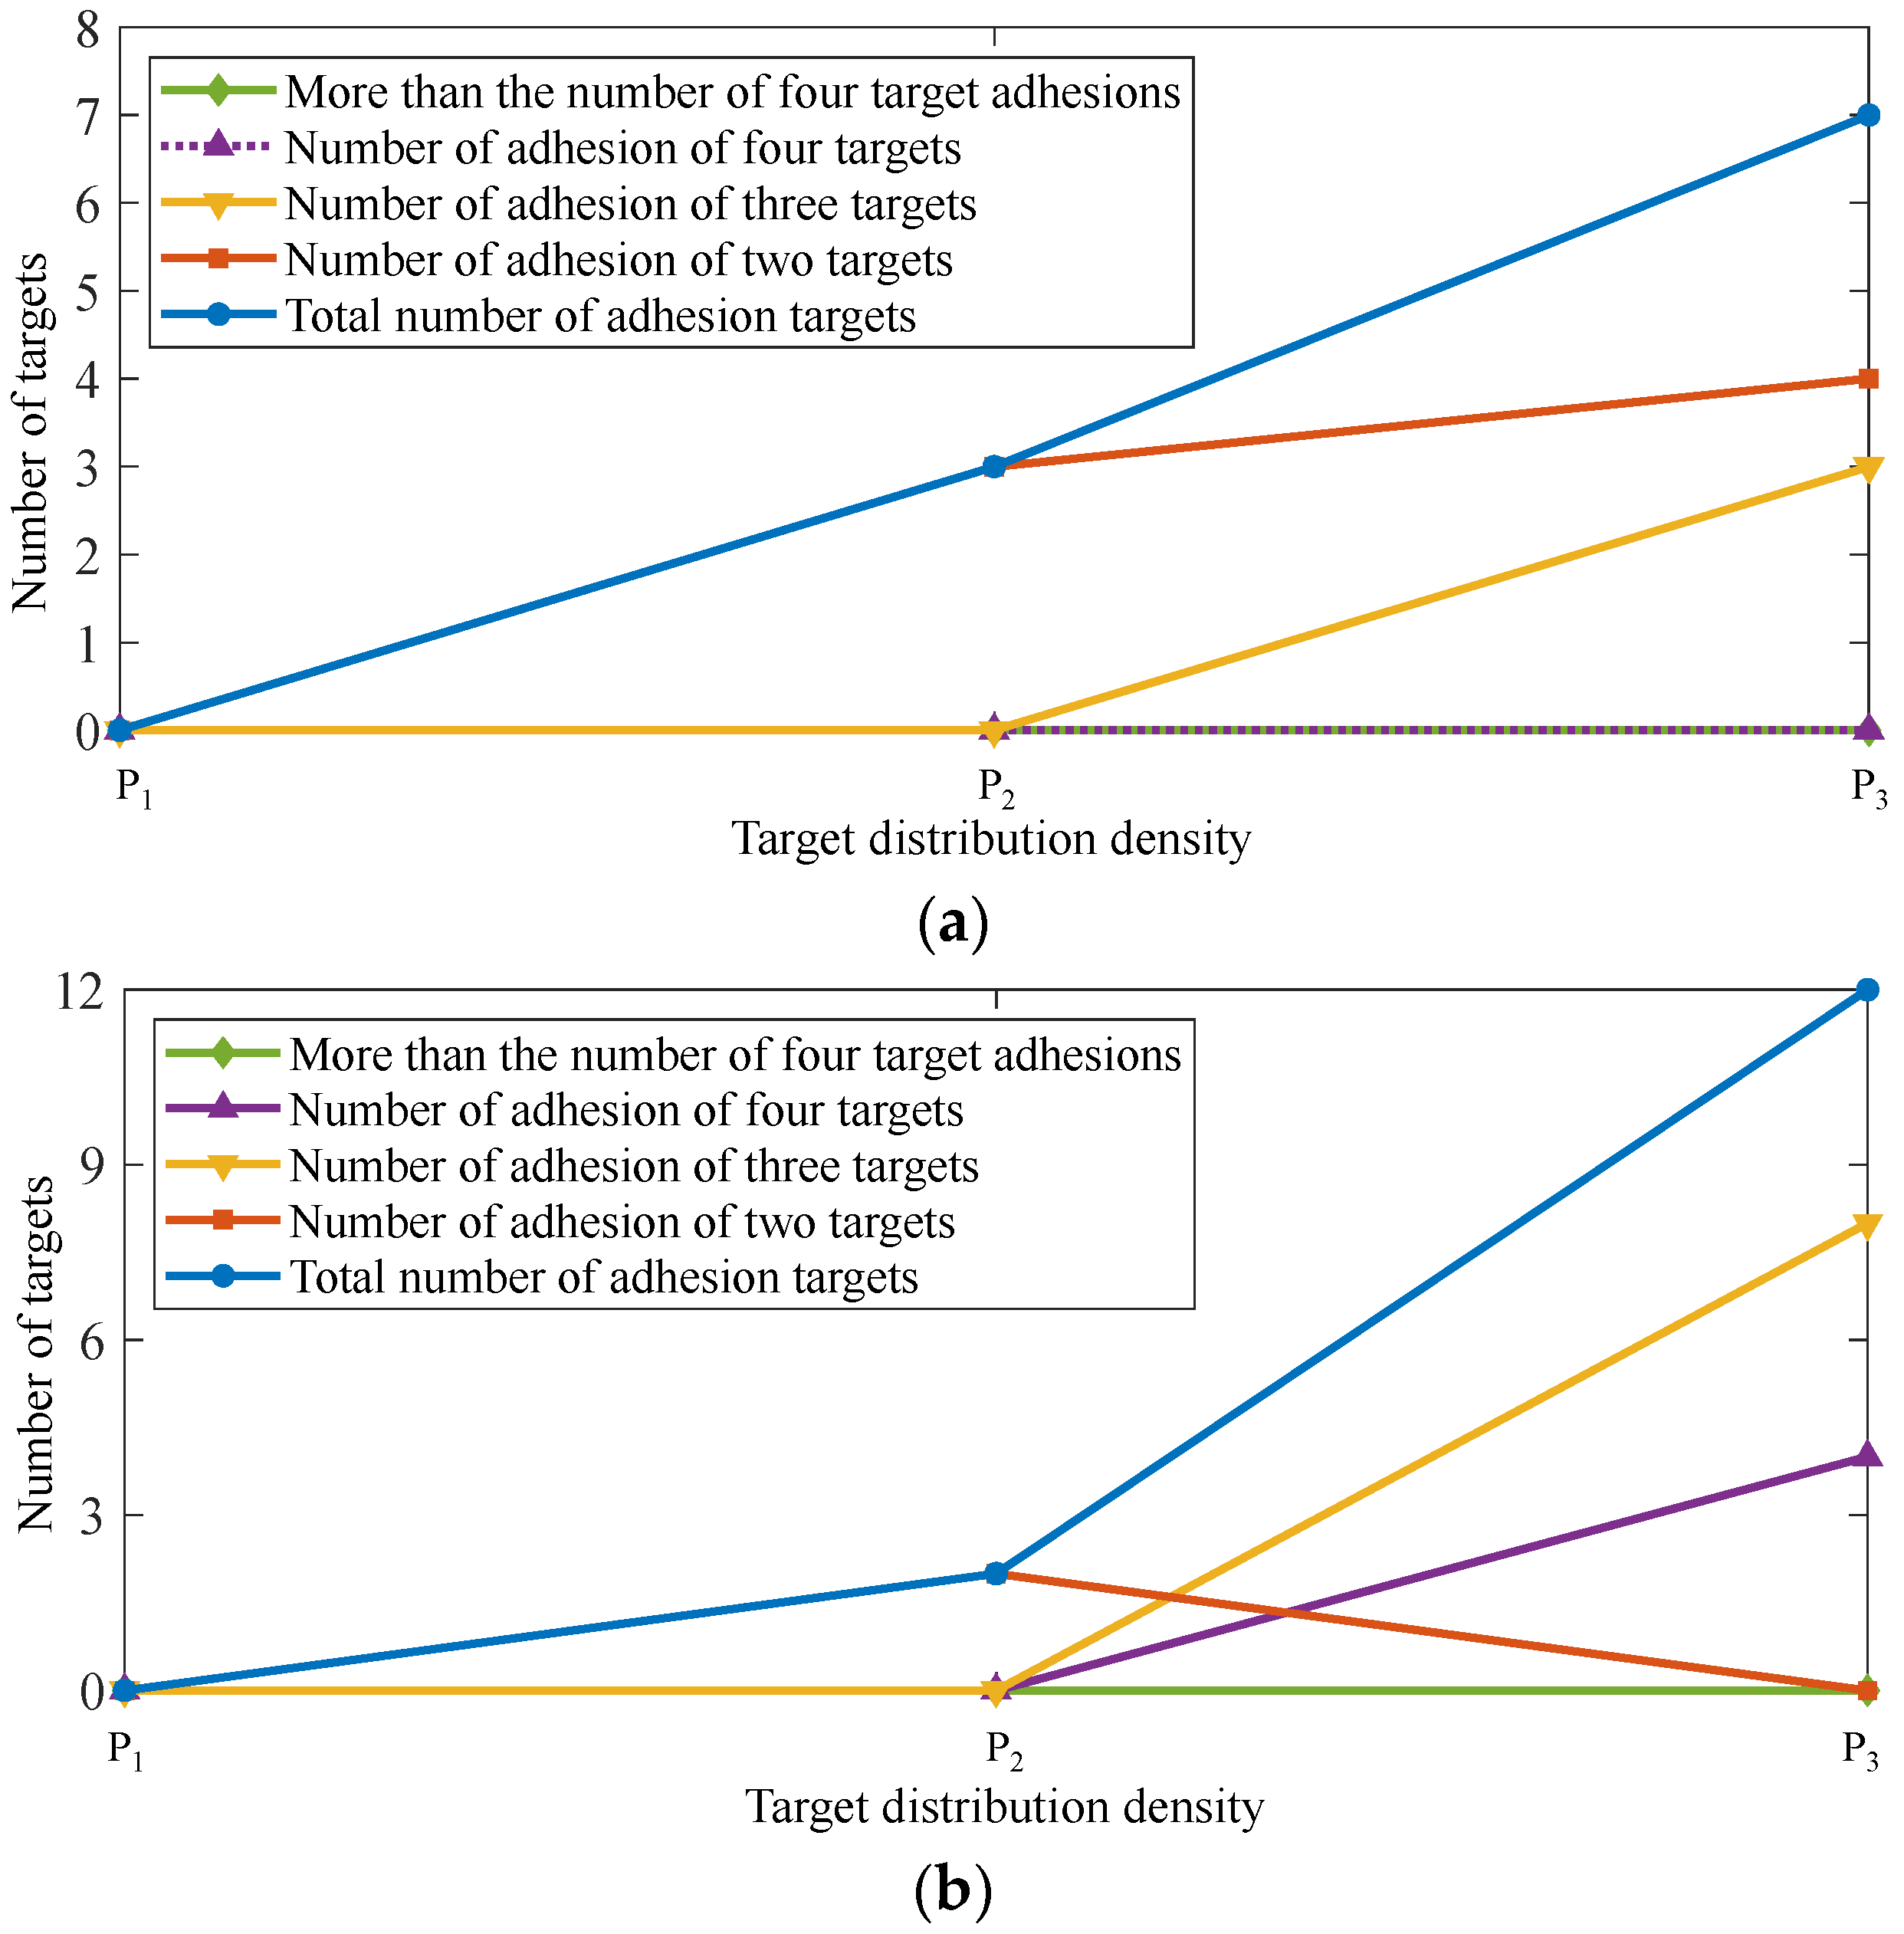
It is necessary to consider increasing the mechanism of pre-queuing coal and gangue to reduce the probability of overlapping and adhesion between large targets and small targets because the overlapping and adhesion of many large and small targets is the main factor that causes the low segmentation accuracy.

Author Contributions

L.H.: methodology, software, writing—original draft; Y.G.: conceptualization, writing—review and editing, funding acquisition; S.W.: software, writing—review and editing, funding acquisition. All authors have read and agreed to the published version of the manuscript.

Funding

This work was supported by Anhui Provincial University System Innovation Project (GXXT-2020-054).

Acknowledgments

We would also like to thank Anhui Zhongke Optoelectronic Color Sorter Machinery Co., Ltd. for providing an experimental platform for our research.

Conflicts of Interest

The authors declare that they have no known competing financial interests or personal relationships that could have influenced the work reported in this paper.

Abbreviations

OLAOpen-loop adhesion
CLAClosed-loop adhesion
OLCAOpen-loop crossover algorithm
CLCAClosed-loop crossover algorithm
CDECHConcave defects at the edge of the convex hull
CDENCHConcave defect at the edge of the non-convex hull
WAWatershed algorithm
DE-XRTDual-energy X-ray transmission

References

  1. Xie, Y.T.; Chi, X.W.; Li, H.Y.; Wang, F.W.; Yan, L.T.; Zhang, B.; Zhang, Q.J. Coal and Gangue Recognition Method Based on Local Texture Classification Network for Robot Picking. Appl. Sci. 2021, 11, 11495. [Google Scholar] [CrossRef]
  2. He, L.; Wang, S.; Guo, Y.C.; Hu, K.; Cheng, G.; Wang, X.Q. Study of raw coal identification method by dual-energy X-ray and dual-view visible light imaging. Int. J. Coal Prep. Util. 2022. [Google Scholar] [CrossRef]
  3. Liu, K.; Zhang, X.; Chen, Y.Q. Extraction of coal and gangue geometric features with multifractal detrending fluctuation analysis. Appl. Sci. 2018, 8, 463. [Google Scholar] [CrossRef]
  4. Guo, Y.C.; He, L.; Liu, P.Z.; Wang, X. Multi-dimensional analysis and recognition method of coal and gangue dual-energy X-ray images. J. China Coal Soc. 2021, 1, 300–309. [Google Scholar]
  5. Li, D.J.; Meng, G.Y.; Sun, Z.Y.; Xu, L.L. Autonomous Multiple Tramp Materials Detection in Raw Coal Using Single-Shot Feature Fusion Detector. Appl. Sci. 2021, 12, 107. [Google Scholar] [CrossRef]
  6. Shang, D.Y.; Wang, Y.W.; Yang, Z.Y.; Wang, J.J.; Liu, Y. Study on comprehensive calibration and image sieving for coal-gangue separation parallel robot. Appl. Sci. 2020, 10, 7059. [Google Scholar] [CrossRef]
  7. Li, M.; Duan, Y.; He, X.L.; Yang, M.L. Image positioning and identification method and system for coal and gangue sorting robot. Int. J. Coal Prep. Util. 2020, 42, 1759–1777. [Google Scholar] [CrossRef]
  8. Win, K.P.; Kitjaidure, Y.; Hamamoto, K.; Myo Aung, T. Computer-assisted screening for cervical cancer using digital image processing of pap smear images. Appl. Sci. 2020, 10, 1800. [Google Scholar] [CrossRef]
  9. He, L. Droplets Image Segmentation Method Based on Machine learning and Watershed. Converter 2021, 2021, 219–227. [Google Scholar]
  10. Cheng, P.; Liu, Y.K.; Gui, W.H.; Tang, Z.H.; Chen, Q. Bubble Image Segmentation Based on a Novel Watershed Algorithm With an Optimized Mark and Edge Constraint. IEEE Trans. Instrum. Meas. 2021, 71, 1–10. [Google Scholar]
  11. Sun, A.Y.; Jia, W.B.; Hei, D.Q.; Yang, Y.Y.; Cheng, K.; Li, J.T.; Wang, Z.L.; Tang, Y.J. Application of concave point matching algorithm in segmenting overlapping coal particles in X-ray images. Miner. Eng. 2021, 171, 107096. [Google Scholar] [CrossRef]
  12. Zhang, W.J.; Li, H.Q. Automated segmentation of overlapped nuclei using concave point detection and segment grouping. Pattern Recogn. 2017, 71, 349–360. [Google Scholar] [CrossRef]
  13. Tan, S.Y.; Ma, X.; Mai, Z.J.; Qi, L.; Wang, Y.W. Segmentation and counting algorithm for touching hybrid rice grains. Comput. Electron. Agric. 2019, 162, 493–504. [Google Scholar] [CrossRef]
  14. Bai, X.Z.; Sun, C.M.; Zhou, F.G. Splitting touching cells based on concave points and ellipse fitting. Pattern Recogn. 2009, 42, 2434–2446. [Google Scholar] [CrossRef]
  15. Bai, F.Y.; Fan, M.Q.; Yang, H.L.; Dong, L.P. Image segmentation method for coal particle size distribution analysis. Particuology 2021, 56, 163–170. [Google Scholar] [CrossRef]
  16. Ji, X.Q.; Li, Y.; Cheng, J.Z.; Yu, Y.H.; Wang, M.J. Cell image segmentation based on an improved watershed algorithm. In Proceedings of the 2015 8th International Congress on Image and Signal Processing (CISP), Shenyang, China, 14–16 October 2015. [Google Scholar]
  17. Wu, Y.; Wang, W.; Zhang, F.; Xiao, Z.T.; Wu, J.; Geng, L. Nanoparticle size measurement method based on improved watershed segmentation. In Proceedings of the 2018 International Conference on Electronics and Electrical Engineering Technology, Tianjin, China, 19–21 September 2018; pp. 232–237. [Google Scholar]
  18. Liang, X.M.; Tian, T.; Liu, W.T.; Niu, F.S. Flotation froth image segmentation based on highlight correction and parameter adaptation. Min. Metall. Explor. 2020, 37, 467–474. [Google Scholar] [CrossRef]
  19. Zhu, Q.D.; Liu, B.B.; Li, Y. Stacked Particle Size Measurement Method Based on Data Processing. In Proceedings of the 2019 Chinese Automation Congress (CAC), Hangzhou, China, 22–24 November 2019. [Google Scholar]
  20. Perkins, J.; Williams, O.; Wu, T.; Lester, E. Automated image analysis techniques to characterise pulverised coal particles and predict combustion char morphology. Fuel 2020, 259, 116022. [Google Scholar] [CrossRef]
  21. Furat, O.; Wang, M.Y.; Neumann, M.; Petrich, L.; Weber, M.; Krill III, C.E.; Schmidt, V. Machine learning techniques for the segmentation of tomographic image data of functional materials. Front. Mater. 2019, 6, 145. [Google Scholar] [CrossRef]
  22. Furat, O.; Leißner, T.; Ditscherlein, R.; Šedivý, O.; Weber, M.; Bachmann, K.; Schmidt, V. Description of ore particles from X-ray microtomography (XMT) images, supported by scanning electron microscope (SEM)-based image analysis. Microsc. Microanal. 2018, 5, 461–470. [Google Scholar] [CrossRef]
  23. Wang, Z.; Li, D.Y.; Zheng, X.; Xie, D.D. A Novel Coal Dust Characteristic Extraction to Enable Particle Size Analysis. IEEE Trans. Instrum. Meas. 2021, 70, 1–12. [Google Scholar] [CrossRef]
  24. Farhan, M.; Yli-Harja, O.; Niemistö, A. A novel method for splitting clumps of convex objects incorporating image intensity and using rectangular window-based concavity point-pair search. Pattern Recogn. 2013, 46, 741–751. [Google Scholar] [CrossRef]
  25. Lin, X.M.; Chen, Y.B. Application of concave point matching algorithm in rice image segmentation. J. Qujing Norm. Univ. 2018, 3, 36–39. [Google Scholar]
  26. Zhang, R.H.; Wu, J. Segmentation algorithm of adherent cells based on edge chain code information. J. Beijing Inst. Technol. 2013, 7, 747–753. [Google Scholar]
  27. Bai, Y.F.; Yang, M.L.; Zhang, X.; Lin, J. Concave matching segmentation algorithm for multi-bee overlapping images. Chin. J. Agric. Chem. 2020, 6, 188–193. [Google Scholar]
  28. Sklansky, J. Finding the convex hull of a simple polygon. Pattern Recogn. Lett. 1982, 2, 79–83. [Google Scholar] [CrossRef]
  29. Zhang, B.Q.; Qiu, Y.L.; Wang, X.Y.; Lu, H.S.; Wang, F.J. Research on the Method of Individual Identification of Chickens Based on Depth Image. J. Phys. Conf. Ser. 2020, 1631, 012018. [Google Scholar] [CrossRef]
  30. Gao, H.; Zhen, T.; Li, Z.H. Overview of segmentation methods of conglutinated particle images. Chin. J. Cereals Oils 2022, 37, 1–14. [Google Scholar]
  31. Wu, K. Image segmentation of conglutinated rocks combining level set and watershed. Inf. Commun. 2018, 3, 141–142. [Google Scholar]
  32. He, L.; Wang, S.; Guo, Y.C.; Cheng, G.; Hu, K.; Zhao, Y.Q.; Wang, X. Multi-scale coal and gangue dual-energy X-ray image concave point detection and segmentation algorithm. Measurement 2022, 196, 111041. [Google Scholar] [CrossRef]
Figure 1. Principle of the dual-energy X-ray transmission (DE-XRT) detection system.
Applsci 12 09850 g001
Figure 2. Mengziyu coal mine.
Applsci 12 09850 g002
Figure 3. Types of adhesion and concave defects: (a) Open-loop adhesion (OLA), (a1) Binary image, (a2) Convex hull binary image, (a3) Concave defect binary image, (a4) Binary image of concave defect after deleting small area. (b) Closed-loop adhesion (CLA), (b1b4) Same as (a1a4), (c) OLA, and CLA.
Applsci 12 09850 g003
Figure 4. Area distribution of concave defect pixel.
Applsci 12 09850 g004
Figure 5. Image processing process: (a) Convex hull binary image, (b) Convex hull edge binary image, (c) Concave defect binary image, (d) Binary image of concave defect edge, (d1d4) The (d) separate connected domain image, (e1e4) Figure 5d1–d4 minus the result of Figure 5b.
Applsci 12 09850 g005
Figure 6. Principle of open-loop crossover algorithm (OLCA). (a) Constraint principle with front and back points on the same side. (b) Principle of the distance constraint condition.
Applsci 12 09850 g006
Figure 7. The flow chart of the OLCA algorithm.
Applsci 12 09850 g007
Figure 8. Principle of closed-loop crossover algorithm (CLCA).
Applsci 12 09850 g008
Figure 9. The flow chart of the CLCA algorithm.
Applsci 12 09850 g009
Figure 10. Analysis of the reasons for the existence of false pits: (a) Extract that number of pixel in an area of 11 × 11 centered on a pit, (b) False pits on both sides near the true pits.
Applsci 12 09850 g010
Figure 11. Single pit dividing line acquisition process.
Applsci 12 09850 g011
Figure 12. Flow chart of the algorithm in this paper.
Applsci 12 09850 g012
Figure 13. Pit detection results: (ad) Visualization of Conjugate Detection pit Process, (e) Pit detection result. The bright green straight line in (b) and the bright green pit in (e) represent the additional detection effect of conjugate lines.
Applsci 12 09850 g013
Figure 14. Results of pit detection and segmentation: (a) Two adhesions, (b) Three adhesions, (c) Four adhesions, (d) More than four adhesions, (e) CLA. A bright green “+” indicates more detected pits in the CLA target.
Applsci 12 09850 g014aApplsci 12 09850 g014b
Figure 15. Distribution of adhesion targets.
Applsci 12 09850 g015
Figure 16. Accuracy of image segmentation.
Applsci 12 09850 g016
Figure 17. Segmentation results: (a) Over-segmentation result, (b) Under-segmentation result.
Applsci 12 09850 g017
Figure 18. Error segmentation target: (a) Too many pits are detected, resulting in over-segmentation, (b) A pit detection error or a minimum distance finding error results in a segmentation error.
Applsci 12 09850 g018
Table 1. Segmentation results in overlapping and adhesion targets.
Comparison of Segmentation MethodsAdhesion Target2-Adhesion3-Adhesion4-Adhesion>4-AdhesionCLA
Method 1Total27412710331134
Correct203102781853
Over-segmentation401416551
Under-segmentation31119830
Accuracy %74.0880.3175.7258.0138.4675
Method 2Correct17784721741
Over-segmentation513211530
Under-segmentation461120963
Accuracy %64.5966.1469.9054.8330.7625
Method 3Correct232122871852
Over-segmentation751100
Under-segmentation350151282
Accuracy %84.6796.0684.4658.0138.4650
Method 4Correct2501239324103
Over-segmentation641101
Under-segmentation1809630
Accuracy %91.2496.8590.2977.4276.9275
Publisher’s Note: MDPI stays neutral with regard to jurisdictional claims in published maps and institutional affiliations.

