1. Introduction
Currently, automation systems are used in areas of the economy, industry and many others. More advanced integrated systems consisting of vision systems—supported by artificial neural networks—are used in medicine, assisting doctors in diagnosis by recognizing pathological changes in the cells of the human body [
1,
2,
3]. As a consequence of the continuous improvement in the parameters of devices and due to the availability of faster and more effective methods of image analysis, the use of vision systems has become more and more common. Depending on the type of the observed object, various advanced methods of location and identification are used. The following techniques are used to locate objects in static images: segmentation, image indexing technique, determining the location of objects by the method of geometric moments or with the use of neural networks [
4,
5,
6].
The use of various types of algorithms in classification, identification and recognition tasks is widely researched. Experiments carried out all over the world are aimed at finding innovative and, above all, effective solutions. A decisive additional stimulus is related to the constant development of technology and science, particularly in the aspect of deep learning applications utilized in many areas of life.
Classifiers based on multilayer and deep neural networks, especially Convolutional Neural Networks (CNNs) in medical applications such as skin cancer diagnosis and analysis of histopathological images in classifying the occurrence of breast cancer, have been successfully presented in the articles [
1,
3]. However, this is not the only application of this approach in medicine. The article [
2] presents an image classifier for diagnosing various disease states, in which the application of a convolutional neural network algorithm on a chest X-ray dataset to classify pneumonia was investigated. Another example of the use of the artificial neural network approach in biomedical applications is the analysis and classification of the electroencephalographic signal in the Brain–Computer Interfaces. The works [
7,
8,
9] describe, inter alia, an example of a classifier of mental commands in a mobile robot control task. The main features were obtained with numerous types of neural networks, which performed well in such tasks.
Another interesting research in the field of classification is the recognition of Korean license plates. The problem has been examined using a system based on deep neural networks. The article [
10] presents a novel deep learning system that achieves a very high recognition accuracy of 98.94%. Other studies also demonstrate the effectiveness of various classification systems. They are related to symbol recognition, engineering drawing, sonar images, as well as music classification or innovative approaches to the detection of malware [
5,
11,
12,
13,
14,
15,
16,
17,
18,
19,
20,
21,
22,
23].
In addition, an interesting study is [
24], which includes the assessment of image quality without reference. This is performed using convolutional neural networks and decision fusion. The intention of the research is to stipulate that a diverse set of different types of networks can characterize genuine image distortions. The experimental results have demonstrated the effectiveness of the perceptual image quality estimation on four large IQA (image quality assessment) comparison databases containing genuine or artificial distortions. Other scientific work that significantly develops the classification problem is [
25]. This study described research on object detection and shaft surface defect analysis during metal polishing based on deep learning of convolutional neural networks.
The important role of the neural model approach in terms of control issues cannot be ignored, both taking into account simulation issues and real systems. Numerous applications of algorithms involving neural networks were discussed in works [
26,
27,
28]. The research reported in these articles is related to neural control of a dynamic and highly non-linear object, as well as the control of robotics systems. In addition, ref. [
29] describes the results of research into the neural network control of non-linear discrete-time systems.
The aim of the work is to assess the effectiveness of neural network learning algorithms in comparison with the classic identification method in the example of recognizing notes on a treble staff. The study will focus on identifying musical notes that will be written in several variants. The main element of the system will be a reconfigurable FPGA (field-programmable gate array) system. The work plan has been divided into sections that will enable the reader to effectively understand the examined problem and to know the achieved results.
In this work, the main target is to prove the effectiveness of simple structures of artificial neural networks in the classification of selected notes in musical notation. This type of research is a valuable introduction to in-depth and extensive research of the complex sets of symbols used to record music. A valuable aspect of this article is the comparison of neural networks with the classic algorithm, which is based on various types of operations performed on the image. Additional content will also cover a study based on modeling the data distribution density by probabilistic principal component analysis. The main core of the research will be the comparison of the radial neural network with the proprietary algorithm.
Such research can make a significant contribution in many ways. For example, they can lead to the design of a complex system that reads musical notation, which will be able to support people learning to play the instruments or learning to sing. It is also a potential opportunity for systems supporting the blind in reading music. In addition, this type of research can develop systems that read notes and then convert them into appropriate sounds and, finally, entire pieces of music.
The article is presented in the following order. In
Section 3, issues in the field of digital processing and methods of computer image analysis are presented.
Section 4 aims to present the problem of reading musical notes and its possible solutions. The next chapter describes the issues related to neural networks and the classic algorithm based on an expert approach.
Section 6 describes the tests that were performed and the results achieved. In the final section of the paper, the results of the classification are discussed.
2. Related Works
The use of neural network models in various operations based on music files and music notation has been studied many times, as it is a rather interesting research problem. The paper [
30] presents the most modern Deep Neural Network (DNN) models for music classification, and the performance of the models was assessed using spectrograms. Music audio files were converted into spectrograms by modal transformation and then classified by deep learning. The performance of different DNN models in the classification of music was compared. Similarly, in [
5], the use of complex CNNs for various machine learning tasks using very small filters for music classification is discussed. Therefore, it undoubtedly forms an issue similar to the area explored in this article, as it concerns the broadly understood issues of classification related to music. The article [
31] introduces a neural network-based backpropagation application using audio function extraction to classify gamelan notation. The study proposes an analysis based on the sonic classification of gamelan musical instruments. It was carried out using the data mining technique using the backward error propagation neural network (BPNN) method. The problem of applying neural network algorithms in music analysis was also presented in the research [
6]. Researchers used computer technology to minimize artificial factors in the automatic composition process. The program is designed to control the generation of a sequence of notes, then compose a melody, and finally get a complete musical score. The results demonstrated that the new neural network-based automatic synthetic music algorithm is quite practical. The experiment also utilized the process of music note recognition using a neural network. It is, therefore, a similar approach as used in the present article.
The paper [
32] presents valuable research on deep learning and intelligent swarm algorithms for image-based cancer recognition and diagnosis. Popular deep learning architectures and intelligent algorithms used for cancer diagnosis were developed. In addition, the publication includes a survey on research that uses deep learning and intelligent swarm algorithms to diagnose cancer in their structures. On the other hand, in [
33], the adaptation of the convolutional hyperparameters of neural networks using a modified firefly algorithm and its application to the classification of the severity of glioblastoma is studied. Moreover, paper [
34] proposes the optimization of fuzzy brain-storm for the segmentation and classification of medical images, which is a combination of fuzzy optimization and brain-storm techniques. Optimized brain-storm focuses on cluster centers and gives them the highest priority. It is, therefore, possible to approach the local optima like any other swarm algorithm.
In the study [
4], the speech/music classification using the visual and spectral functions of the chromatogram was performed. The paper proposes the use of textural and spectral features of the chromatogram for the classification of speech and music. Experiments with the Support Vector Machine Classifier showed interesting results, proving that chromatogram texture descriptors outperform other state-of-the-art approaches.
In article [
35], an approach to object detection based on synthetic energy maps and watershed transformations called the Deep Watershed Detector (DWD), was introduced. The above-mentioned method is dedicated to the analysis of high-resolution images that contain a large number of very small objects. Due to these advantages, it is capable of processing full pages of stored music. This study also covers the results of detecting popular musical symbols. Moreover, the ability of DWD to work with synthetic scores and with handwritten music was tested.
In the article [
36], the U-Net architecture for semantic segmentation presented in combination with a trivial detector provides a high level of reference for the musical data analysis task. The improved detection performance was obtained by integrating the networks into an OMR stream. The base score was obtained for inferring the pitch in handwritten music with an f-score of 0.81.
Paper [
37] presents a deep learning architecture called the Convolutional Sequence-to-Sequence model. The model was trained and tested on a set of human-generated data with different image extensions based on real-world scenarios. As a result of the conducted experiments, the accuracy of pitch recognition at the level of 81% and the accuracy of the duration at the level of 94% were achieved, which gives the accuracy of the note level of 80%.
Article [
38] contains the results of research on the automatic classification of audio tracks into musical genres. Attempts have been made to achieve recognition accuracy at the human level through rapid training and classification. The use of a Radial Basis Network (RBF) helped to achieve this goal. This was possible by using a combination of unsupervised and supervised initialization methods. Based on the results achieved in work [
38], we also decided to check the capabilities of the RBF network in this study. Further research in this area will certainly require the use of other neural networks. This will help to develop and test the effectiveness of different applications.
3. Prototype and Design of the Device
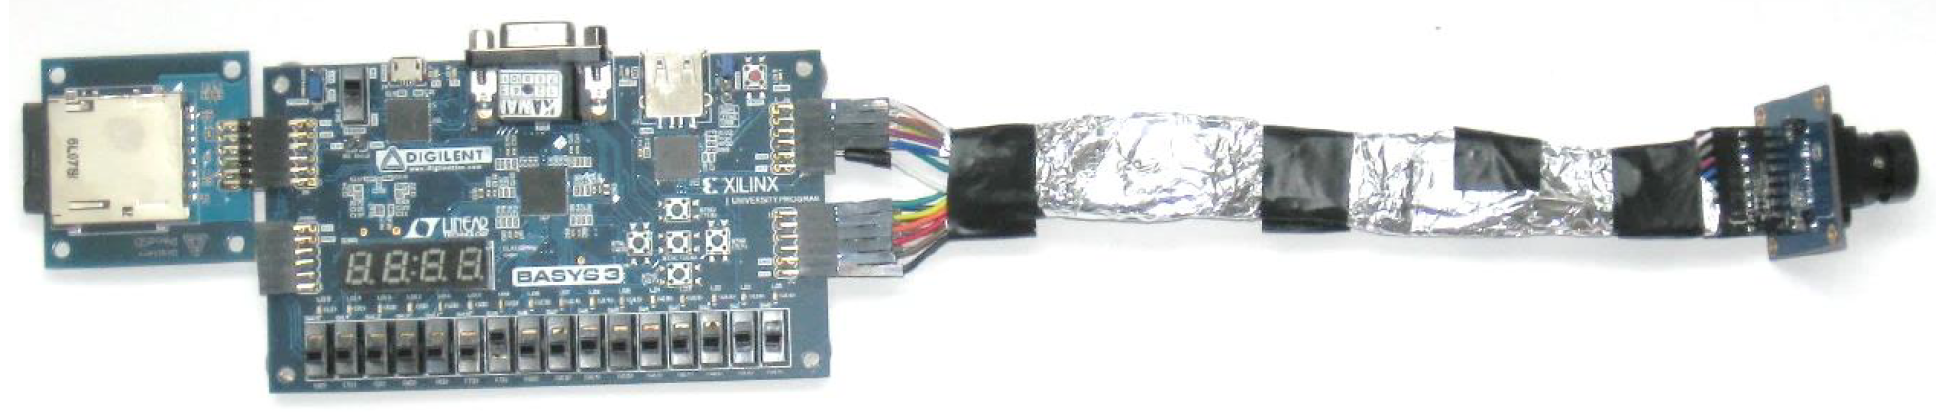
In this study, we used a self-designed and built proprietary device. It is a portable, independent structure that allows the identification of symbols of musical notation placed on the staff. It should also allow the user to generate a pdf or midi file of the recognized music notation. The prototype of the device is shown in
Figure 1.
A low-budget OV7670 camera module was used as the scanner for image acquisition, and it was equipped with a CMOS sensor with a size of 0.3 Mpx and a resolution of 640 × 480 pixels. To meet the functional requirements of the device, the Basys3 educational set by Digilent was used. The set includes analog and digital I/O ports, VGA (Video Graphics Array) output, USB port, built-in JTAG (Joint Test Action Group) programmer, buttons, switches, 16 luminescent diodes and fast memory. The key element of the set, responsible for communication between components and performing mathematical operations, is the programmable digital Artix-7 FPGA circuit [
40].
The image obtained from the camera in accordance with the RGB565 format was downloaded in two clock cycles to two variables with a 16-bit data type. In order to display it on the monitor via 12-bit VGA output, the image has been converted to RGB444 format.
Black objects on a white background were to be identified; the color image was replaced with a grayscale image. The marking of objects appearing in the image was performed by thresholding the pixel values relative to the value of the previous image-reading iteration. The reading was to be interrupted when the entire object appeared in the lens. The identified image should have a resolution of 90 × 240 pixels. In order to obtain the best quality samples, the acquired grayscale image was filtered and then binarized, thus obtaining a black and white image. The samples prepared in this way are identified by the neural network. The response of the network is the numerical equivalent of the recognized image on the basis of which the output image or sound is generated.
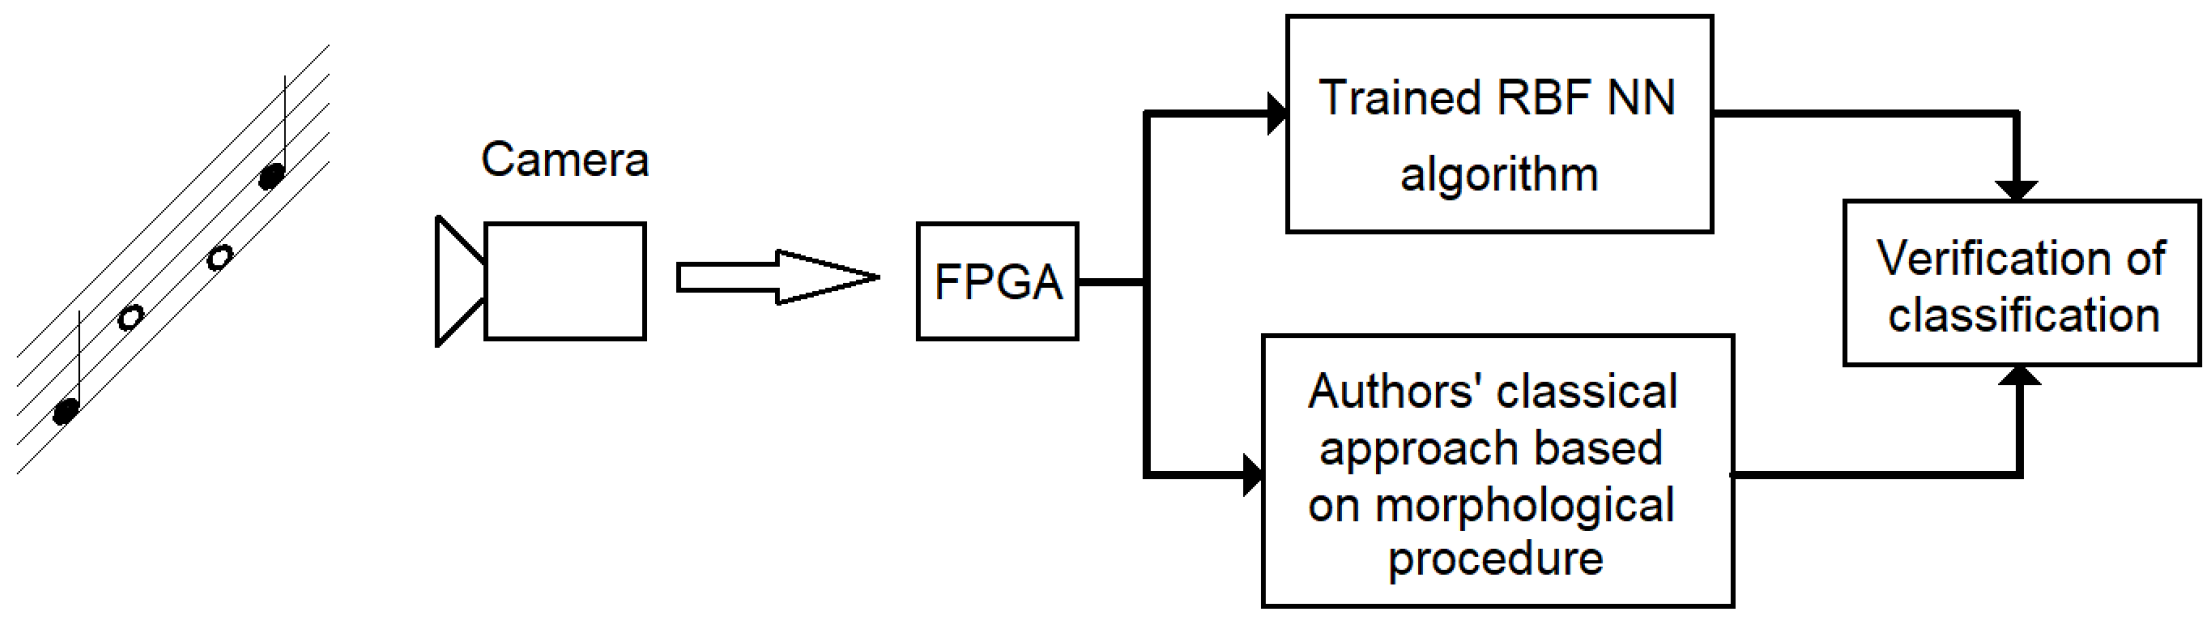
The most common method of using a neural network on a field-programmable gate array system, recommended in the literature, was to load an array of weights or the entire learned neural network, rather than teaching it from the level of a digital system. The RBF neural network was used to recognize musical notation symbols. The preparation of learning sets, the learning process and tests were carried out in the Matlab environment with the use of Netlab libraries. The code in the VHDL hardware description language of the neural network model was generated using the “HDL Coder” tool available in the Matlab environment. The methodology of using the developed hardware layer in the musical notation classification task can be presented in the flowchart depicted in
Figure 2.
Section 4 is intended to introduce the issues of reading notes as an image recognition task and describe possible solutions in this regard.
4. Reading Musical Notes as an Image Recognition Task and Its Possible Solutions
This chapter will introduce the reader to the topic of reading notes in the context of the image recognition task. Possible solutions will also be presented.
4.1. Problem Related to Reading Notes
Considering the fact that musical notation is performed in the form of black characters on a white background, a sufficiently processed image will be a grayscale image or even a binary black and white image. Further, limiting the area of the recognized image to the height of one staff significantly reduces the amount of memory area occupied and thus, the computational complexity. In the image prepared in this way, the position of the musical notation marks can be distinguished using an algorithm that denotes the change in the arithmetic mean value of individual columns and rows describing the pixel positions.
The isolation of objects in the image does not pose a major problem, whereas the identification of the symbol itself becomes problematic. This is due to the homogeneity of the images. Regardless of the position of the same note at different heights of the treble staff, the mathematical representation of the image has almost identical values.
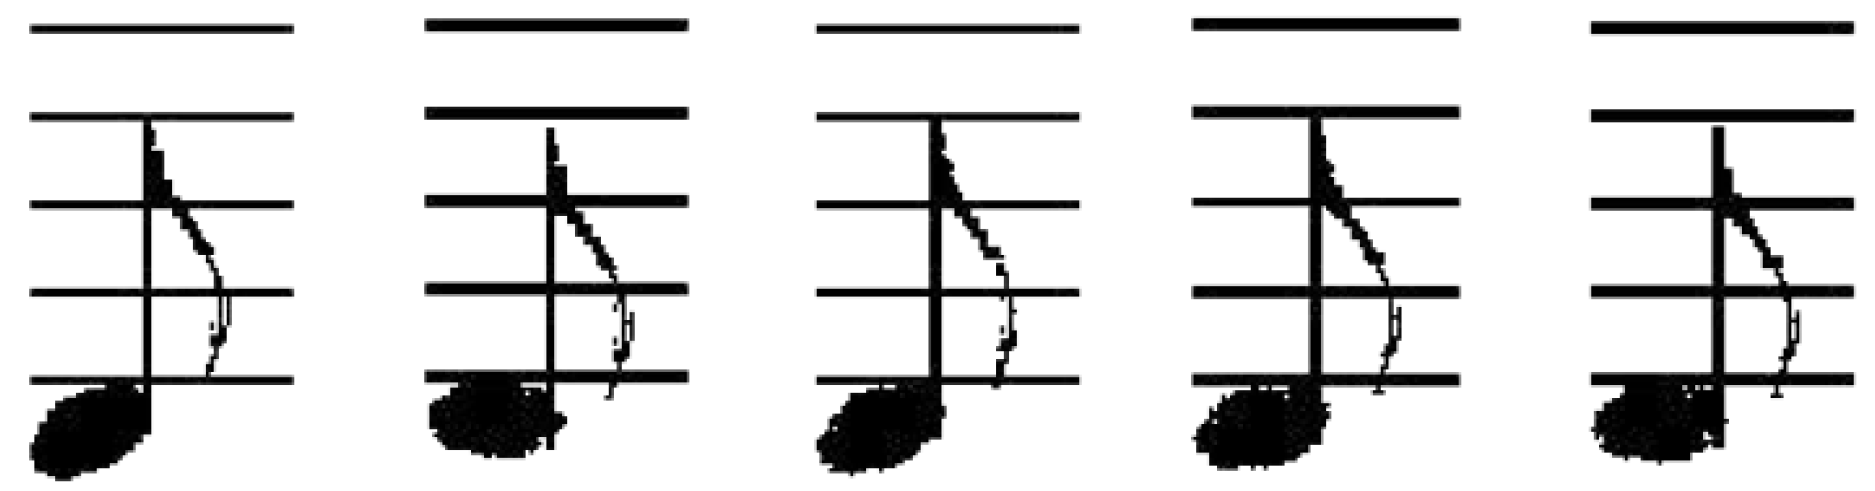
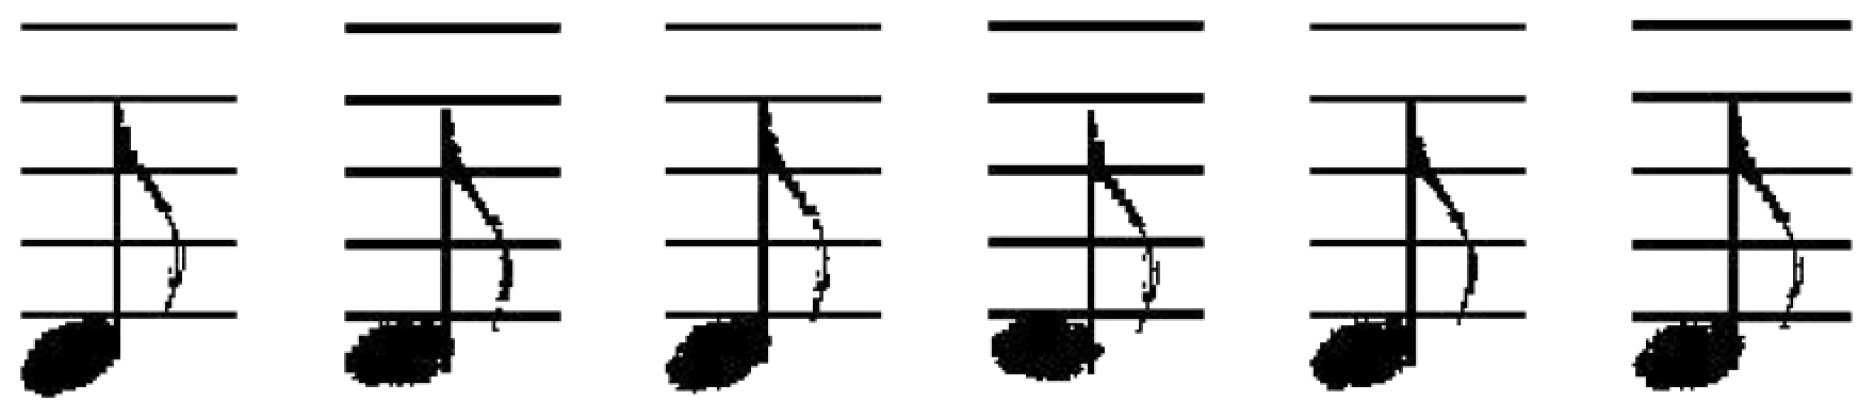
It was assumed that the neural network must identify single symbols of musical notation appearing at the network inputs. Thus, for network learning, images containing single symbols were prepared with distortions in the form of symbol deformation, as shown in
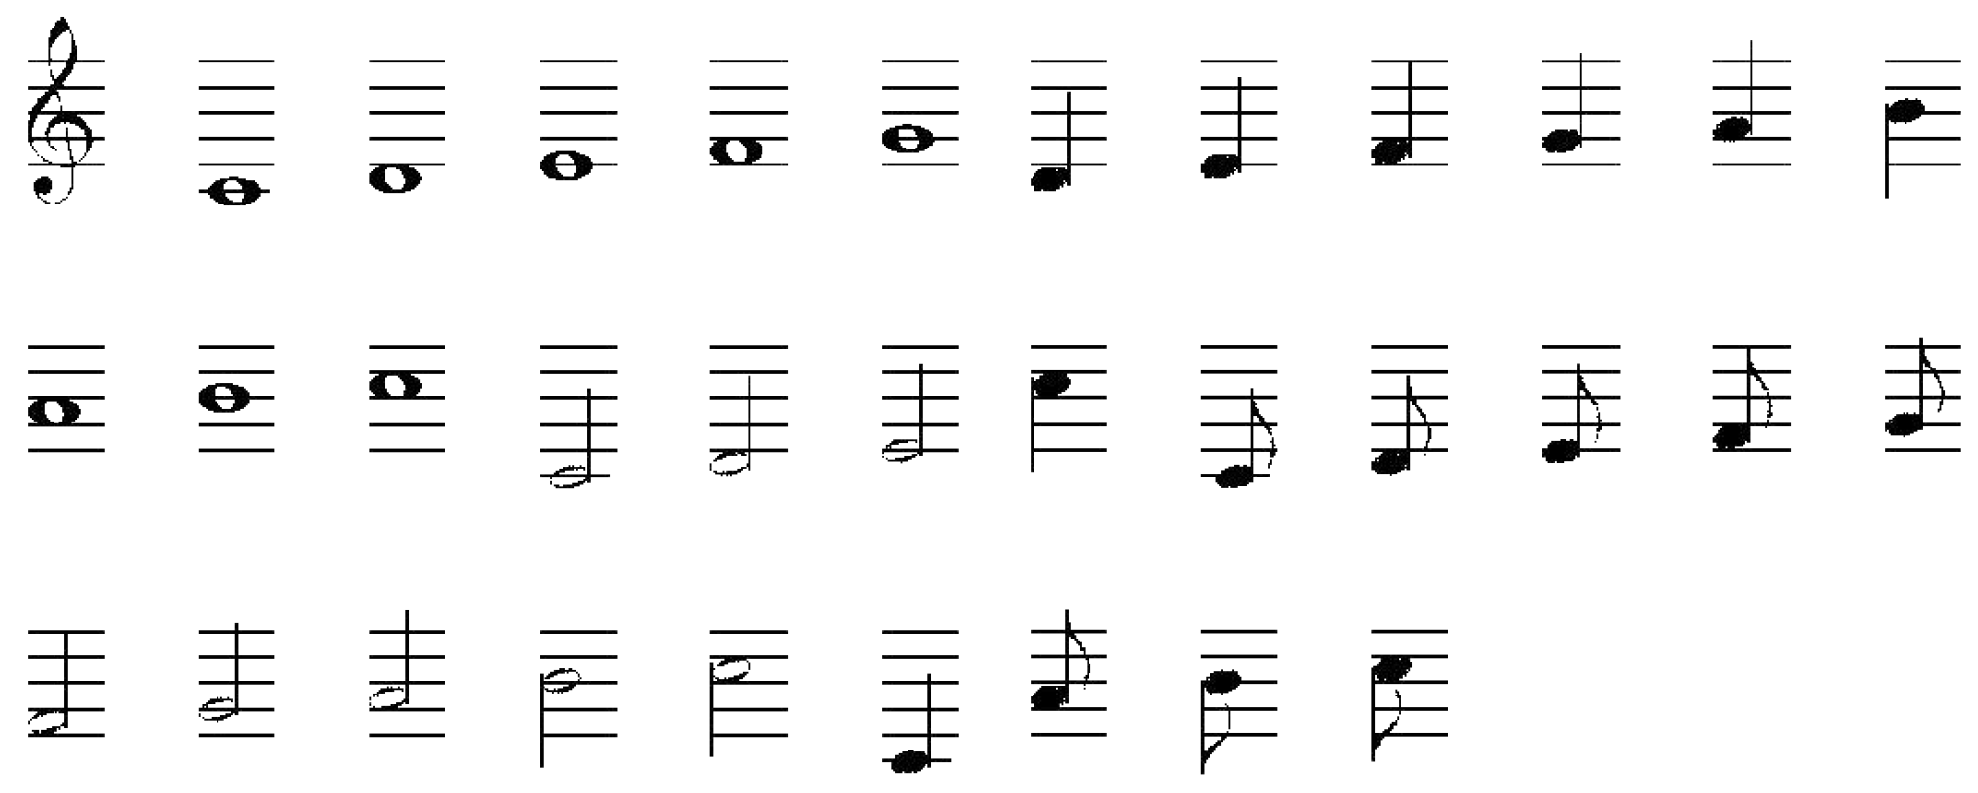
Figure 3, and as output patterns, target symbols without interference. They are shown in
Figure 4. For the purposes of this research, the patterns of symbols such as the treble clef and the whole note, half note, crotchet and eighth note were made in all positions of the scale. For each symbol, 37 images of distorted patterns were generated, and the final size of the patterns was set to 90 × 240 pixels.
In the case of designing the classical image identification algorithm, only the model symbols of musical notation from
Figure 4 were used.
4.2. Preparation of Pattern Images of Music Notes
The paper presents research for grayscale image patterns in a binary form and for patterns in the form of arithmetic mean values of these images. For images in binary form, samples were derived on the basis of patterns in which the pixels were described with the values “0, 1” and “−1, 1”.
The preparation of the patterns started with taking the images in the RGB color palette and the dimensions corresponding to the images seen with the camera lens. Due to the chromatic nature of the identified objects, the images were converted to grayscale, and by applying the thresholding operation, images were obtained in binary form, described with the values “0” and “1”. The change of the value from “0” to “−1” was carried out iteratively over all pixels of the image. In the pictures prepared in this way, symbols of musical notation, as well as their location and size, have been separated and labeled.
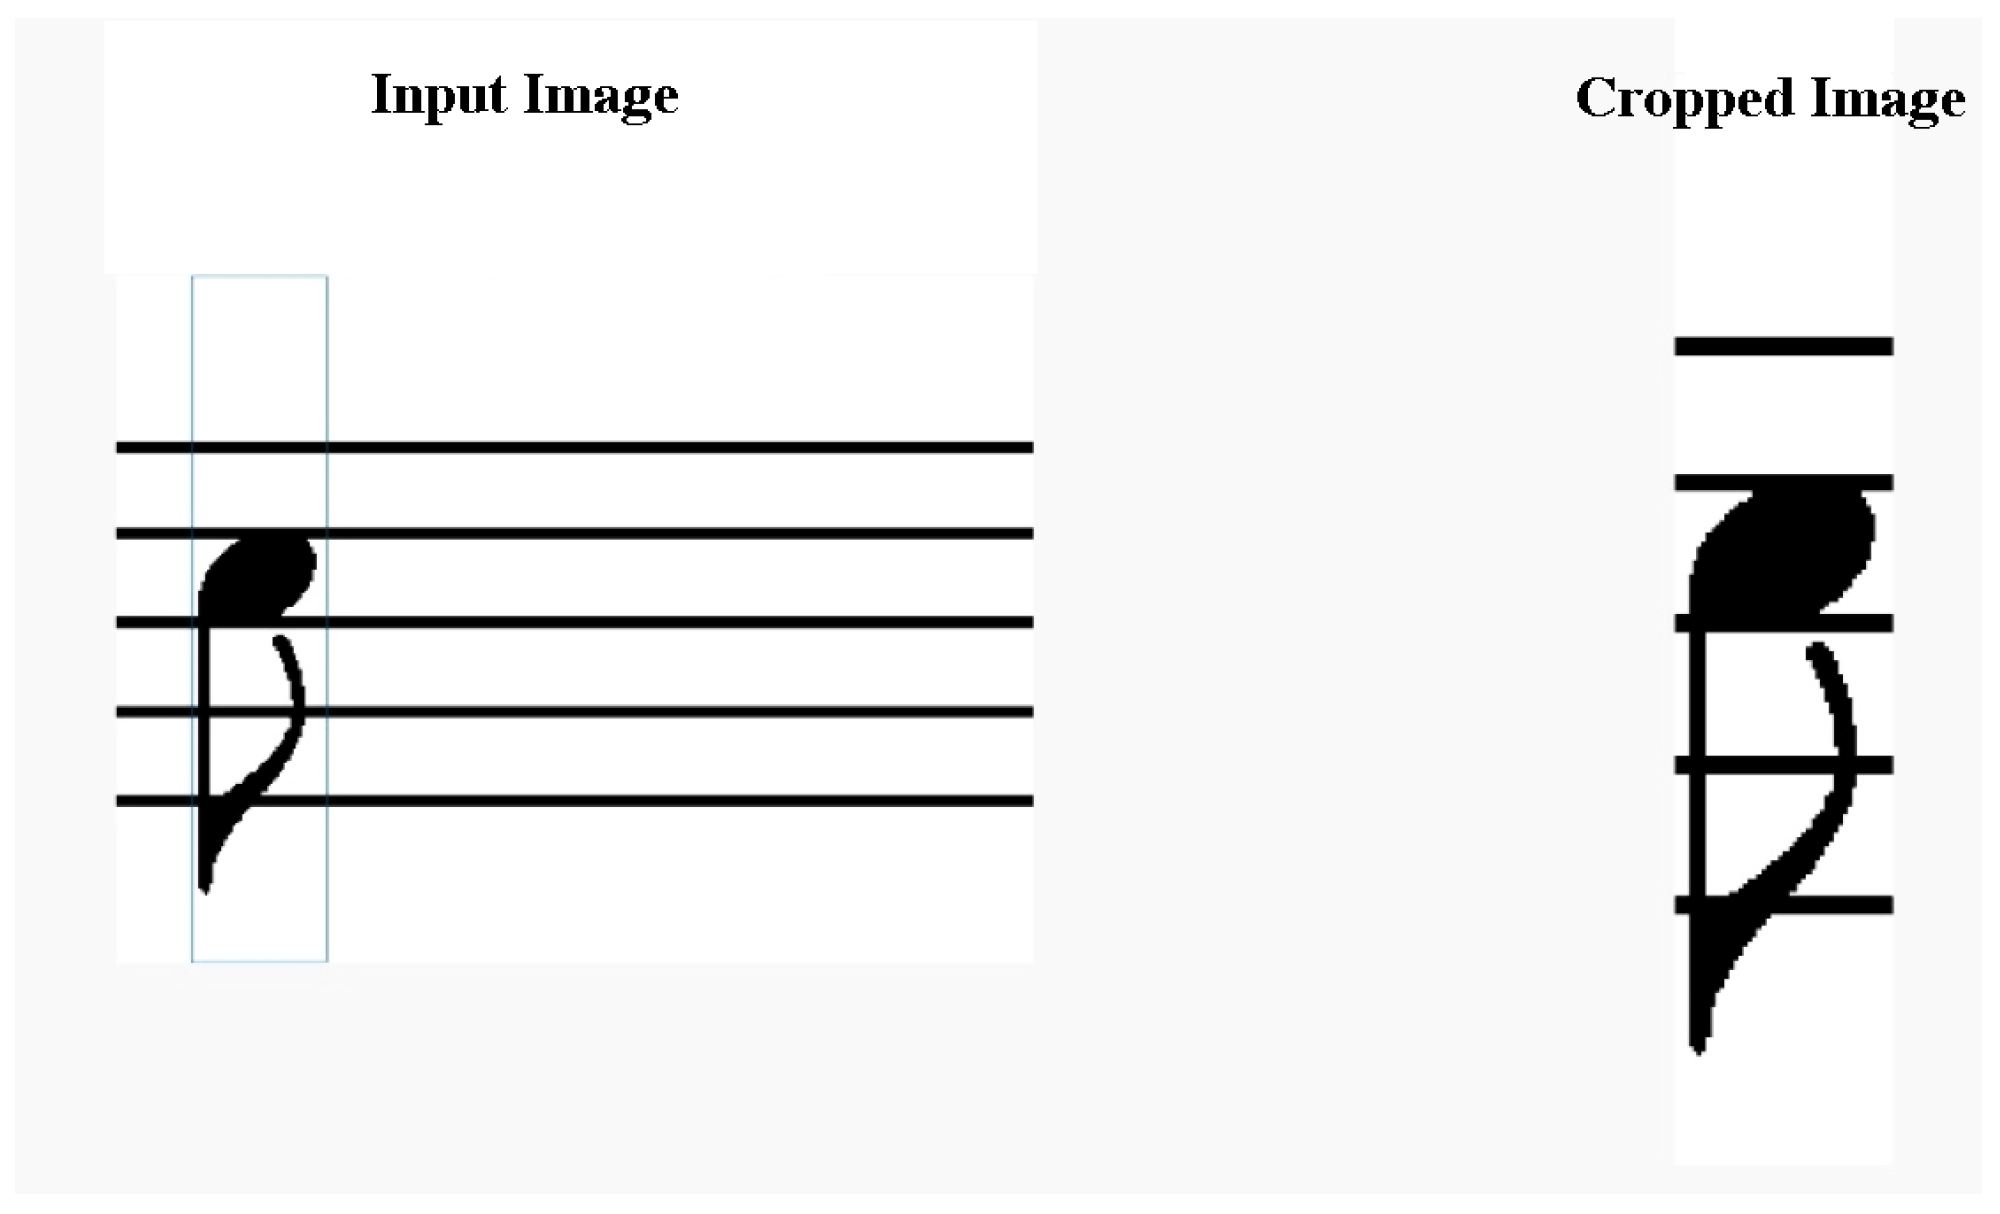
The manner in which the symbols of musical notation are marked is presented in
Figure 5. On the basis of the collected data, teaching patterns were prepared, showing images of symbols containing distortions in the form of deformations. First, specific components of symbols were distinguished. To obtain distorted symbols, the treble clef and note dot symbols were rotated. A set of symbol patterns was created from the objects of distorted dots and music sticks using the AND logic operation. Staff patterns have been generated. Then, using the AND logic operation, the patterns of distorted musical notation and staff symbols were merged, and the pattern images were dimensioned. In order to standardize the sizes of the patterns, the value of the largest symbol width was assumed, and the height of the images seen through the camera lens was assumed as the height of the patterns.
The next section will present the issues related to the design of algorithms used in the current examination.
5. Neural Networks and a Classical Image Identification Algorithm
This section describes the procedures used in training the neural network as well as the provisions for designing a classical classification algorithm without the use of an artificial neural network approach.
5.1. Radial Network Used in Research
An RBF is a one-way neural network with a radial basis function. Such networks are applied in classification problems, where they recreate the density function of the distribution of variables, but most often, they are used in the tasks of non-linear approximation of numerical variables. The RBF neural network is used in studies that require regression tasks. Among others, article [
41] proposes the use of the radial base function of the artificial neural network to predict trihalomethanes levels in real distribution systems. In turn, a combination of multilayer perceptrons and radial neural networks with a base function (RBF-NN) was proposed in [
42]. A multilayer RBF network was designed for regression problems.
The process of learning radial networks consists of two stages:
(a) designation of centers representing the training data space and parameters of the shape of base functions,
(b) selecting the neuron weights used in the approximation of target values.
A radial basis function is a function that changes radially around a fixed center point
c and is non-zero only around this point. The parameters
x and
c stand for two points lying in the space of the distribution of functions. Point
c is the fixed center point of this space, while point
x is the floating point. The general form of the radial basis function can be represented by the formula [
43]:
From Equation (
1), we can conclude that the argument
x of the
radial function is the distance of a given point
x from the center
c. However, the formula for the
function may include an additional
parameter to specify the center width.
From a practical point of view, the use of a large number of training sets
p in the expansion of base functions is unacceptable. Usually, the number of
p patterns is very large, which leads to high computational complexity of the algorithm. As in multilayer networks, weight reduction is needed; in radial networks, a reduction in the number of base functions is employed. In a space with smaller dimensions, while limiting the basic functions to
K, an approximate solution with sufficiently high accuracy can be expressed by the formula [
43]:
where:
—number of base functions,
p—number of patterns,
—a set of centers to be designated,
x—a variable point lying in the space of function distribution,
—distance between the point and the center.
5.2. Specifying the Value Types of Musical Notation Patterns of Symbols for Training Neural Networks
The first attempts to train neural networks were carried out using three different ways of representing patterns:
(a) in grayscale,
(b) in a binary form with the data distribution “0” and “1”,
(c) in a binary form with the distribution “−1” and “1”.
Attempts to train the RBF neural network were carried out. Despite the large degree of data reduction in the image, the pattern set was still of considerable size. The pixel number of a single image was 21,600 pixels, and the color depth in grayscale was 8 bpp (bits per pixel), and for binary images, it was 1 bpp.
The RBF neural network was trained using a set containing only patterns of one note (
Figure 6). In this case, a decision was made not to terminate the process following the decomposition of training data by singular values. It is the decomposition into products of three matrices to reduce the dimension of the matrix. This operation was performed by the SVD (Singular Value Decomposition) function included in the Matlab environment and used by the Netlab library.
Another attempt was carried out again on the RBF network, and it was performed using the arithmetic mean values of the images of the training patterns. In this case, two note patterns were used. The learning process took about 2.5 h, and the neural network needed 550 epochs for the final mean square error value to be
. The process is time-consuming, and the network is large, but it achieves good results in the classification of objects. This will be described in detail in
Section 6.
5.3. Identification Algorithm without the Use of Neural Network
In order to compare the quality of note recognition by the designed neural networks, an additional, classic identification algorithm was created. This will provide a suitable benchmark for the AI method of note recognition with the recognition abilities of an image-based algorithm that uses various photo operations. It is based on an add-on for the Matlab—Image Processing Toolbox.
It should be remembered that the classical method may not give equally satisfactory test results because, unlike the neural network, it does not have generalizing abilities.
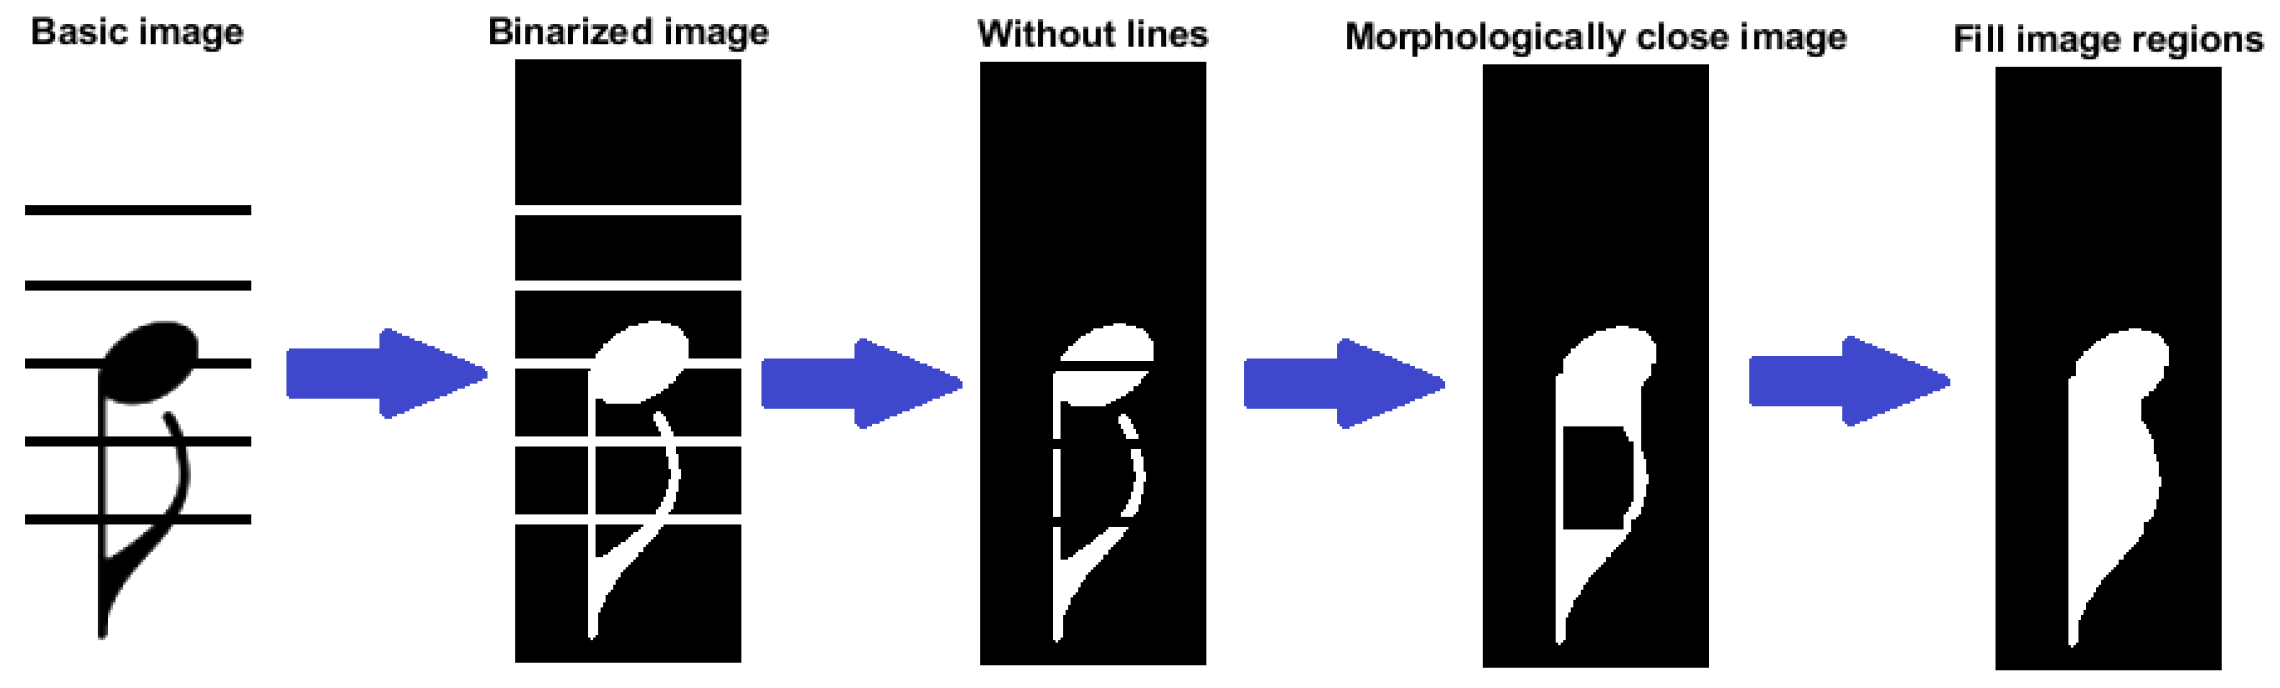
It is necessary to adequately prepare the image by performing appropriate operations in order to carry out the identification process. First, the image is binarized, and the colors are inverted (
Figure 7). The effect of this is that the background is black and the note is white. Subsequently, the staff is removed, which will facilitate the identification process by the application of an algorithm that does not utilize an artificial neural network. By processing the figure of the note on the image, the morphological operation of closing the image is performed (
Figure 7). This process allows the connection of objects lying close to each other. In addition, it allows the closure to fill the sinuses, narrow gaps and small holes inside the figure without changing its basic part.
Right after performing the closing operation in Matlab, it is necessary to select an appropriate structuring element. Too low or high values of this element may lead to inadequate results, providing such drawbacks as failure to close gaps and holes or too strong closure of a larger number of image elements.
In the case of notes classification, closing the image will allow discontinuities in the note resulting from the removal of the staff to be filled.
Figure 7 shows an exemplary form of a clear closure of a note, which is the eighth note, and in this case, special attention should be paid to the nearby pixels.
The last step is to fill regions with a continuous contour (
Figure 7). It is a necessary part of the algorithm that enables the final determination of the note in the image.
6. Description of Tests and Their Procedure
The first part of the research on the effectiveness of network learning algorithms was carried out on the RBF network model. On the basis of the information contained in the literature, the research divided the sets and the determination of prototypes (center values) with the most popular and most effective methods, such as: k-means and k-the nearest neighbors. The number of centers was selected experimentally until the width of the Gaussian distribution of the data () was correct. Input and output signals made of images of symbols of musical notation were used for the study.
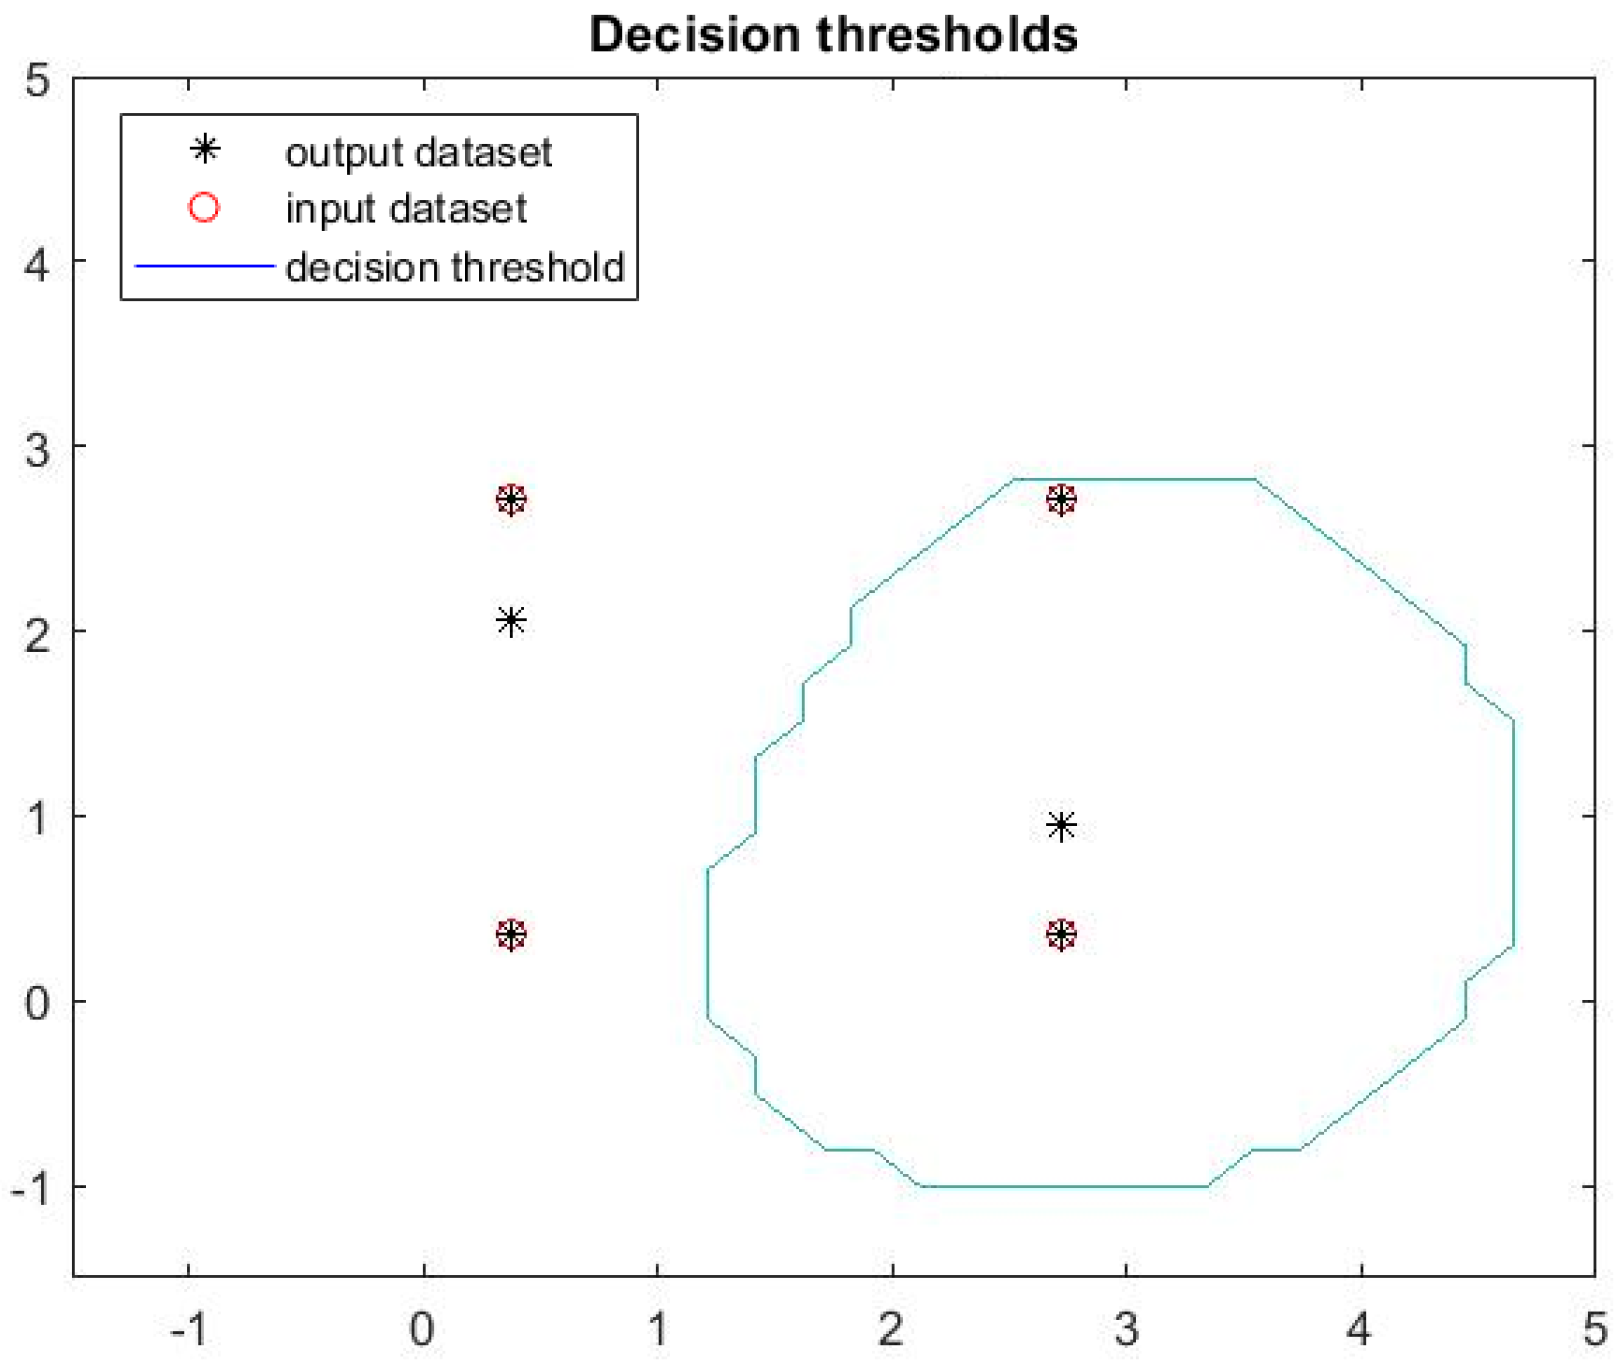
6.1. Decision Boundary Based on the Values of Binary Patterns
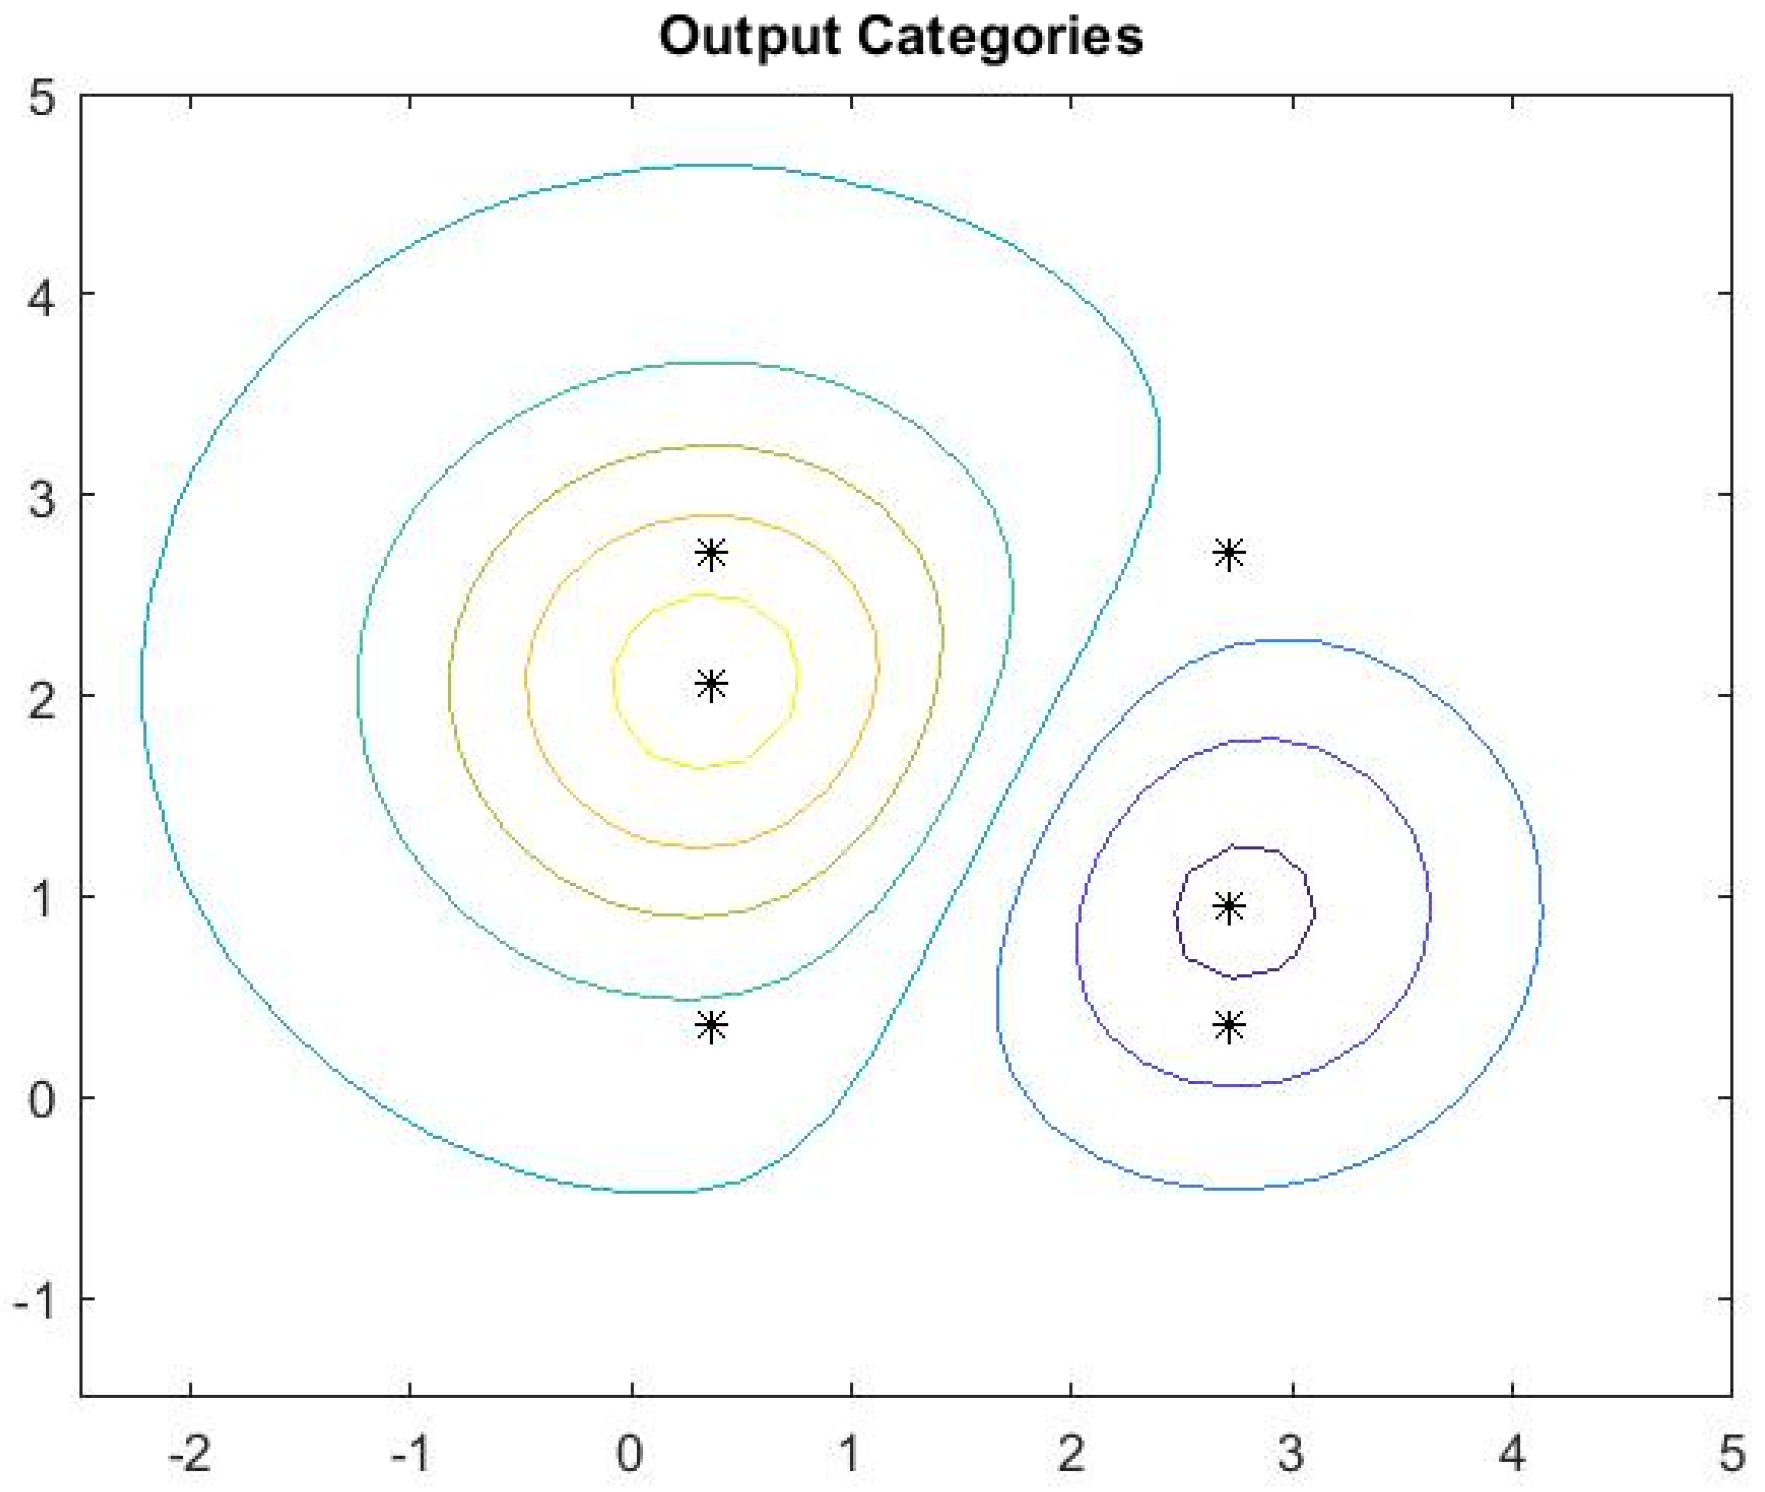
The study used input signals in binary form with the values substituted for the exponential function in order to differentiate the values with respect to the target signals. The input data signal consisted of two vectors corresponding to images of distorted notes of 90 × 240 pixels. The target signal was two categories labeled . The target data signal was one vector of 90 × 240 pixels and corresponded to the pattern image of this note.
The study was conducted on the RBF network. There are 10 center points for each exit category. The method of
k-meaning was applied with the purpose of selecting the prototype. The beta coefficients controlling the width of the activation function were then calculated. The training of neuron weights was performed using the gradient descent algorithm. The obtained data division and distribution, as well as the decision boundary, are shown in
Figure 8 and
Figure 9.
There are also points for the minimum () and maximum () categories. The accuracy of the training was 98.3%.
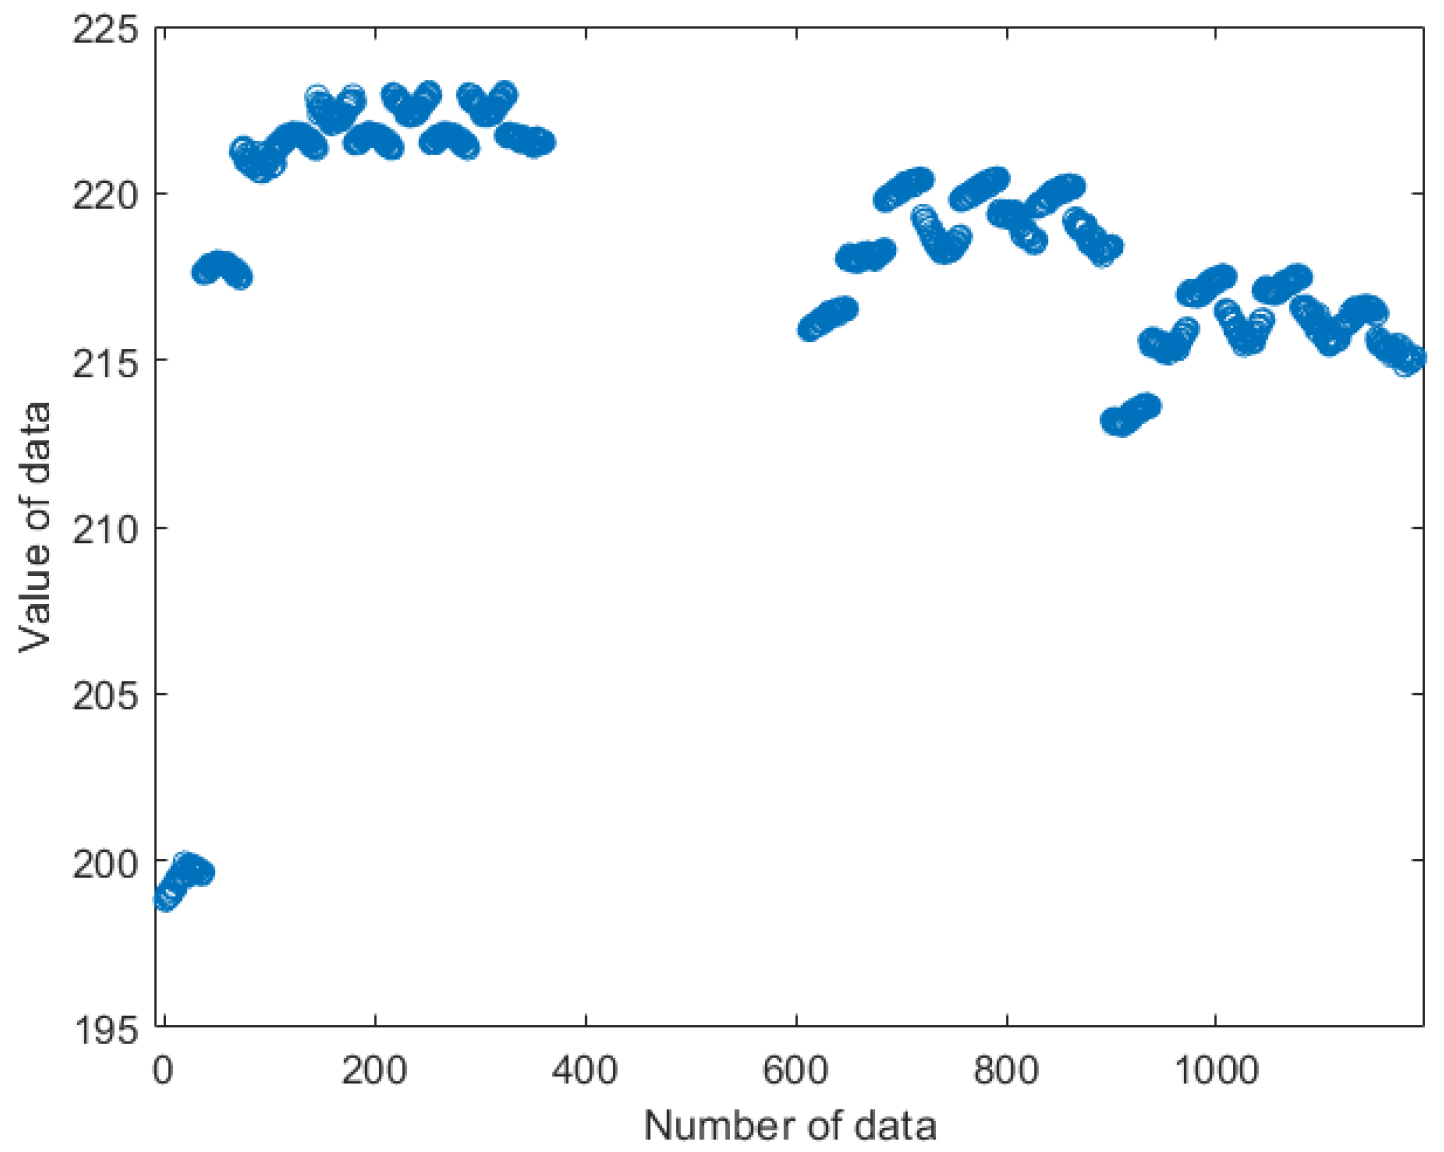
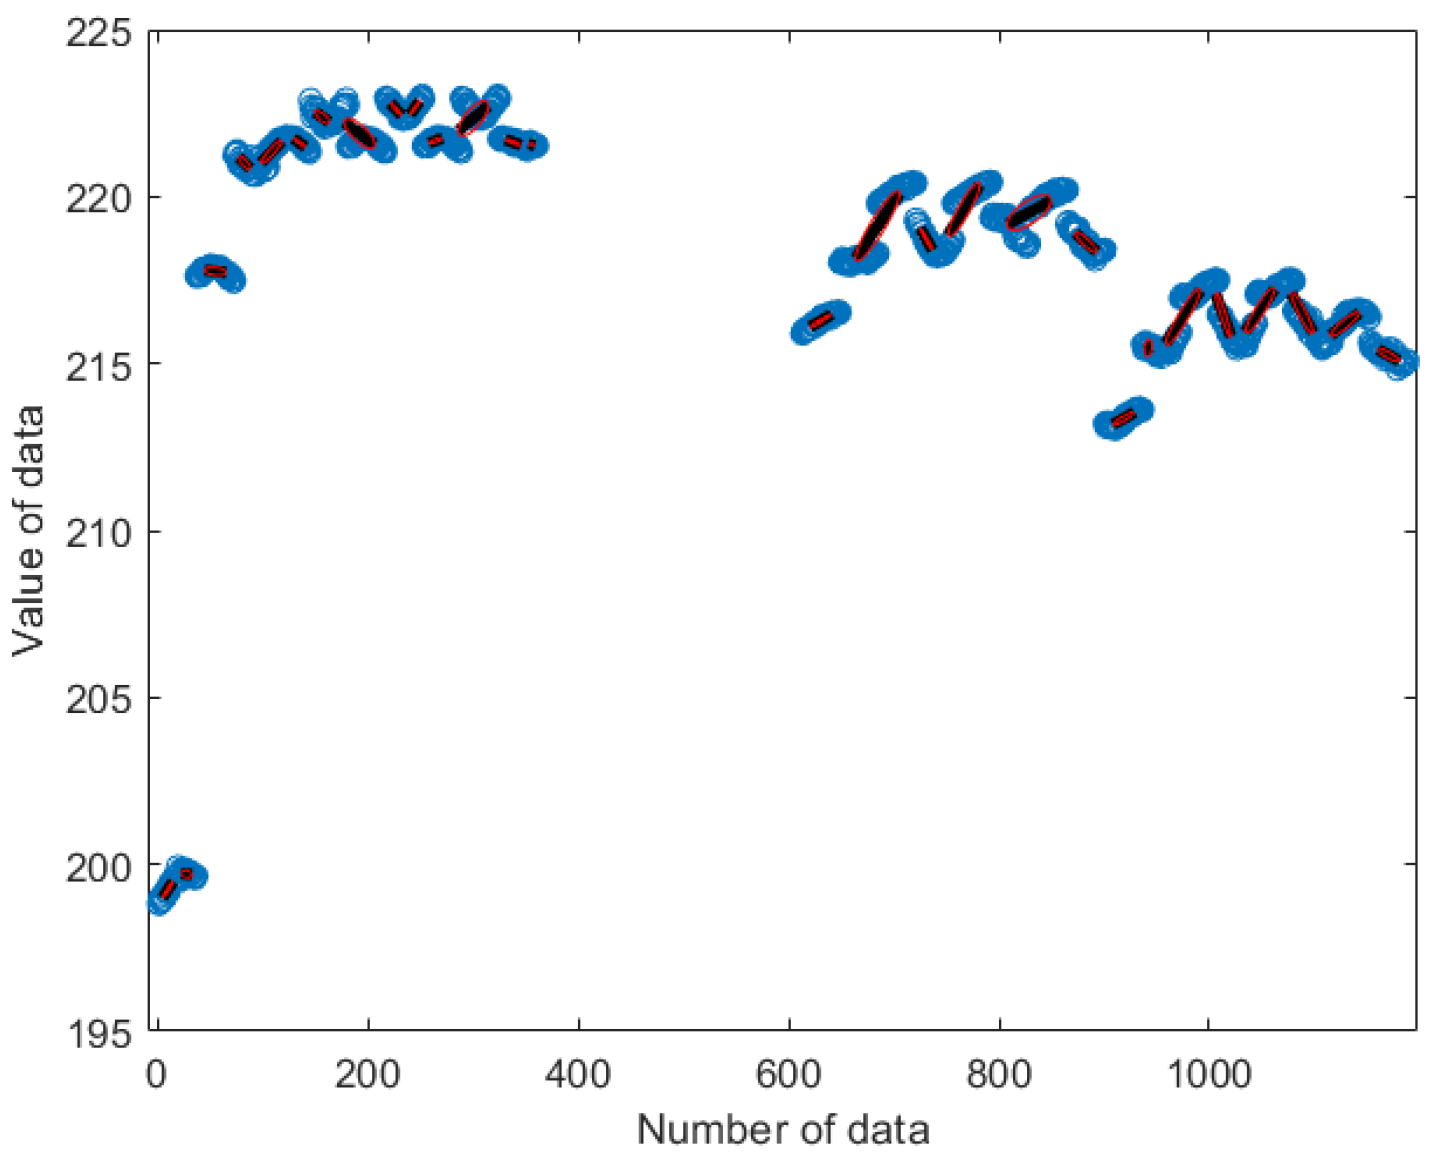
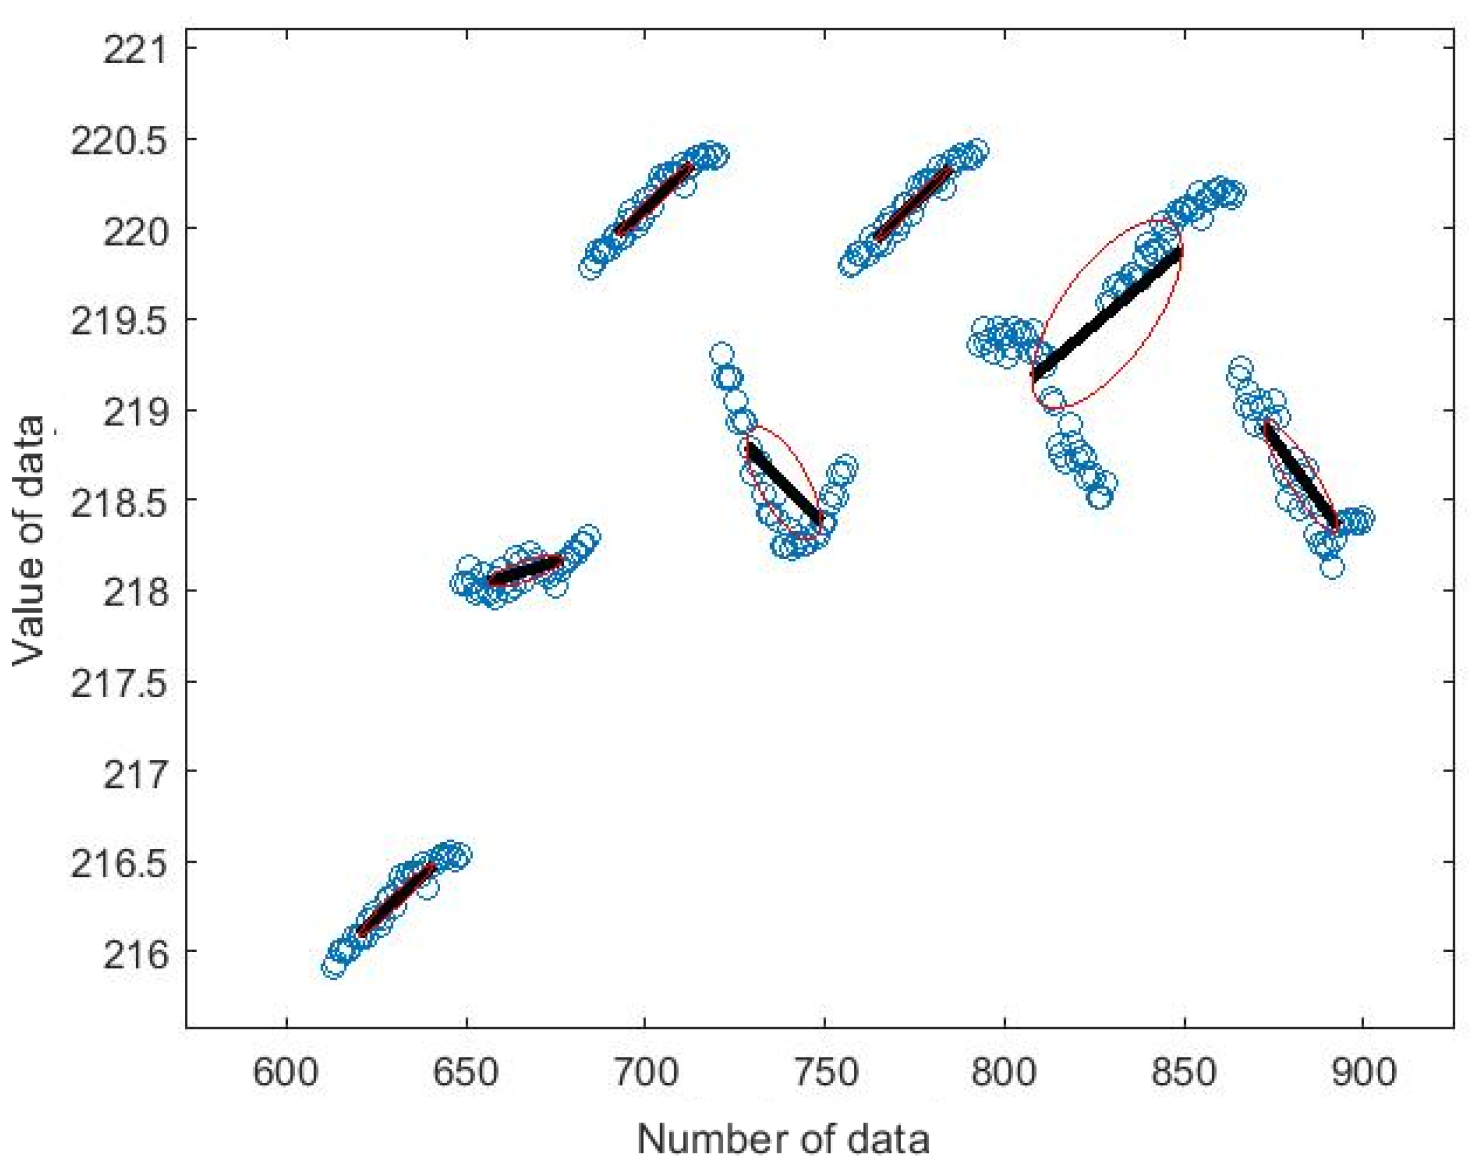
6.2. Modeling the Data Distribution Density by Probabilistic Principal Component Analysis
In this study, data distribution density was modeled using Probabilistic Principal Component Analysis (PPCA) using full covariance matrices. The test was carried out for seven values of the intervals equal to 0.1, 0.2, 0.3, 0.5, 0.6, 0.8 and 1. The data applied in the study were represented by arithmetic mean values derived from distorted images of musical notation symbols presented in grayscale. The number of center points was equal to the number of musical symbols and equal to 33. The center values were determined as the arithmetic mean values of all images of a given symbol, e.g., all average values of the distorted images of the entire note of the C key. The model with one-dimensional PPCA components was subjected to a learning process using a probabilistic expectation-maximization algorithm (Expectation-Maximization). The presented process consisted of 30 epochs. The obtained test results are presented below.
Figure 10 indicates the arrangement of the input data (blue color).
Figure 11 and
Figure 12 show the view of the density function (black) and the standard deviation for all terms along each component of the model (red).
Based on the results obtained during the tests of the density function modeling, it was found that the method achieves good results in determining the location and density of data in individual clusters, showing that the values vary considerably between clusters. In
Figure 11, a model of the data density distribution within the data coming from two different clusters can be seen. The results of representing the symbols of musical notation this way is not satisfactory. The possibility of a further improvement in data density modeling cannot be excluded.
6.3. Simple Regression Using RBF Networks
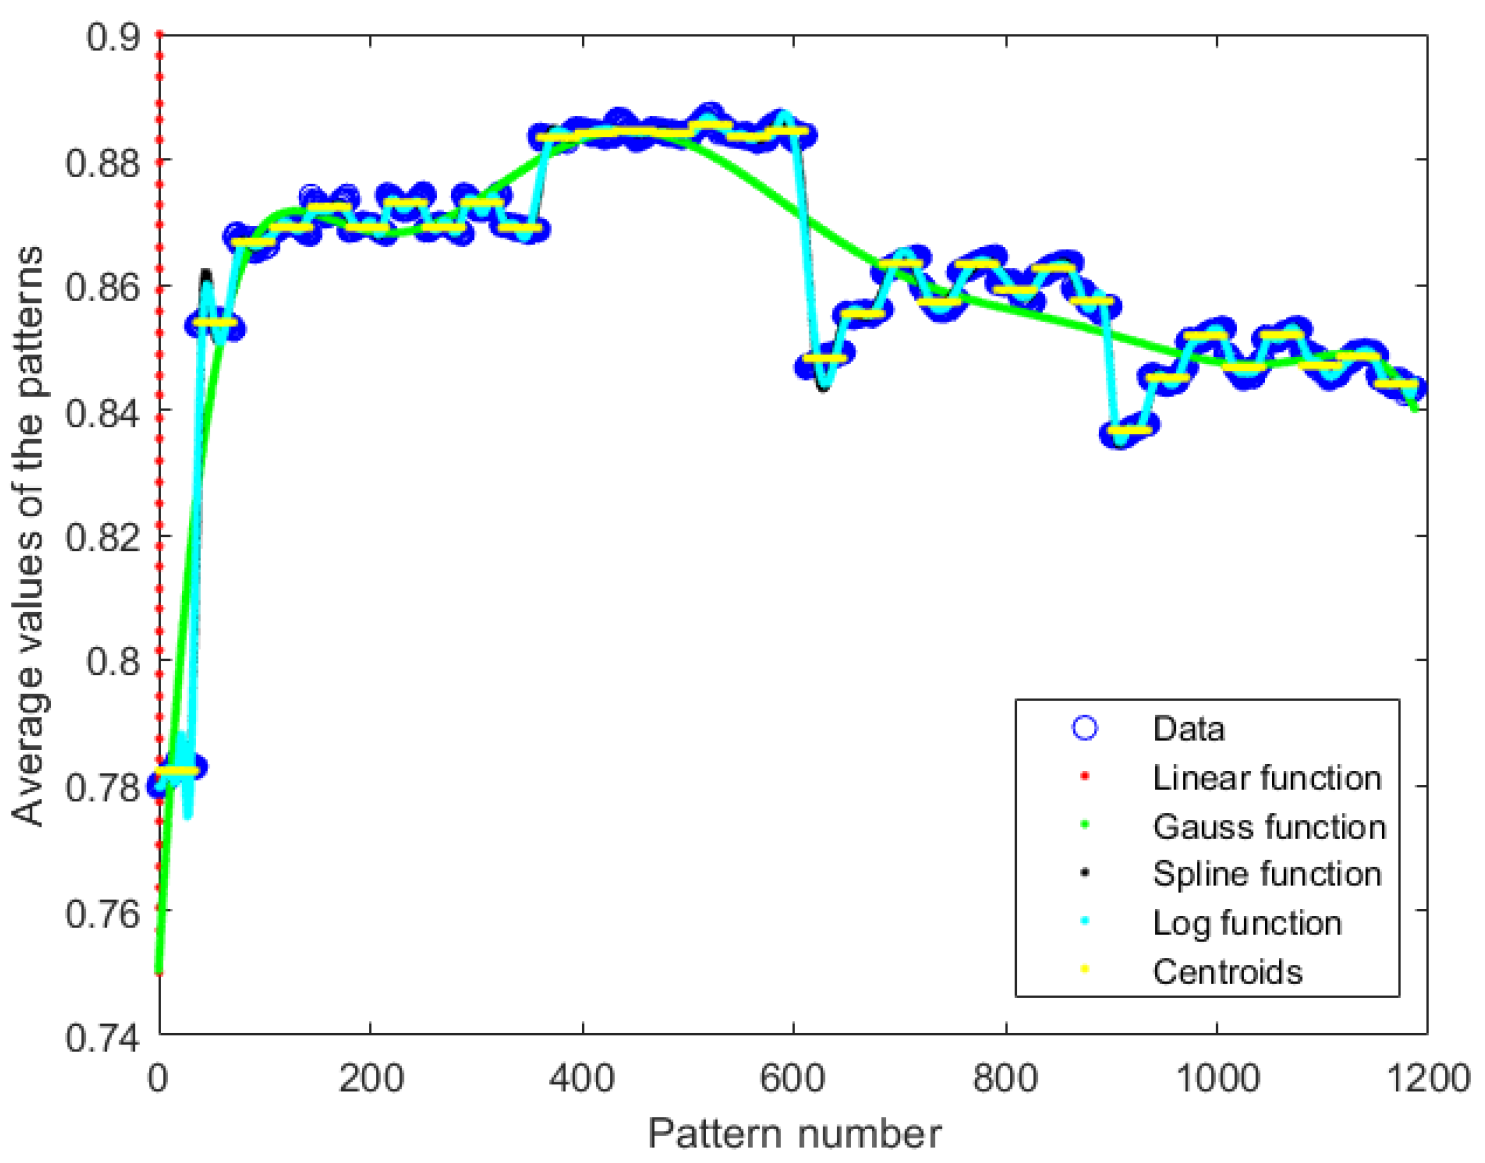
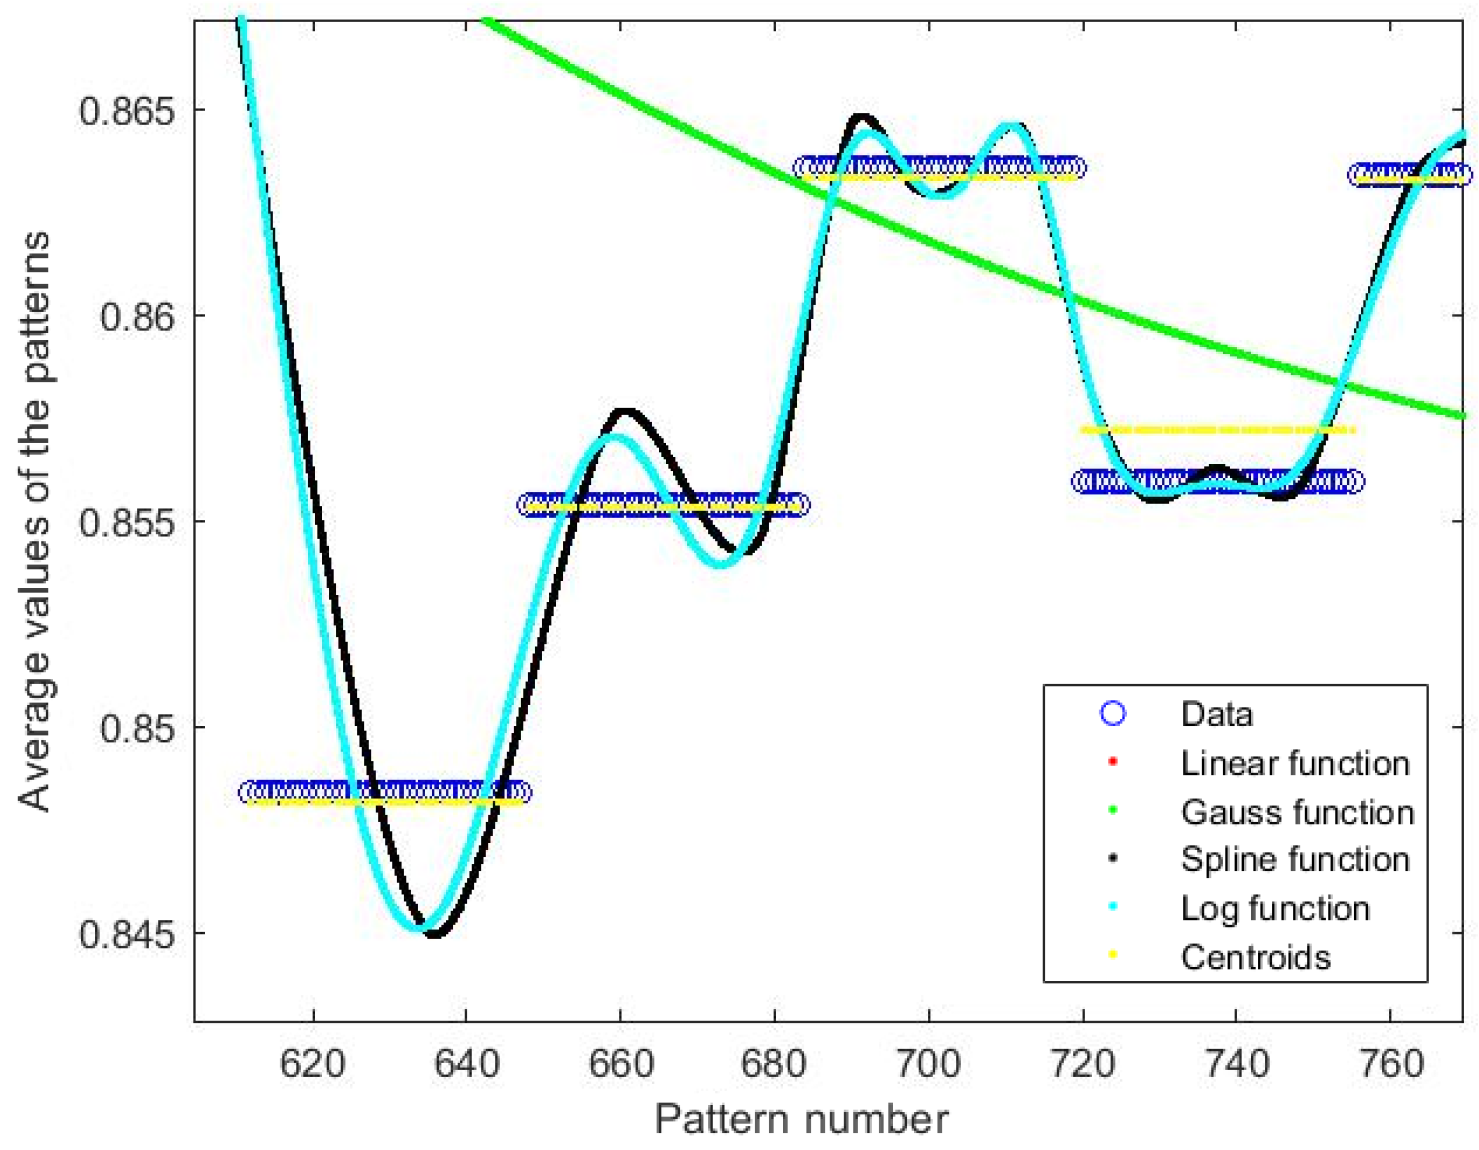
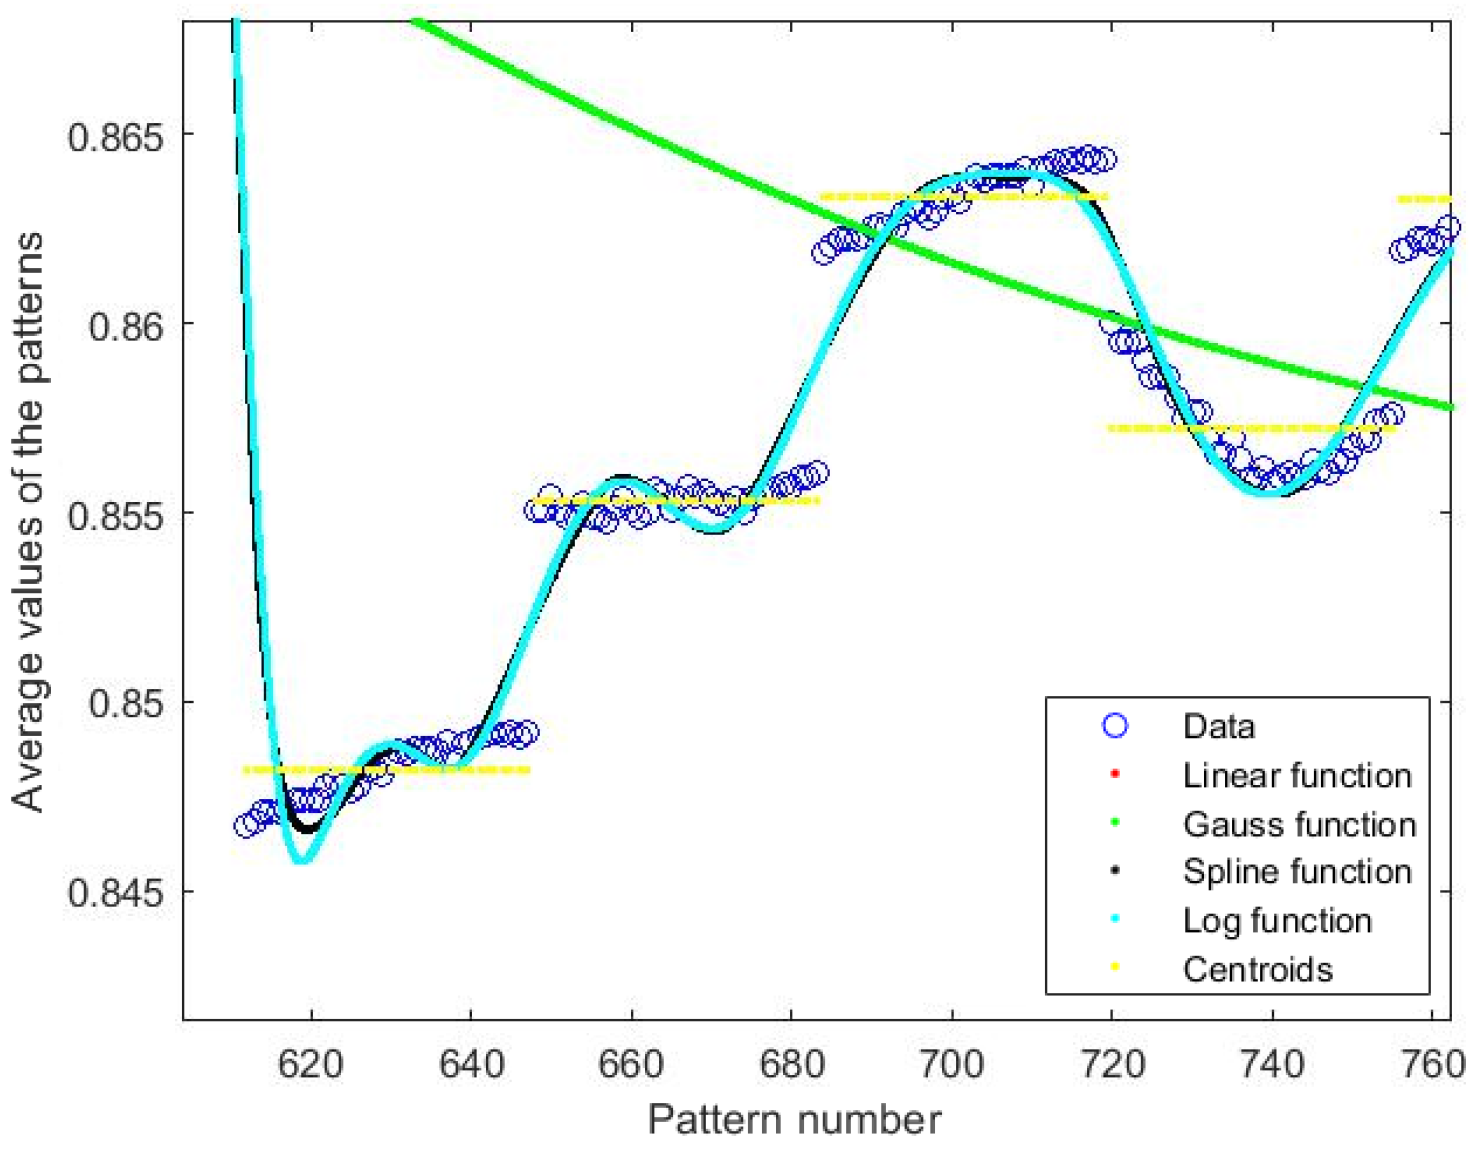
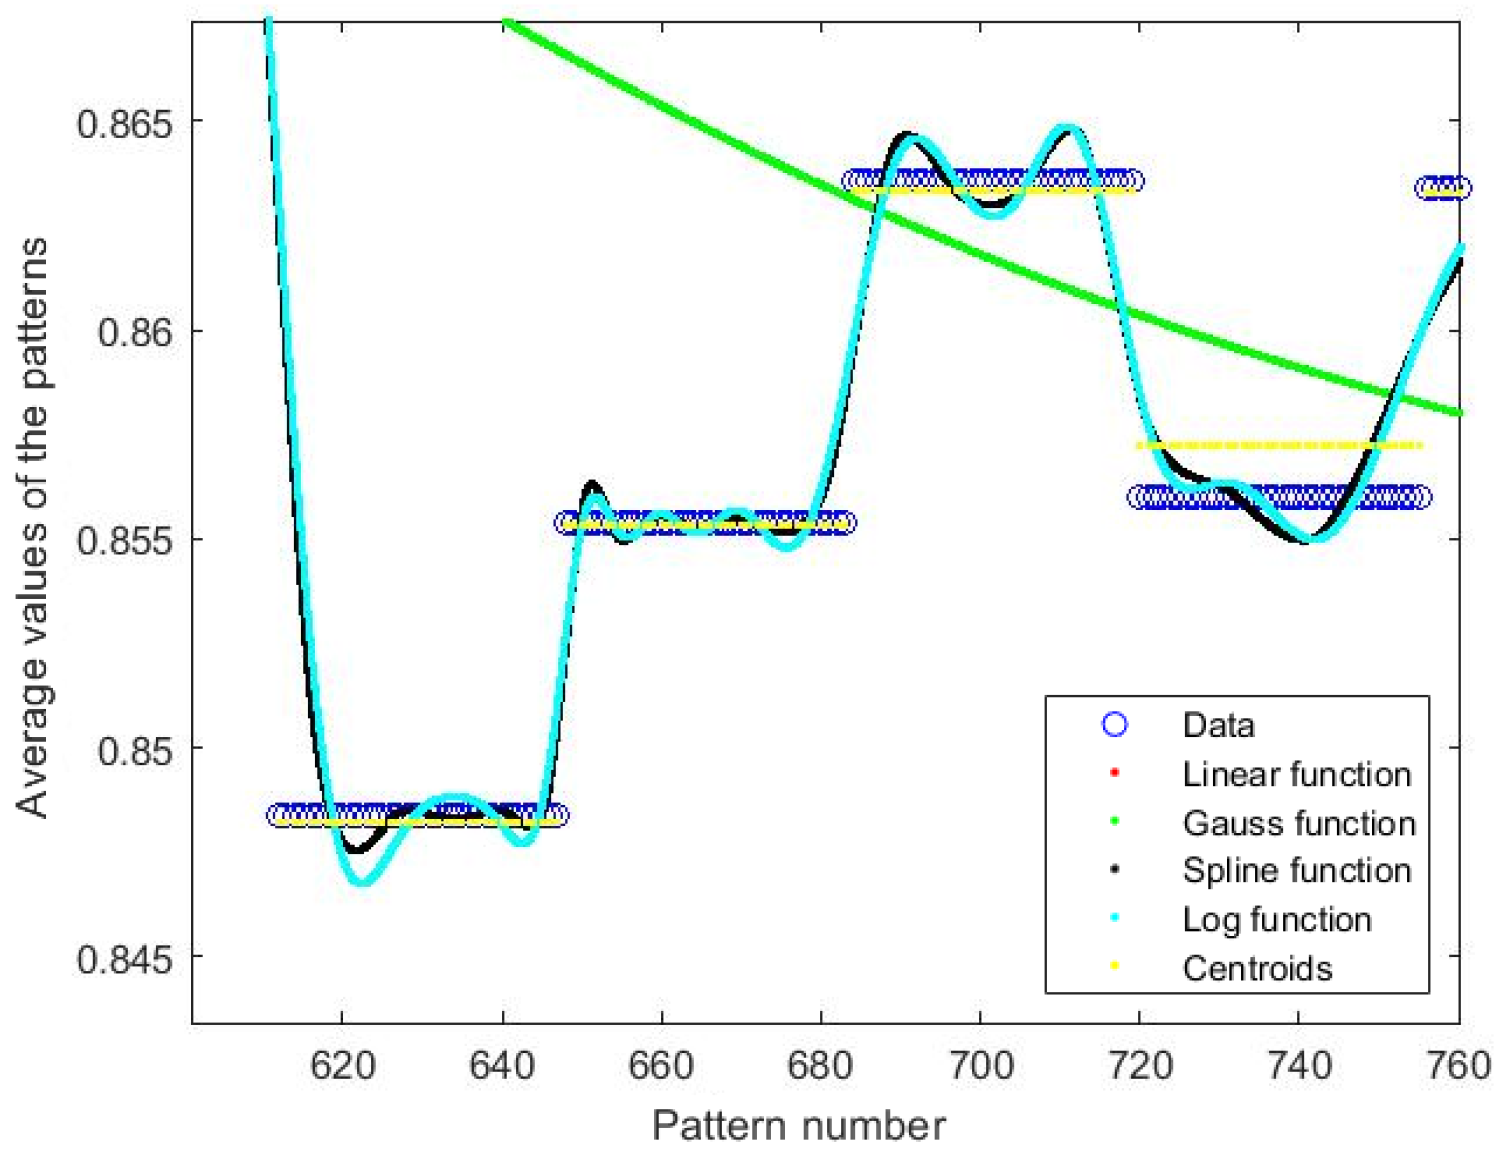
The study was performed using network models created with the use of the Netlab library and was carried out on a set of arithmetic means of the values of the training patterns and the target represented in binary form. The data consisted of a vector of input () and a vector of output (). RBF networks with three different activation functions were subjected to the learning process. The representation of the patterns has been changed for this series of tests. The input dataset is a vector with a range of integers from 0 to 1187 (number of musical notation symbol patterns). The target data were a vector containing:
(a) in the first case, the average values of the distorted images of symbols in musical notation,
(b) in the second case, the average values of the reference images of the musical notation symbols correspond to the number of the specific pattern.
Series of studies were conducted to obtain the results for the 40 epochs, and the number of a single hidden layer = 100.
The following activation functions were used to activate neurons: Gauss, spline and logarithmic. The arithmetic means of distorted values and standard symbols of musical notation were used as training patterns. As a result of the research, it was found that increasing the number of learning epochs did not significantly improve the network operation. On the other hand, increasing the number of neurons, the neural network parameters improved, despite the small number of learning epochs. Increasing both the number of epochs and the number of neurons led to over-parameterization, causing the value obtained from the function to diverge in relation to the value of the training patterns, which can be seen by observing
Figure 13,
Figure 14,
Figure 15 and
Figure 16 (mainly
Figure 15 and
Figure 16). The best generalization behavior was obtained using the Gaussian function as the neuron activation function, and the best representation of the pattern distribution by means of the logarithmic function. The shortest learning time was achieved for the network with a spline activation function. The best results were obtained for the values of the distorted images (
Figure 15). On the basis of this data, we can see that such a network can be applied to recognize images of musical notation symbols, assuming that the data are properly prepared.
6.4. Classifying Images with RBF Networks
In this particular section, we are investigating the effectiveness of the RBF neural network in the task of image classification. The training dataset consisted of 90 × 240 pixel images of musical notation symbols. The values describing the pixel saturation were converted to binary data with values of −1 for black and 1 for white. The set of symbol matrices was converted into vectors with a size of 1 × 21,600 pixels for each pattern. Each symbol was represented as 36 distorted patterns. The total number of symbols was 33. As a result, a matrix with the dimensions of 1188 rows and 21,600 columns was obtained. The target standards were placed in the second matrix of the same dimensions.
The RBF network available in the Matlab Neural Toolbox package was used as a classifier. The base radial function was the Gaussian distribution, and the network learning process was carried out using the Levenberg–Marquardt algorithm. The initial network parameters were set according to the order:
(a) target mean square error = 0,
(b) area of dispersion of the base function = 1,
(c) initial number of neurons equal to 1.
Increasing the base of the Gaussian distribution function increases the smoothing of the function.
During the learning process, the RBF network is formed iteratively by increasing the number of neurons in the hidden layer by one neuron in every cycle. At each iteration, the input vector with the greatest reduction in network error is used to create a new neuron. More neurons are added until the mean square error value assumes the target error value or the maximum number of neurons is reached. A new network is created using the function. It takes the input and target vector matrices, and design parameters such as the target mean square error value and the base function scatter area. The scattering area should be large enough for the neurons to respond to overlapping areas of the input space but not large enough for all neurons to respond in the same way.
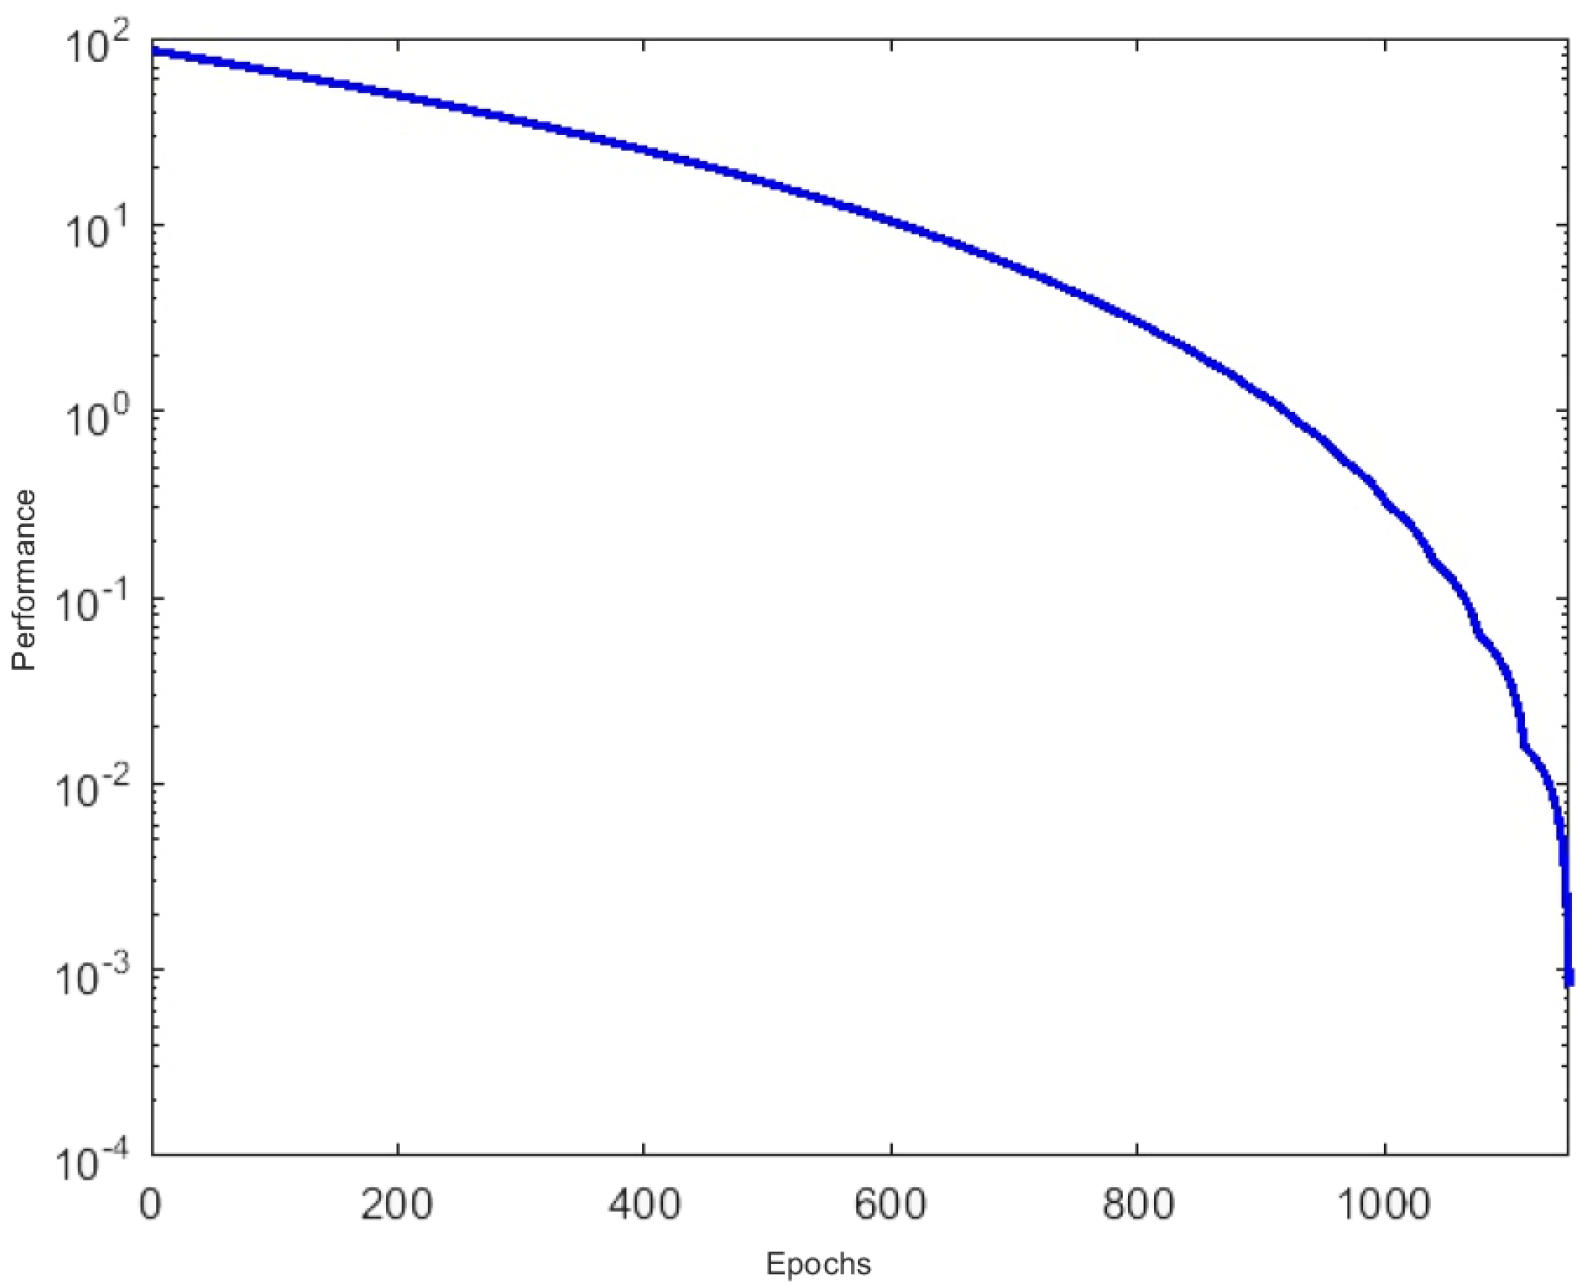
The target mean square error was set to 0. During the learning process, the value was 0.0008196 (
Figure 17). On the basis of the obtained results, one may conclude that this method of network training offers very good results but is time-consuming. The process of learning the network took 92,682 s, which is approximately 25 h and 45 min. Tests were carried out on a Dell Latitude E6530 computer with an Intel Core i7 4800MQ 2.7 GHz CPU and 16 GB RAM memory. The network effectiveness test was carried out on the number of one thousand randomly selected symbol patterns. Details of the results achieved will be included, in detail, in
Section 8.
In the next part of the research, attempts will be made to identify the form of musical notation using a classical algorithm, which is based on image segmentation as well as morphological operations, as already mentioned. On the basis of methods that do not employ an artificial neural network, a decision is made to determine the note presented in the image.
6.5. Classifying Images Using the Proprietary Classical Identification Algorithm
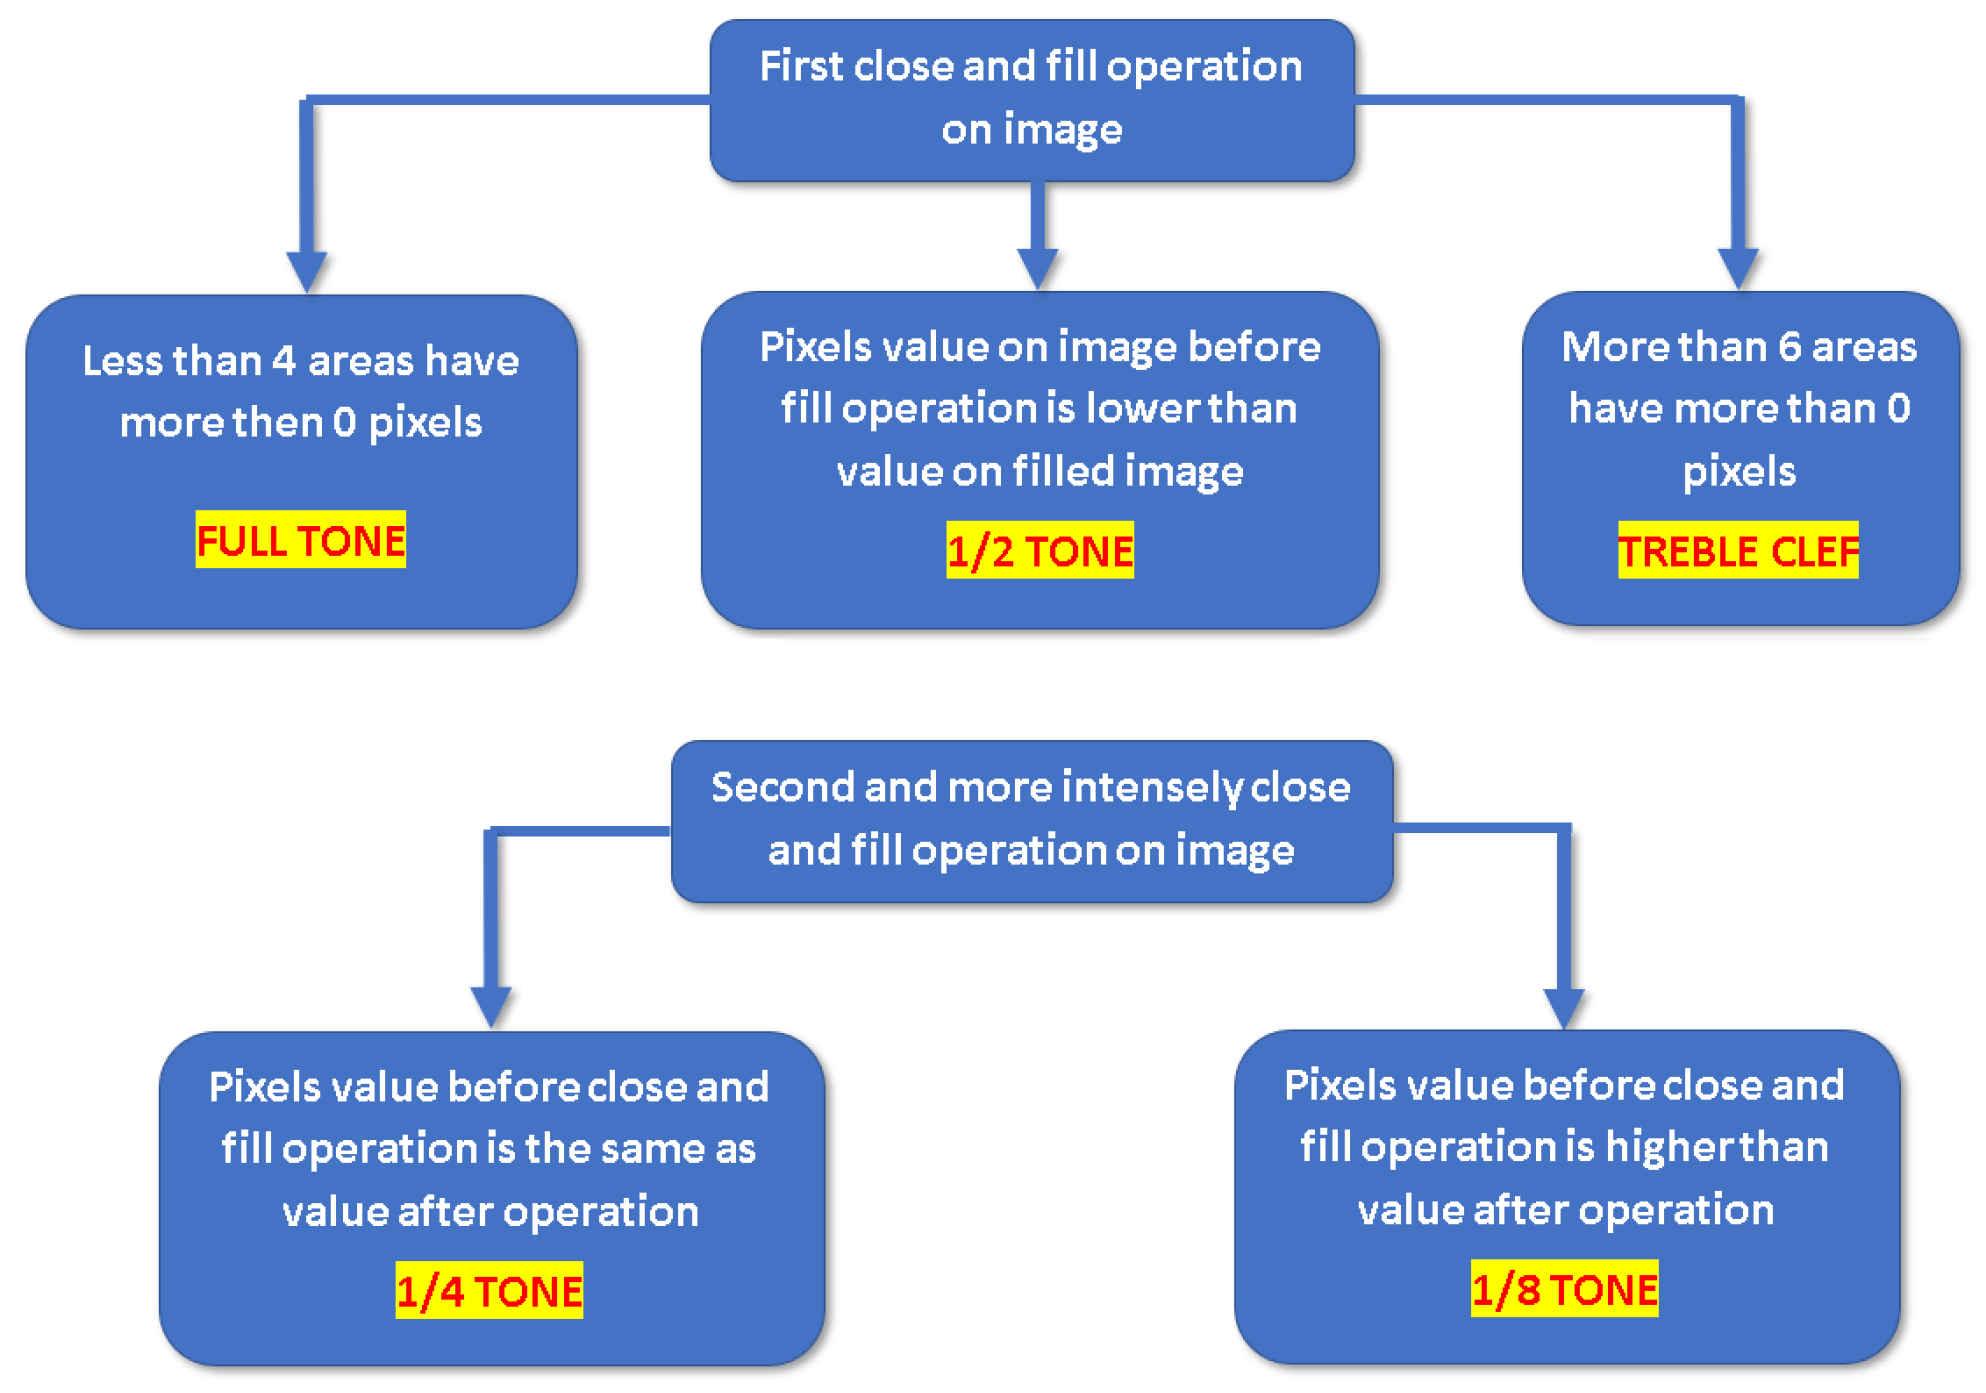
The ability of an algorithm that does not use artificial neural networks to identify notes was tested on the same set of 1000 test notes used to test the operation of the RBF neural network. A simplified diagram of the operation of the proprietary algorithm under study is presented in
Figure 18. The chart describes the two steps of examining an image by an algorithm. This approach to the problem ensures better stability and versatility of the designed algorithm. A suitable division can be observed in the task of recognizing individual notes. The first procedure of filling and closing is to help distinguish the characteristics of the whole note, half note and treble clef. It is related to their surface on the staff. The repeated procedure is to emphasize the features of the crotchets and eighth notes.
The action taken in this chapter follows on from the pre-classification of
Section 5.3. It describes the method of initial image processing for final recognition by the proprietary expert system. The results achieved on the basis of the identification algorithm procedure will be described in
Section 8.
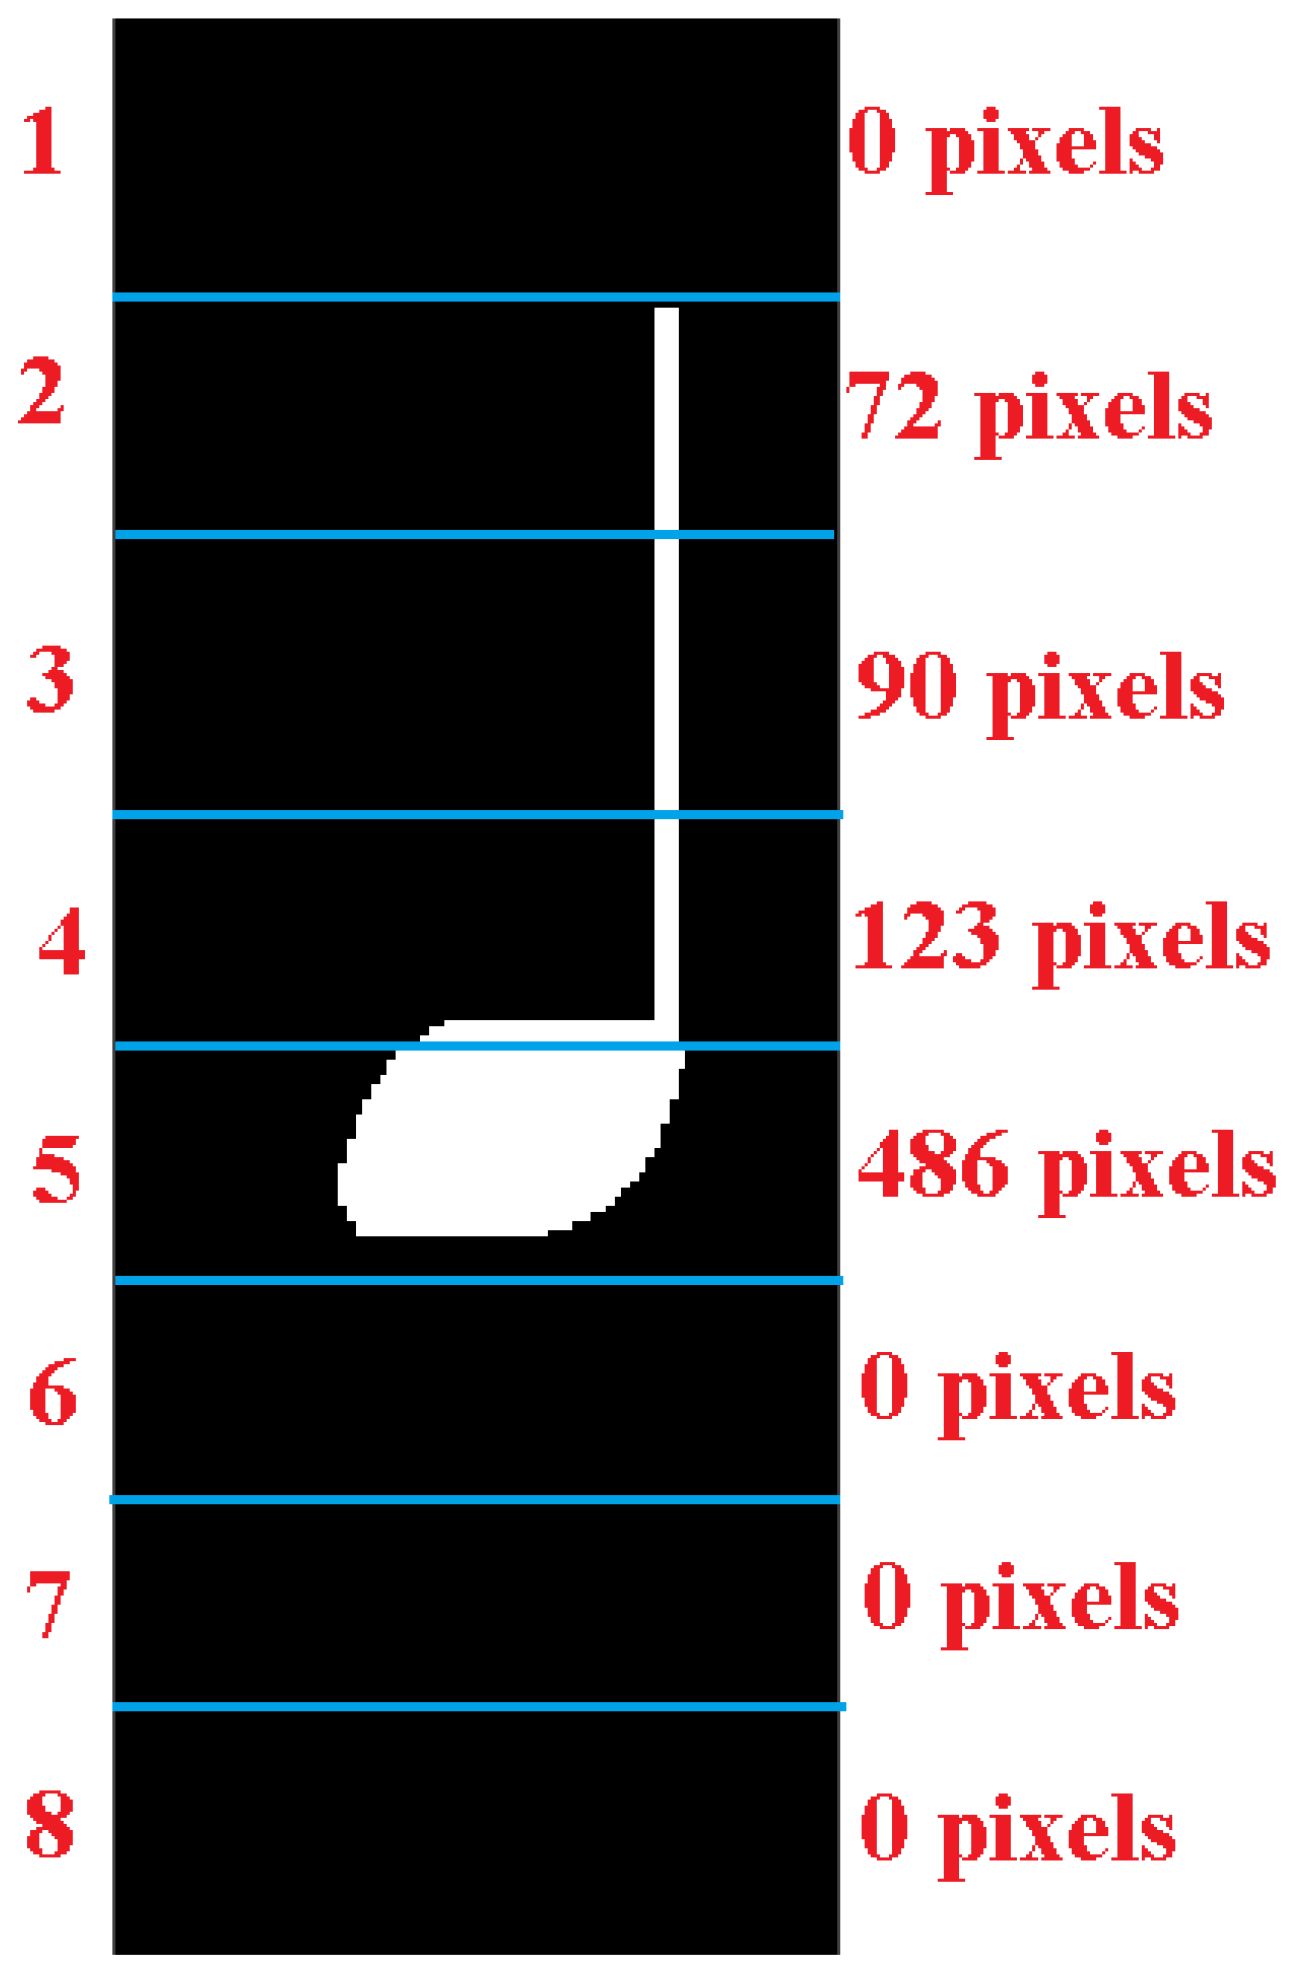
The obtained image is divided into eight segments, from which the value of occurring pixels is counted (
Figure 19). The largest concentration of pixels in a selected segment allows the position of a note on the staff in terms of the solmization scale to be indicated.
7. Discussion of the Results Based on Selected Quality Criteria
Despite the lack of numerous examples in the professional literature about the possibility and effectiveness of the use of neural networks in the issue of identifying musical notation symbols on a staff, it has been proven during the research that it is a quite good approach. The study of note recognition was subject to quality criteria. As a result of the test carried out on the number of one thousand randomly selected symbol patterns, the network efficiency was 96.8%. This is a highly satisfactory result. This method, however, has a very significant disadvantage, which is it is time-consuming and has a high average time of recognizing one note, amounting to 1.086 s (
Table 1). Its unquestionable advantage is the features of neural networks, which, due to their nature of the operation, can surpass classical algorithms. The reason for this is related to the undoubted feature of the network, which is its ability to generalize. Unfortunately, this does not occur in the classic algorithm with an expert approach.
A study conducted on the same thousand patterns with the use of an algorithm that does not use neural networks shows that it coped very well with the task of classifying notes. Its effectiveness is 98.7% (
Table 1). This may be due to the good preparation of an expert approach to the issues of recognition and classification. The disadvantage of this solution is related to the lack of generalization skills. The advantage of this algorithm is its very fast time of operation, as the average time of 0.018 s was devoted to the analysis of a single image. It is nearly 60 times faster than the first method of identification. Taking into account the time of starting the algorithm, a runtime of 1101.74 s was observed for a solution including a neural network. The second approach took 21.57 s.
The research conducted on the classification of notes on a staff offers important conclusions. The method using artificial neural networks is significantly different from the classical identification algorithm. Each method has its advantages and disadvantages. The classic algorithm for the given case did a great job, as did the neural network. Both classification systems work very satisfactorily. However, it can be anticipated that the expert approach may not give good results in the case of a change in the classified photos (e.g., a change in the musical note environment). The reason is the lack of generalization, which is a feature of the neural network. However, it is worth noting that the appropriate preparation of the environment for the classical classification system will certainly produce good results in the quality indicators. This approach may require more work and time. However, such an algorithm will be very fast and accurate (
Table 1).
The neural network performs very well in the tasks of recognizing more complex and complicated shapes, which is confirmed by
Table 1. Thus, it can be stated that the proposed approach is a suitable tool for the task of classifying music notation.
In the last chapter, the conclusions drawn from the research will be summarized. In addition, plans for further testing and study will be described.
8. Conclusions and Future Work
The needs and priorities of the algorithm design should be firmly taken into account. As noted in the introduction to this article, this research can be a valuable introduction to systems supporting beginners or blind people in reading musical notation. It is, therefore, important to carefully consider whether the algorithm requires quick operation, as is the case with the classical classification system, or the generalization of the learned note patterns. The neural network provides this aspect. Therefore, it should be considered whether the long time of analyzing one image can use the phenomenon of generalization, which characterizes an artificial neural network solution.
The main open problem should also be presented. It would be beneficial to conduct research using the classic approach and one that applies an algorithm based on an artificial neural network model in a different environment than it was in the design process. This will allow the authors to clearly define which system is worth further development, looking through the prism of the algorithm design time as well as the effectiveness and time of classification.
We also hope to quickly test the presented solutions in a wider project. First and foremost, it is a comparative analysis with other state-of-the-art machine learning models assessed on the same dataset, both in terms of classification accuracy and execution time. In addition, it will be of key importance to extend the scope of the studied musical notation to a more complex and demanding one. This will also allow classification methods other than those presented in this paper to be verified.


