Author Contributions
Conceptualization, K.L., B.T. and J.Z.; methodology, K.L., J.W. (Junxiong Wang) and J.Z.; software, B.H. and J.W. (Jian Wang); validation, K.L., B.T. and J.Z.; formal analysis, B.H.; investigation, B.H.; resources, B.H.; data curation, B.H. and J.W. (Jian Wang); writing—original draft preparation, B.T. and J.W. (Jian Wang); writing—review and editing, B.T.; visualization, J.Z.; supervision, K.L.; project administration, B.H. and J.W. (Jian Wang); funding acquisition, B.H. All authors have read and agreed to the published version of the manuscript.
Figure 1.
Structure of direct-drive turntable: 1—protective box, 2—C-axis torque motor, 3—pneumatic clamping mechanism, 4—C-axis mounting sleeve, 5—turntable bearing, 6—C-axis rotating spindle, 7—turntable surface, 8—swing frame, 9—A-axis rotating spindle, 10—pneumatic clamping mechanism 2, 11—A-axis torque motor, 12—A-axis mounting sleeve, and 13—turntable bearing 2.
Figure 2.
Decomposition of milling force.
Figure 2.
Decomposition of milling force.
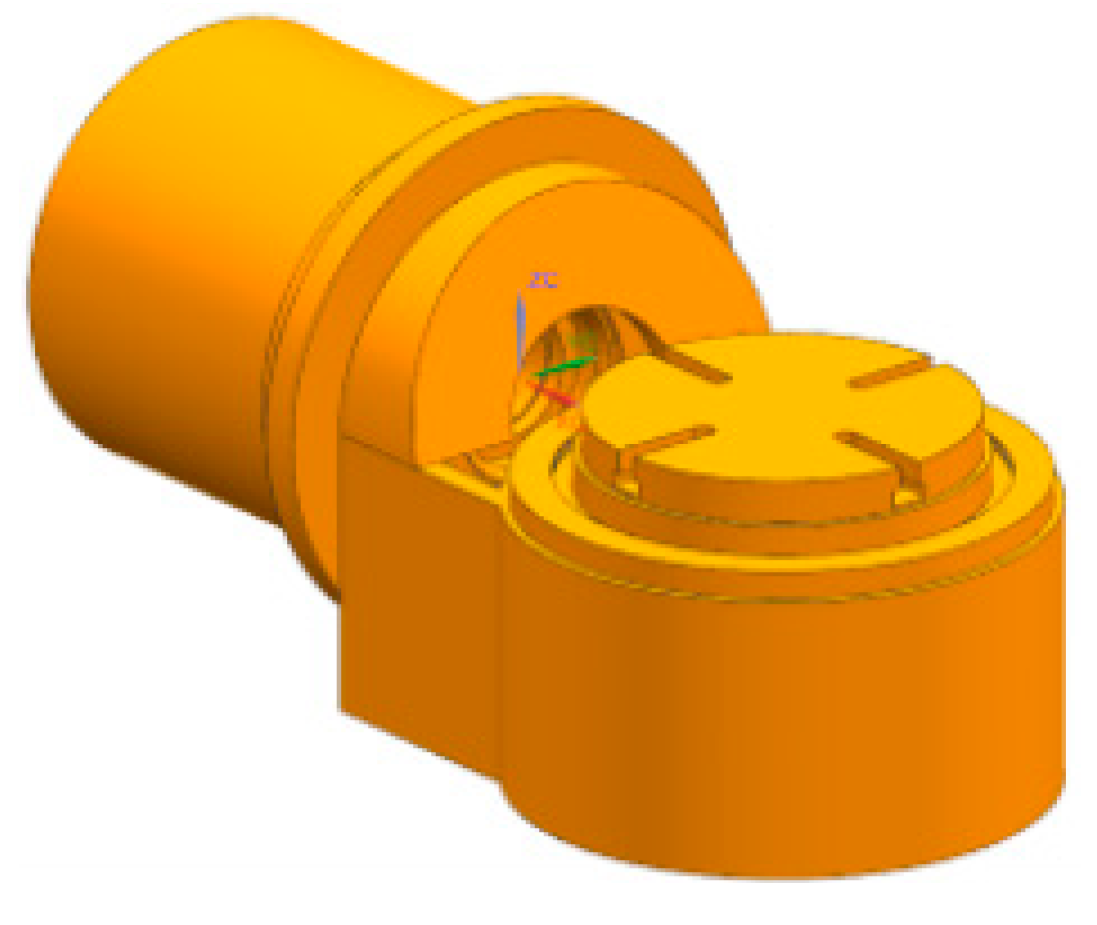
Figure 3.
Three-dimensional model of direct-drive turntable.
Figure 3.
Three-dimensional model of direct-drive turntable.
Figure 4.
Finite element model of direct-drive turntable.
Figure 4.
Finite element model of direct-drive turntable.
Figure 5.
Diagram of cutting force load point position.
Figure 5.
Diagram of cutting force load point position.
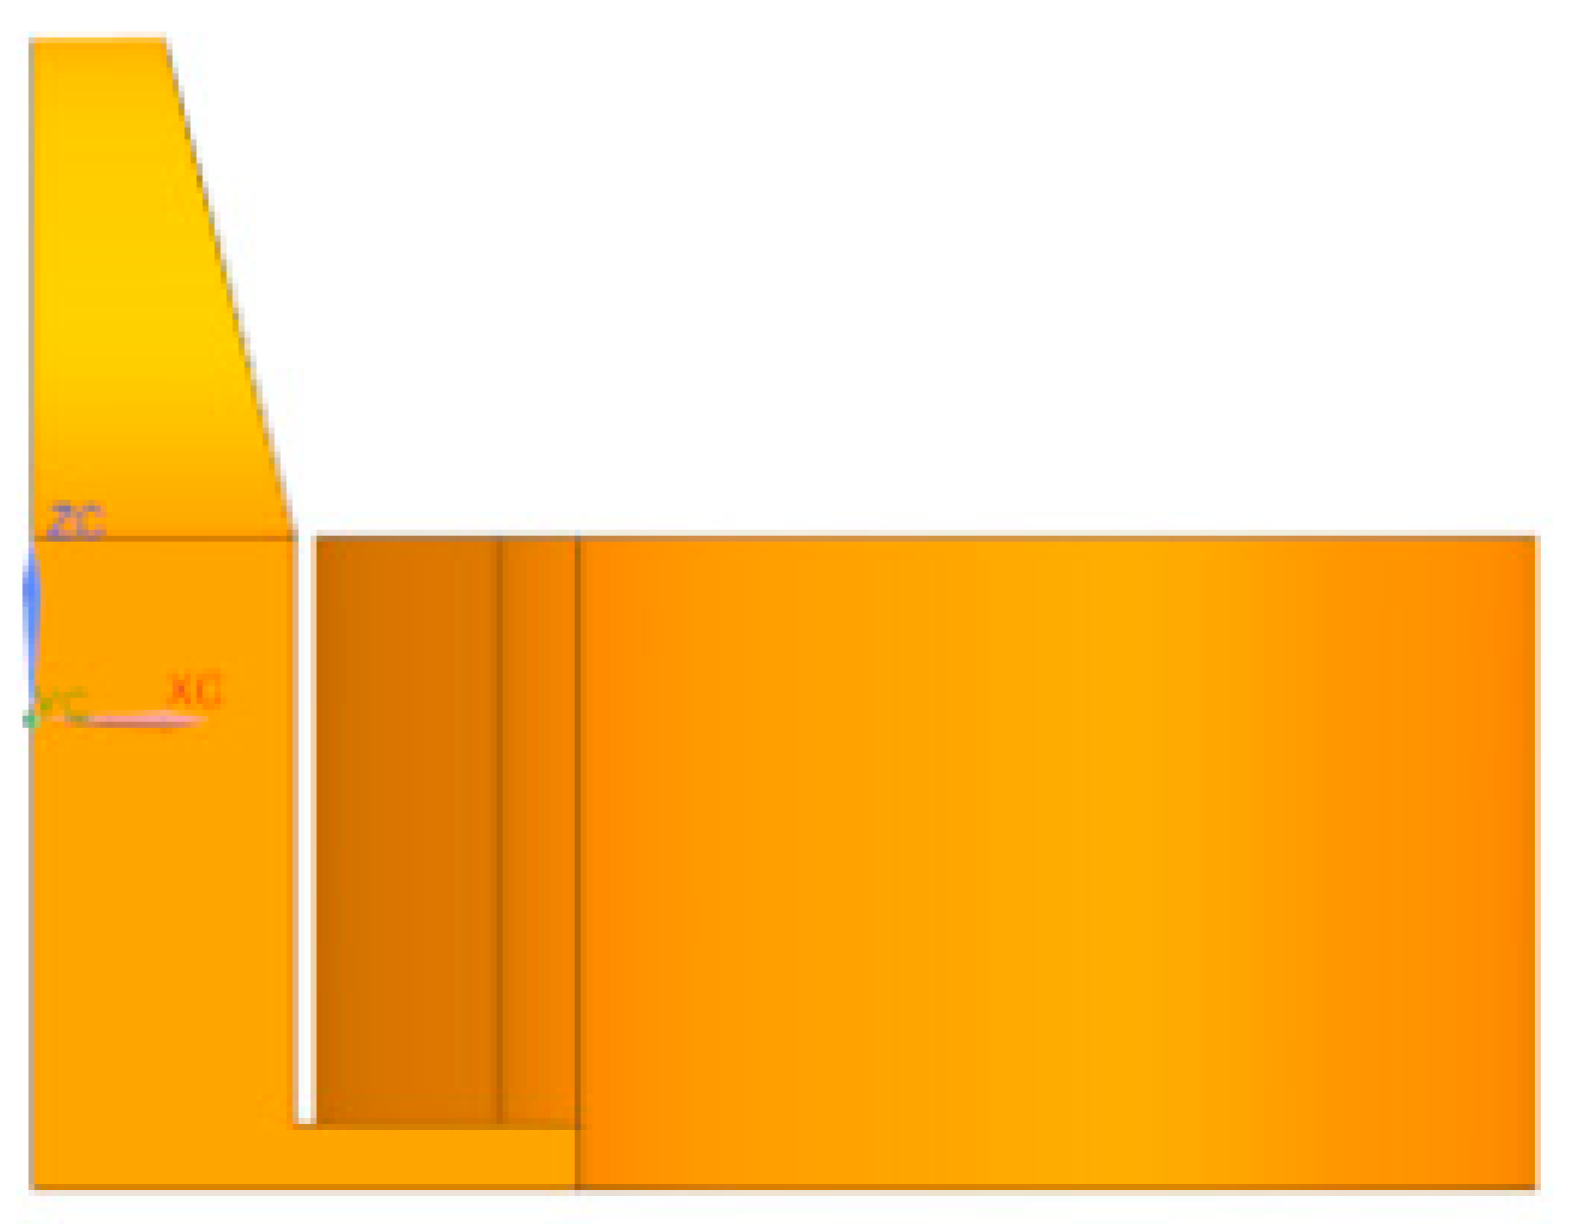
Figure 6.
Optimization and exclusion regions of topology optimization.
Figure 6.
Optimization and exclusion regions of topology optimization.
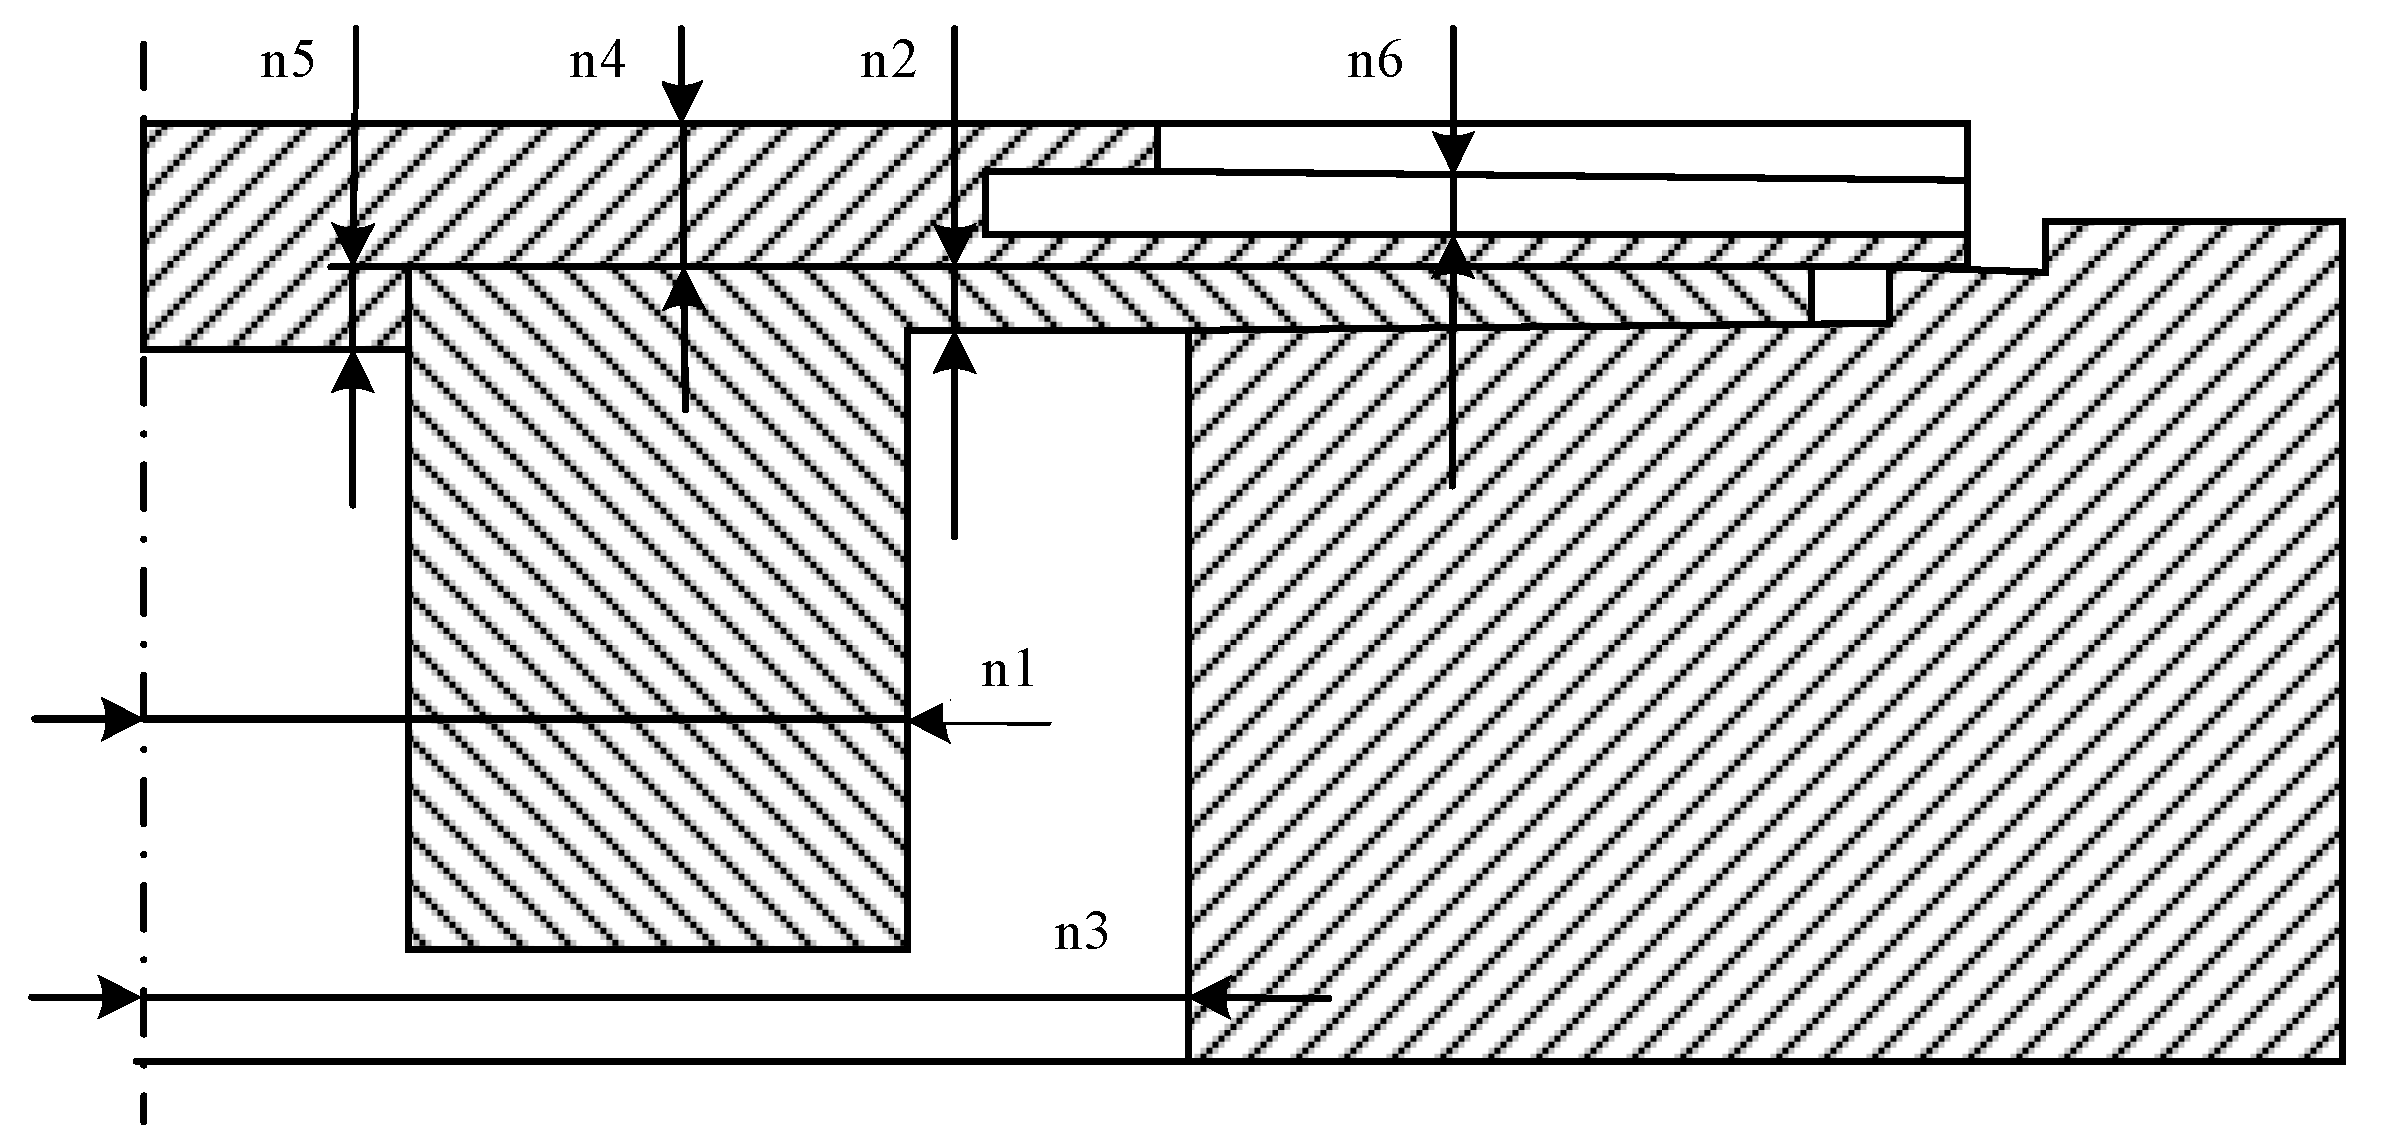
Figure 7.
Optimal design parameters of C-axis.
Figure 7.
Optimal design parameters of C-axis.
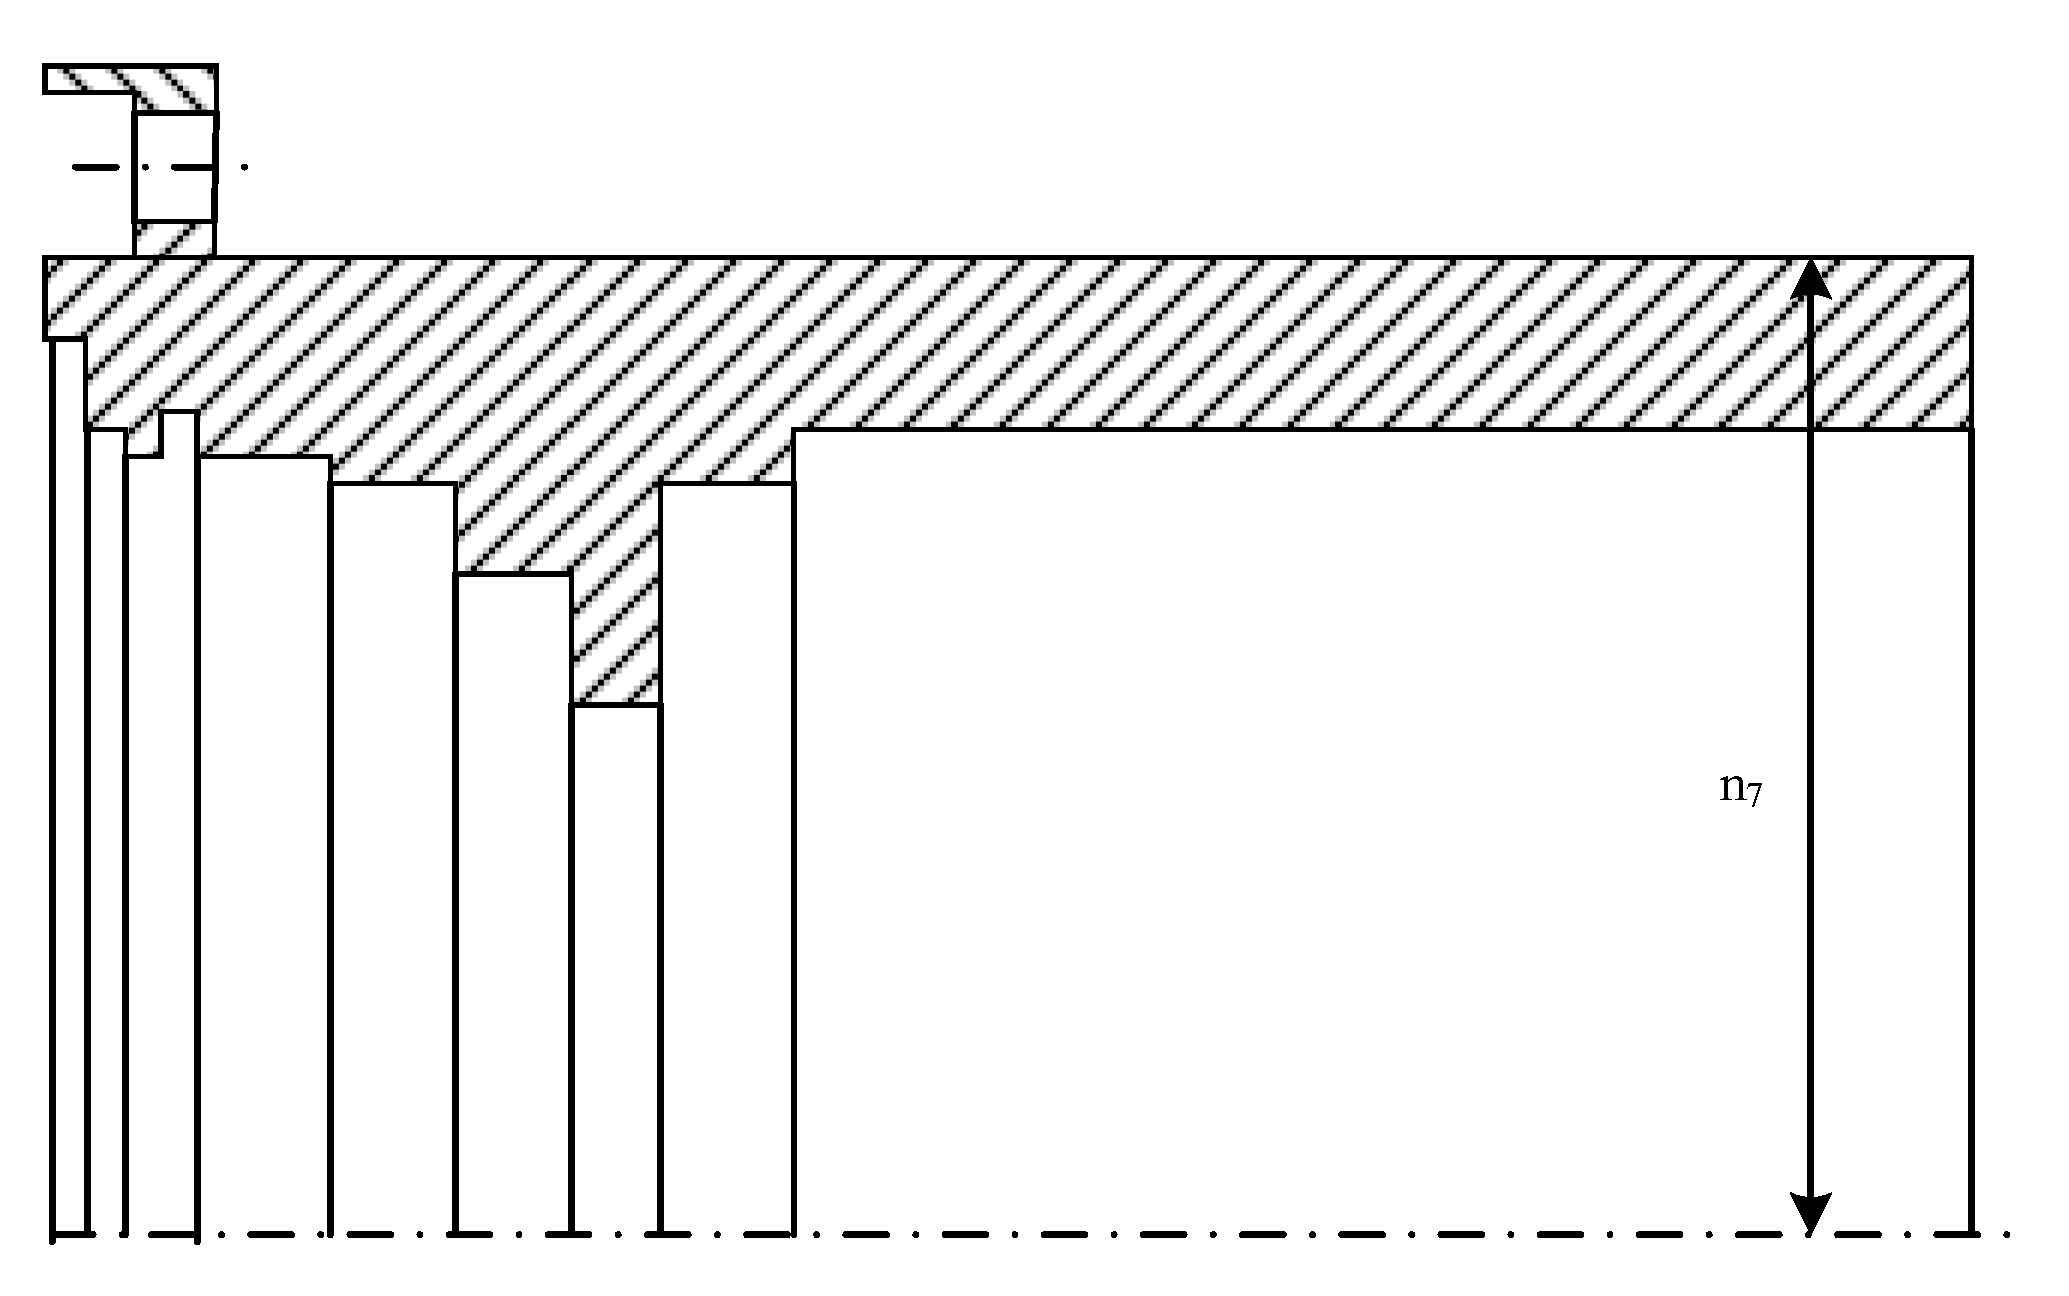
Figure 8.
Optimal design parameters of A-axis.
Figure 8.
Optimal design parameters of A-axis.
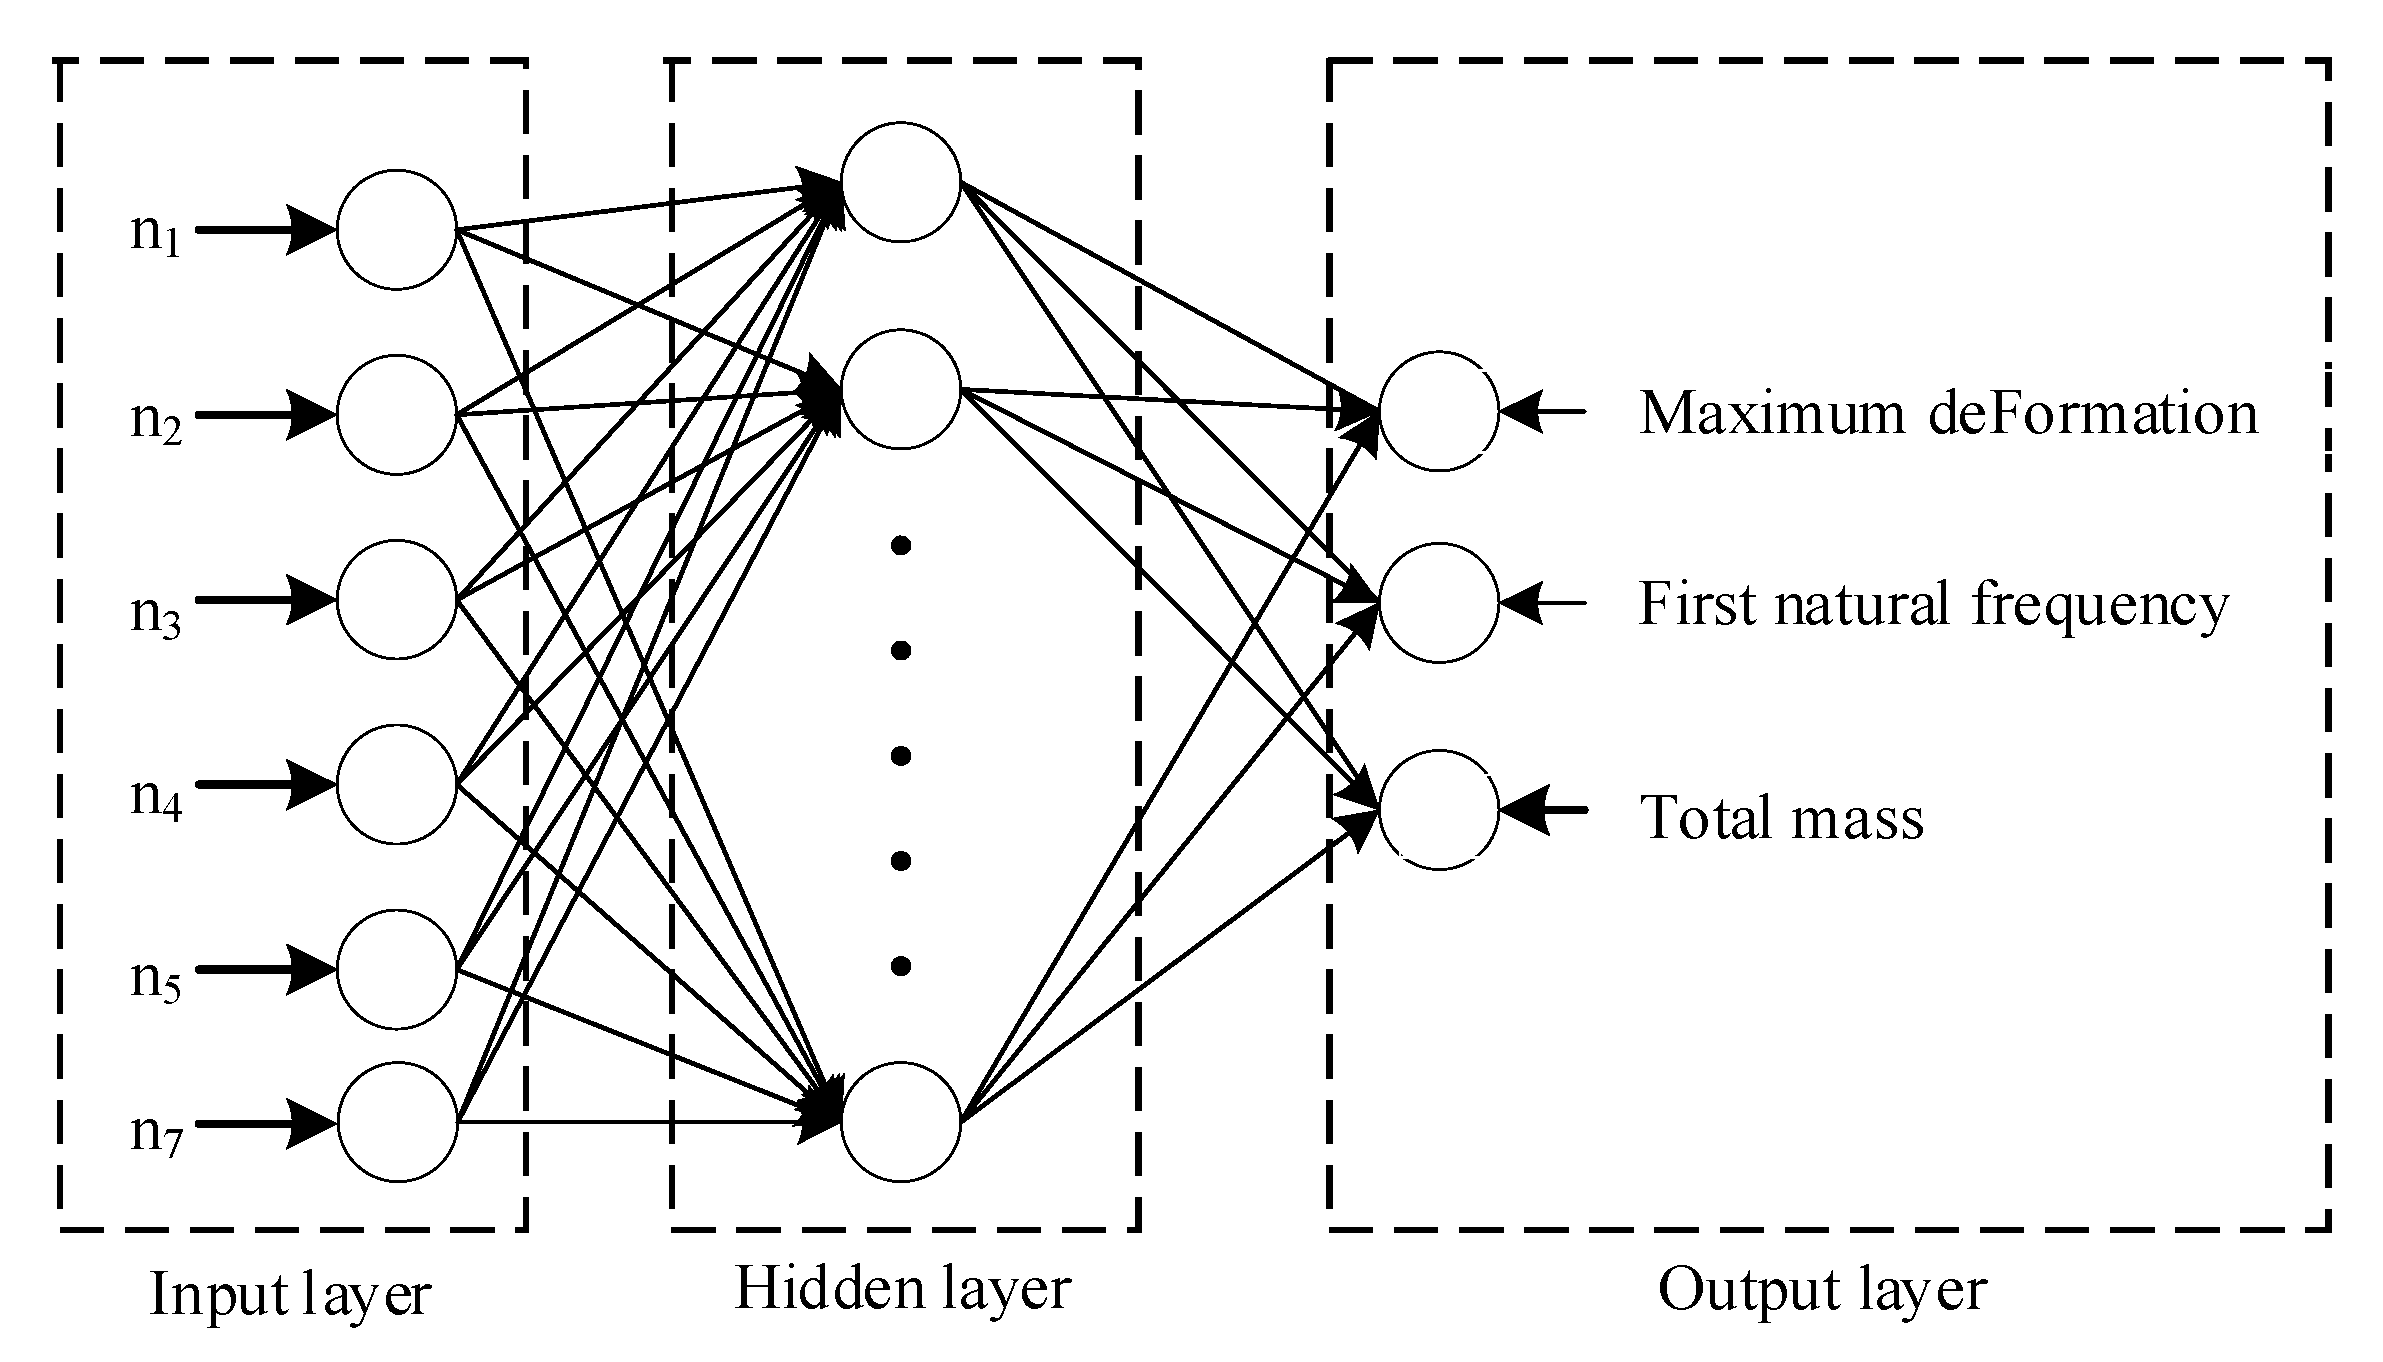
Figure 9.
Mapping relationship between sample data and optimization objective.
Figure 9.
Mapping relationship between sample data and optimization objective.
Figure 10.
The maximum deformation at different loading positions under milling condition.
Figure 10.
The maximum deformation at different loading positions under milling condition.
Figure 11.
The milling stress nephogram of the maximum deformation position.
Figure 11.
The milling stress nephogram of the maximum deformation position.
Figure 12.
The maximum deformation at different loading positions under turning condition.
Figure 12.
The maximum deformation at different loading positions under turning condition.
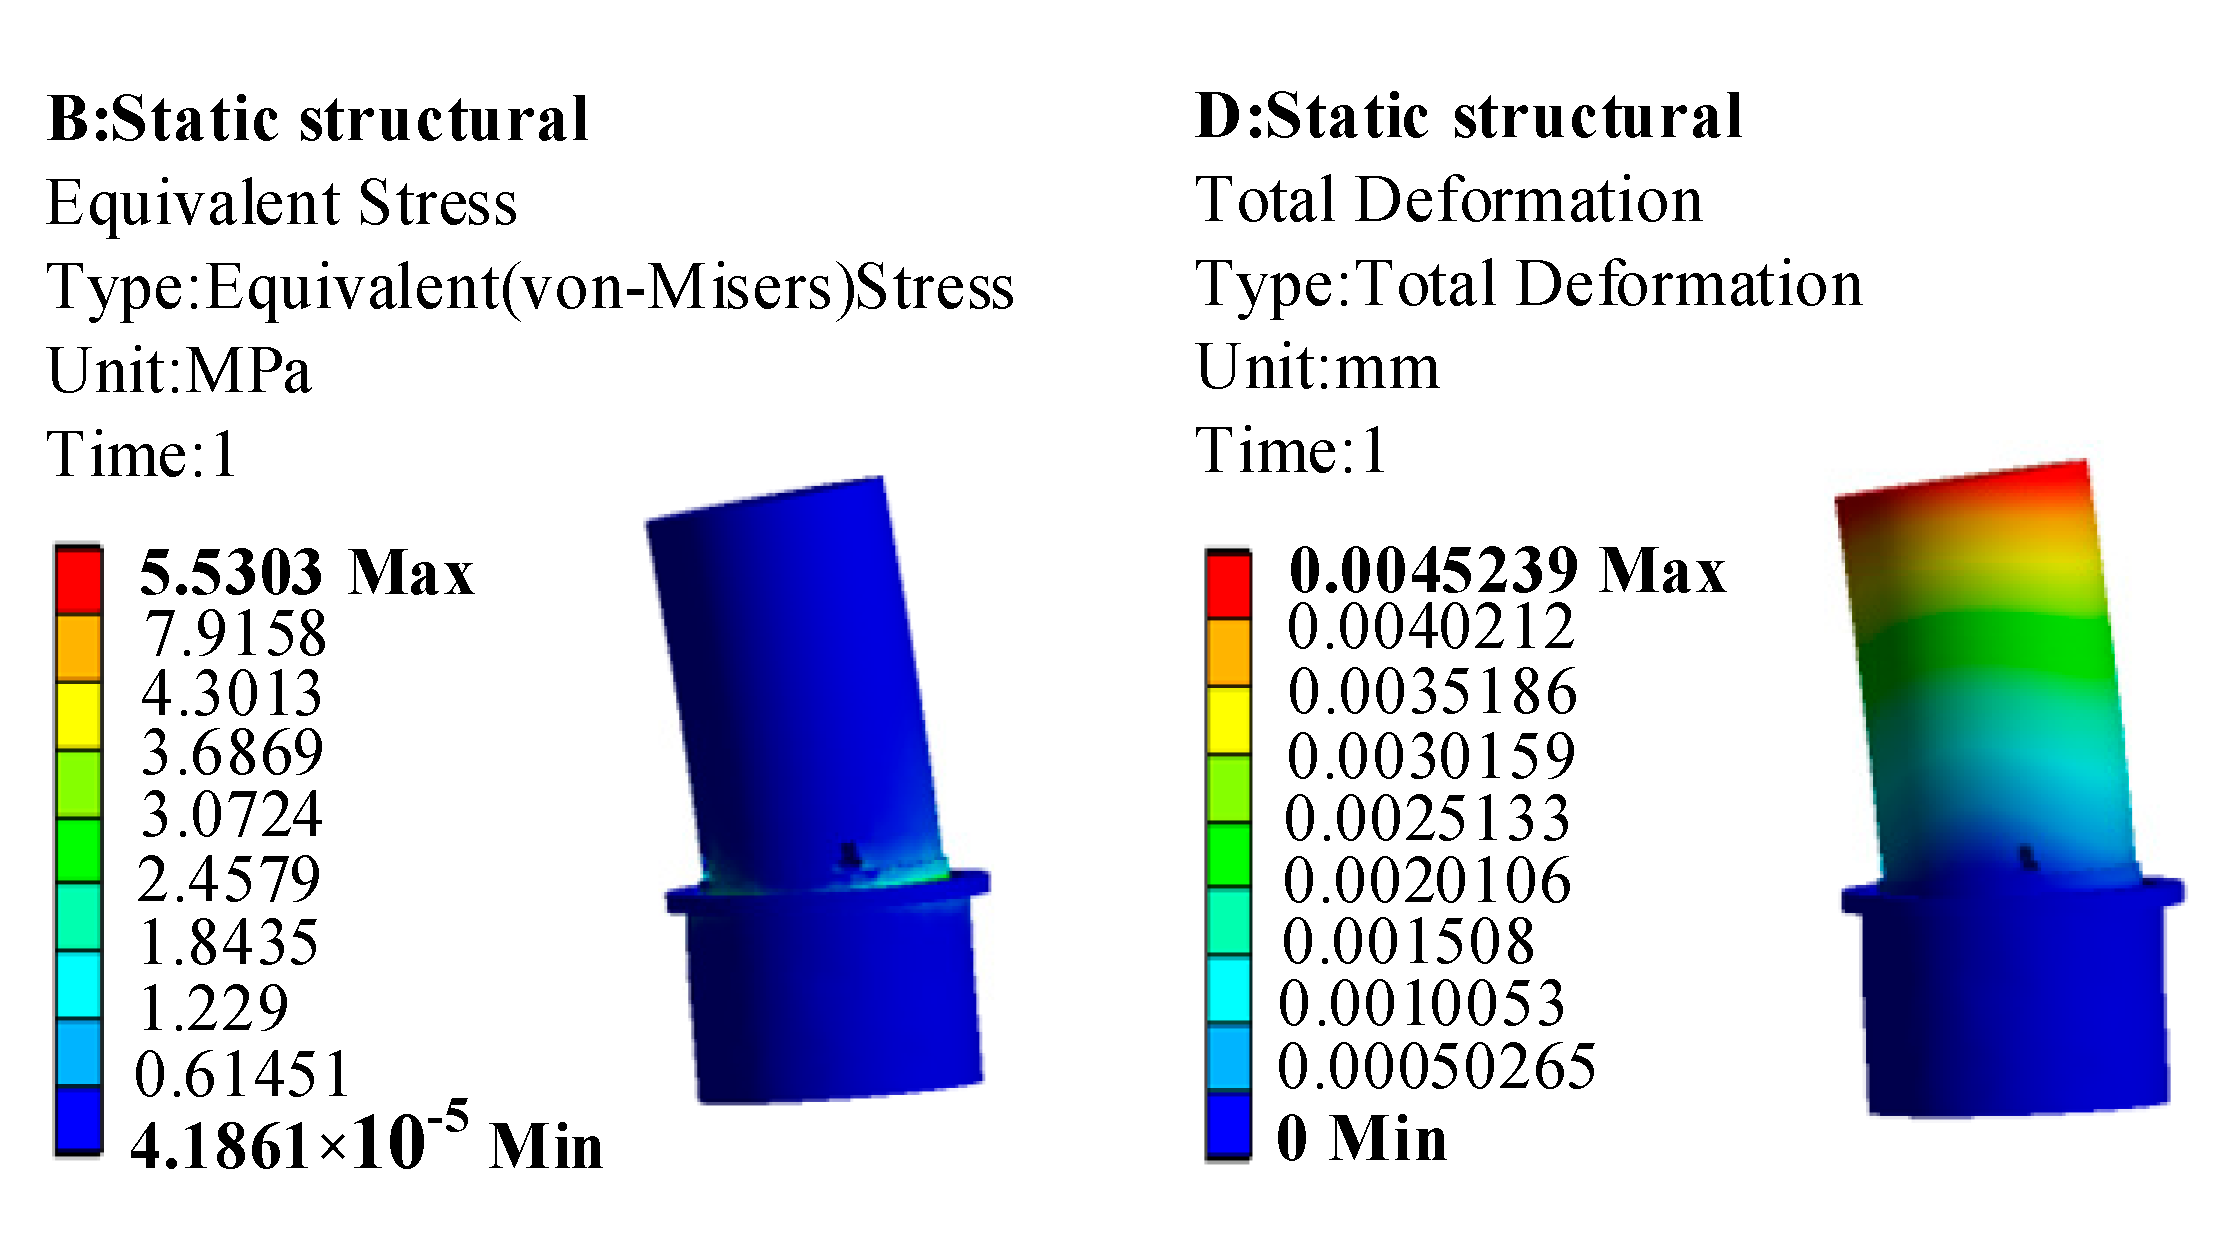
Figure 13.
The turning stress nephogram and deformation nephogram of the maximum deformation position.
Figure 13.
The turning stress nephogram and deformation nephogram of the maximum deformation position.
Figure 14.
Nephogram of the first six vibration modes under milling conditions.
Figure 14.
Nephogram of the first six vibration modes under milling conditions.
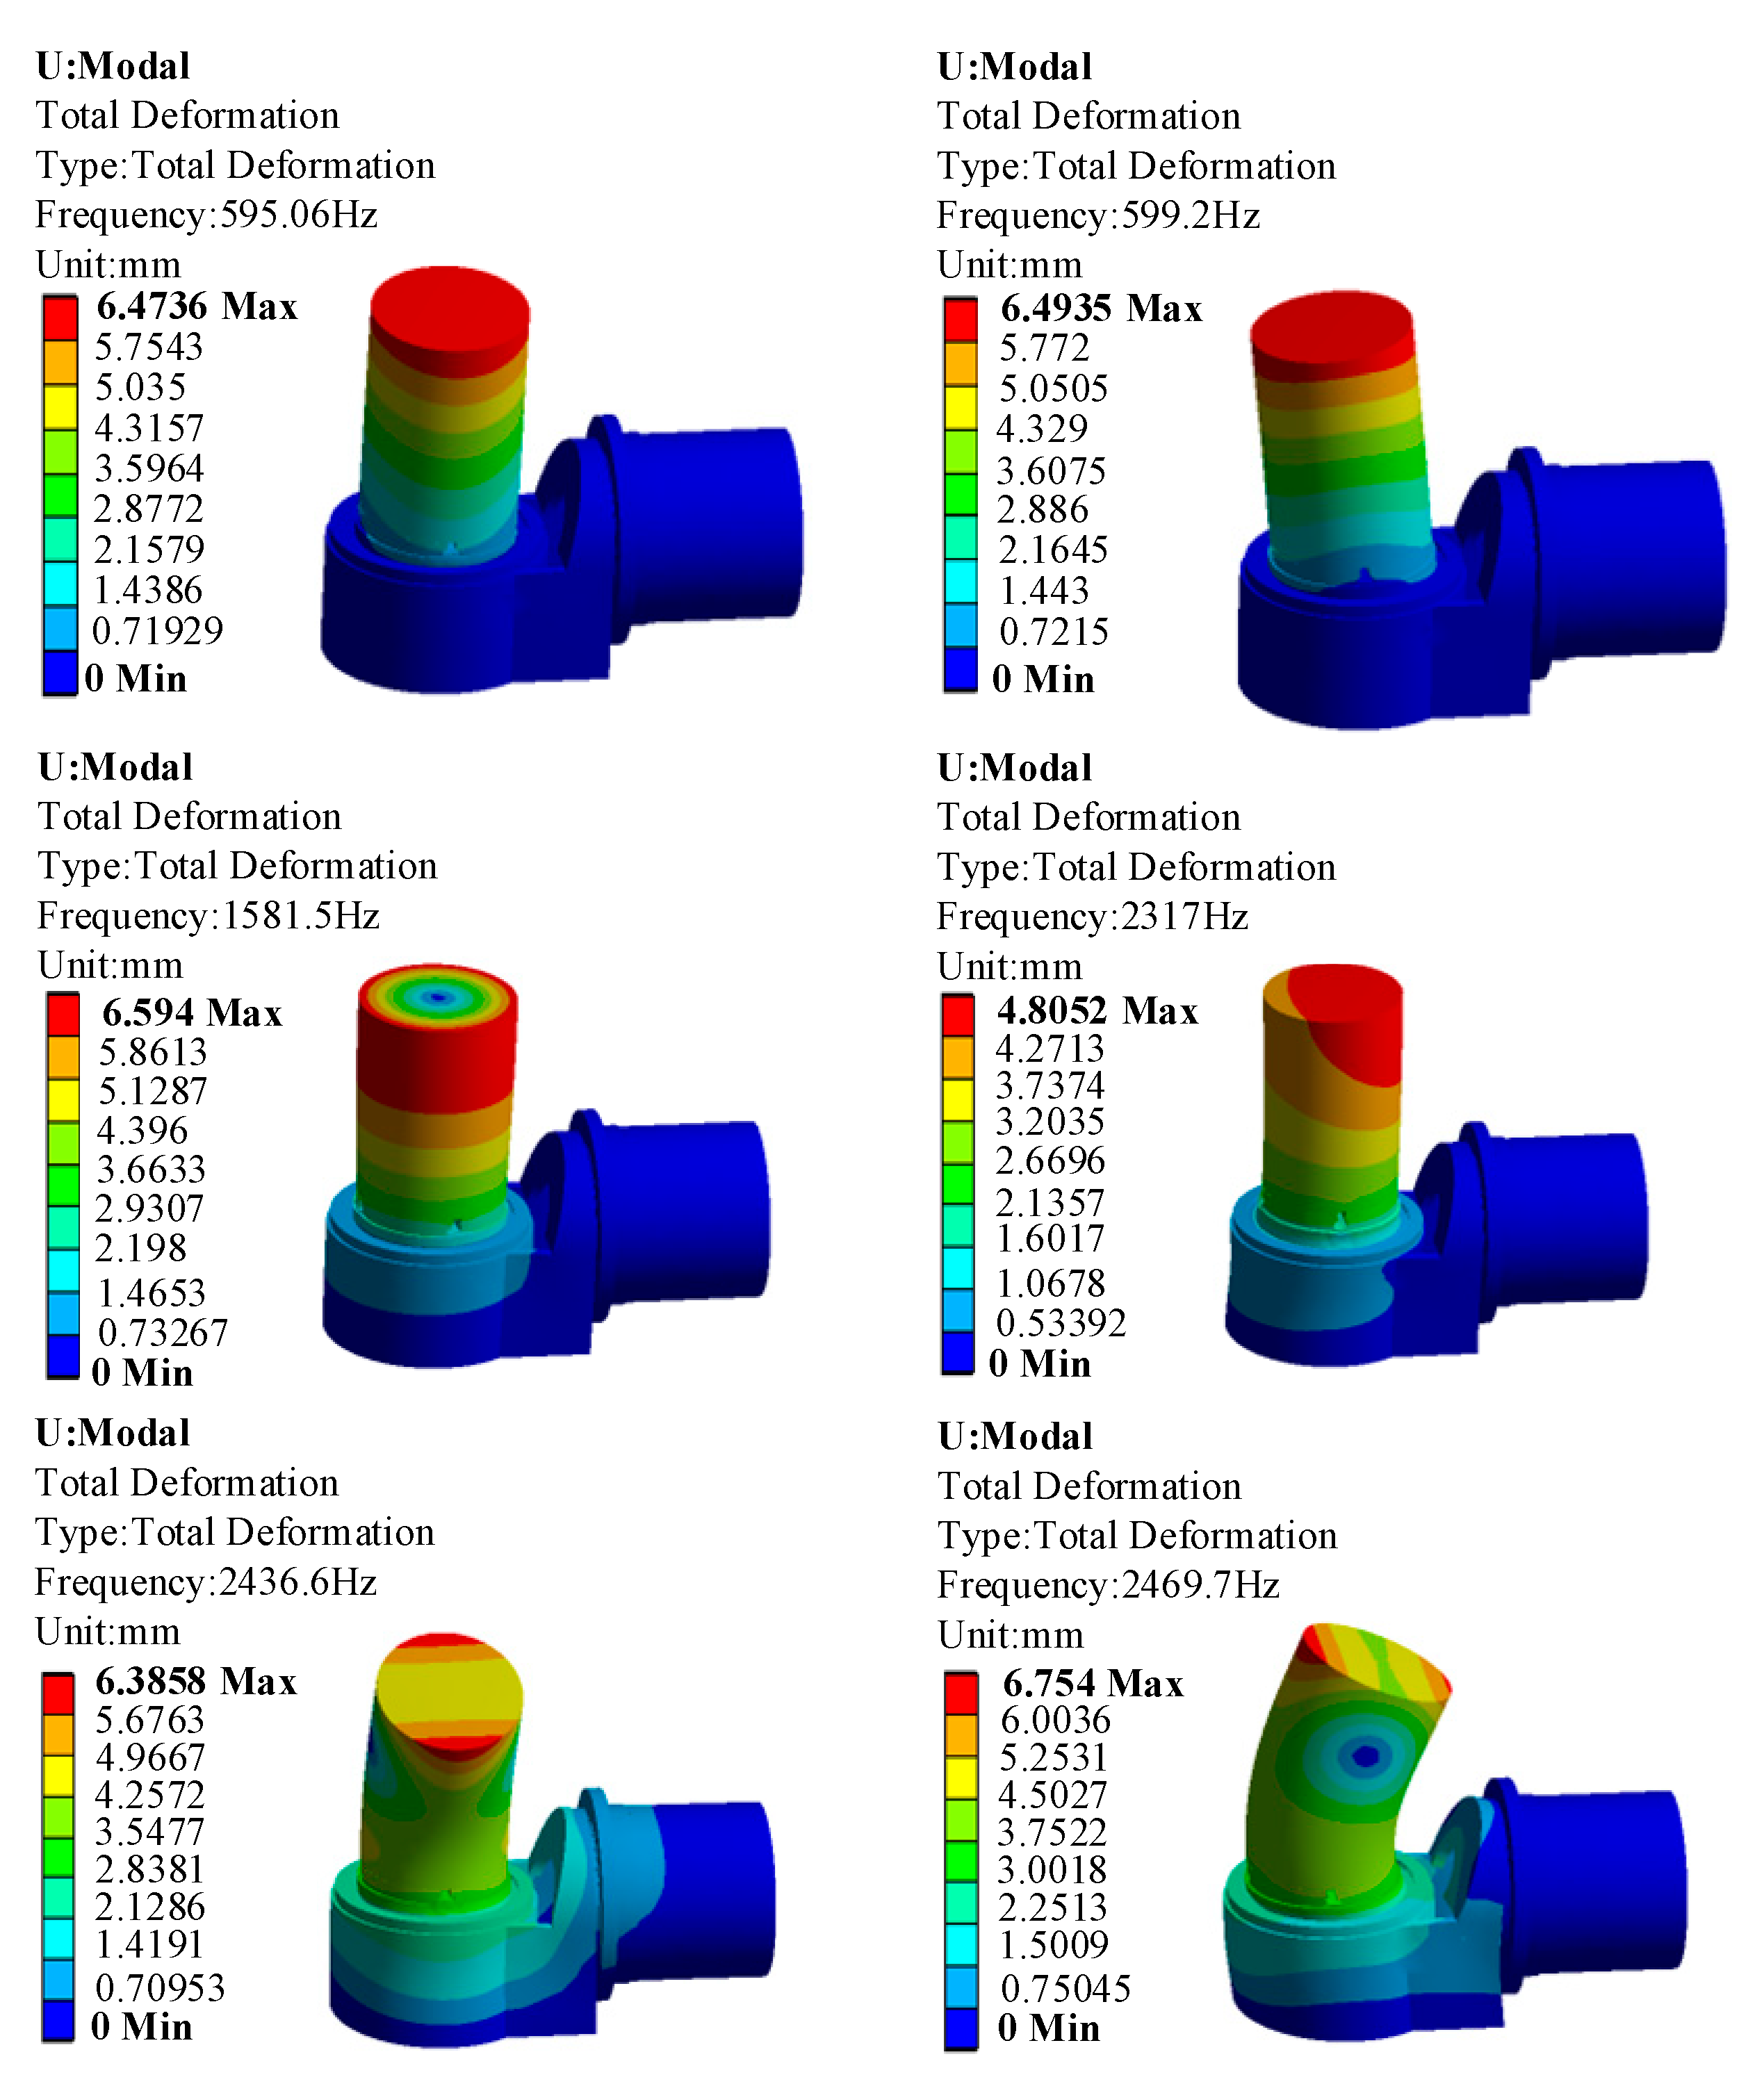
Figure 15.
Nephogram of the first six vibration modes under turning conditions.
Figure 15.
Nephogram of the first six vibration modes under turning conditions.
Figure 16.
Harmonic response curve of turntable under edge loading: (a) X-directional harmonic response curve; (b) Y-directional harmonic response curve; (c) Z-directional harmonic response curve.
Figure 16.
Harmonic response curve of turntable under edge loading: (a) X-directional harmonic response curve; (b) Y-directional harmonic response curve; (c) Z-directional harmonic response curve.
Figure 17.
Harmonic response curve of turntable under center loading: (a) X-directional harmonic response curve; (b) Y-directional harmonic response curve; (c) Z-directional harmonic response curve.
Figure 17.
Harmonic response curve of turntable under center loading: (a) X-directional harmonic response curve; (b) Y-directional harmonic response curve; (c) Z-directional harmonic response curve.
Figure 18.
Topology optimization results of direct-drive turntable in turning condition: (a) 50% mass retention rate; (b) 60% mass retention rate.
Figure 18.
Topology optimization results of direct-drive turntable in turning condition: (a) 50% mass retention rate; (b) 60% mass retention rate.
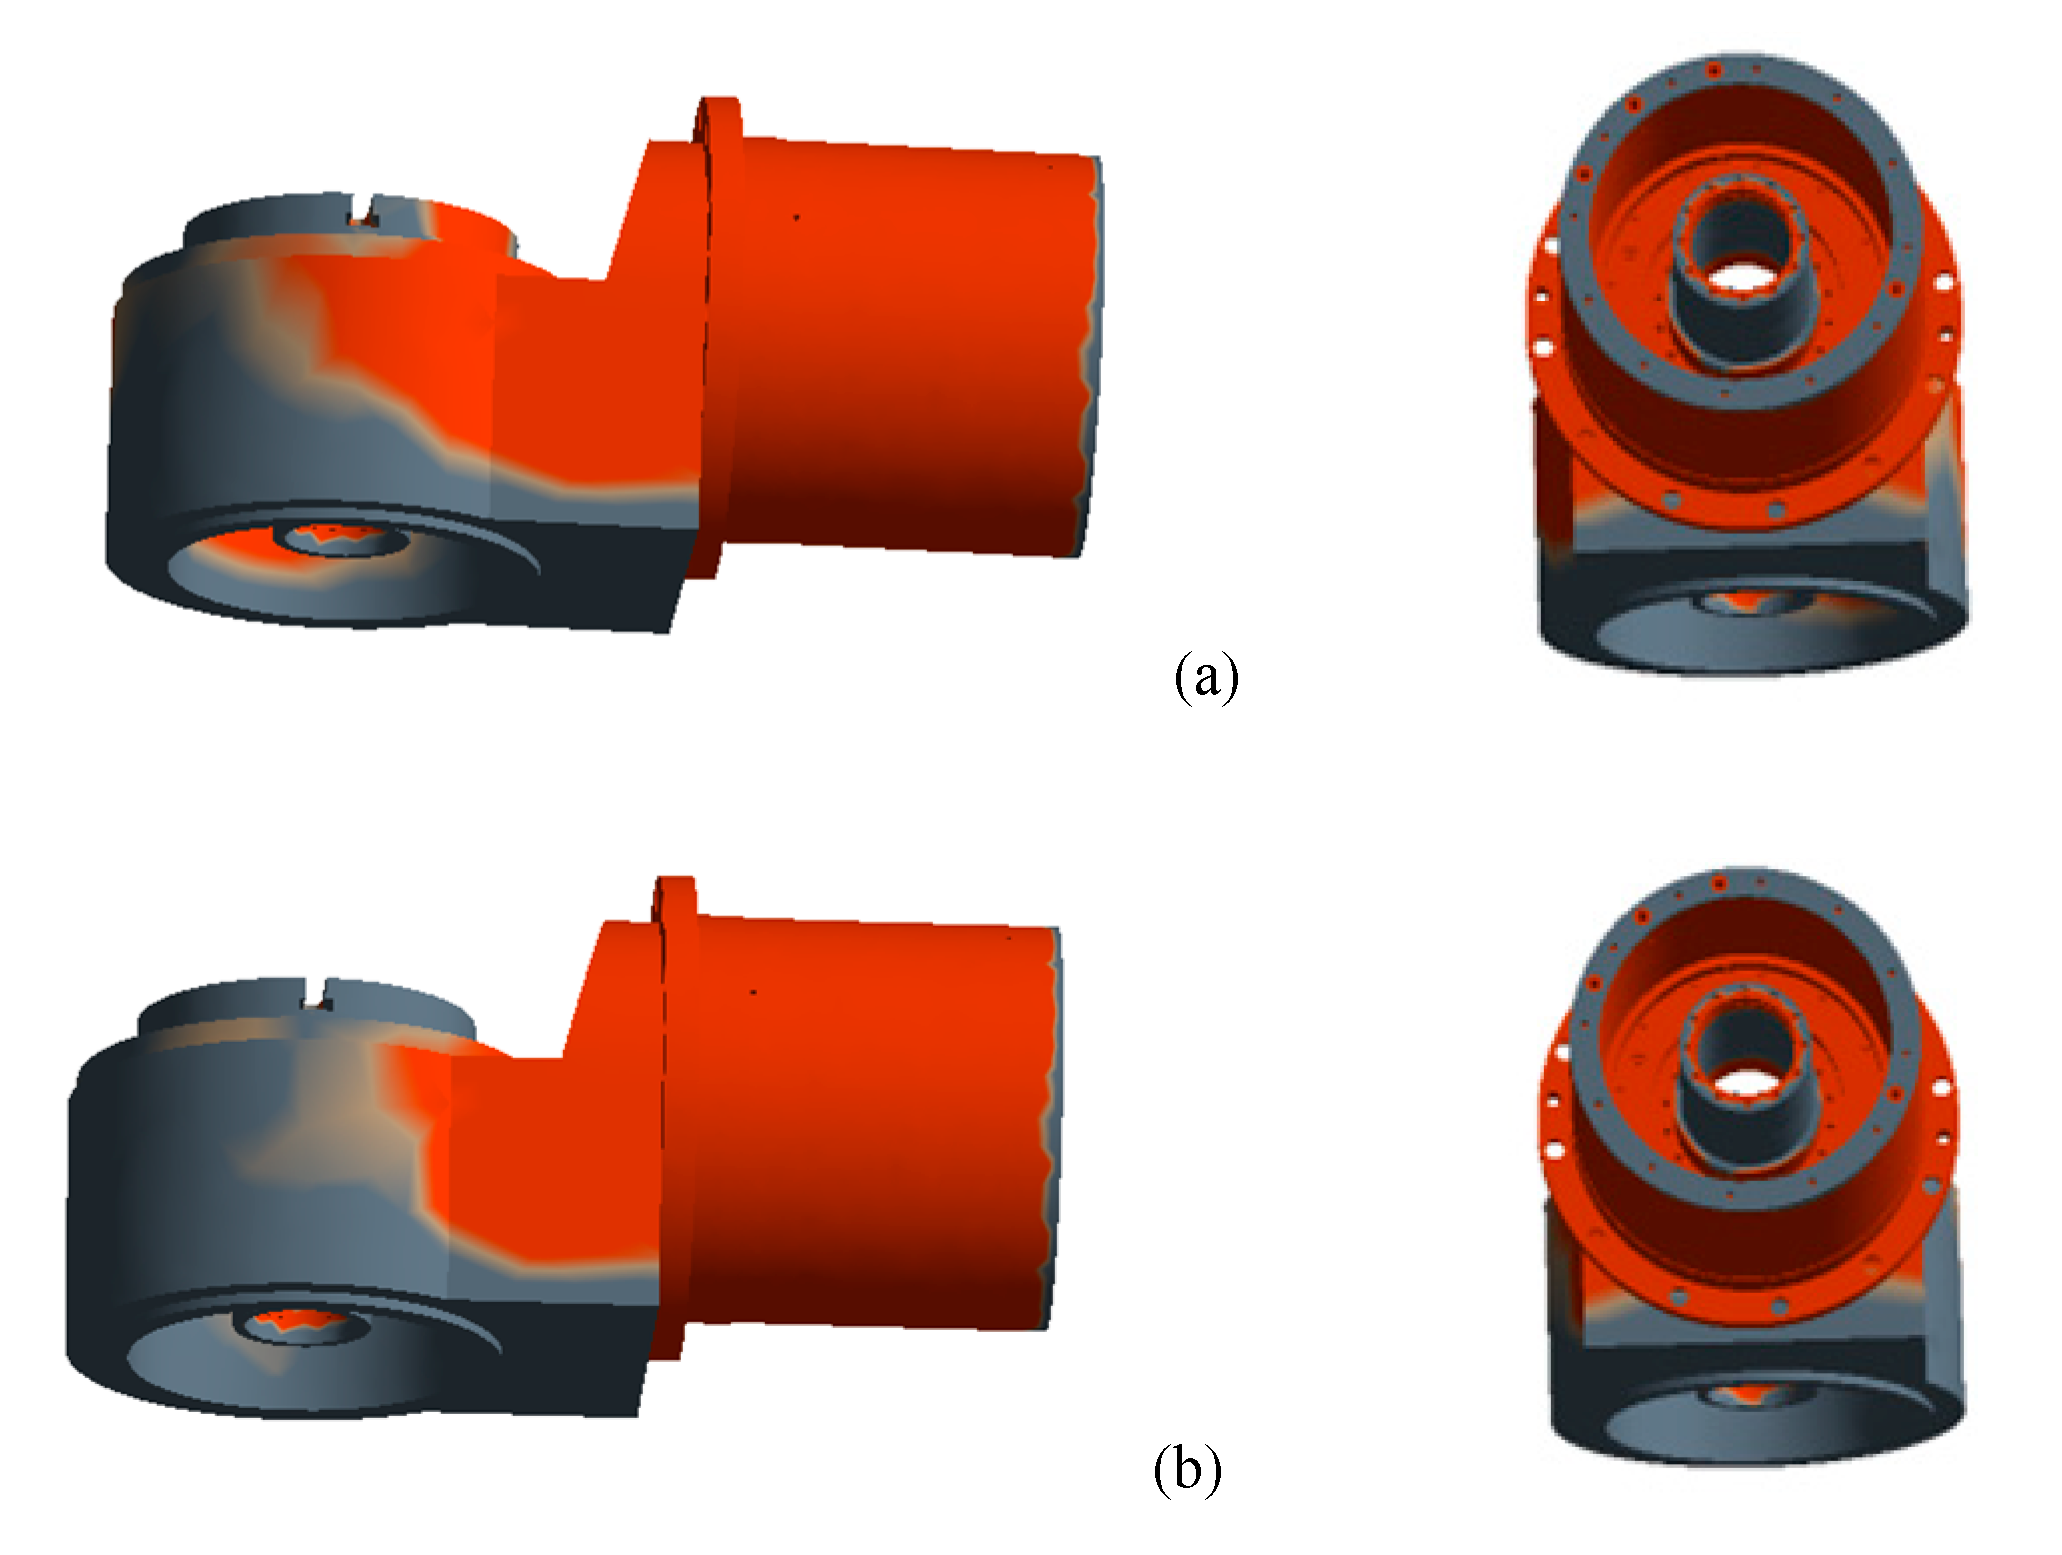
Figure 19.
Topology optimization results of direct-drive turntable in milling condition: (a) 50% mass retention rate; (b) 60% mass retention rate.
Figure 19.
Topology optimization results of direct-drive turntable in milling condition: (a) 50% mass retention rate; (b) 60% mass retention rate.
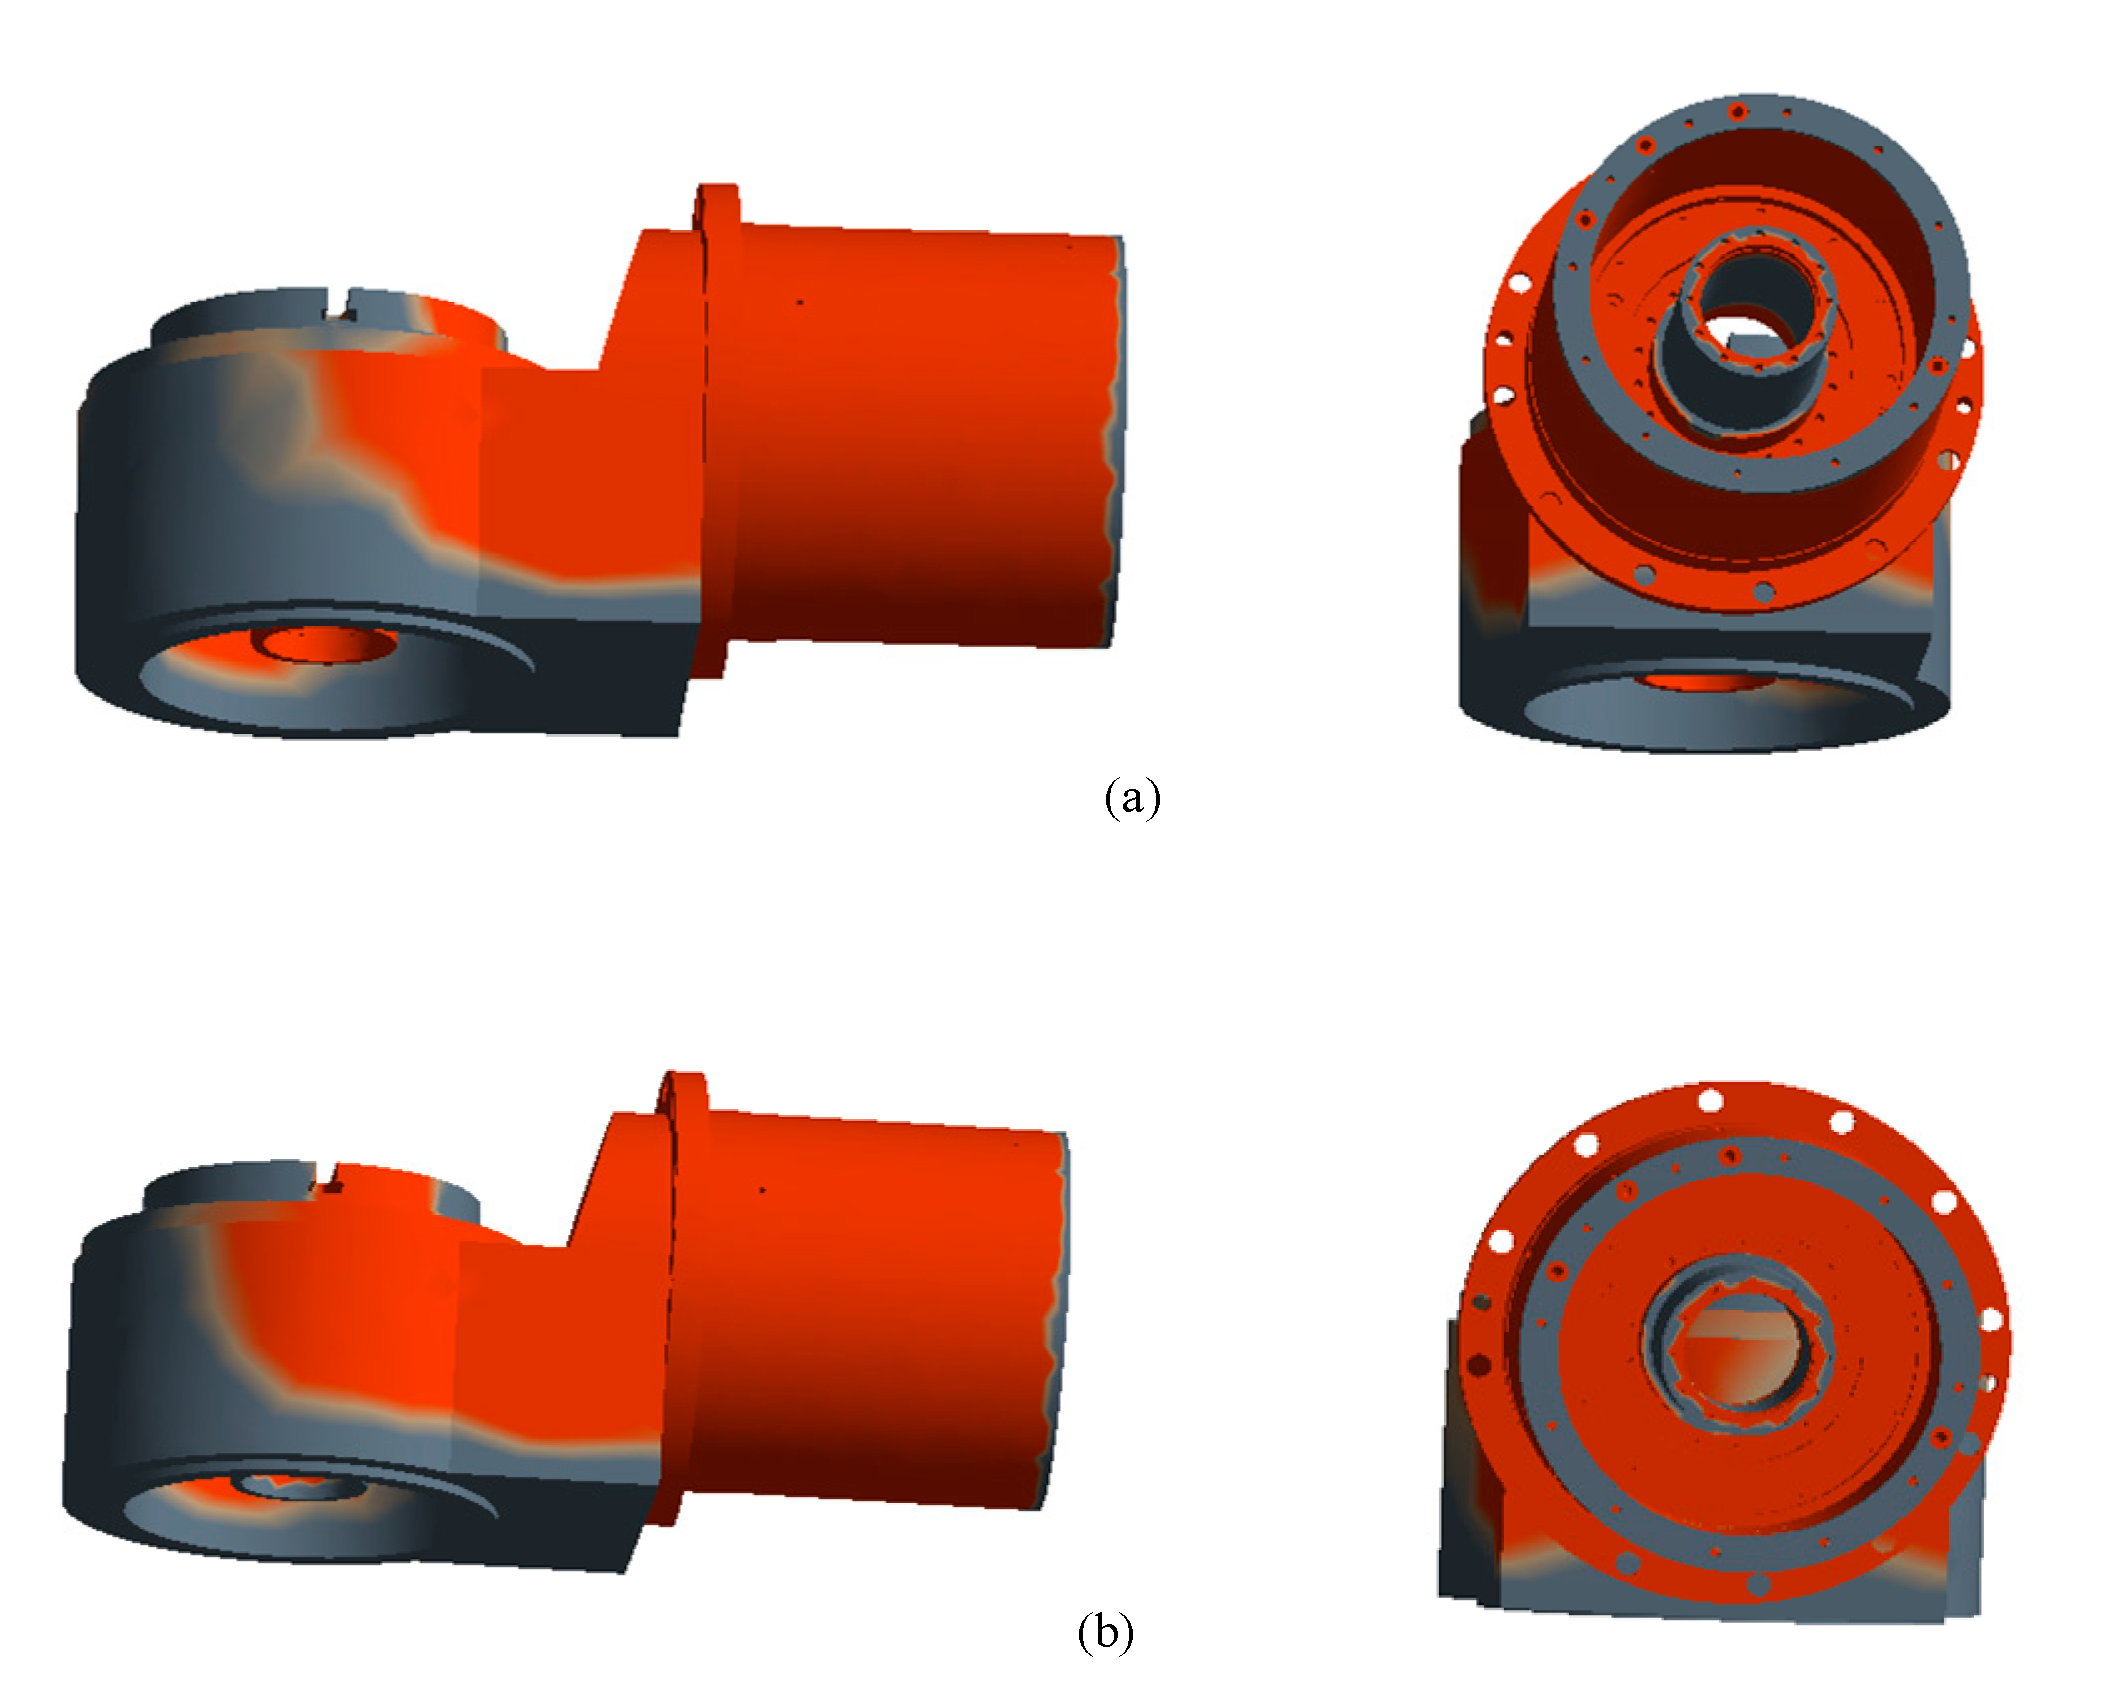
Figure 20.
Topology optimization results of direct-drive turntable in composite condition: (a) 50% mass retention rate; (b) 60% mass retention rate.
Figure 20.
Topology optimization results of direct-drive turntable in composite condition: (a) 50% mass retention rate; (b) 60% mass retention rate.
Figure 21.
Topological structure of swing frame: (a) opening square hole; (b) opening round hole.
Figure 21.
Topological structure of swing frame: (a) opening square hole; (b) opening round hole.
Figure 22.
Deformation nephogram of direct-drive turntable with different swing frames in milling working condition: (a) opening square hole; (b) opening round hole.
Figure 22.
Deformation nephogram of direct-drive turntable with different swing frames in milling working condition: (a) opening square hole; (b) opening round hole.
Figure 23.
Improved swing frame.
Figure 23.
Improved swing frame.
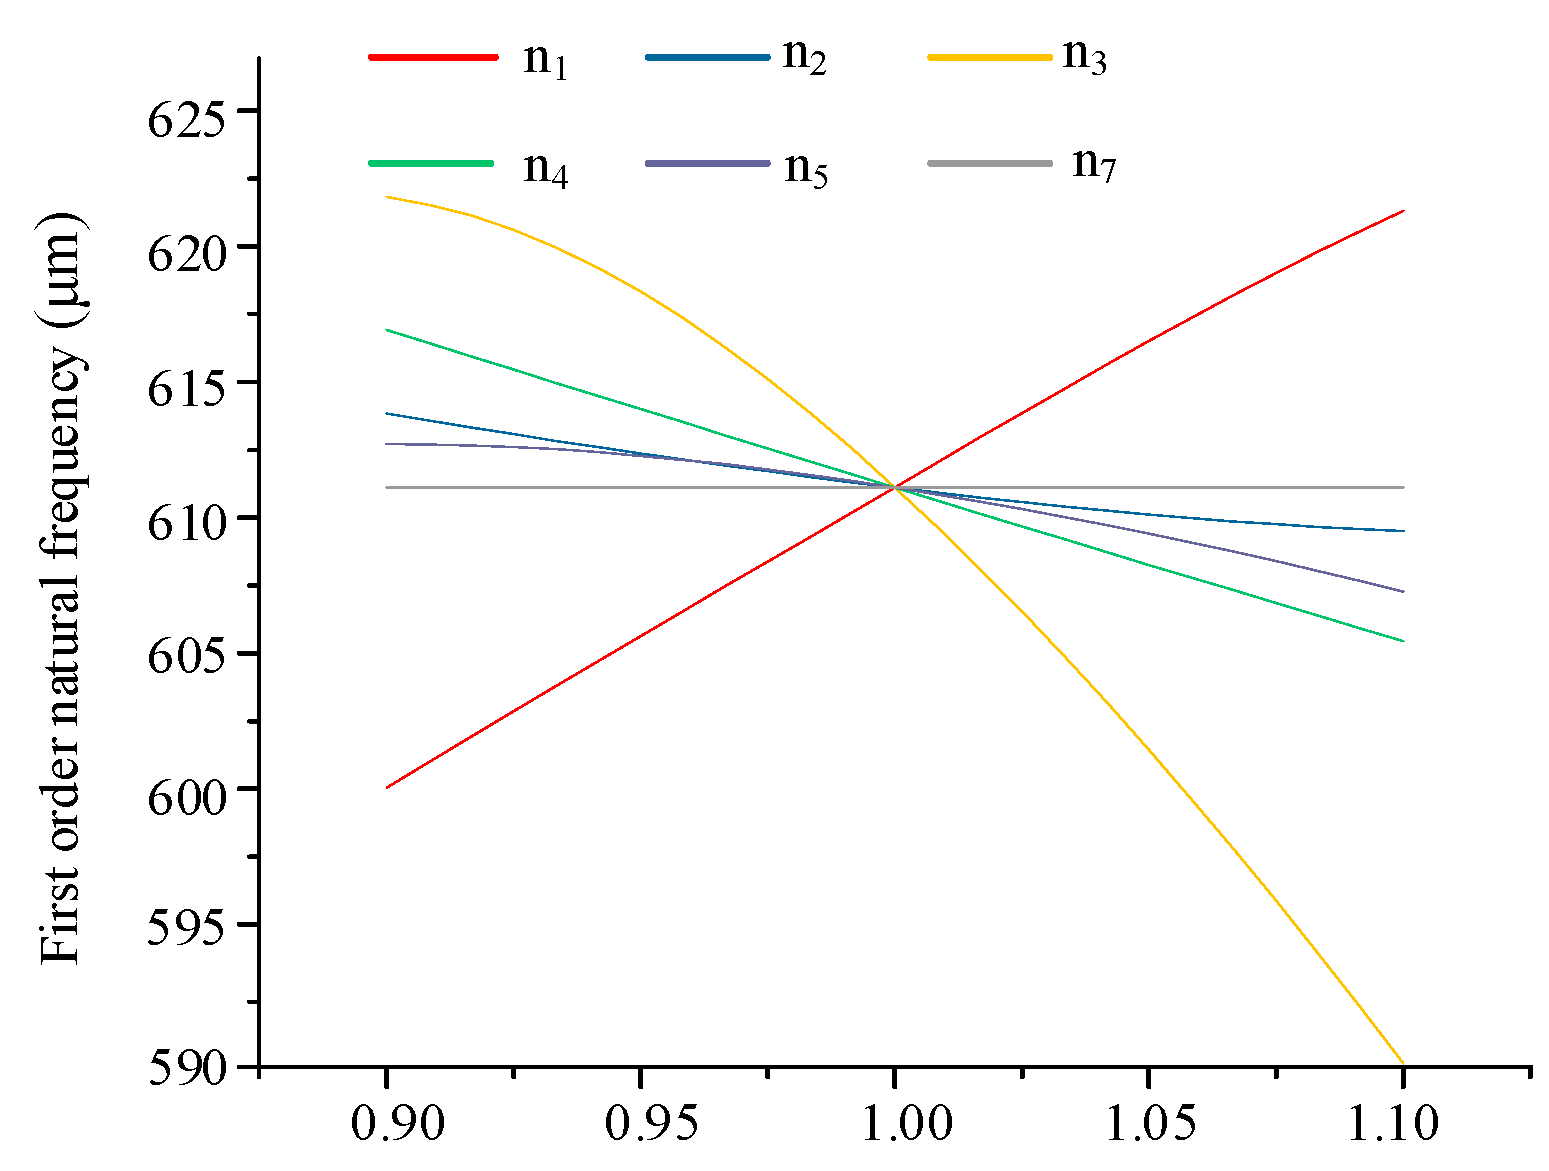
Figure 24.
Correlation of 7 optimization parameters to natural frequency sensitivity.
Figure 24.
Correlation of 7 optimization parameters to natural frequency sensitivity.
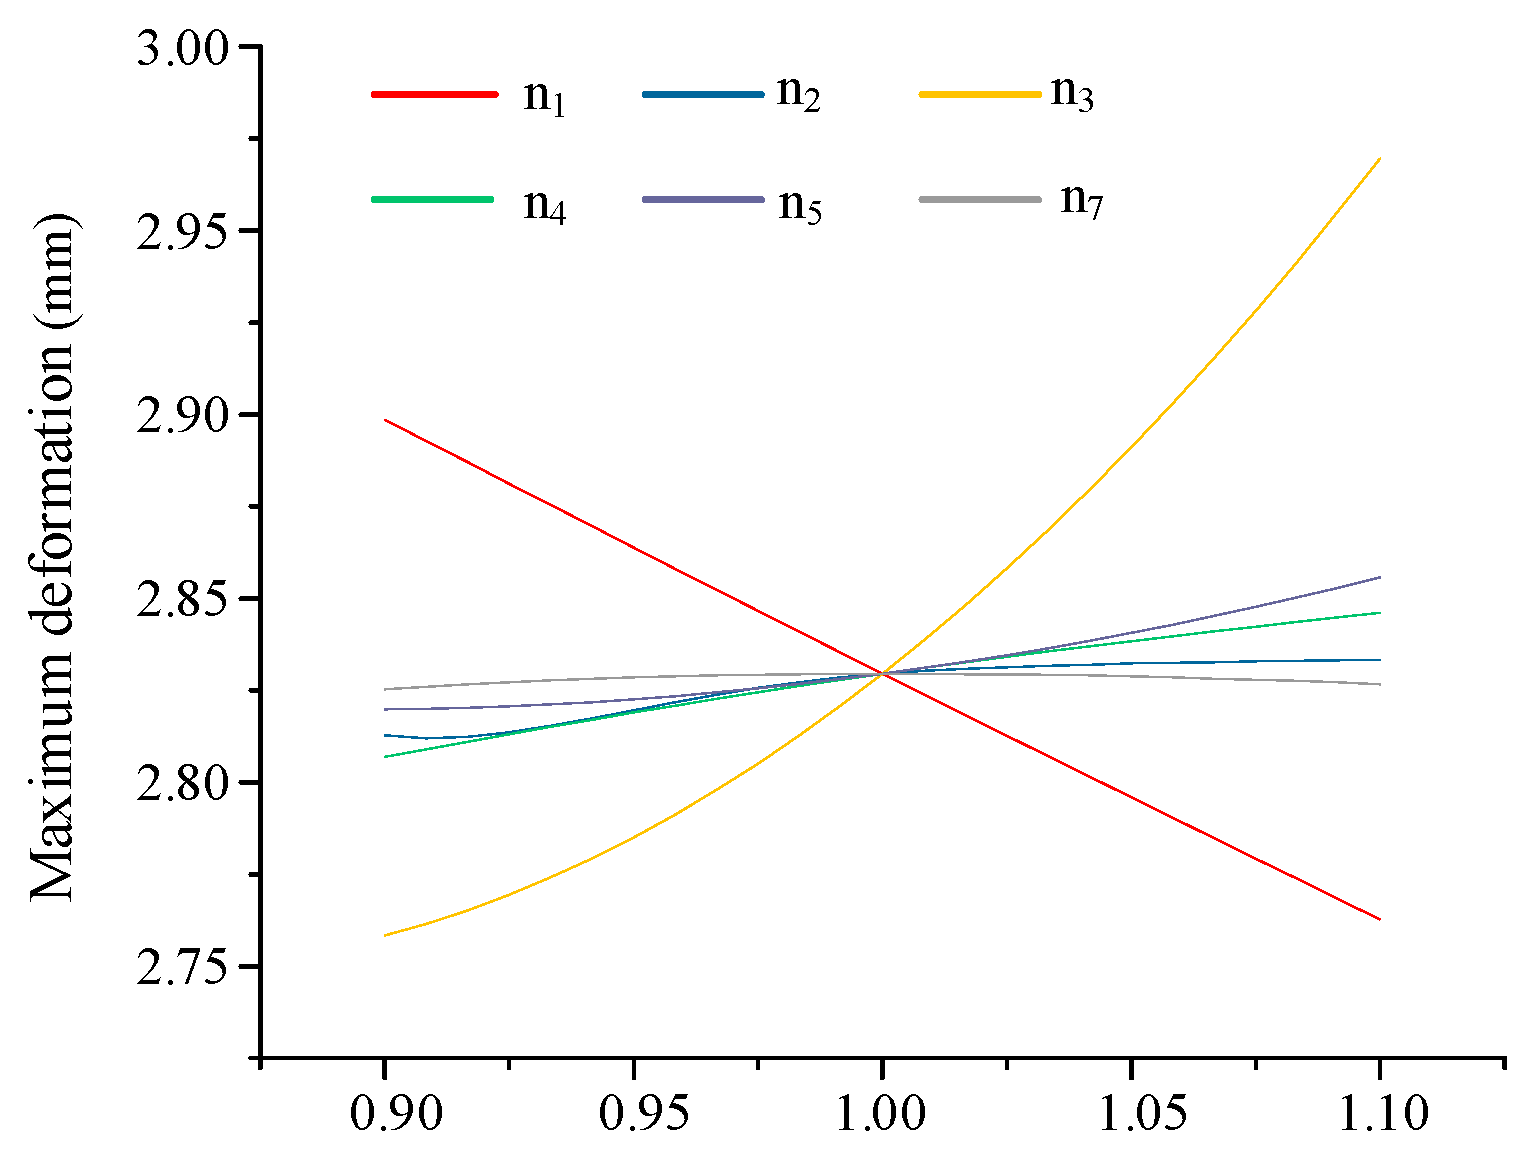
Figure 25.
Correlation of 7 optimization parameters to maximum deformation sensitivity.
Figure 25.
Correlation of 7 optimization parameters to maximum deformation sensitivity.
Figure 26.
Correlation of 7 optimization parameters to total mass sensitivity.
Figure 26.
Correlation of 7 optimization parameters to total mass sensitivity.
Figure 27.
Deformation response curve.
Figure 27.
Deformation response curve.
Figure 28.
Frequency response curve.
Figure 28.
Frequency response curve.
Figure 29.
Mass response curve.
Figure 29.
Mass response curve.
Figure 30.
Normalized curve.
Figure 30.
Normalized curve.
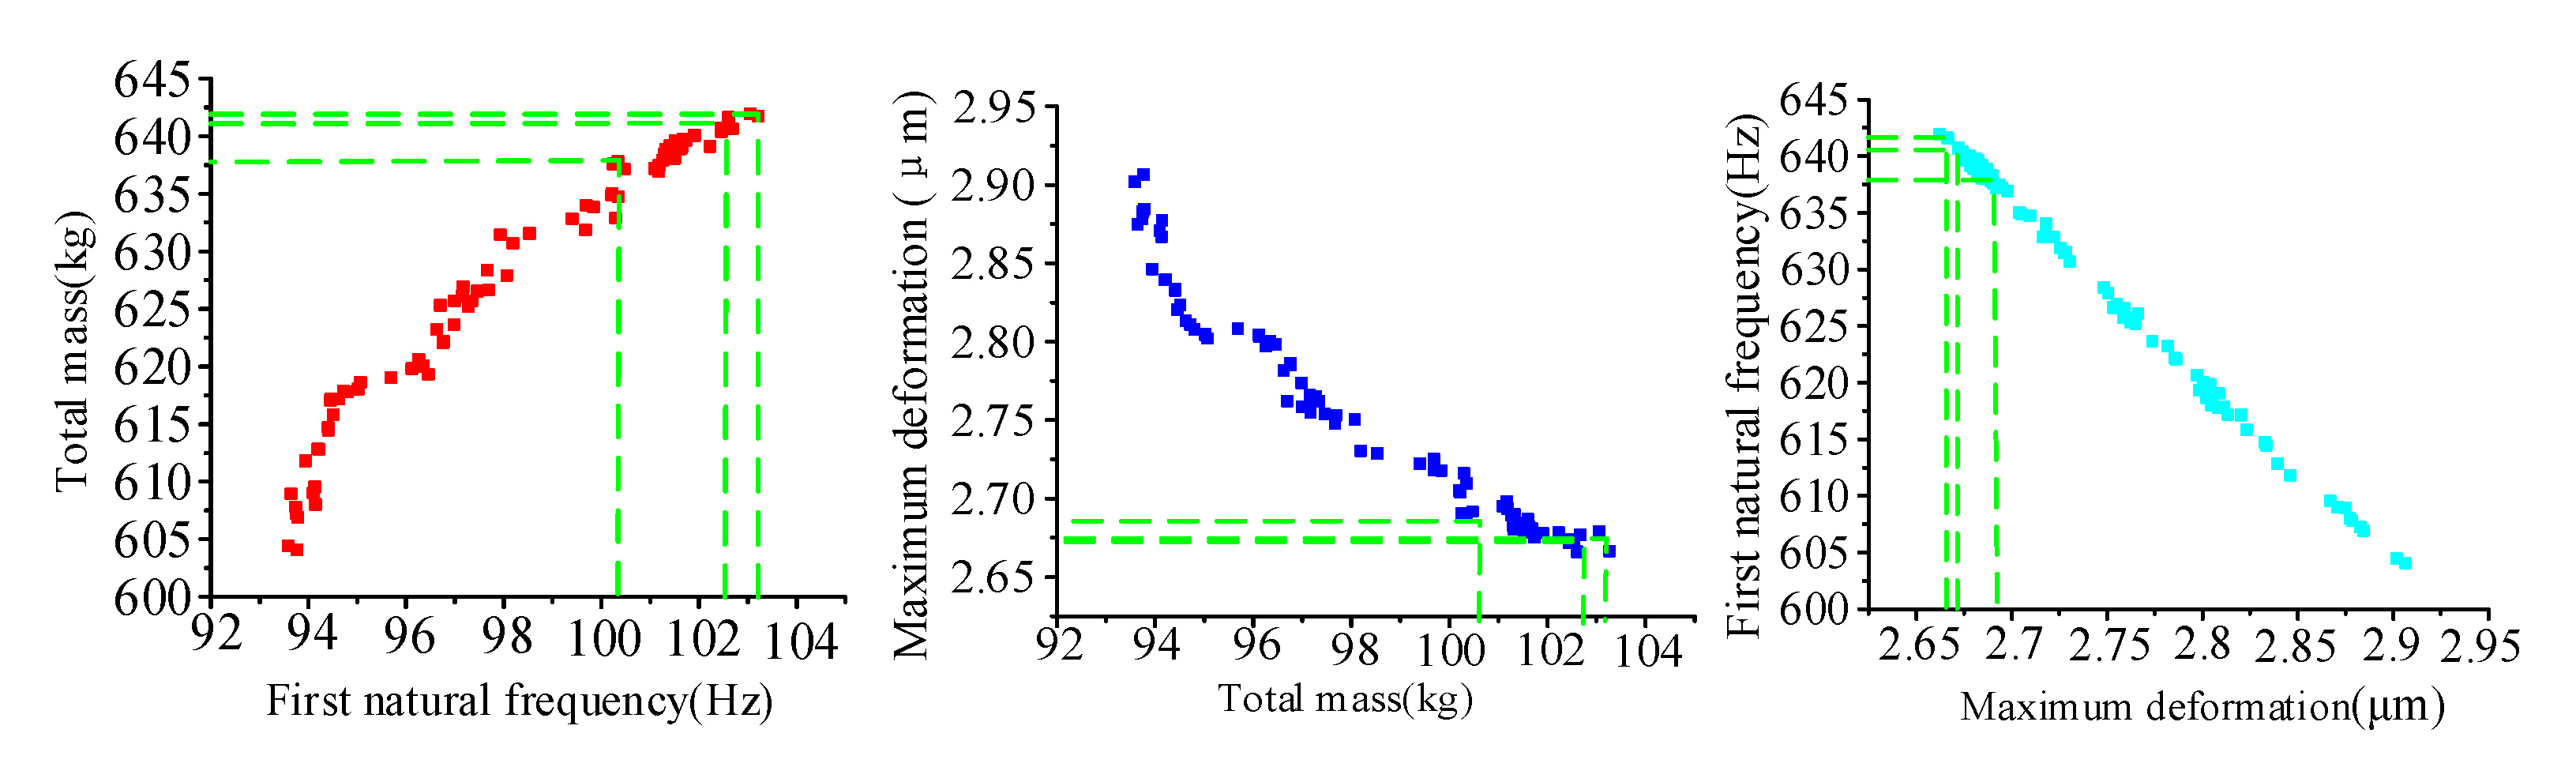
Figure 31.
NSGA-II Pareto solution.
Figure 31.
NSGA-II Pareto solution.
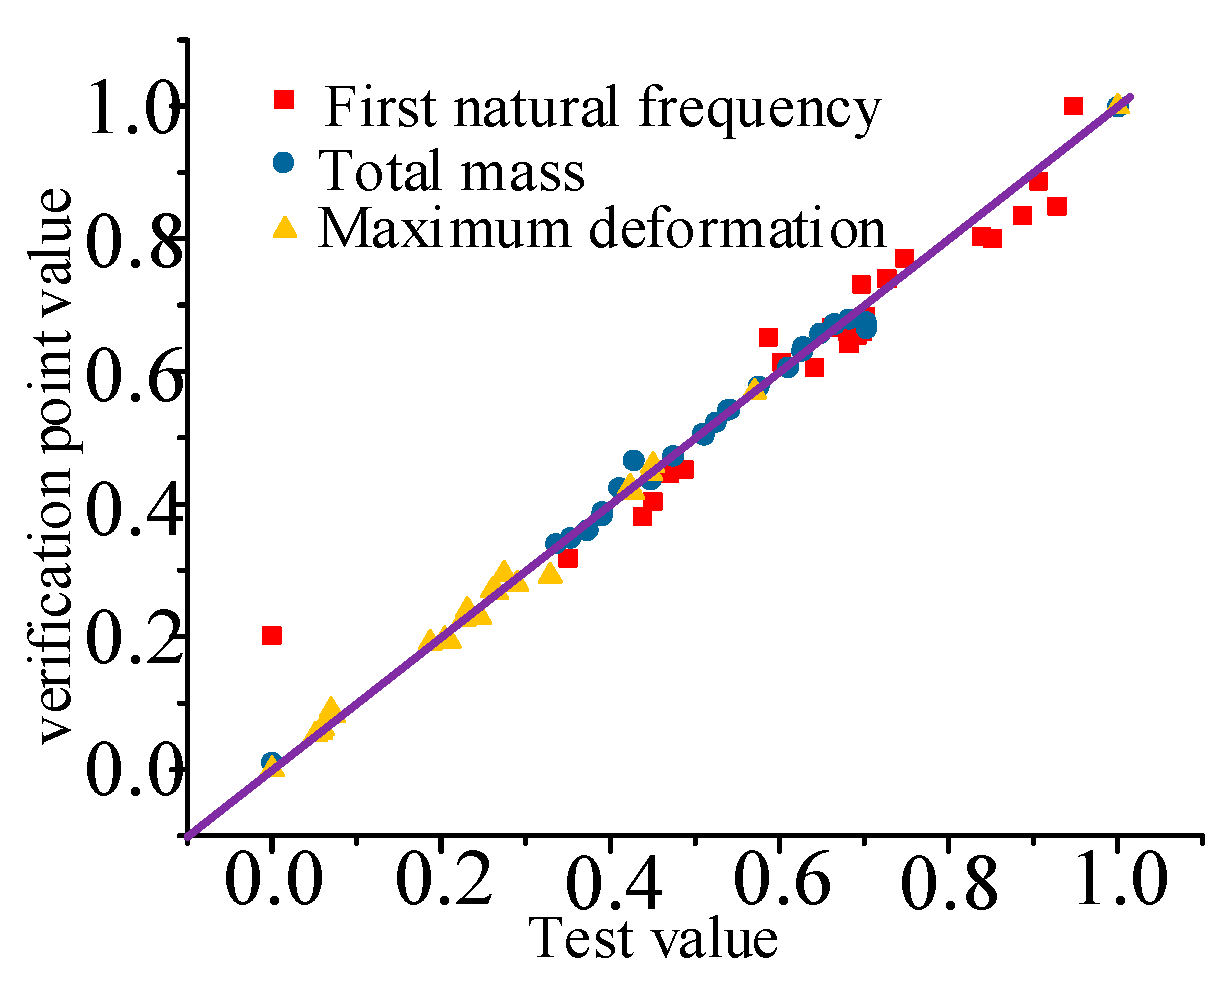
Figure 32.
Prediction and simulation values: (a) deformation; (b) first natural frequency; (c) total mass.
Figure 32.
Prediction and simulation values: (a) deformation; (b) first natural frequency; (c) total mass.
Table 1.
Key design parameters of direct-drive turntable.
Table 1.
Key design parameters of direct-drive turntable.
| Type | Parameter | Type | Parameter |
|---|
| Turntable diameter | 200 mm | Limit load | 65 kg |
| A-axis rotation range | ±100° | Z-direction travel | 500 mm |
| C-axis rotation range | 360° | C-axis rotation speed | 200 rad/min |
Table 3.
Turning parameters.
Table 3.
Turning parameters.
| CFz | xFz | yFz | nFz | CFx | xFx |
|---|
| 92 | 1.0 | 0.75 | 0 | 54 | 0.9 |
| yFx | zFx | CFy | xFy | yFy | nFy |
| 0.75 | 0 | 46 | 1.0 | 0.4 | 0 |
Table 4.
Material parameters of direct-drive turntable.
Table 4.
Material parameters of direct-drive turntable.
| Material | Density (kg/m3) | Poisson’s Ratio | Elastic Modulus (Pa) |
|---|
| HT200 | 7.15 × 10³ | 0.23 | 1.13 × 10¹¹ |
| 45 steel | 7.85 × 10³ | 0.3 | 2.00 × 10¹¹ |
| QT500-7 | 7.10 × 10³ | 0.275 | 1.69 × 10¹¹ |
| GCr15 | 7.81 × 10³ | 0.3 | 2.07 × 10¹¹ |
| HT250 | 7.28 × 10³ | 0.27 | 1.20 × 10¹¹ |
Table 5.
Design variables and value ranges.
Table 5.
Design variables and value ranges.
| Optimizing Size Parameters | Initial (mm) | Lower Limit (mm) | Upper Limit (mm) |
|---|
| n1—C-axis radius | 82.14 | 73.926 | 90.354 |
| n2—C-axis support thickness | 13.16 | 11.844 | 14.476 |
| n3—Inner diameter of C-axis mounting sleeve | 205.78 | 185.2 | 226.36 |
| n4—Thickness of turntable surface | 22.81 | 20.529 | 25.091 |
| n5—Thickness of connection between turntable surface and C-axis | 10.53 | 9.477 | 11.583 |
| n6—Oil groove depth of turntable | 7.27 | 6.543 | 7.997 |
| n7—Outer diameter of A-axis mounting sleeve | 235 | 211.5 | 258.5 |
Table 6.
Number of design variables and test points.
Table 6.
Number of design variables and test points.
| Number of Design Variables | 1 | 2 | 3 | 4 | 5 | 6 | 7 |
|---|
| Factorial coefficient | 0 | 0 | 0 | 0 | 1 | 1 | 1 |
| Number of test points | 5 | 9 | 15 | 25 | 27 | 45 | 78 |
Table 7.
Central composite design test point.
Table 7.
Central composite design test point.
| Order | n1 (mm) | n2 (mm) | n3 (mm) | n4 (mm) | n5 (mm) | n7 (mm) | f (Hz) | δmax (μm) | m (kg) |
|---|
| 1 | 82.140 | 13.160 | 205.780 | 22.810 | 10.530 | 235.000 | 614.2500 | 2.8232 | 110.300 |
| 2 | 82.140 | 11.844 | 205.780 | 22.810 | 10.530 | 235.000 | 616.300 | 2.8128 | 110.130 |
| 3 | 82.140 | 14.476 | 205.780 | 22.810 | 10.530 | 235.000 | 611.940 | 2.8358 | 110.460 |
| … | … | … | … | … | … | … | … | … | |
| 44 | 77.392 | 13.921 | 217.670 | 24.128 | 11.139 | 221.420 | 589.330 | 2.972 | 100.150 |
| 45 | 86.888 | 12.399 | 217.670 | 24.128 | 11.139 | 221.420 | 605.560 | 2.868 | 100.910 |
| 46 | 86.888 | 13.921 | 211.6119 | 24.128 | 11.139 | 248.580 | 601.690 | 2.888 | 115.830 |
Table 8.
The first six vibration modes and natural frequencies of direct-drive turntable under milling conditions.
Table 8.
The first six vibration modes and natural frequencies of direct-drive turntable under milling conditions.
| Order | Frequency (Hz) | Vibration Mode |
|---|
| 1 | 594.33 | C-axis and workpiece oscillating back and forth |
| 2 | 598.39 | C-axis and workpiece oscillating left and right |
| 3 | 1579.7 | C-axis and workpiece rotation |
| 4 | 2314.9 | C-axis and workpiece oscillating up and down |
| 5 | 2434.3 | C-axis, workpiece, and swing frame oscillating back and forth |
| 6 | 2468 | C-axis, workpiece, and swing frame oscillating left and right |
Table 9.
The first six vibration modes and natural frequencies of direct-drive turntable under turning conditions.
Table 9.
The first six vibration modes and natural frequencies of direct-drive turntable under turning conditions.
| Order | Frequency (Hz) | Vibration mode |
|---|
| 1 | 595.06 | C-axis and workpiece oscillating back and forth |
| 2 | 599.20 | C-axis and workpiece oscillating left and right |
| 3 | 1581.5 | C-axis and workpiece rotation |
| 4 | 2317 | C-axis and workpiece oscillating up and down |
| 5 | 2436.6 | C-axis, workpiece, and swing frame oscillating back and forth |
| 6 | 2469.7 | C-axis, workpiece, and swing frame oscillating left and right |
Table 10.
Comparison of parameters before and after optimization of direct-drive turntable.
Table 10.
Comparison of parameters before and after optimization of direct-drive turntable.
| | Total Mass (kg) | Maximum Deformation (μm) | First Natural Frequency (Hz) |
|---|
| Before optimization | 127.6 | 2.9772 | 594.33 |
| Optimized | 110.3 | 2.8232 | 614.25 |
Table 11.
Size parameters after and before optimization.
Table 11.
Size parameters after and before optimization.
| | Original Data (mm) | Optimization
Data 1 (mm) | Optimization
Data 2 (mm) | Optimization Data 3 (mm) |
|---|
| n1 | 82.140 | 88.633 | 89.409 | 89.274 |
| n2 | 13.160 | 11.887 | 11.970 | 12.074 |
| n3 | 205.780 | 185.86 | 191.860 | 198.310 |
| n4 | 22.810 | 20.561 | 20.553 | 20.553 |
| n5 | 10.530 | 9.5326 | 9.517 | 9.572 |
| n7 | 235.000 | 212.13 | 213.560 | 212.140 |
Table 12.
Original data and optimization values of optimization objectives.
Table 12.
Original data and optimization values of optimization objectives.
| | Mass (kg) | First Natural Frequency (Hz) | Deformation (μm) |
|---|
| Optimal value 1 | 103.050 | 641.970 | 2.6620 |
| Optimal value 2 | 102.610 | 641.670 | 2.6660 |
| Optimal value 3 | 100.340 | 637.820 | 2.6888 |
| Original data | 110.300 | 614.250 | 2.8232 |


