

Interdecadal Changes of the MERRA-2 Incoming Surface Solar Radiation (SSR) and Evaluation against GEBA & BSRN Stations

 , , , and
Abstract
:1. Introduction
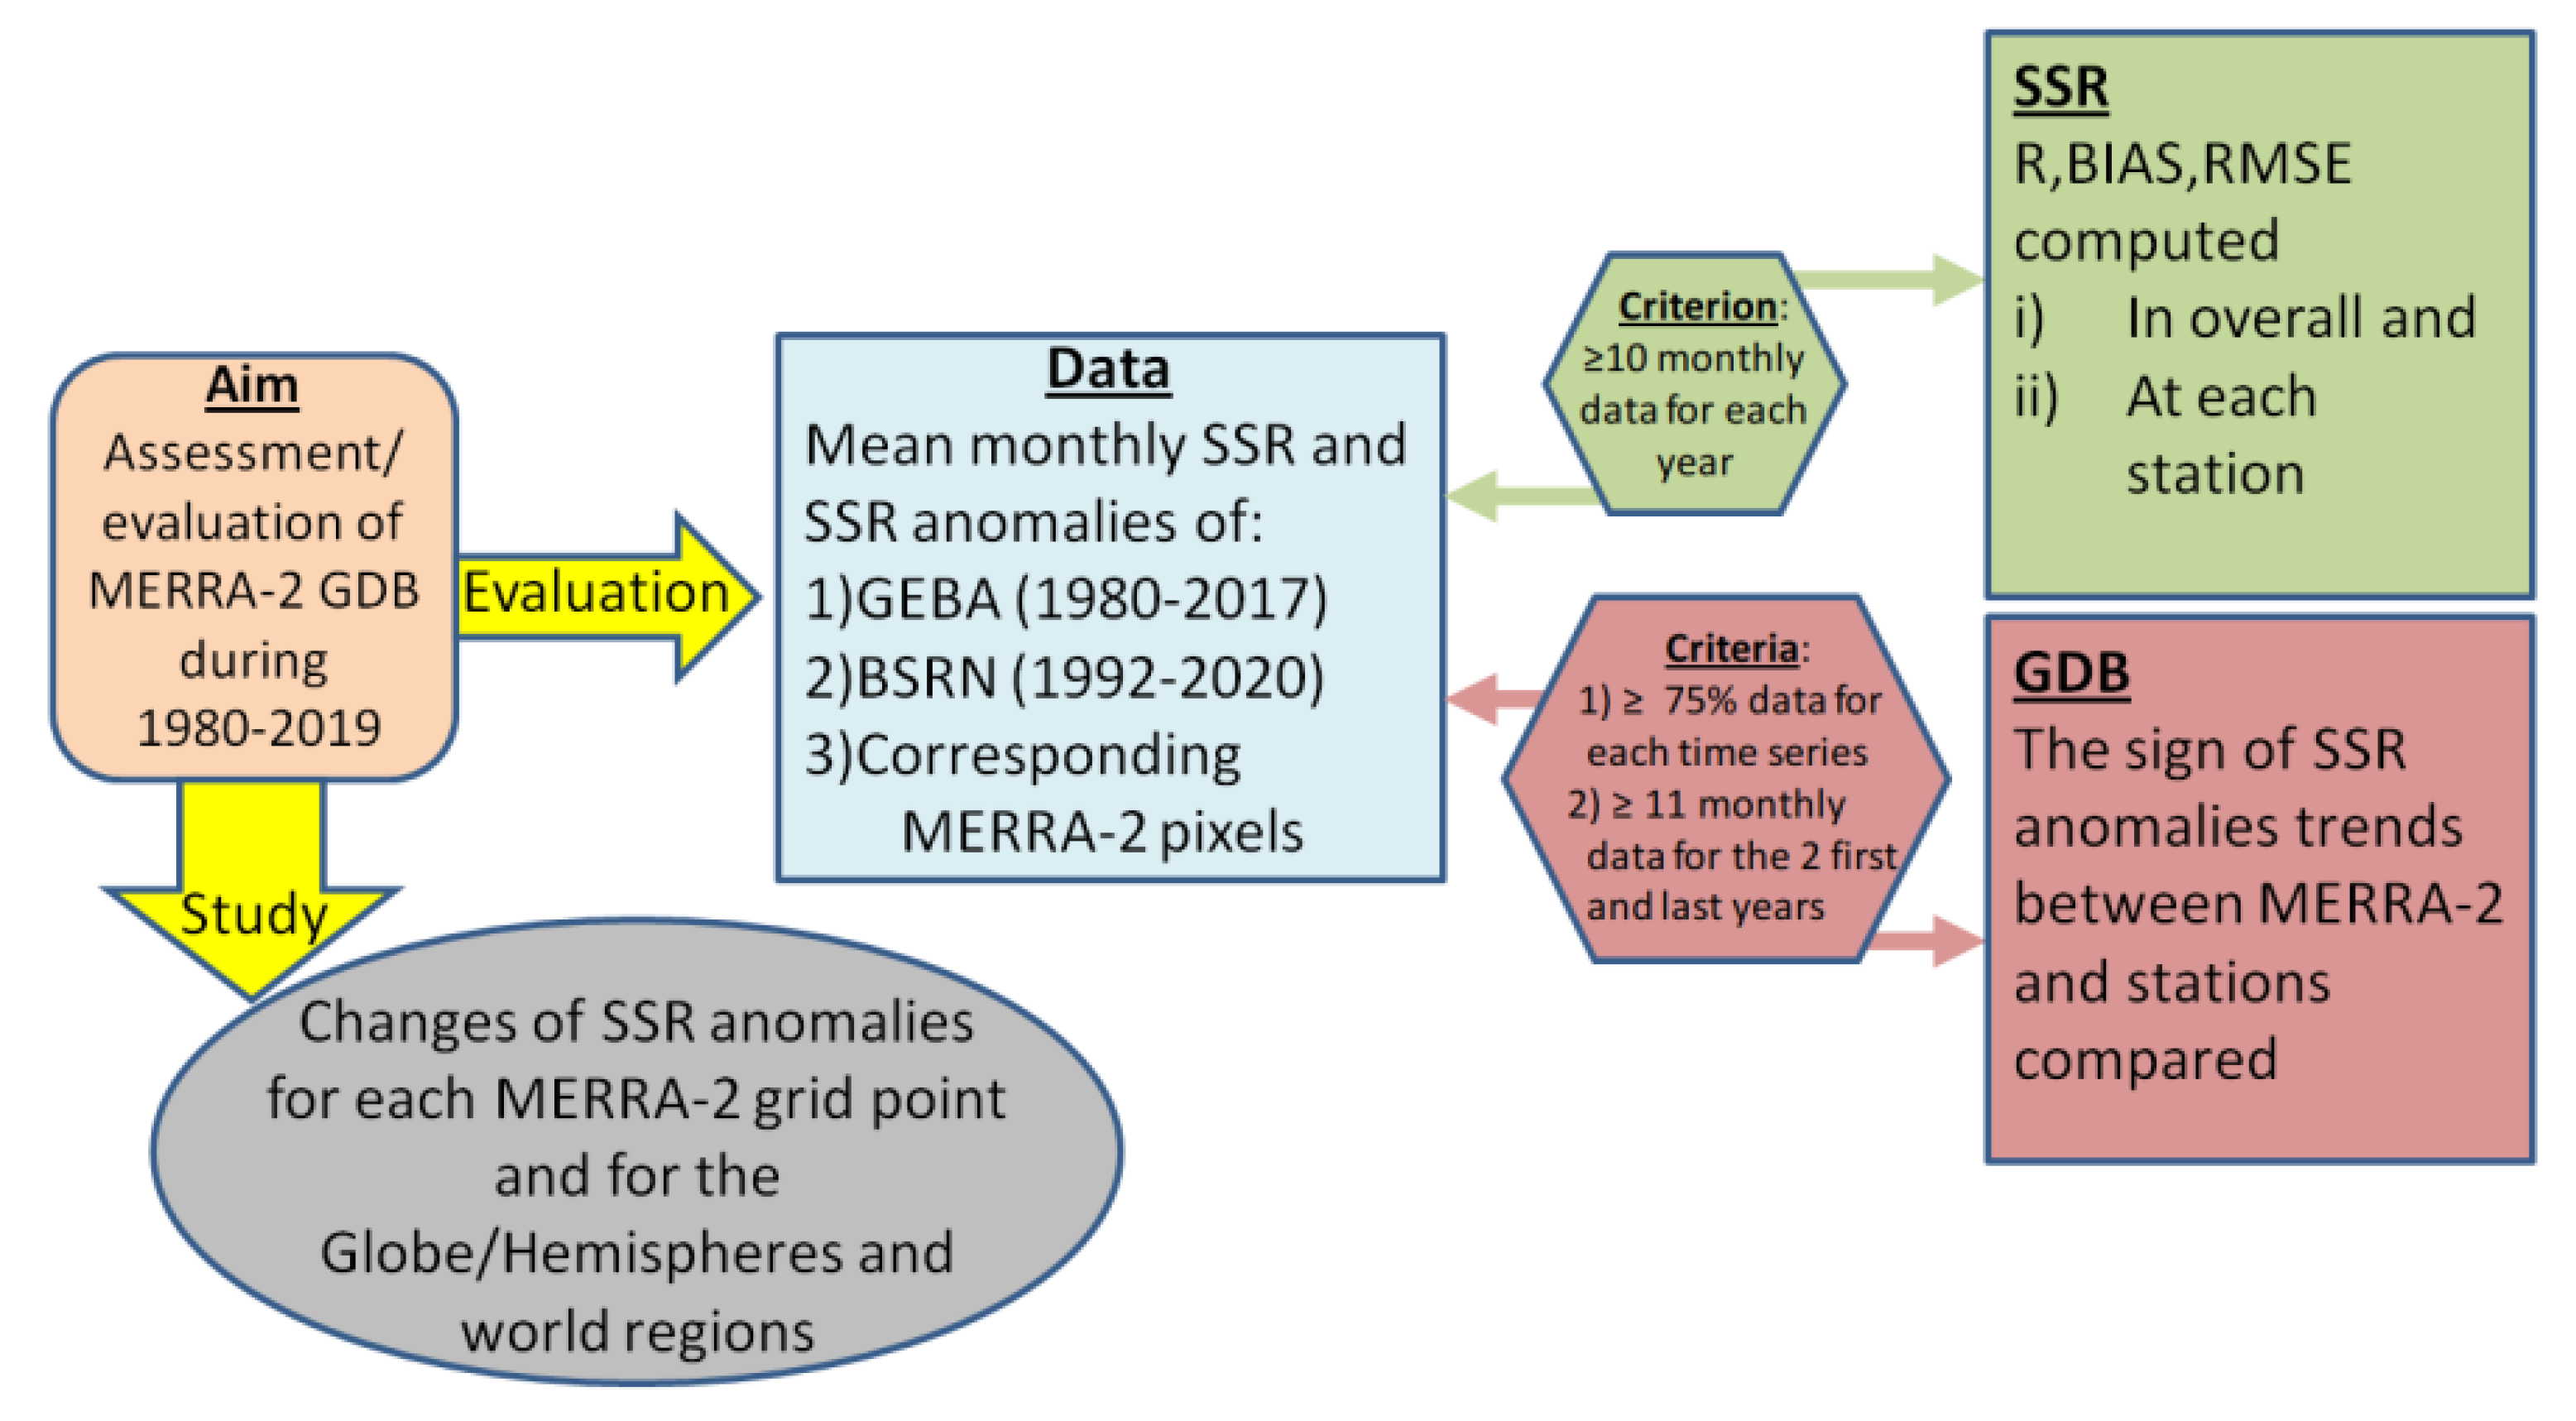
2. Materials and Methods
2.1. Data
2.1.1. MERRA-2
2.1.2. CERES-EBAF
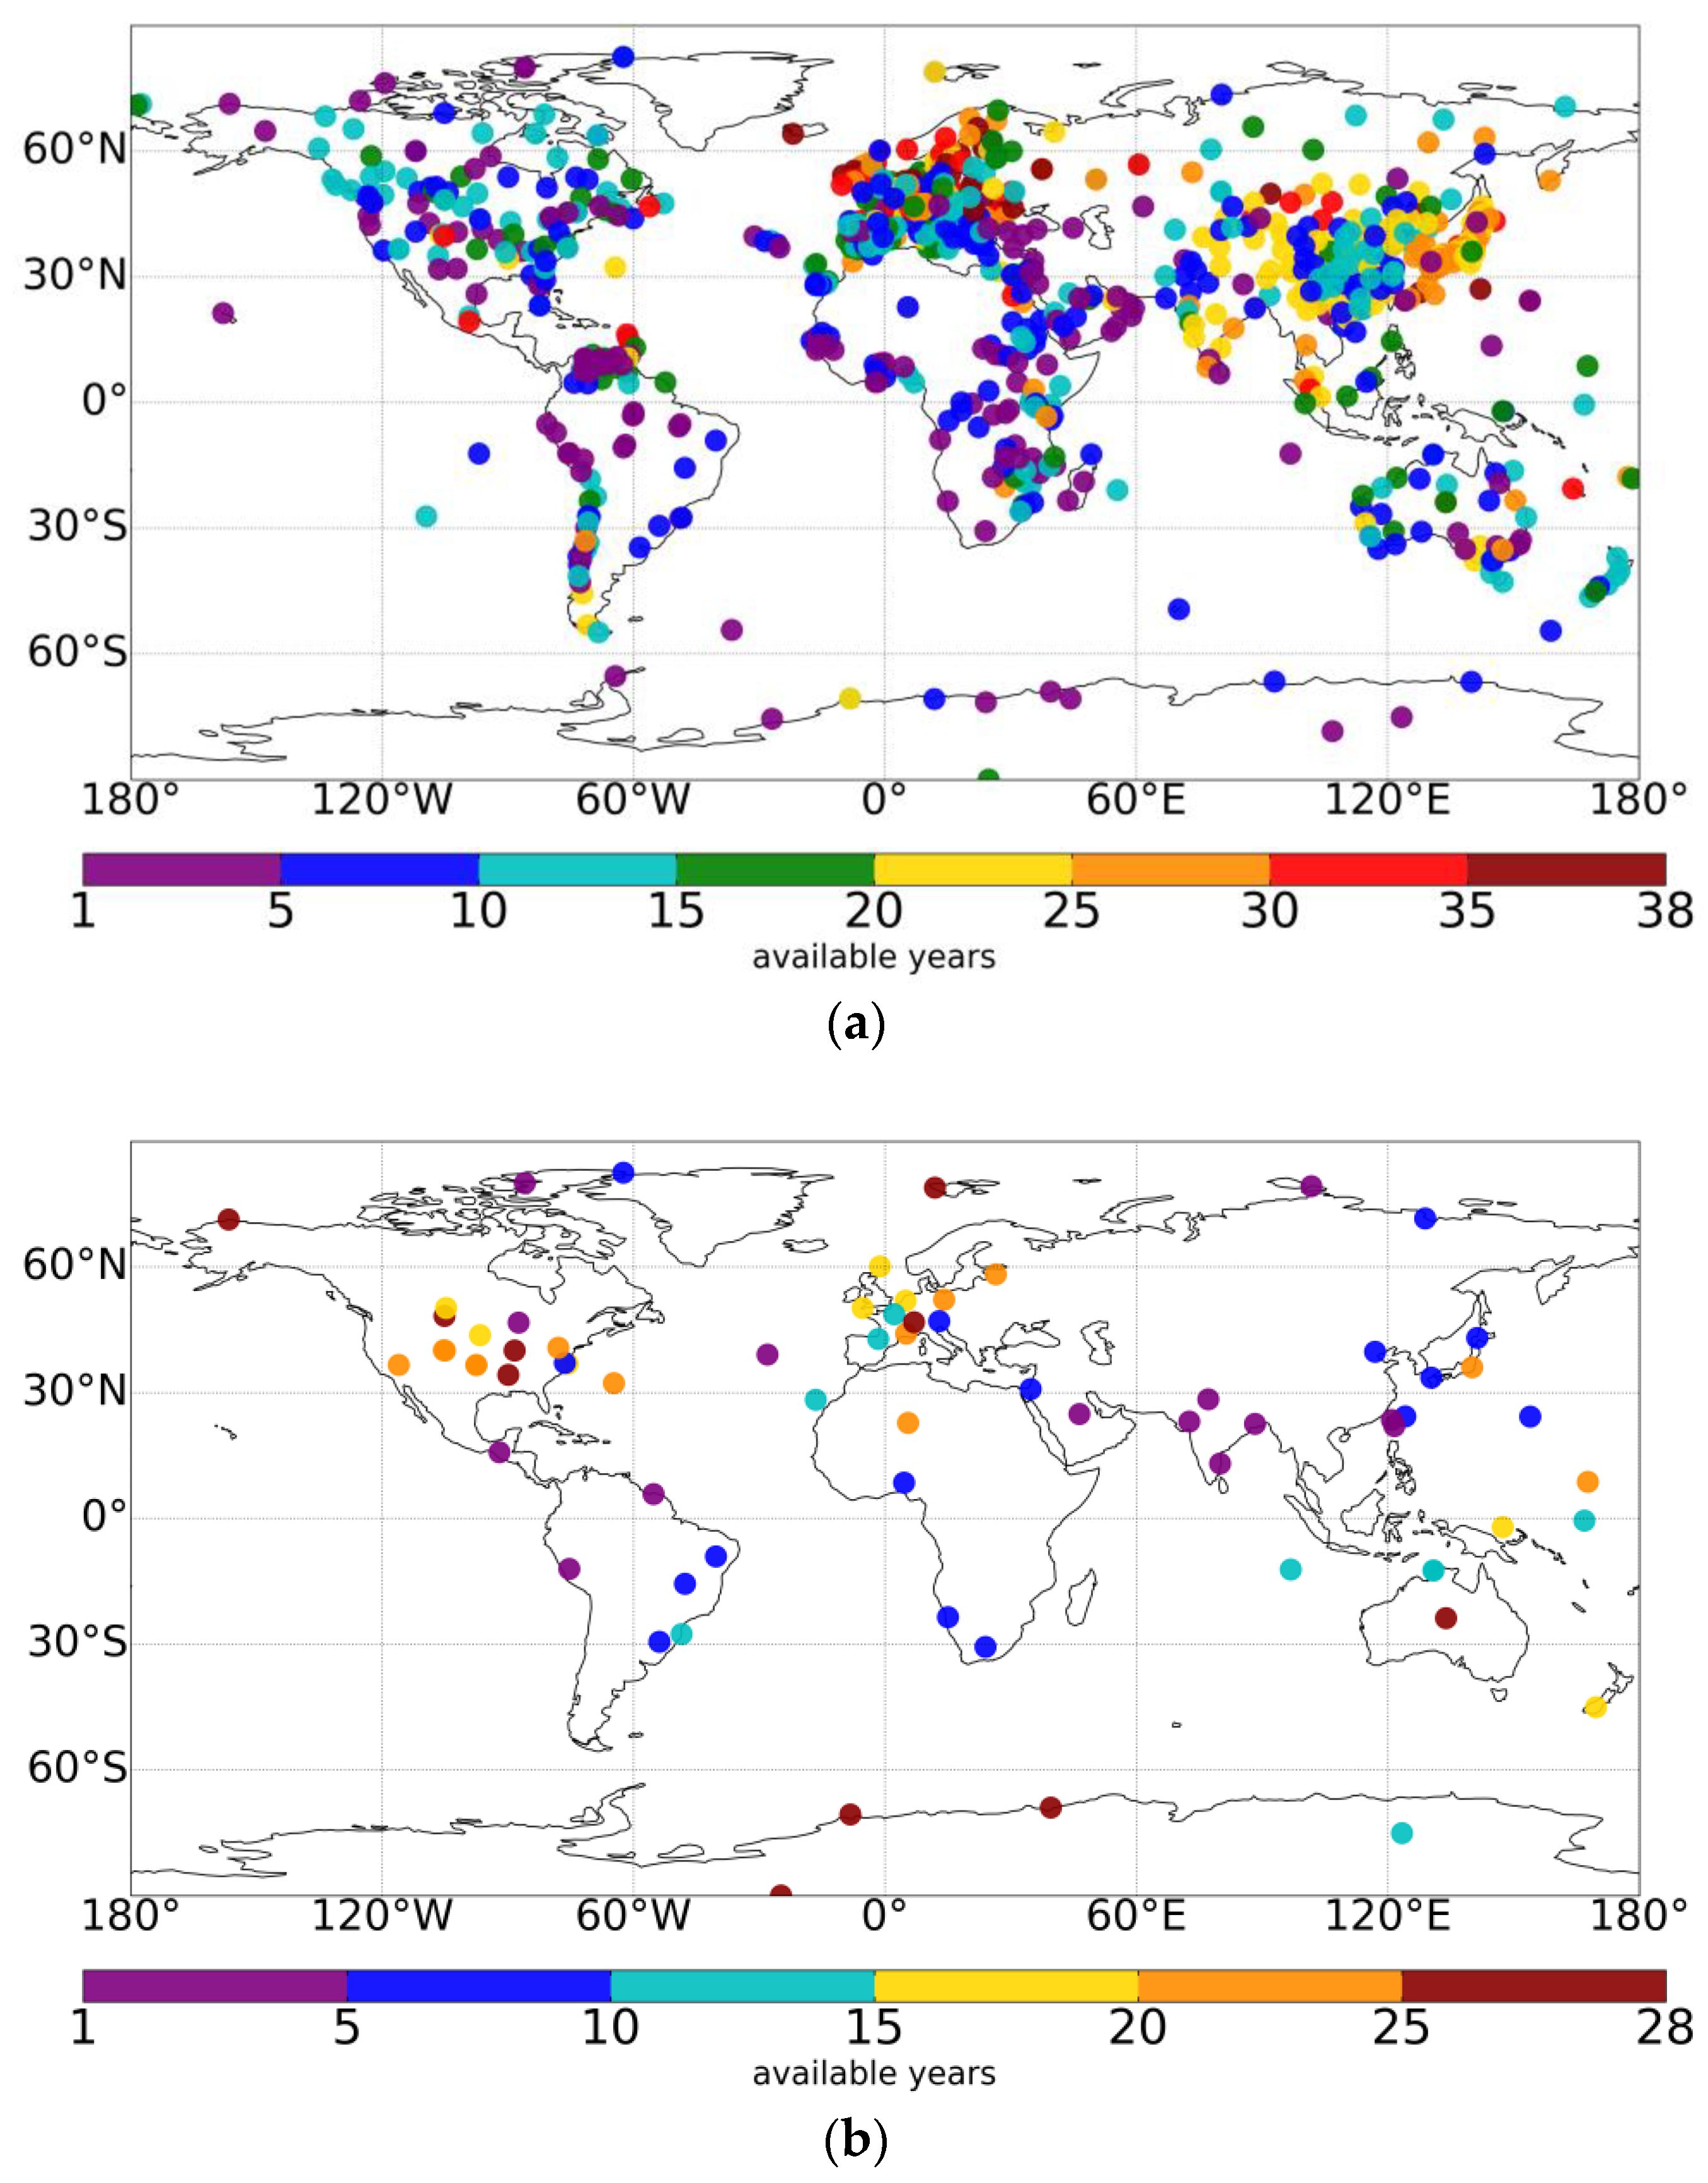
2.1.3. GEBA & BSRN
2.2. Methodology
3. Results
3.1. Evaluation of MERRA-2 SSR
3.1.1. All Stations
3.1.2. At Station Level
3.2. MERRA-2 GDB (SSR Trends) and Its Evaluation
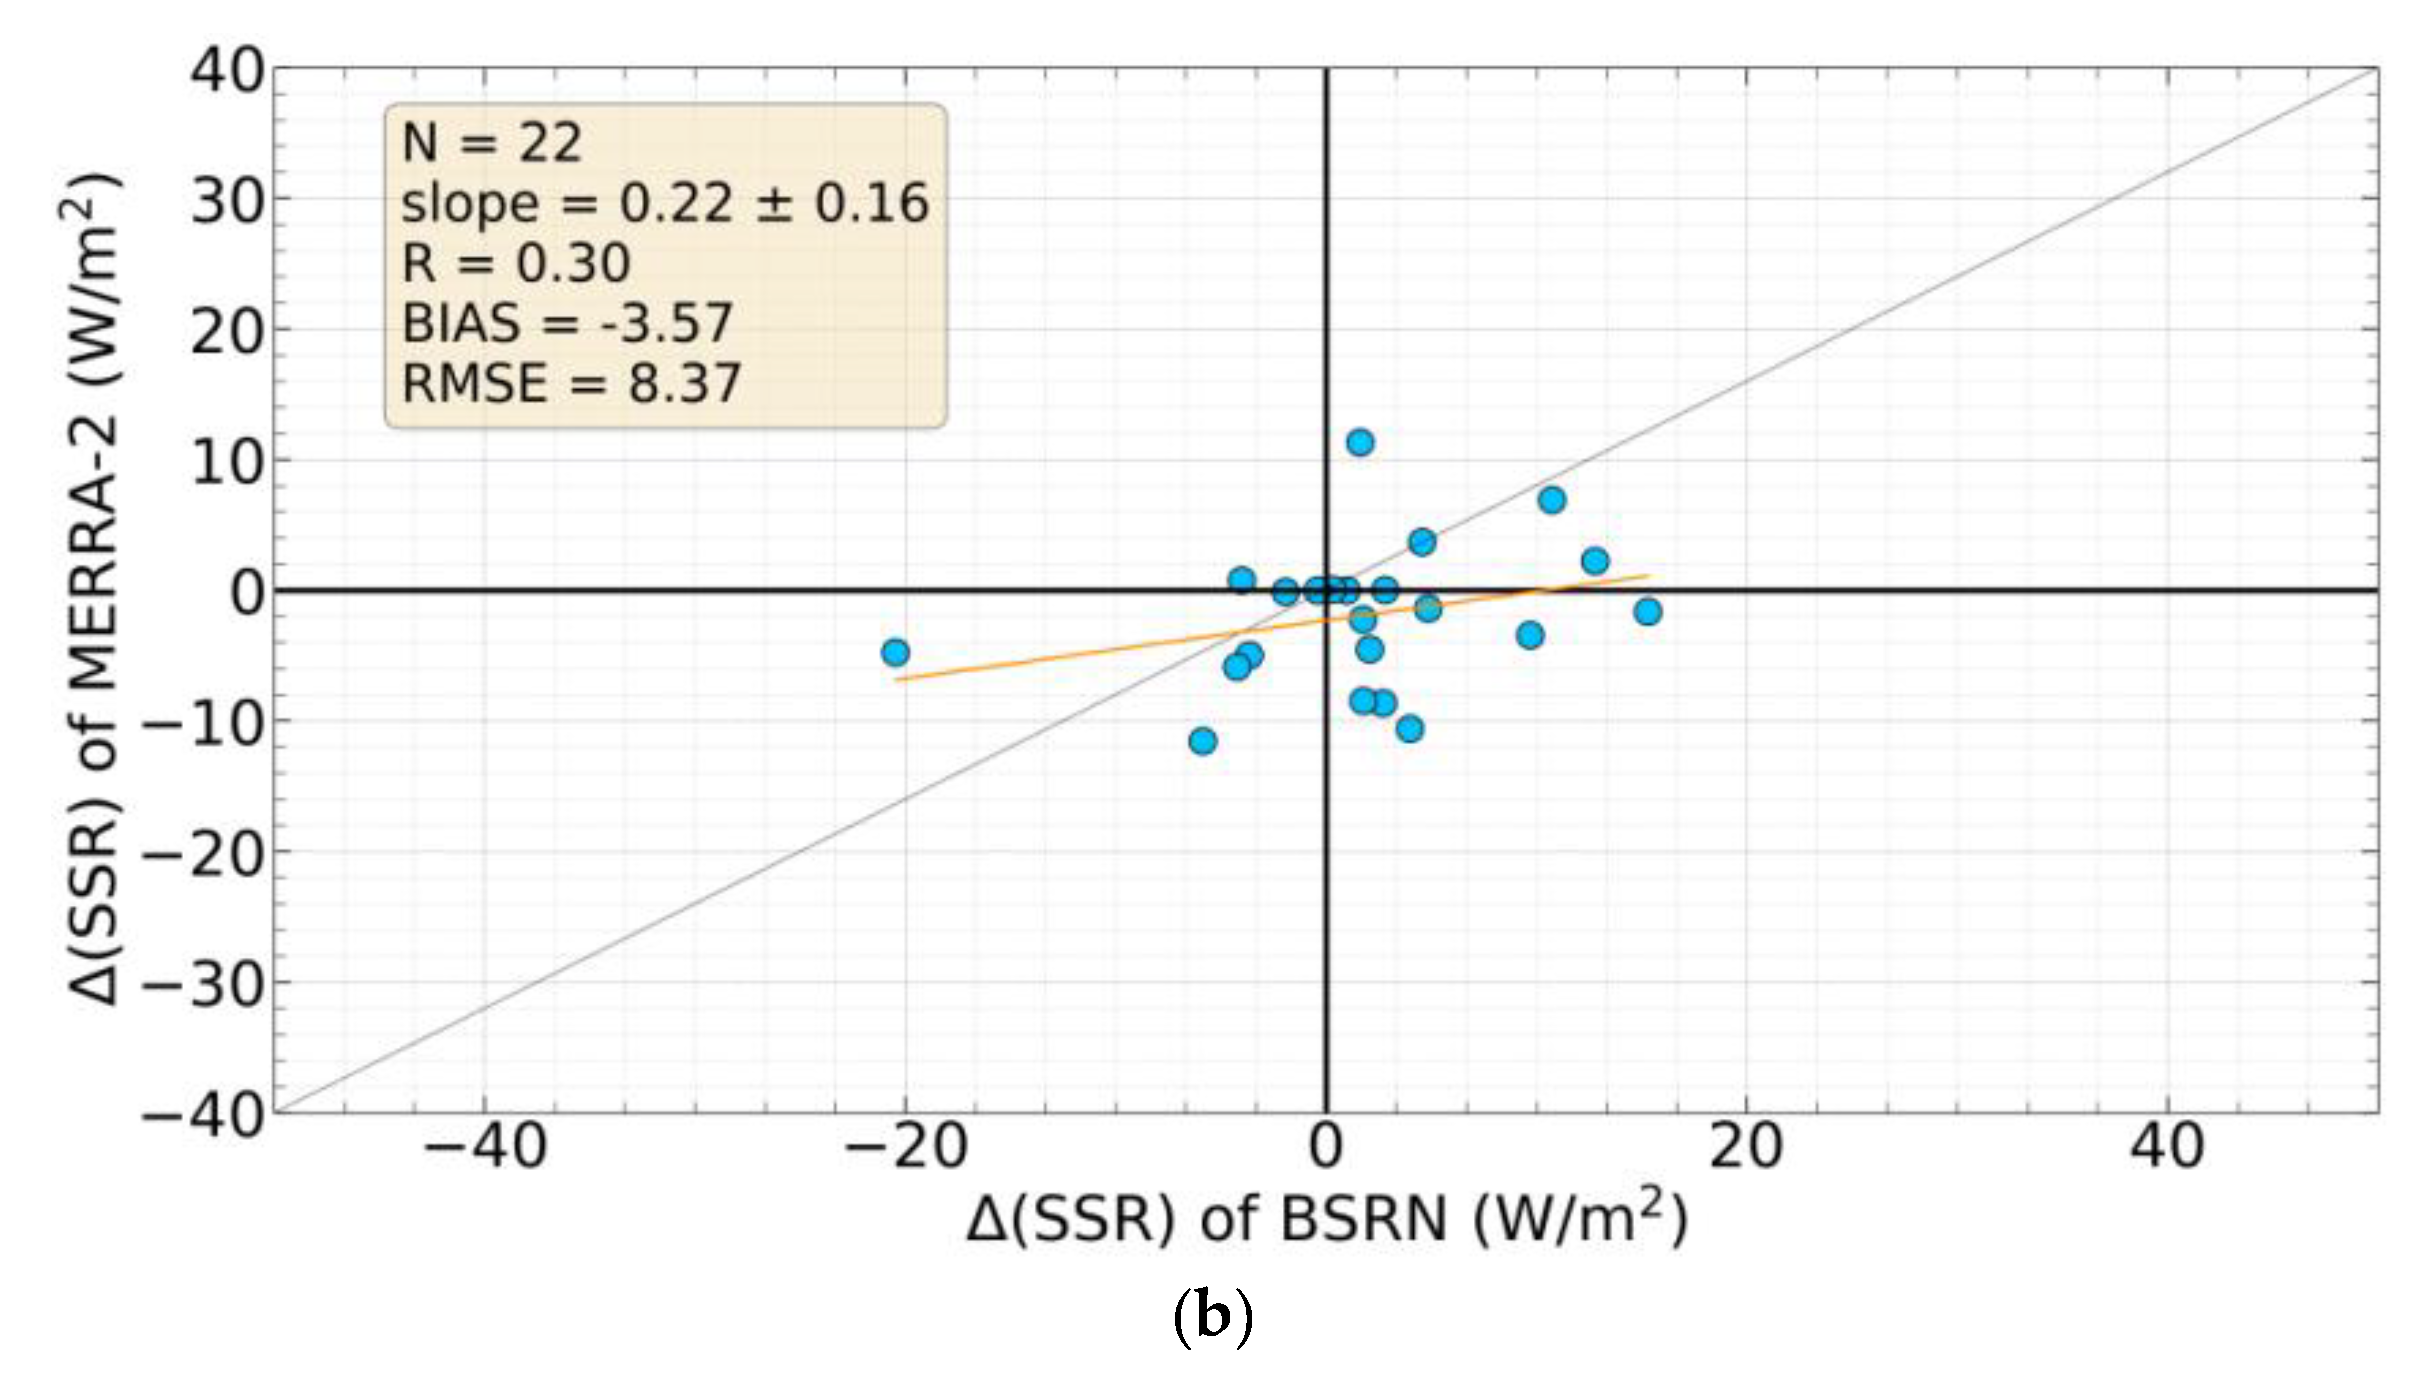
3.2.1. Evaluation of MERRA-2 GDB (SSR Trends)
All Stations
At Station Level
3.2.2. The MERRA-2 GDB on Global, Hemispherical and Regional Scales
4. Conclusions
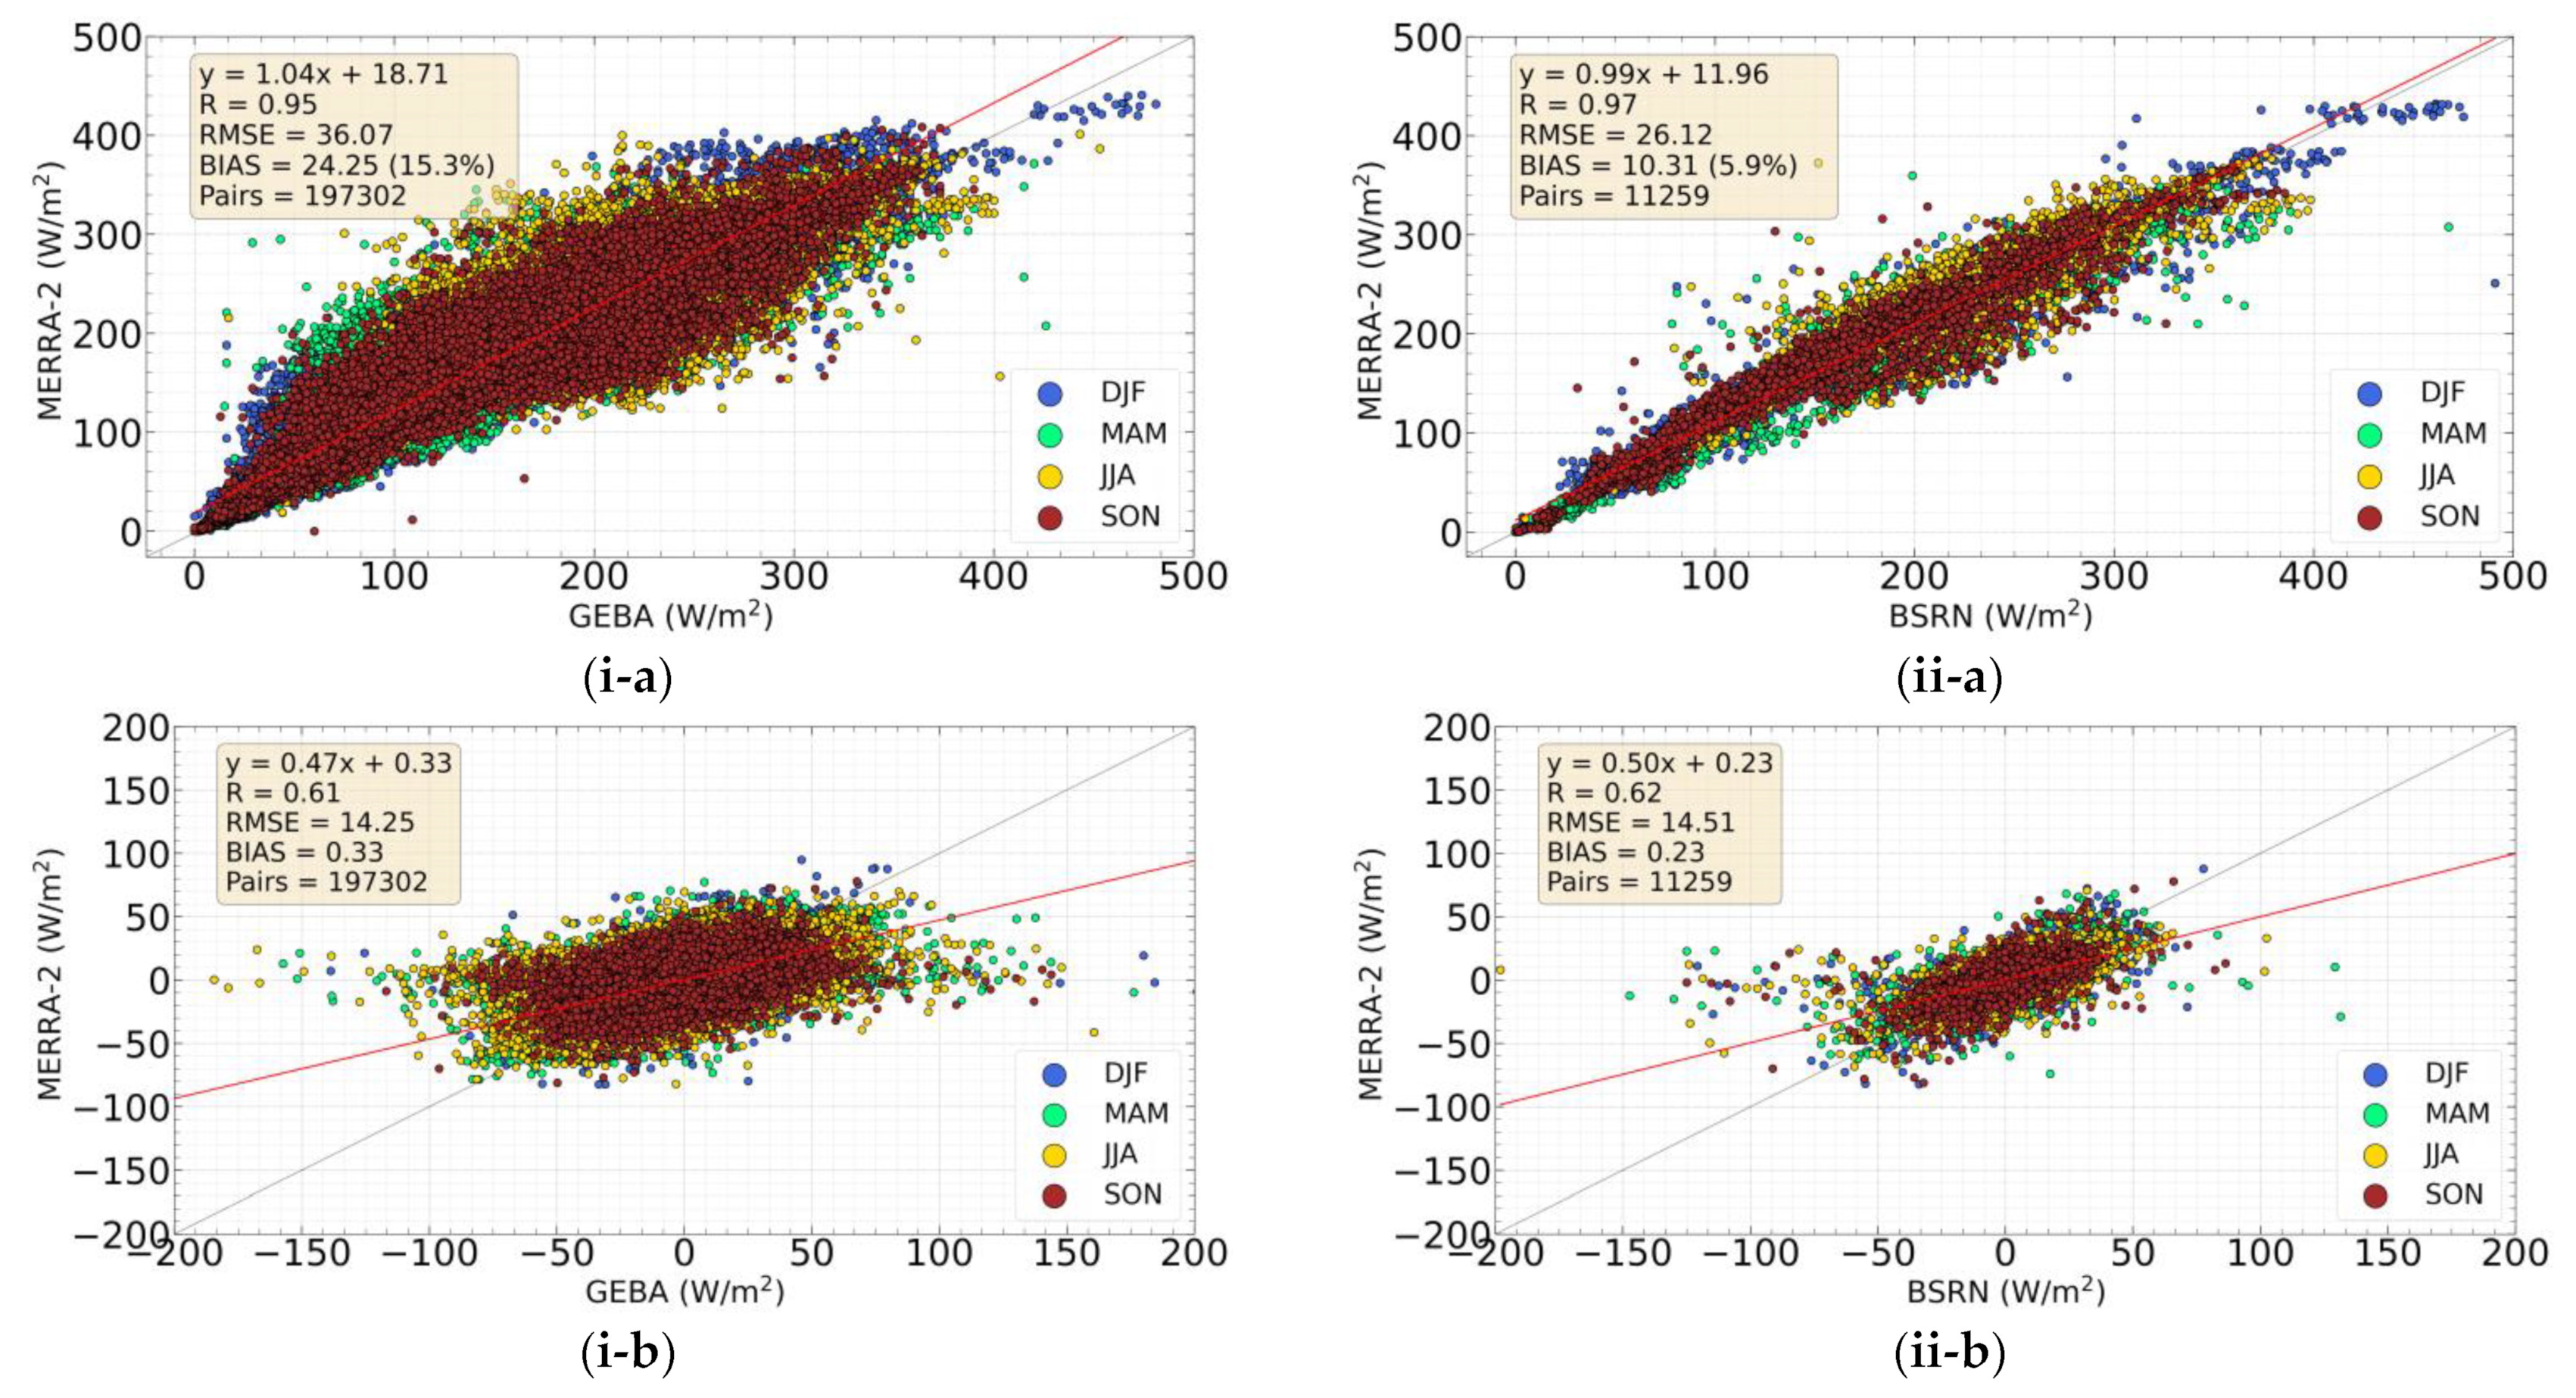
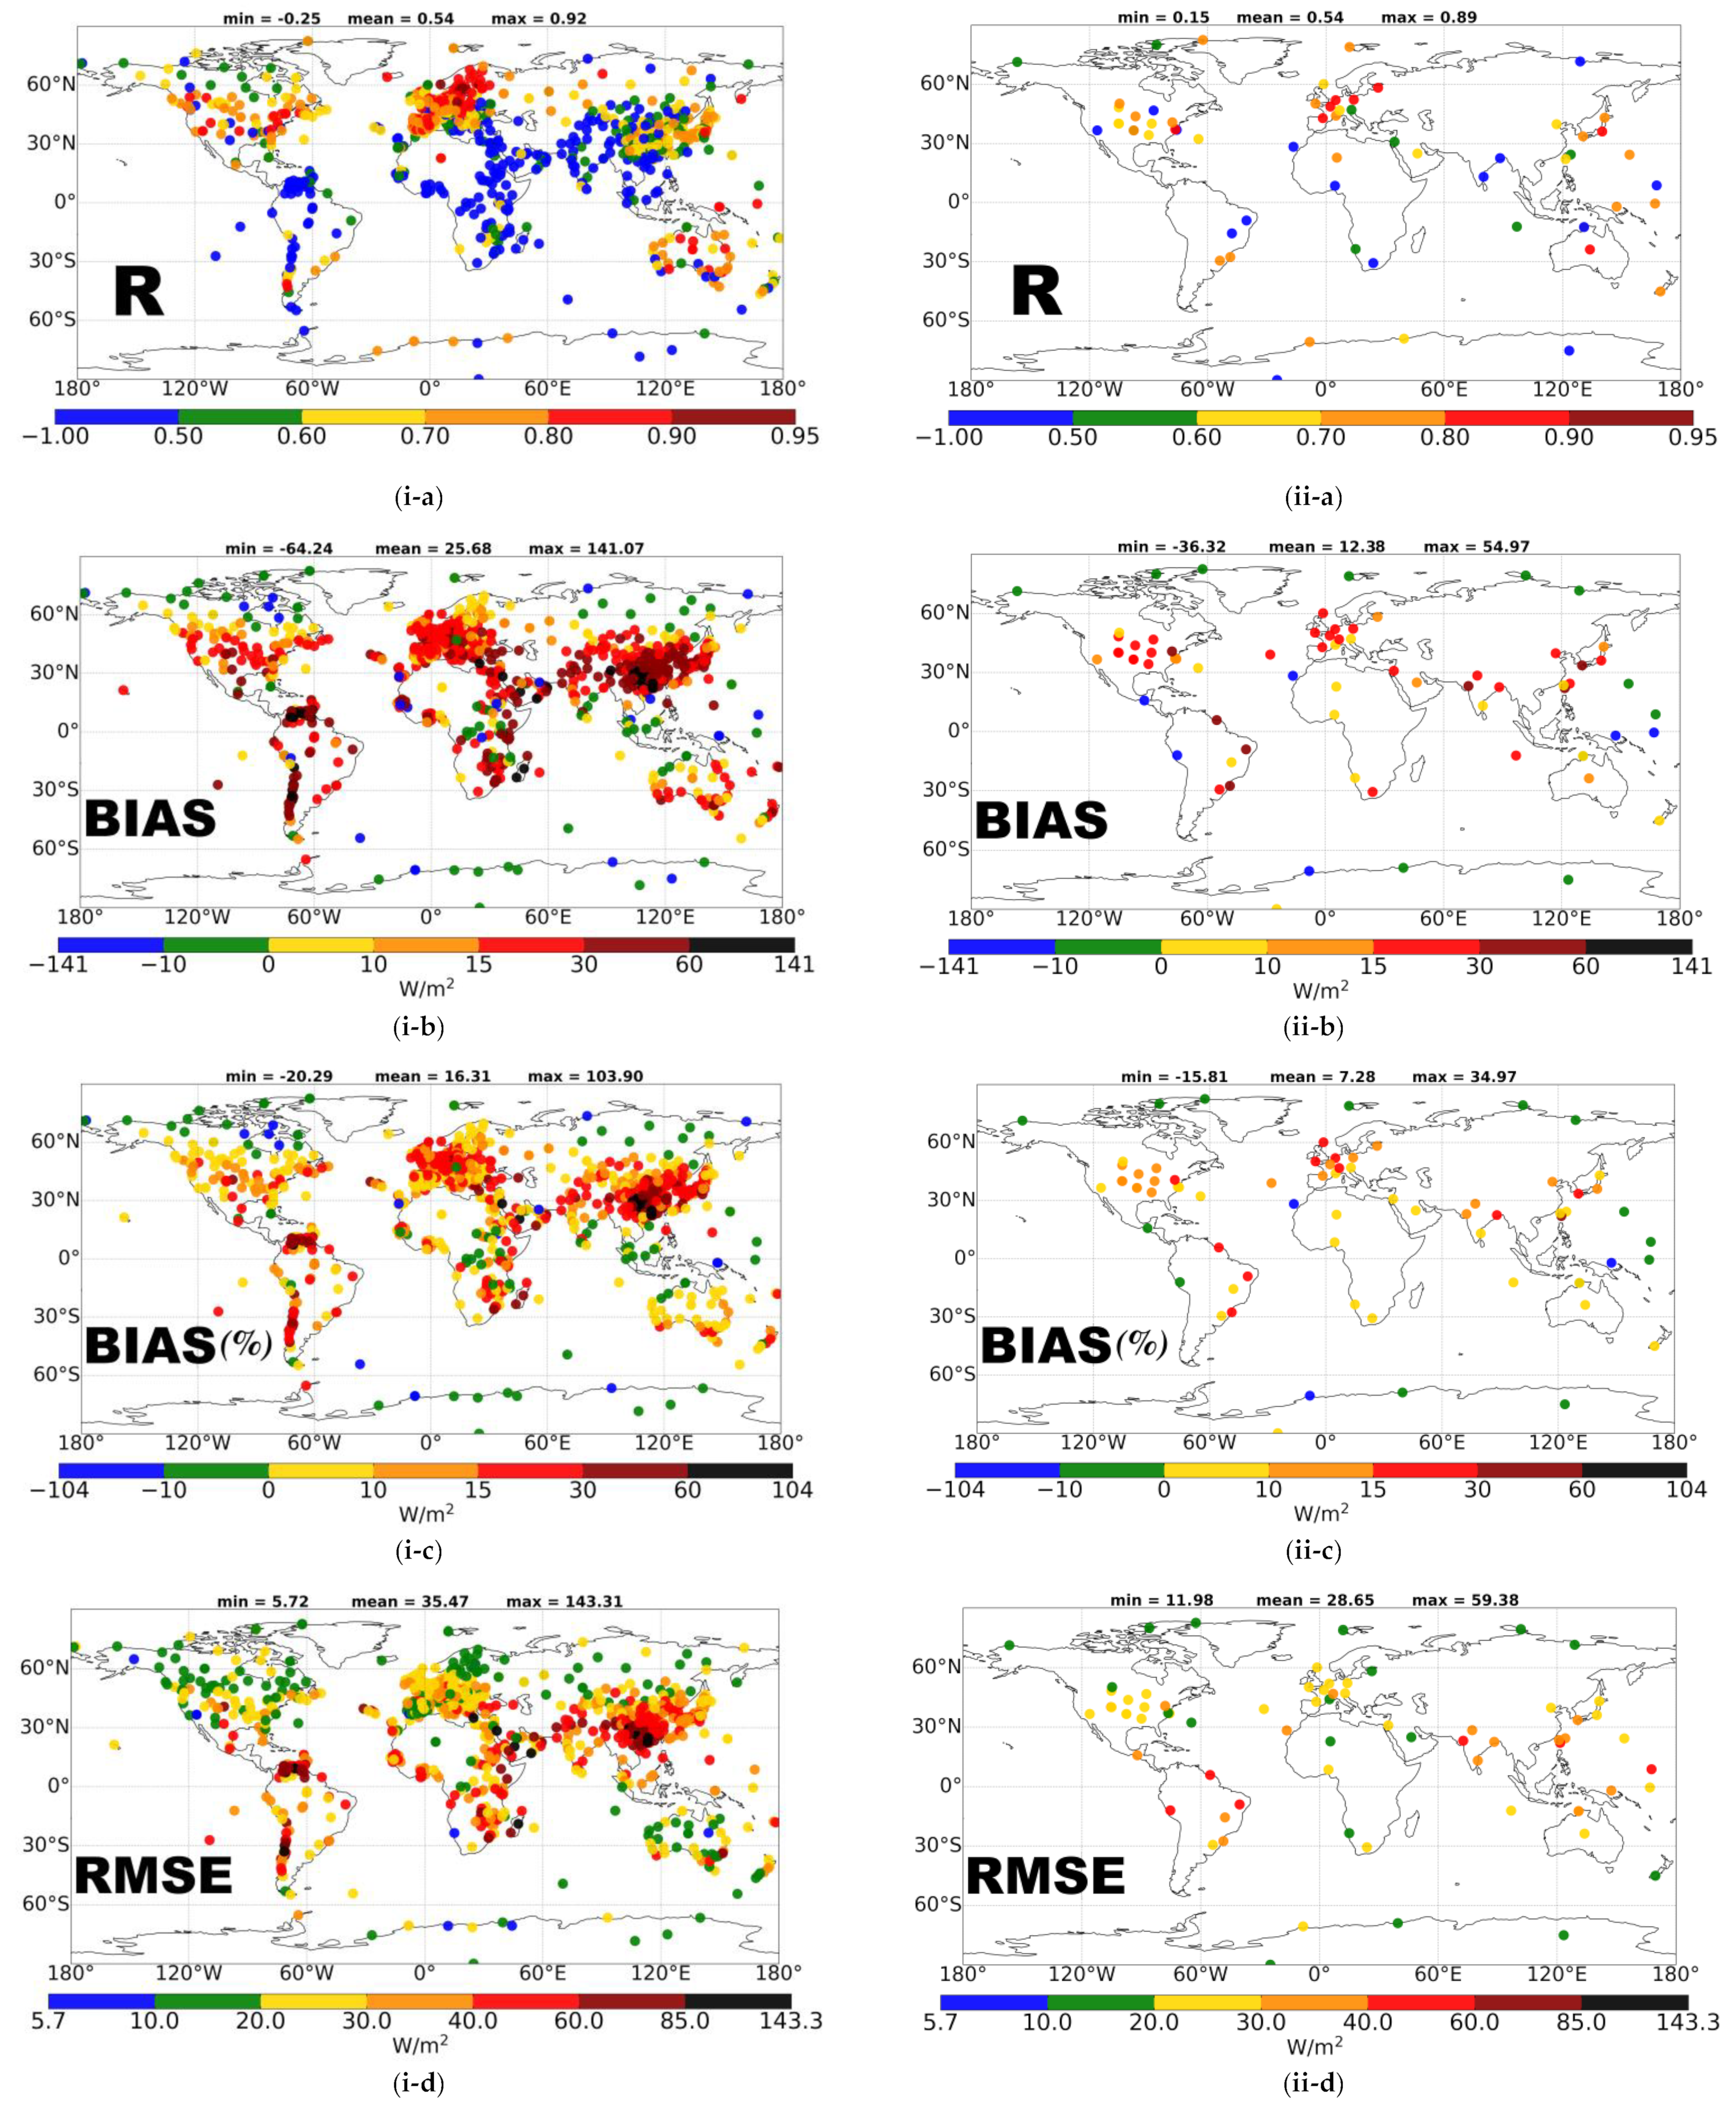
- The MERRA-2 SSR fluxes correlate very well with the ground truth measurements, with R values equal to 0.95 and 0.97 for the comparison with GEBA and BSRN stations, respectively. The corresponding R values for the comparison of deseasonalized SSR anomalies, which are free of the seasonal cycle and give more meaningful results, are still satisfactory and equal to 0.61 and 0.62. On an individual station-level, the estimated R values range from −0.25 to 0.92, the lowest values occurring in tropical and sub-tropical regions, probably due to uncertainties in the Reanalysis cloudiness.
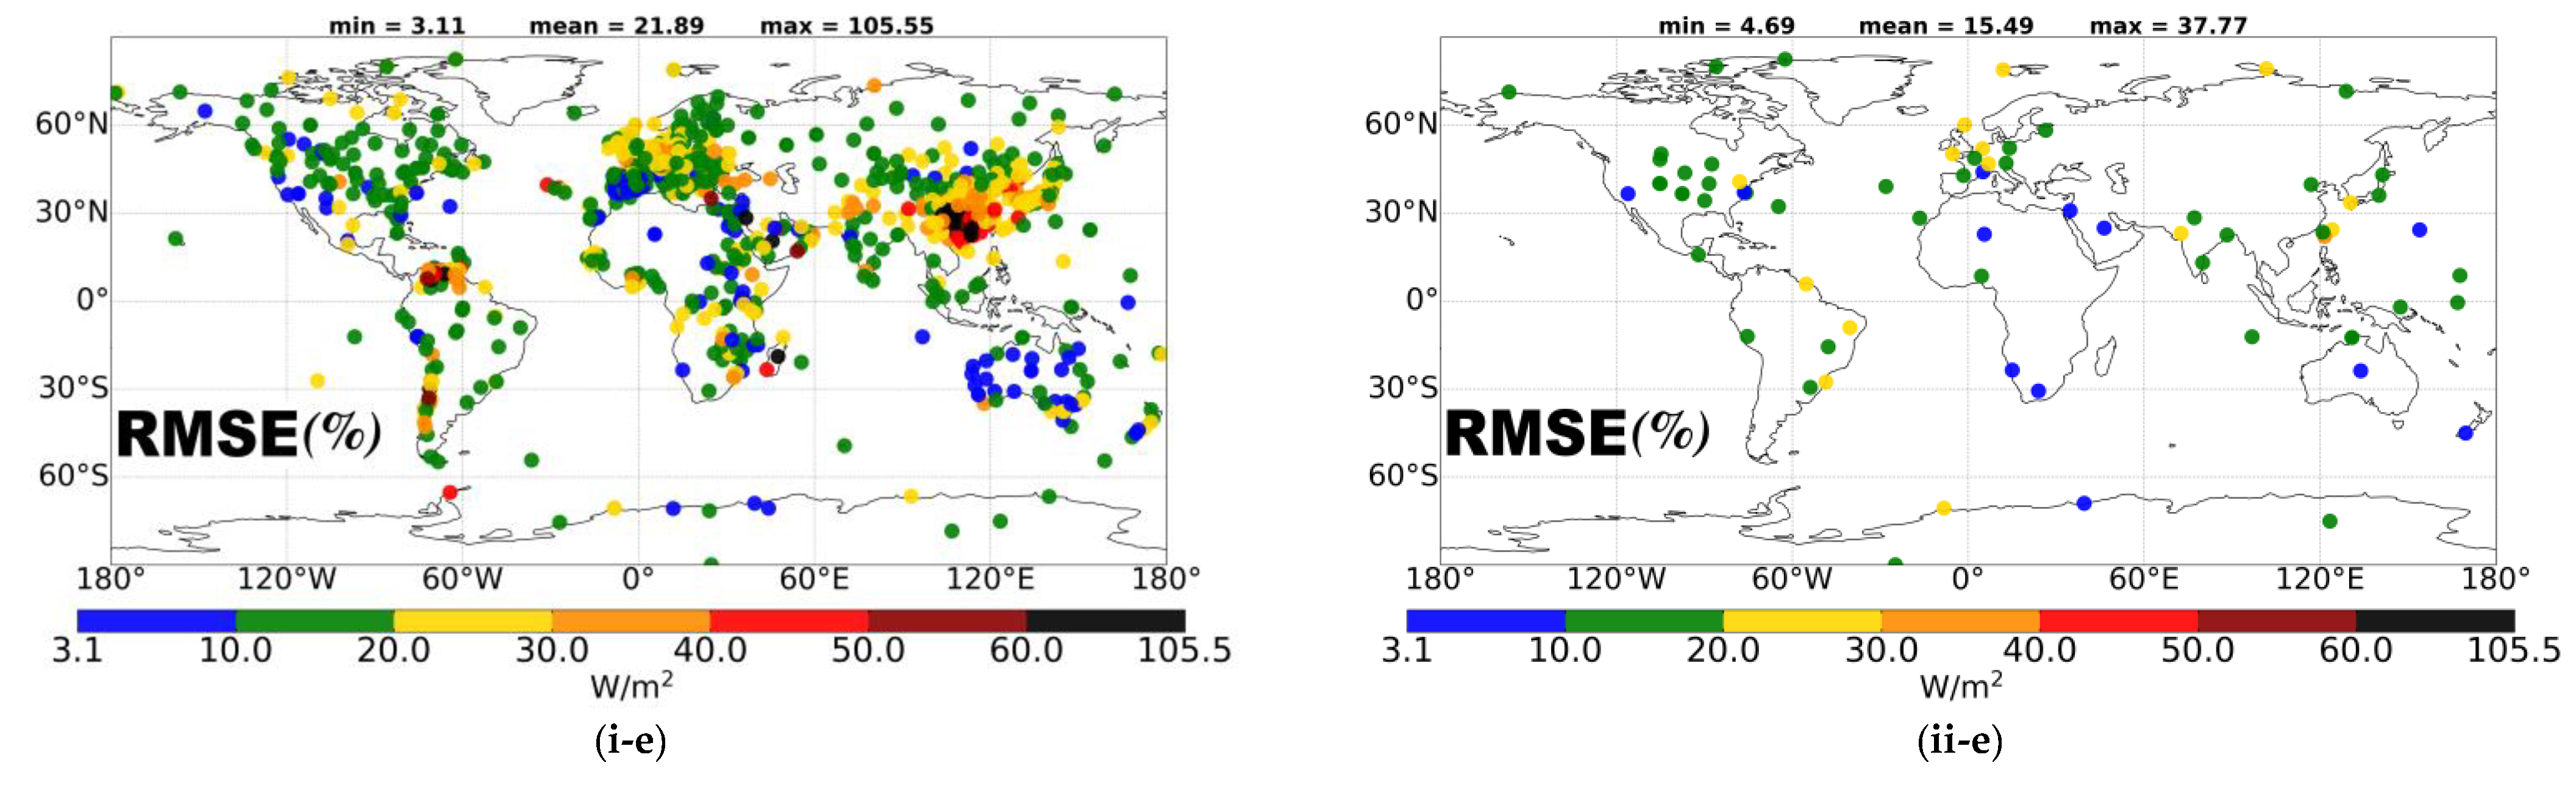
- In general, there is an overestimation of MERRA−2 SSR compared to GEBA and BSRN measurements, the mean bias being equal to 24.25 and 10.31 W/m2 or 15.3 and 5.9%, respectively. The ranges of variability of the biases in terms of absolute and relative percent values for individual stations are −64.24–141.07 W/m2 or −20.3–103.9% for GEBA and −36.32–54.97 W/m2 or −15.8–35% for BSRN stations. However, MERRA-2 underestimates SSR at low latitudes and polar regions. The general overestimation leads to the conclusion that the atmosphere of MERRA-2 is too transparent. The computed average RMSE is equal to 36.07 W/m2 (equivalent to 22.8%) for the comparison of MERRA-2 with GEBA, while the corresponding values for BSRN are equal to 26.12 W/m2 or 15.1%. The RMSE values are high in the tropics and the highest in Southern China.
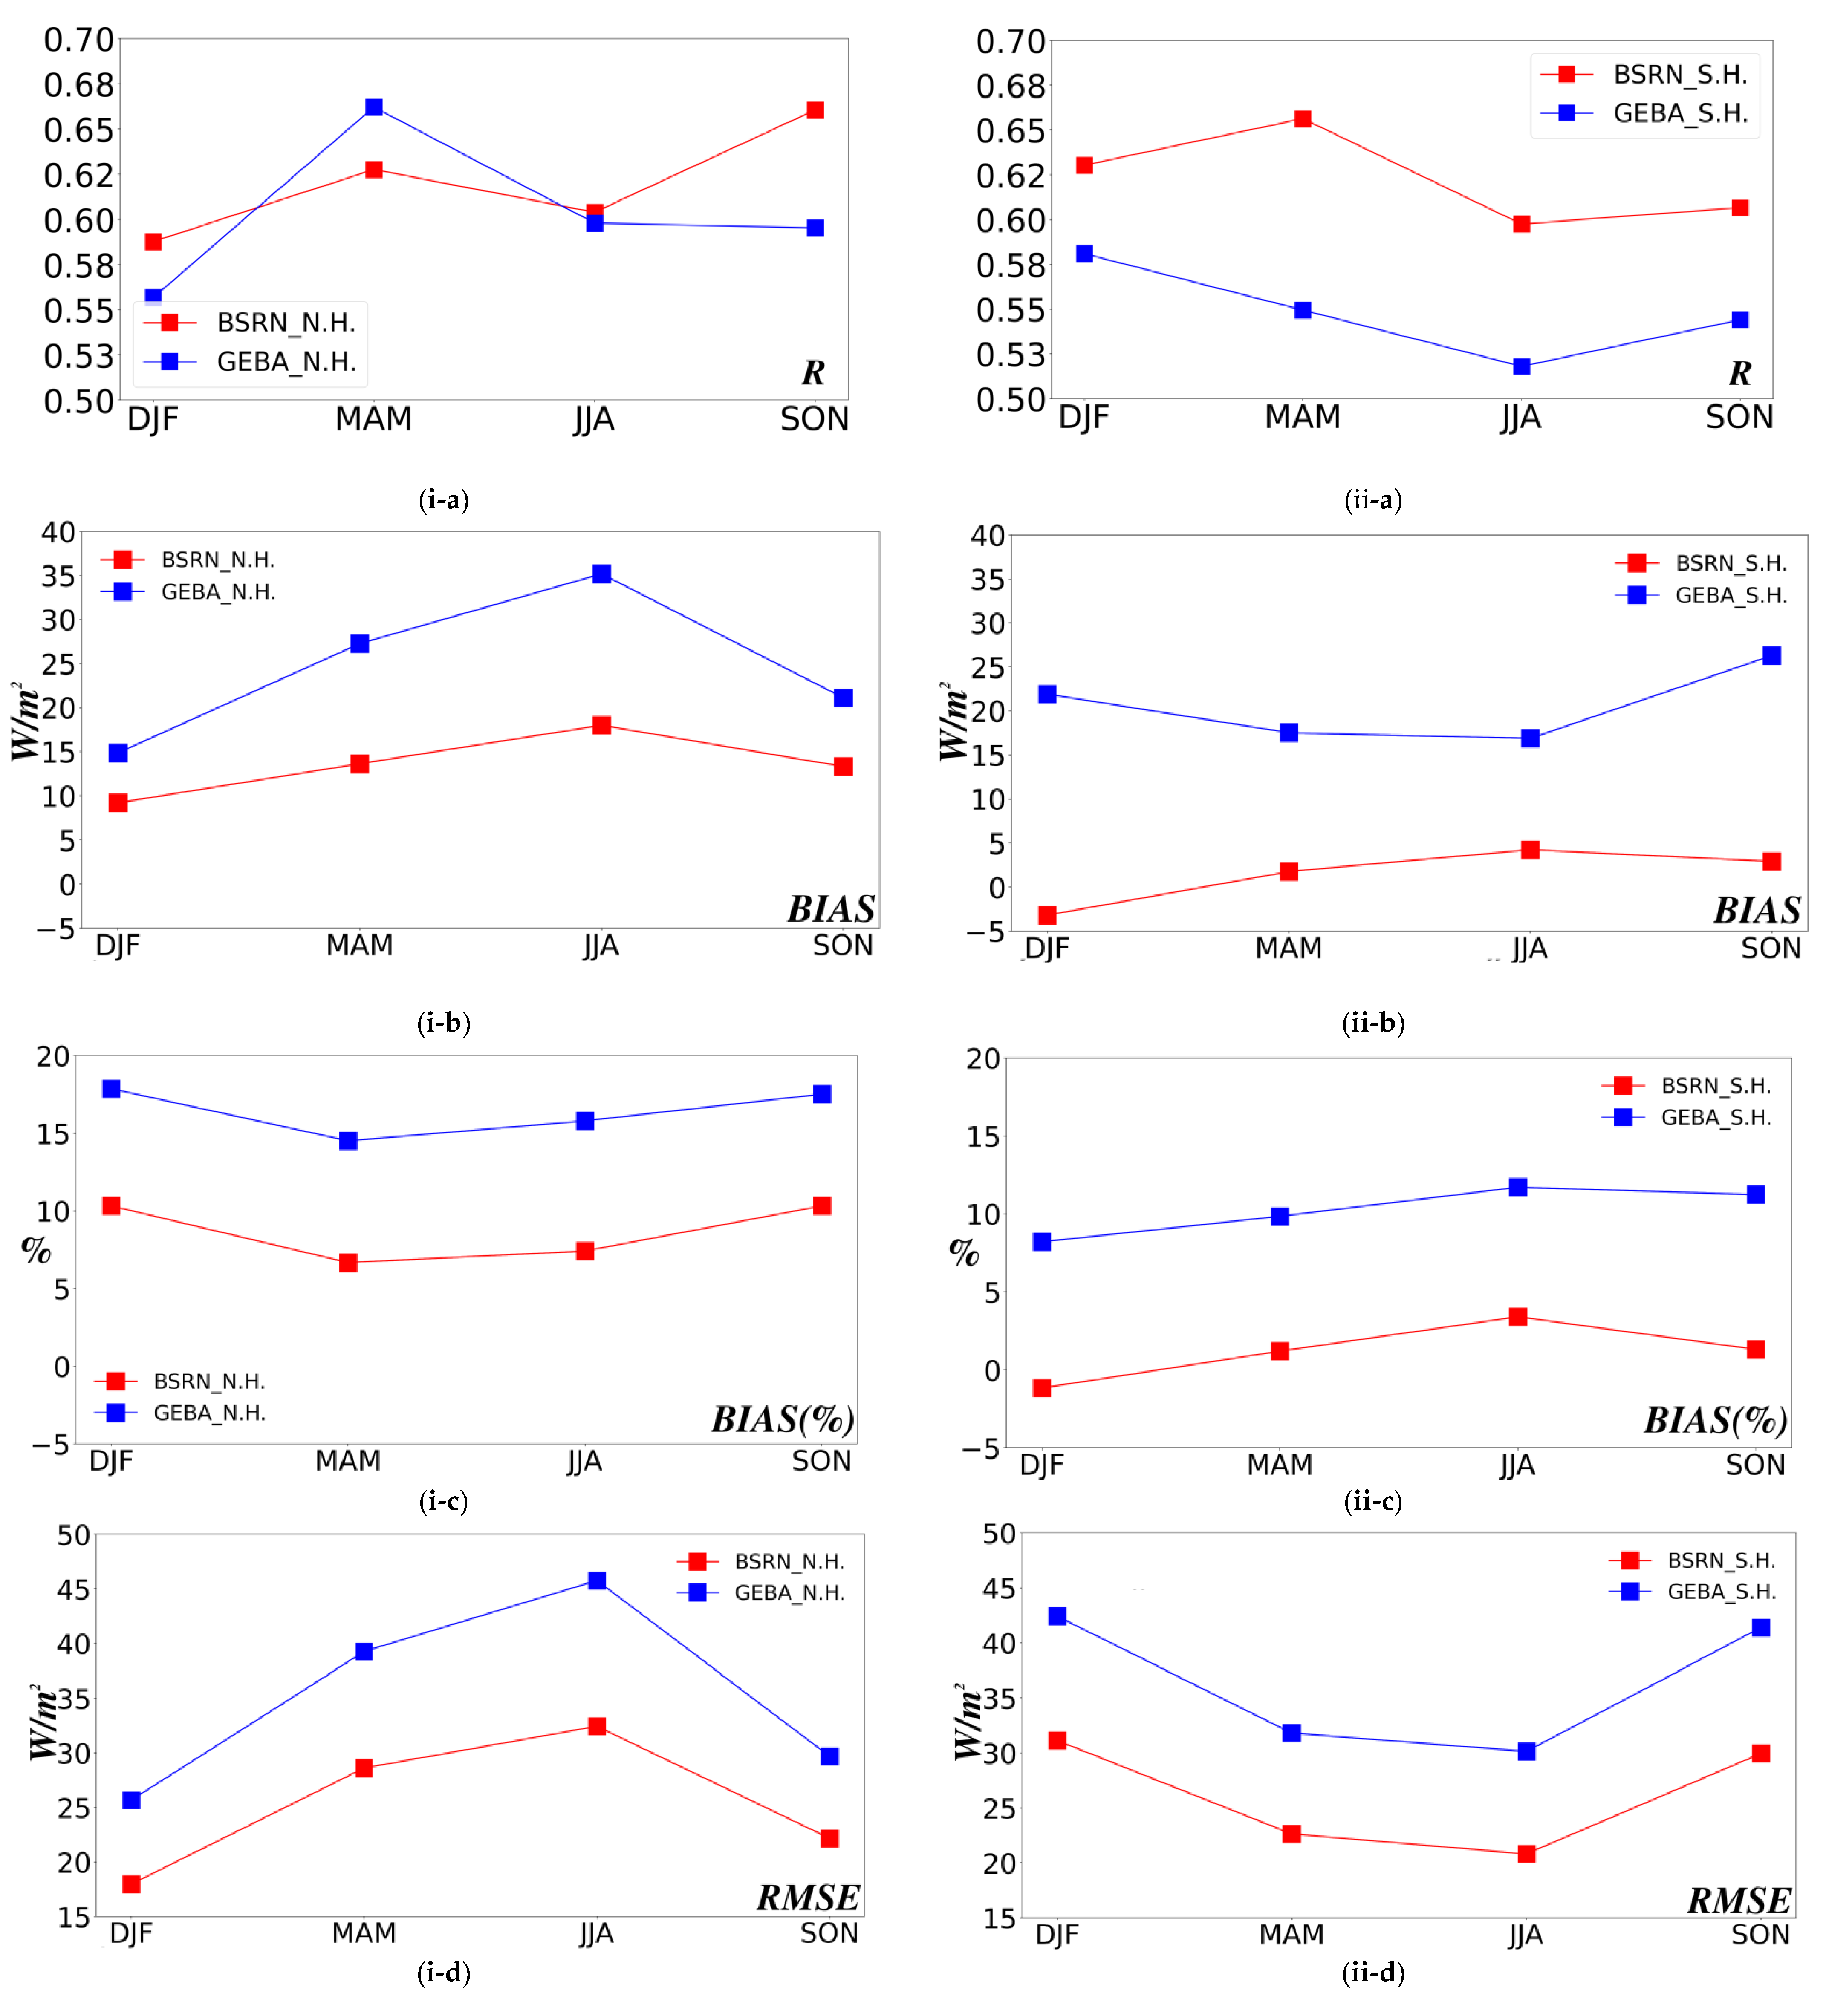
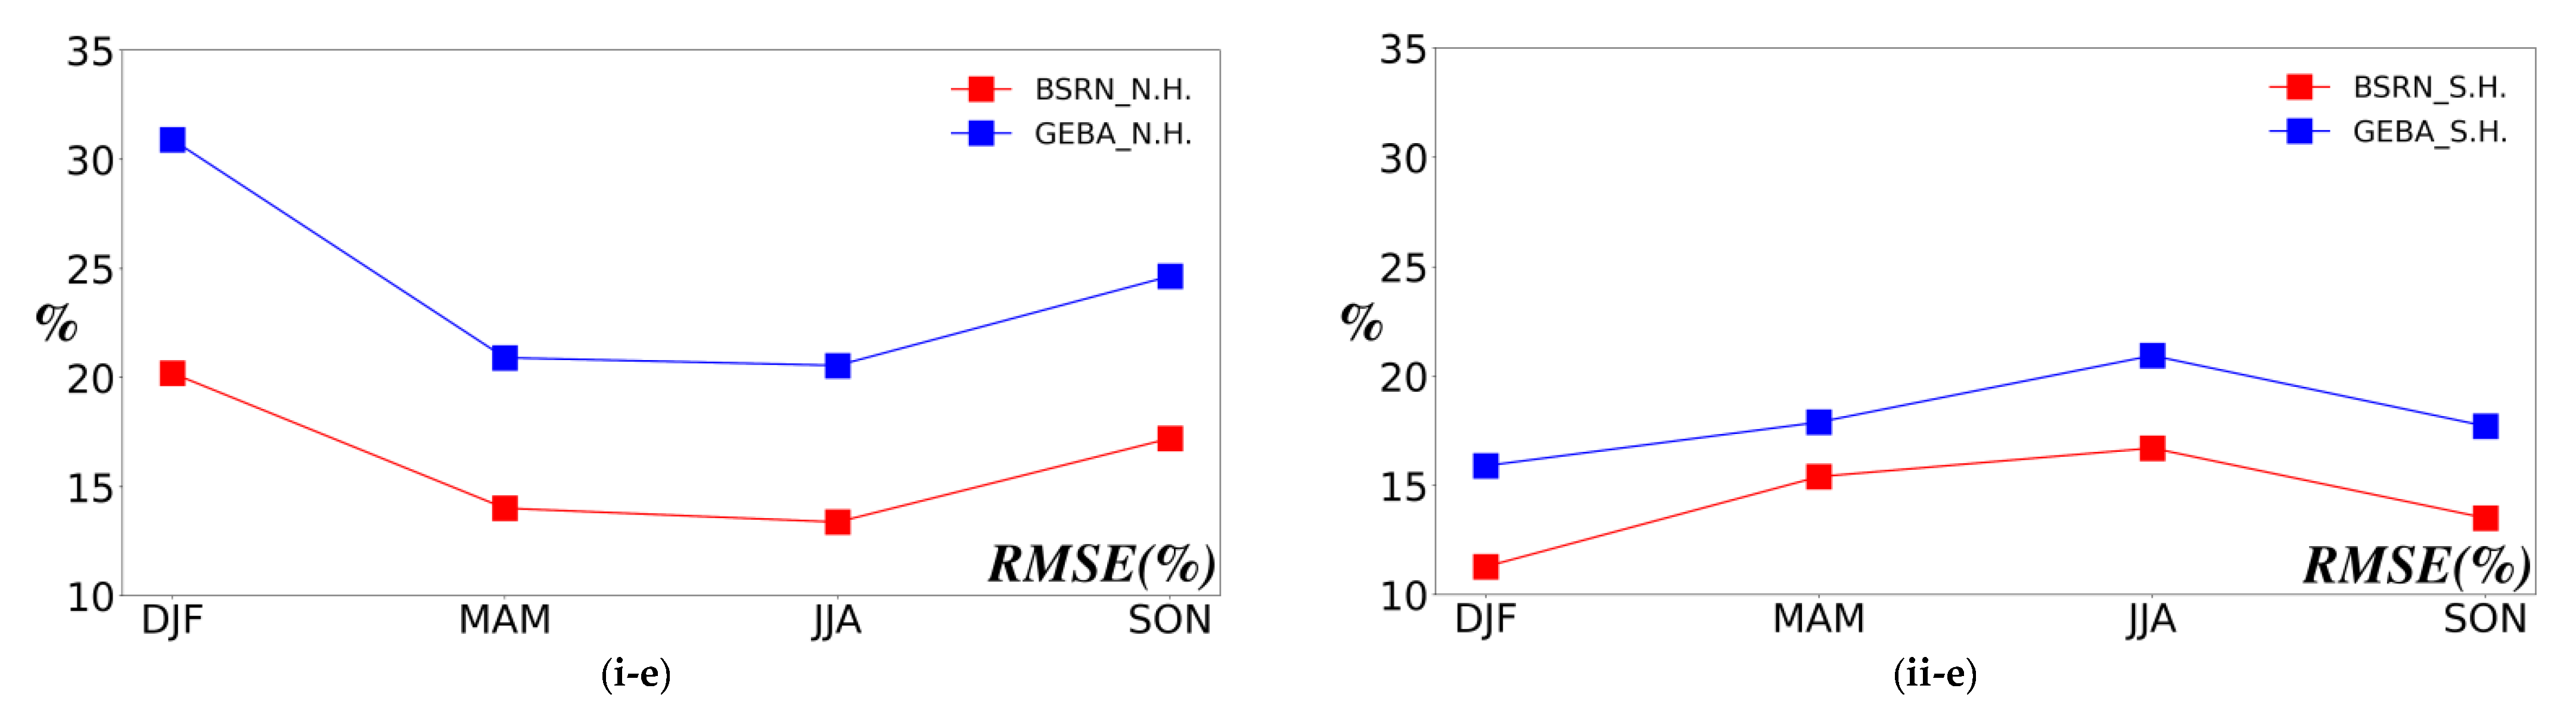
- The assessment of the performance of MERRA-2 SSR with GEBA on a seasonal basis has shown that in both hemispheres the performance is worse during the cold period of the year, when the computed hemispherical mean values of percent bias and RMSE are the highest (17.9 and 30.9%, respectively) and those of R are the lowest (0.52).
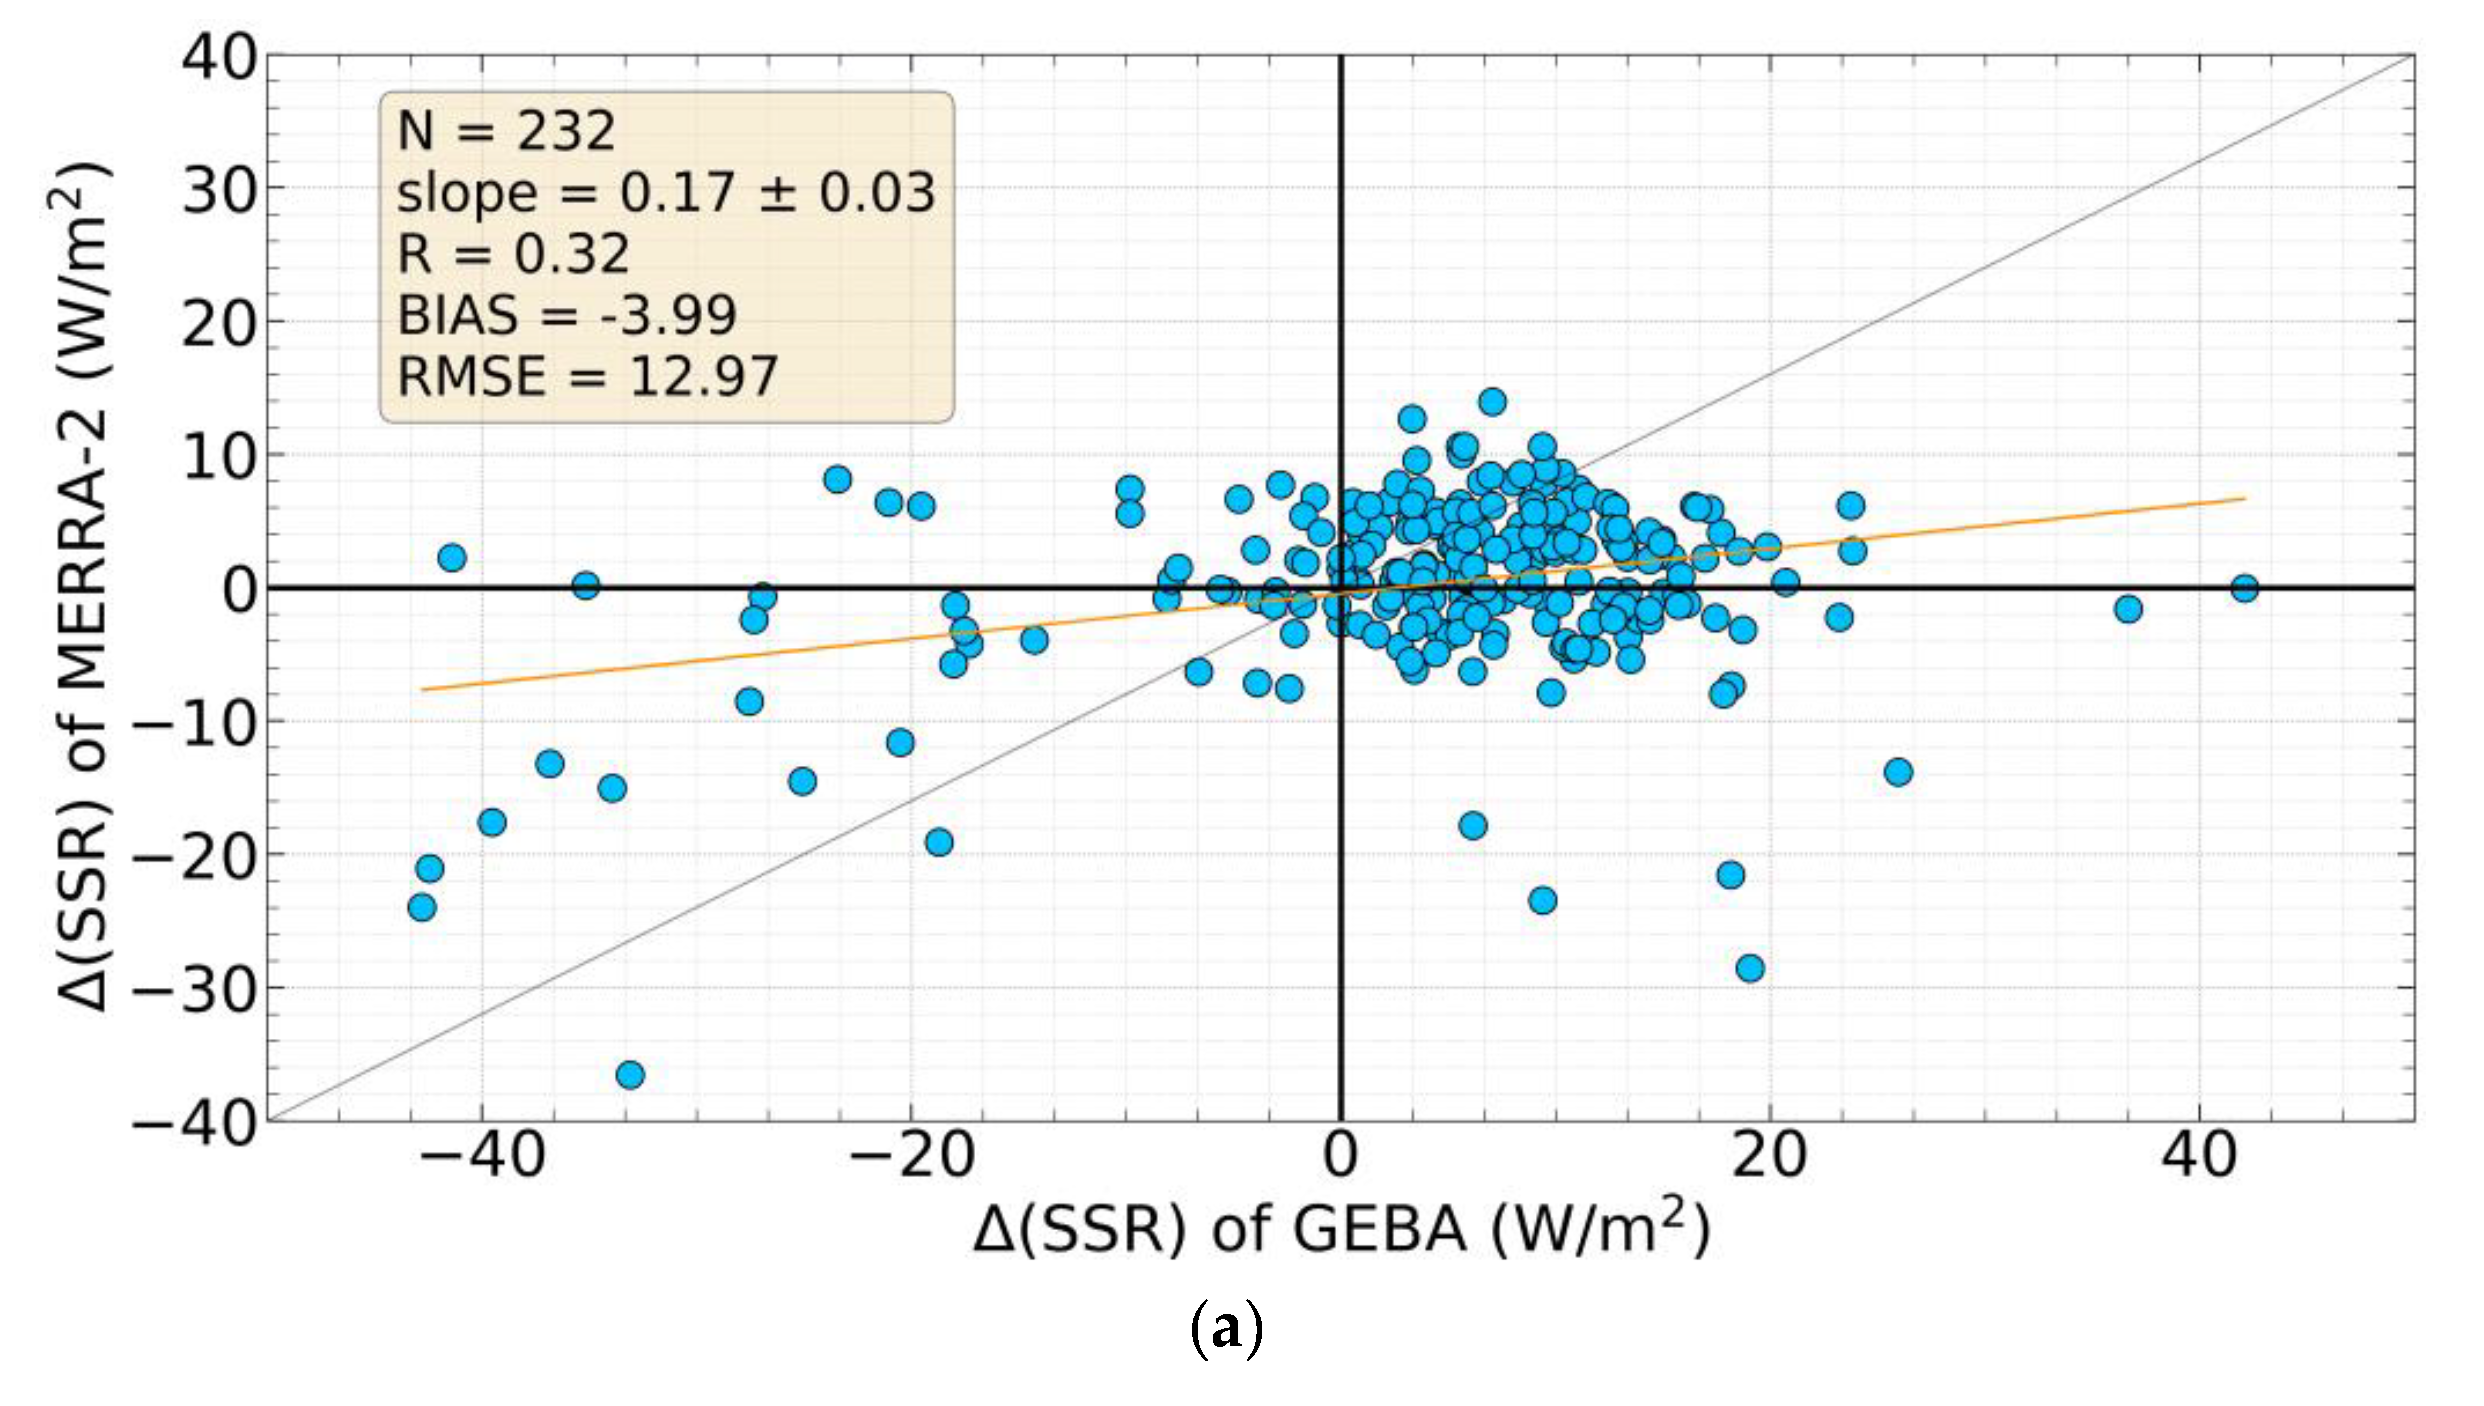
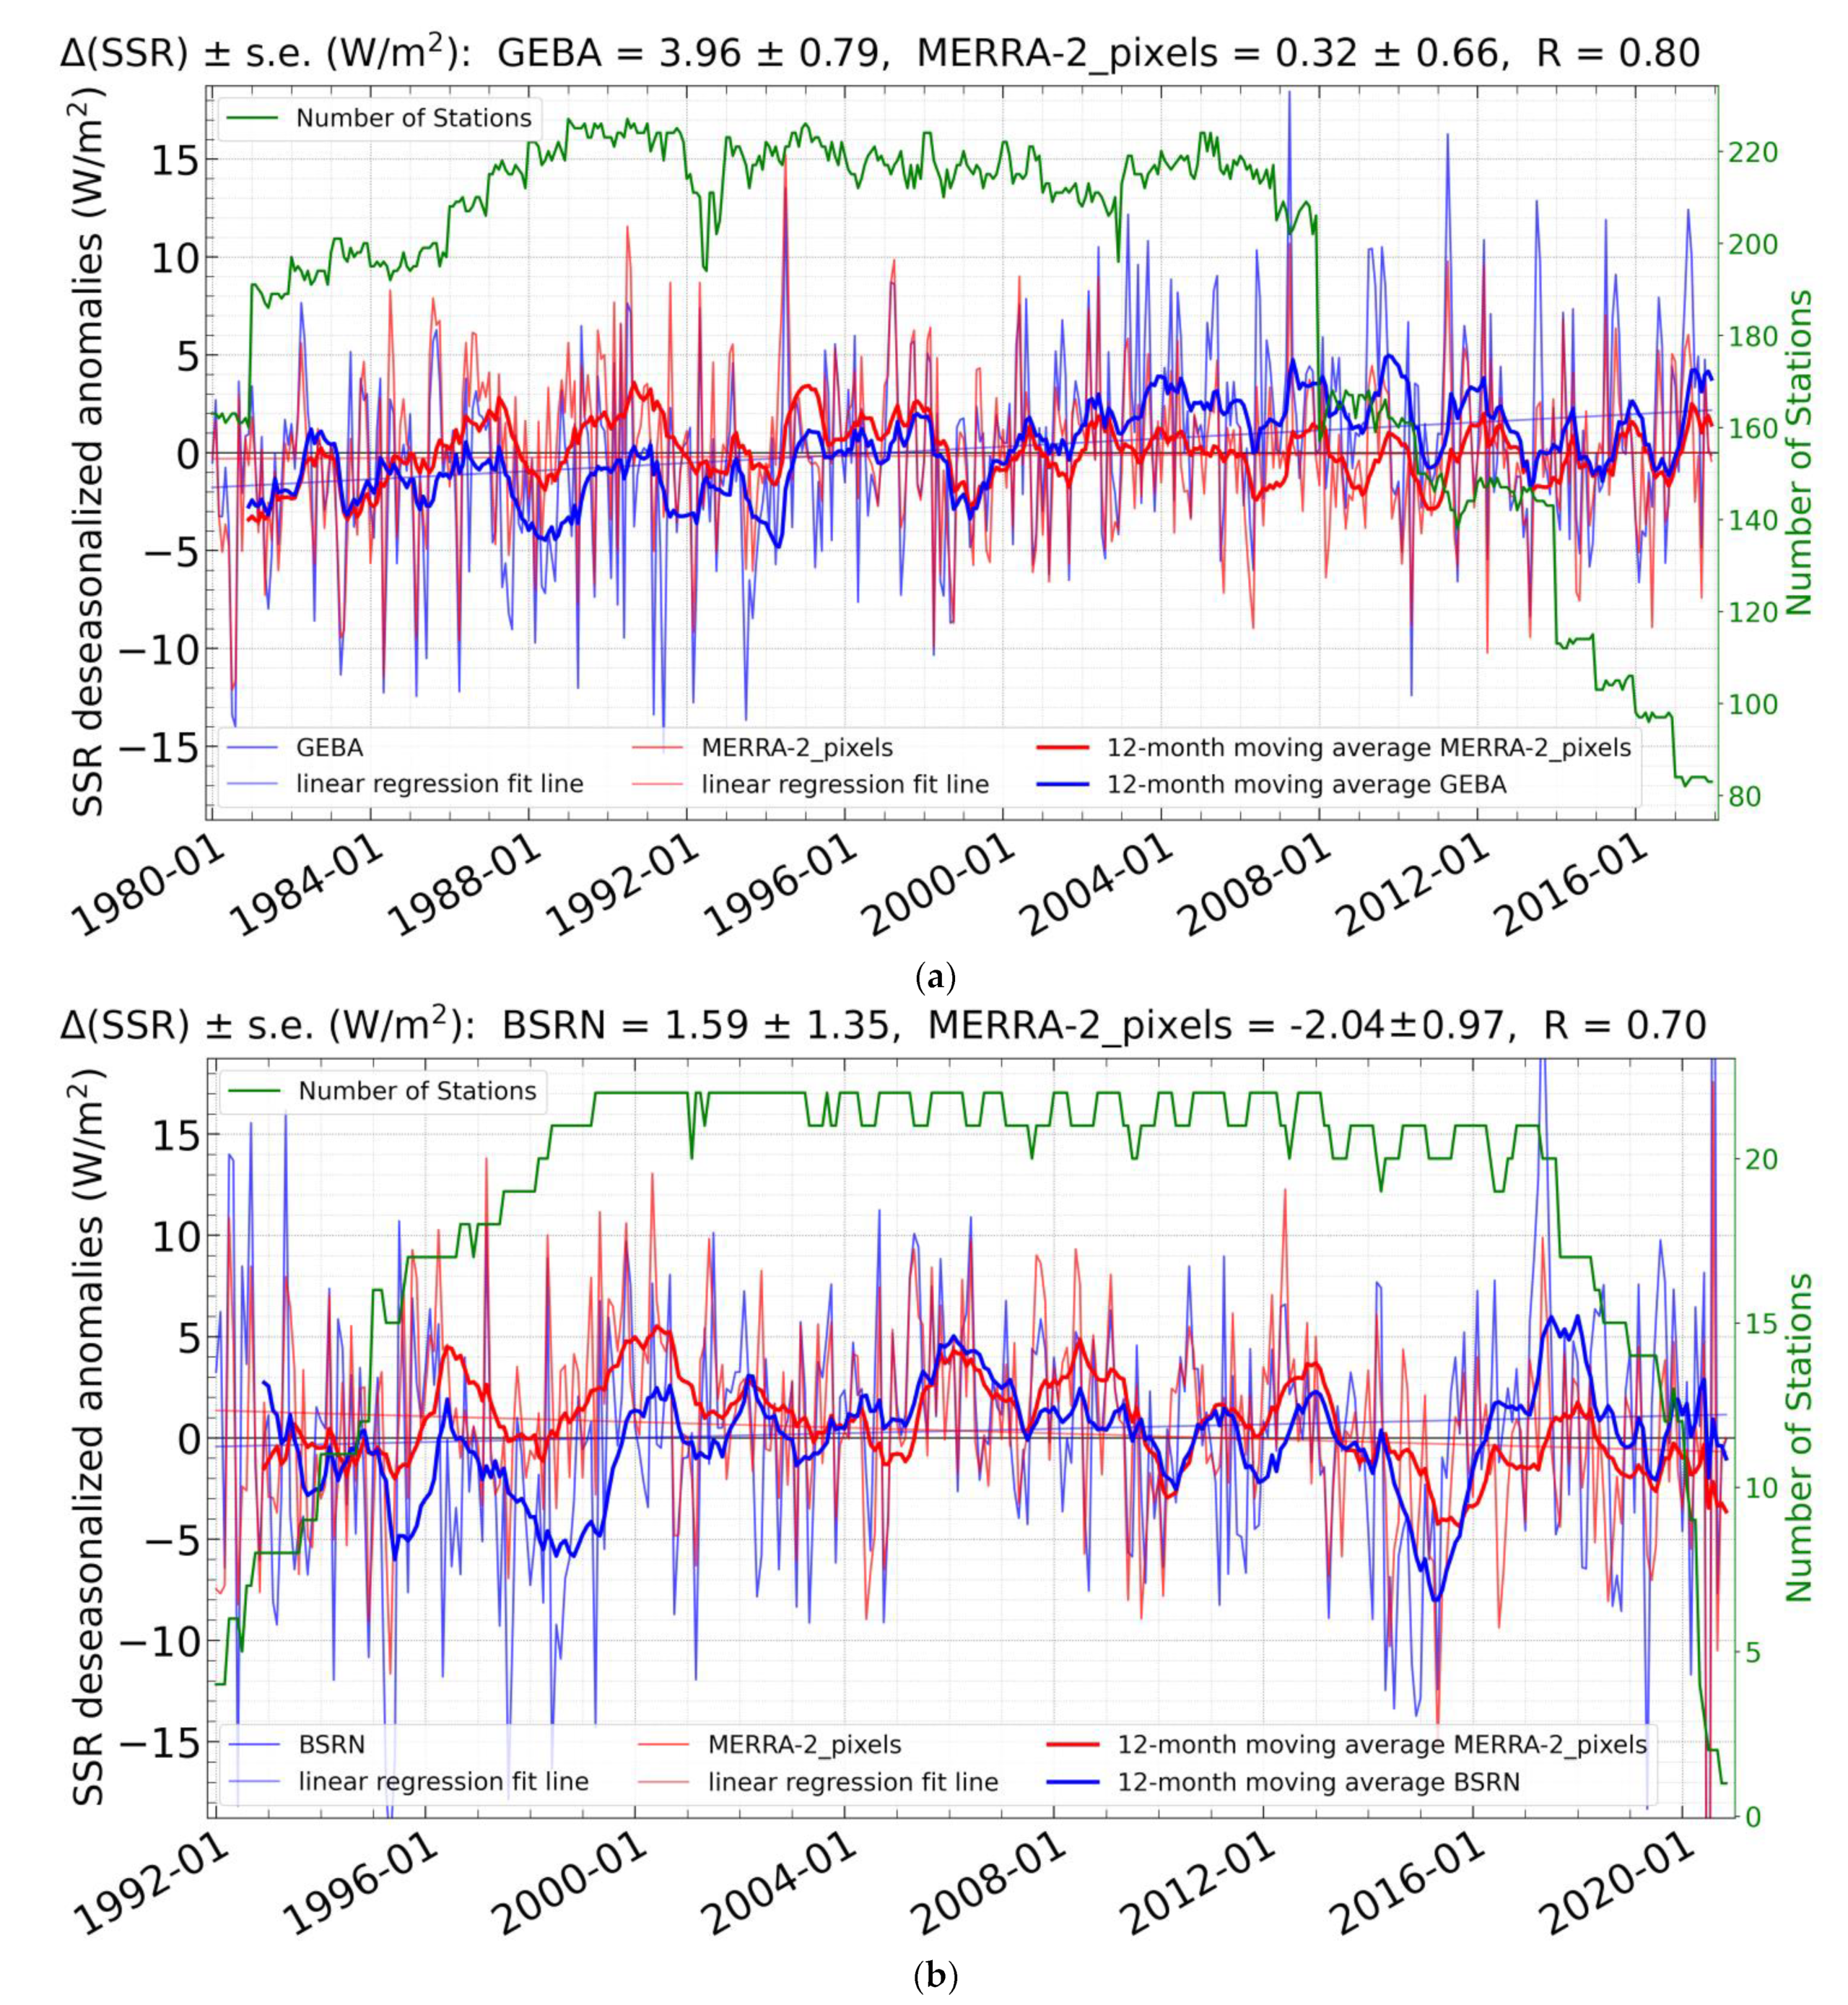
- The time-series of the average SSR anomalies of GEBA and BSRN stations and the corresponding MERRA-2 pixels show that MERRA-2 show larger anomalies, positive before 2000 and negative in the post 2000 years, which can affect the computed trends of SSR, namely GDB, of MERRA-2 and stations. Indeed, the MERRA-2 SSR trends show a stronger dimming and a weaker brightening than the stations’ trends.
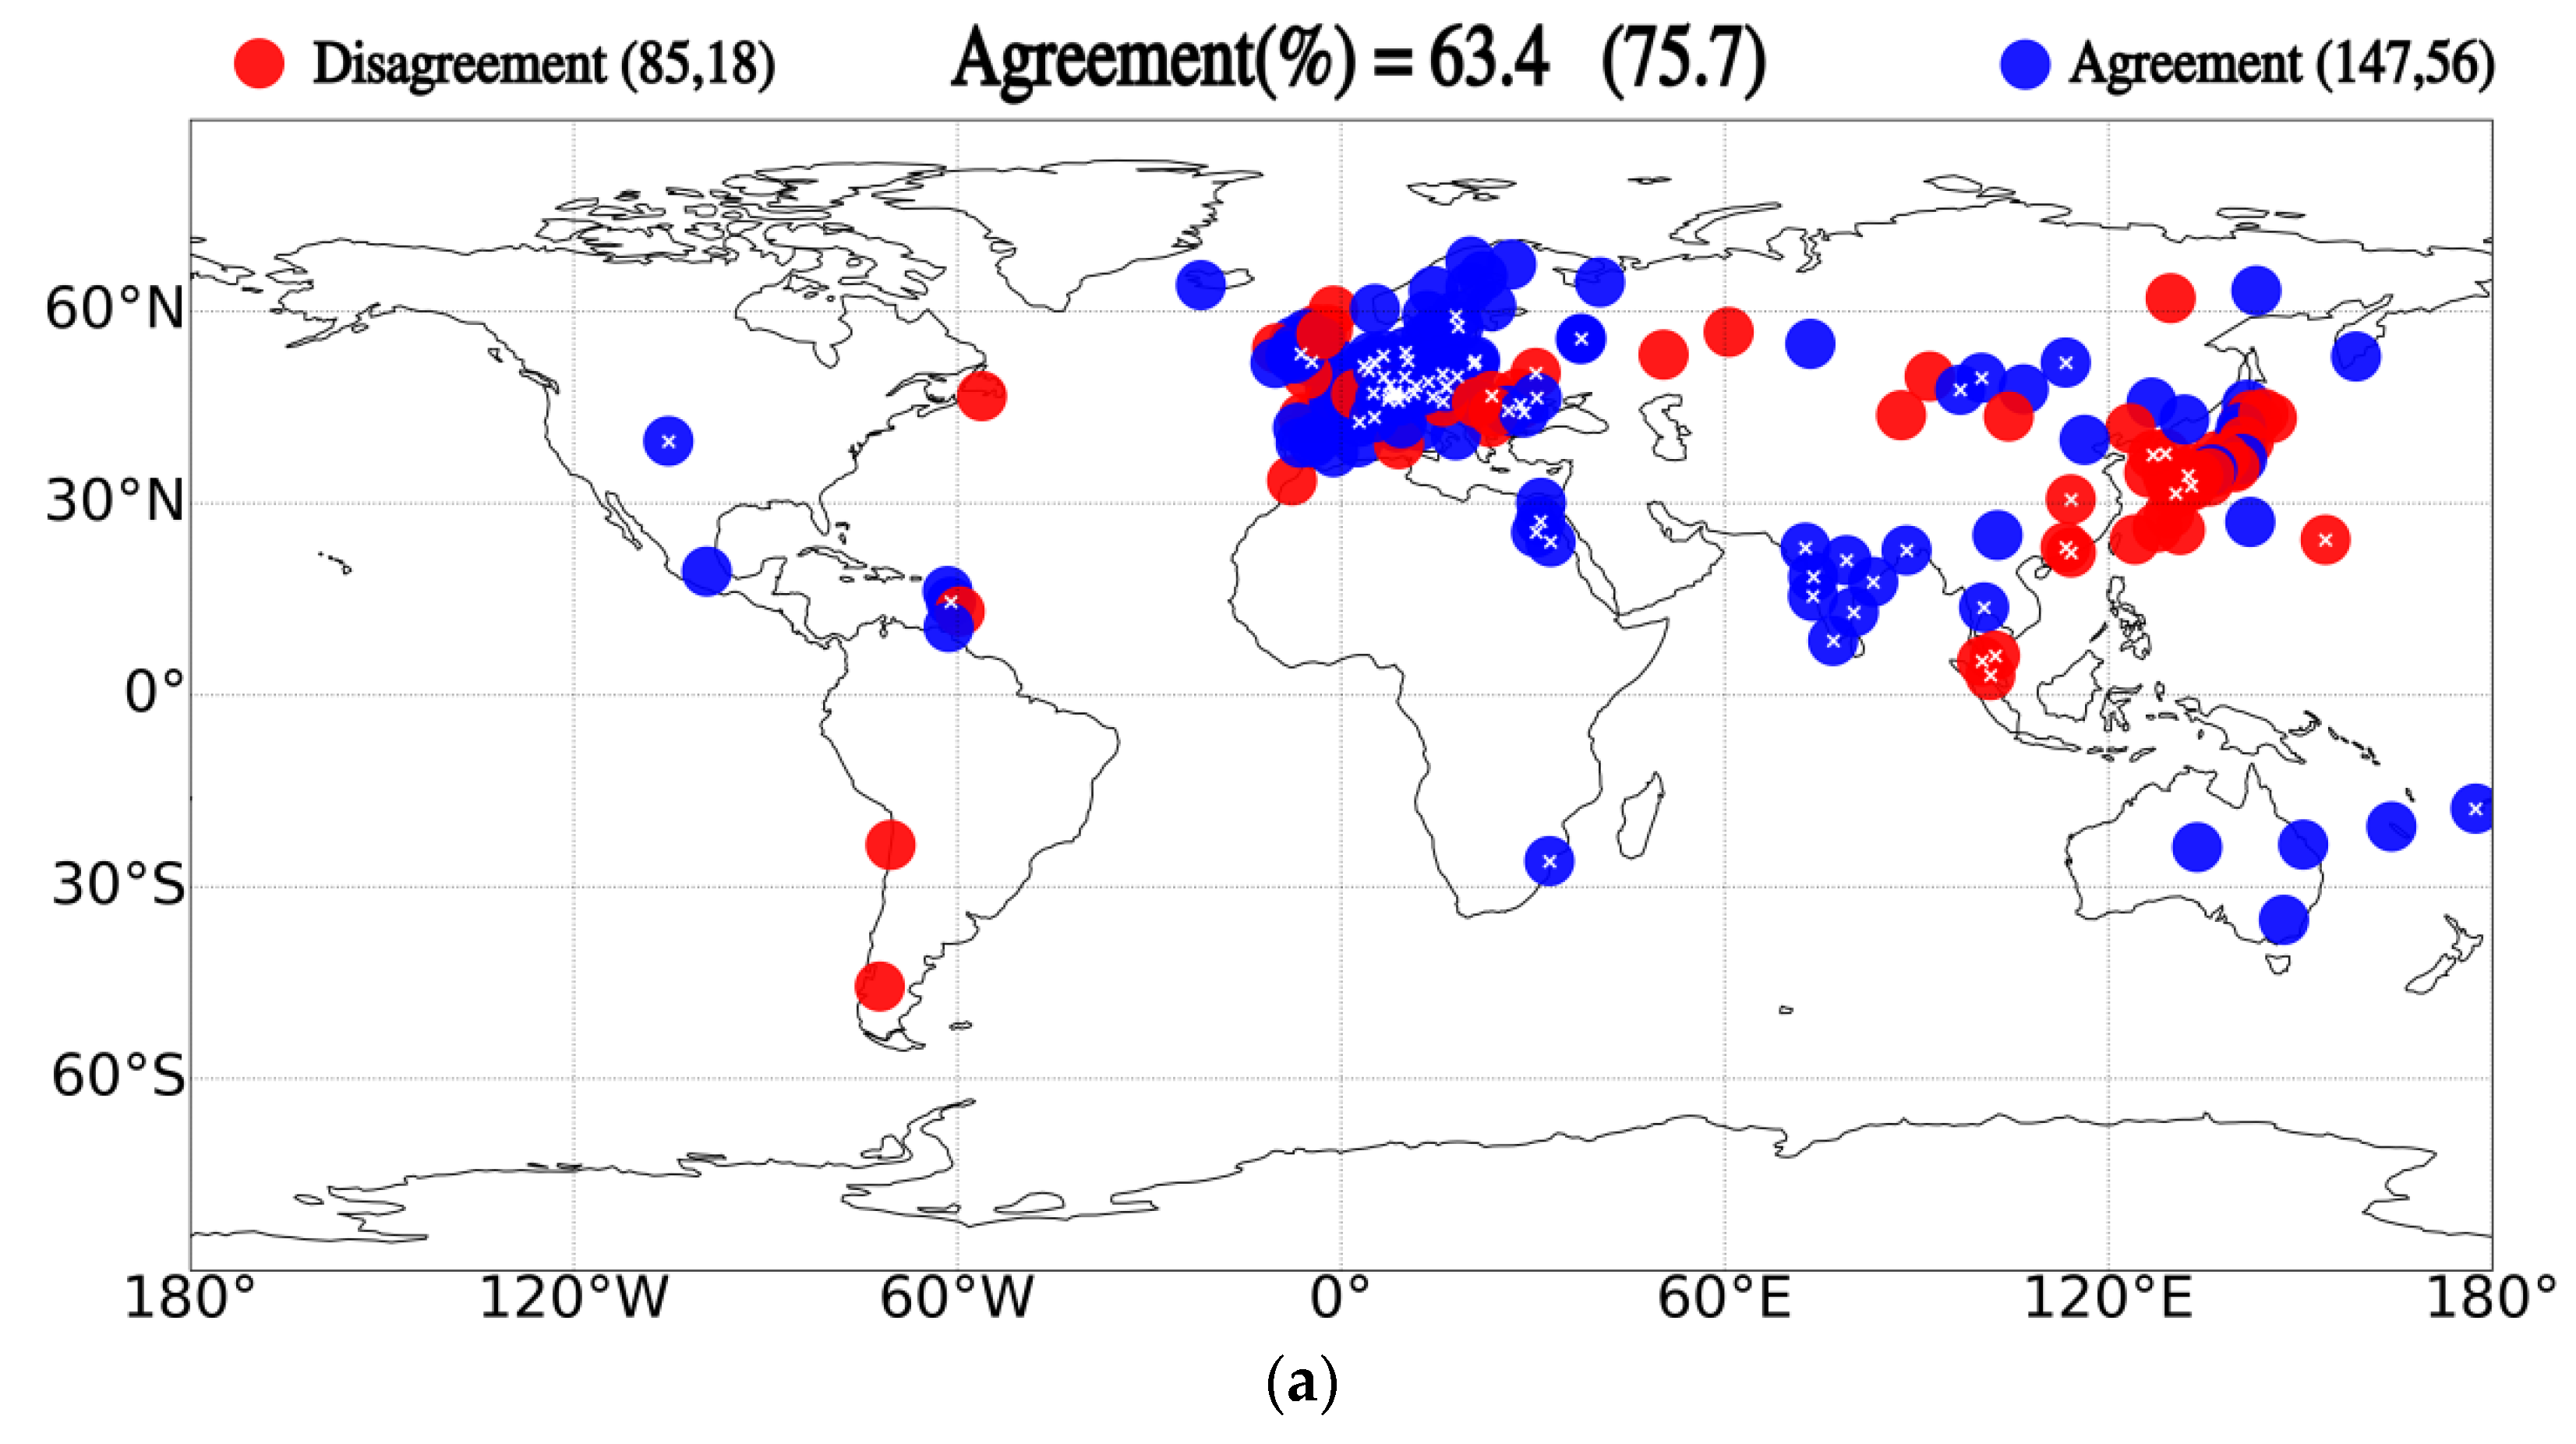
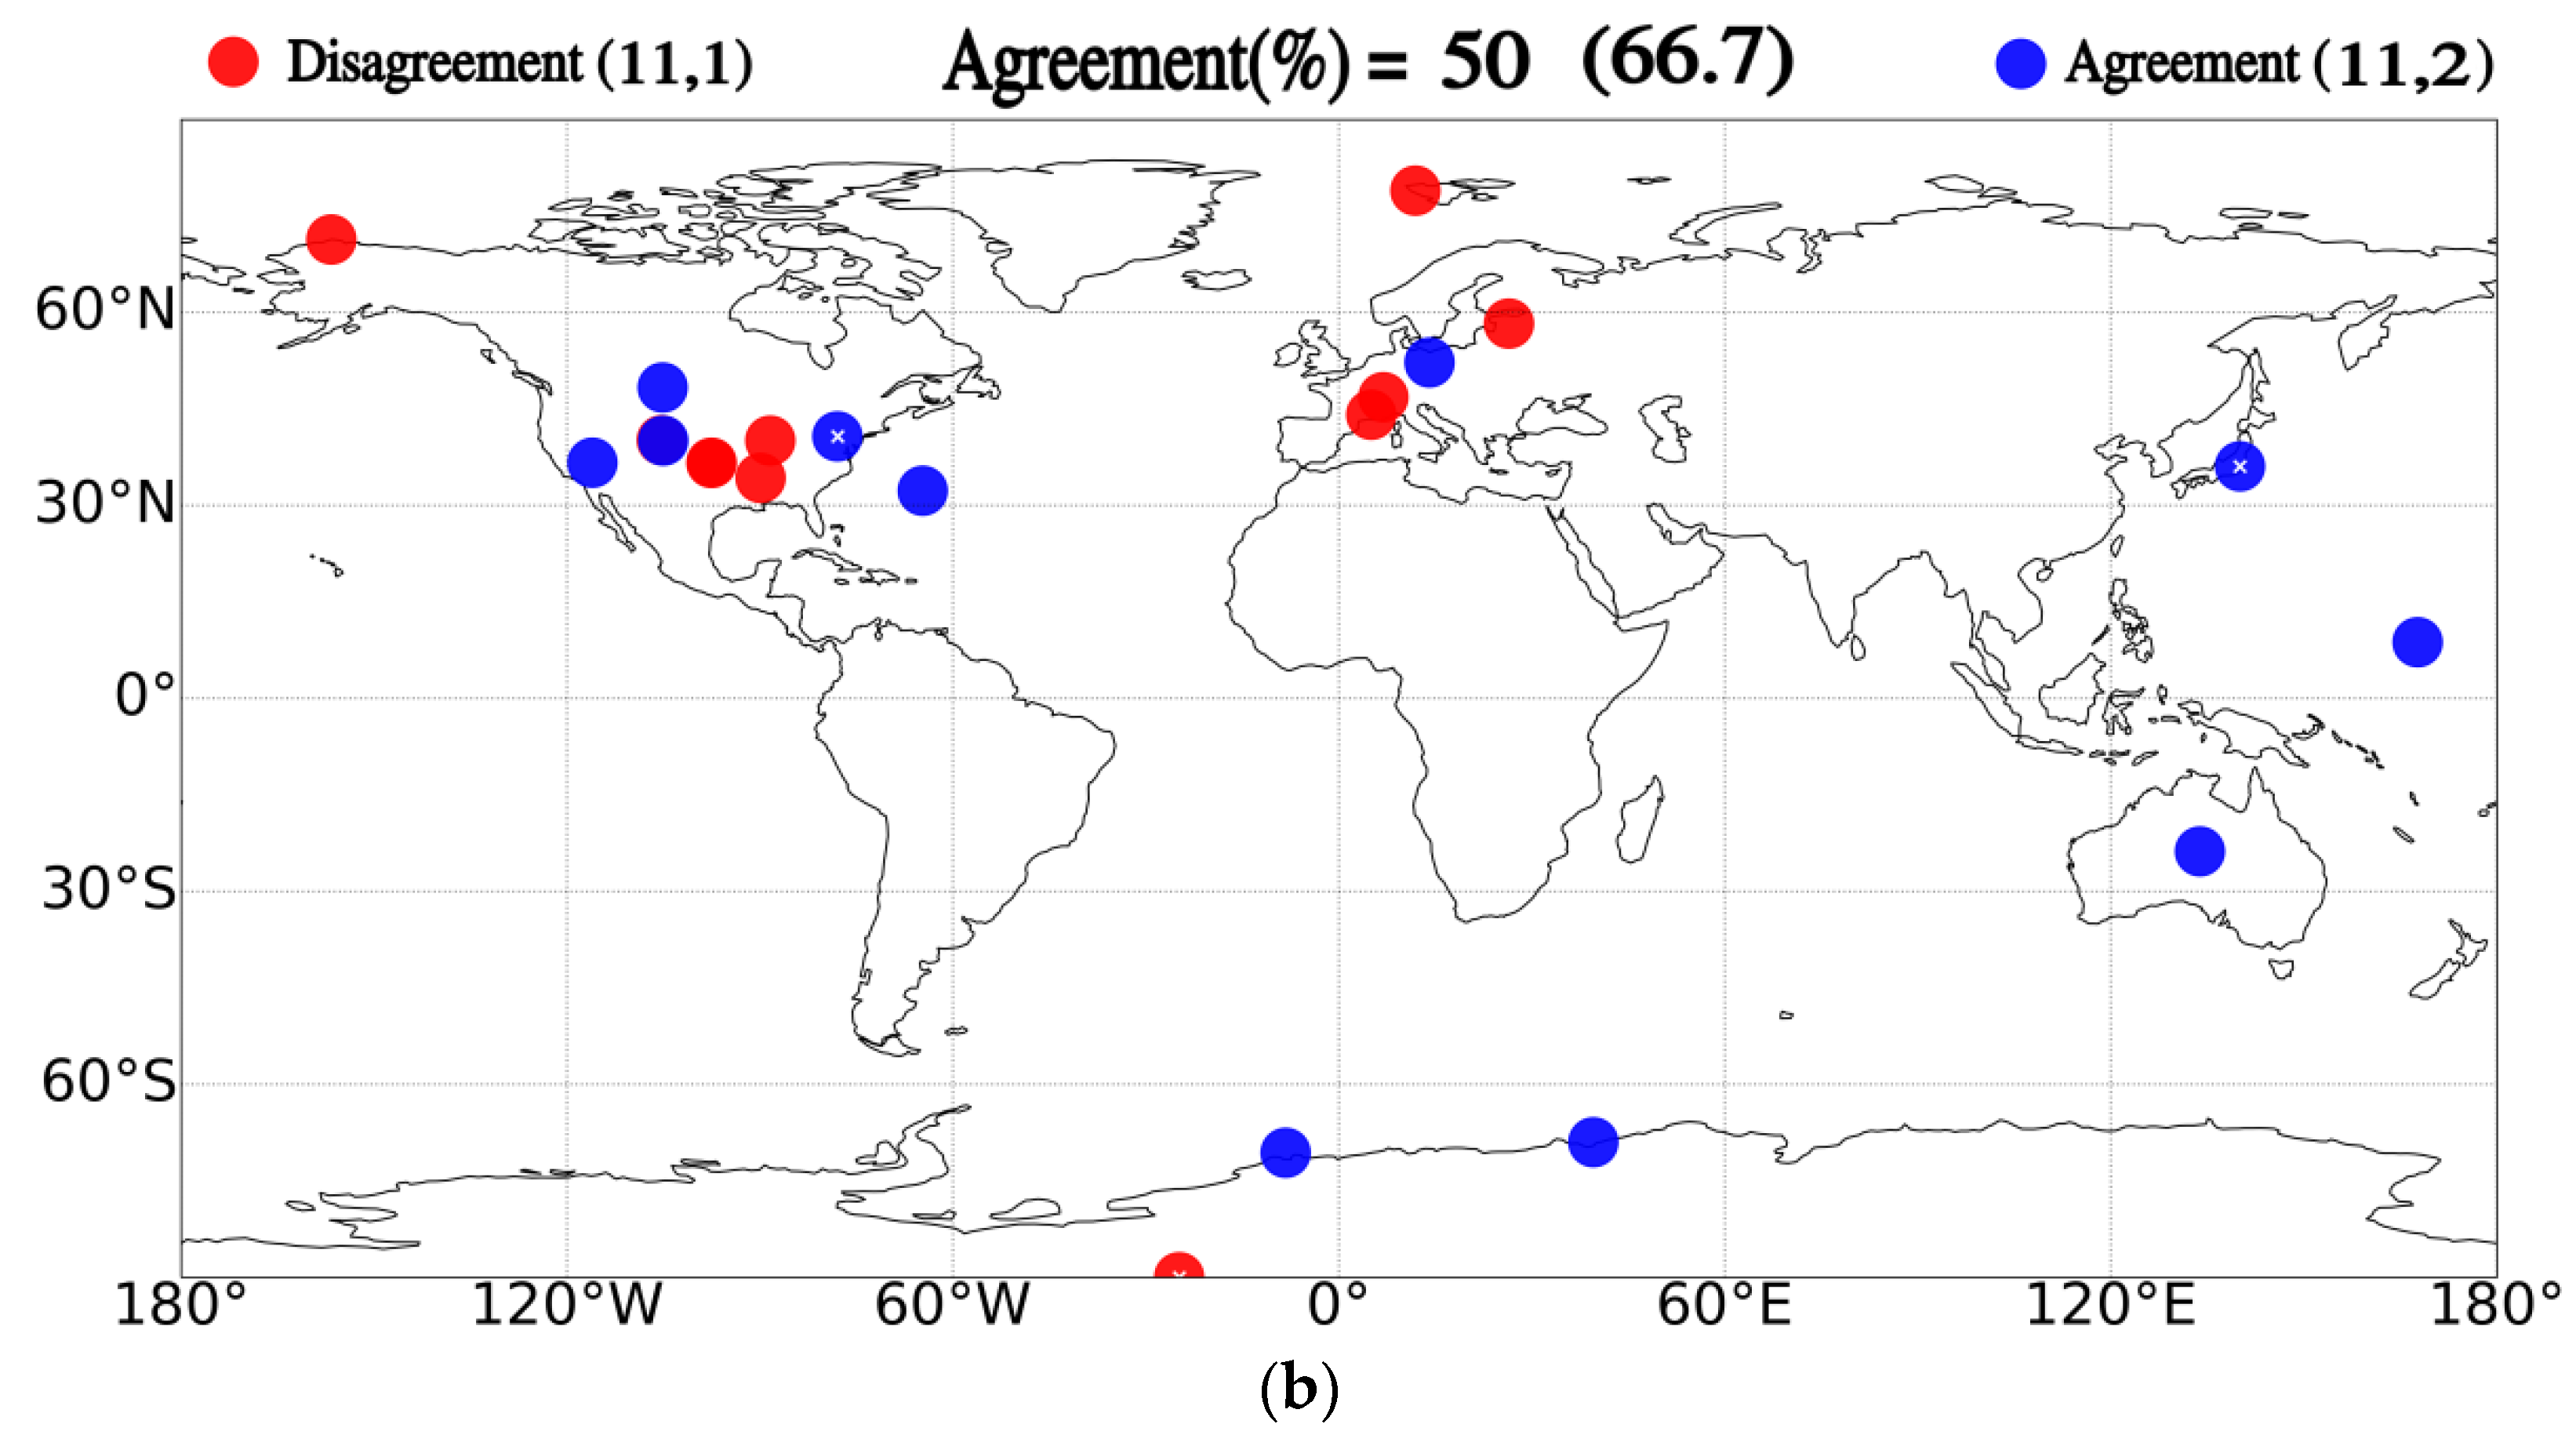
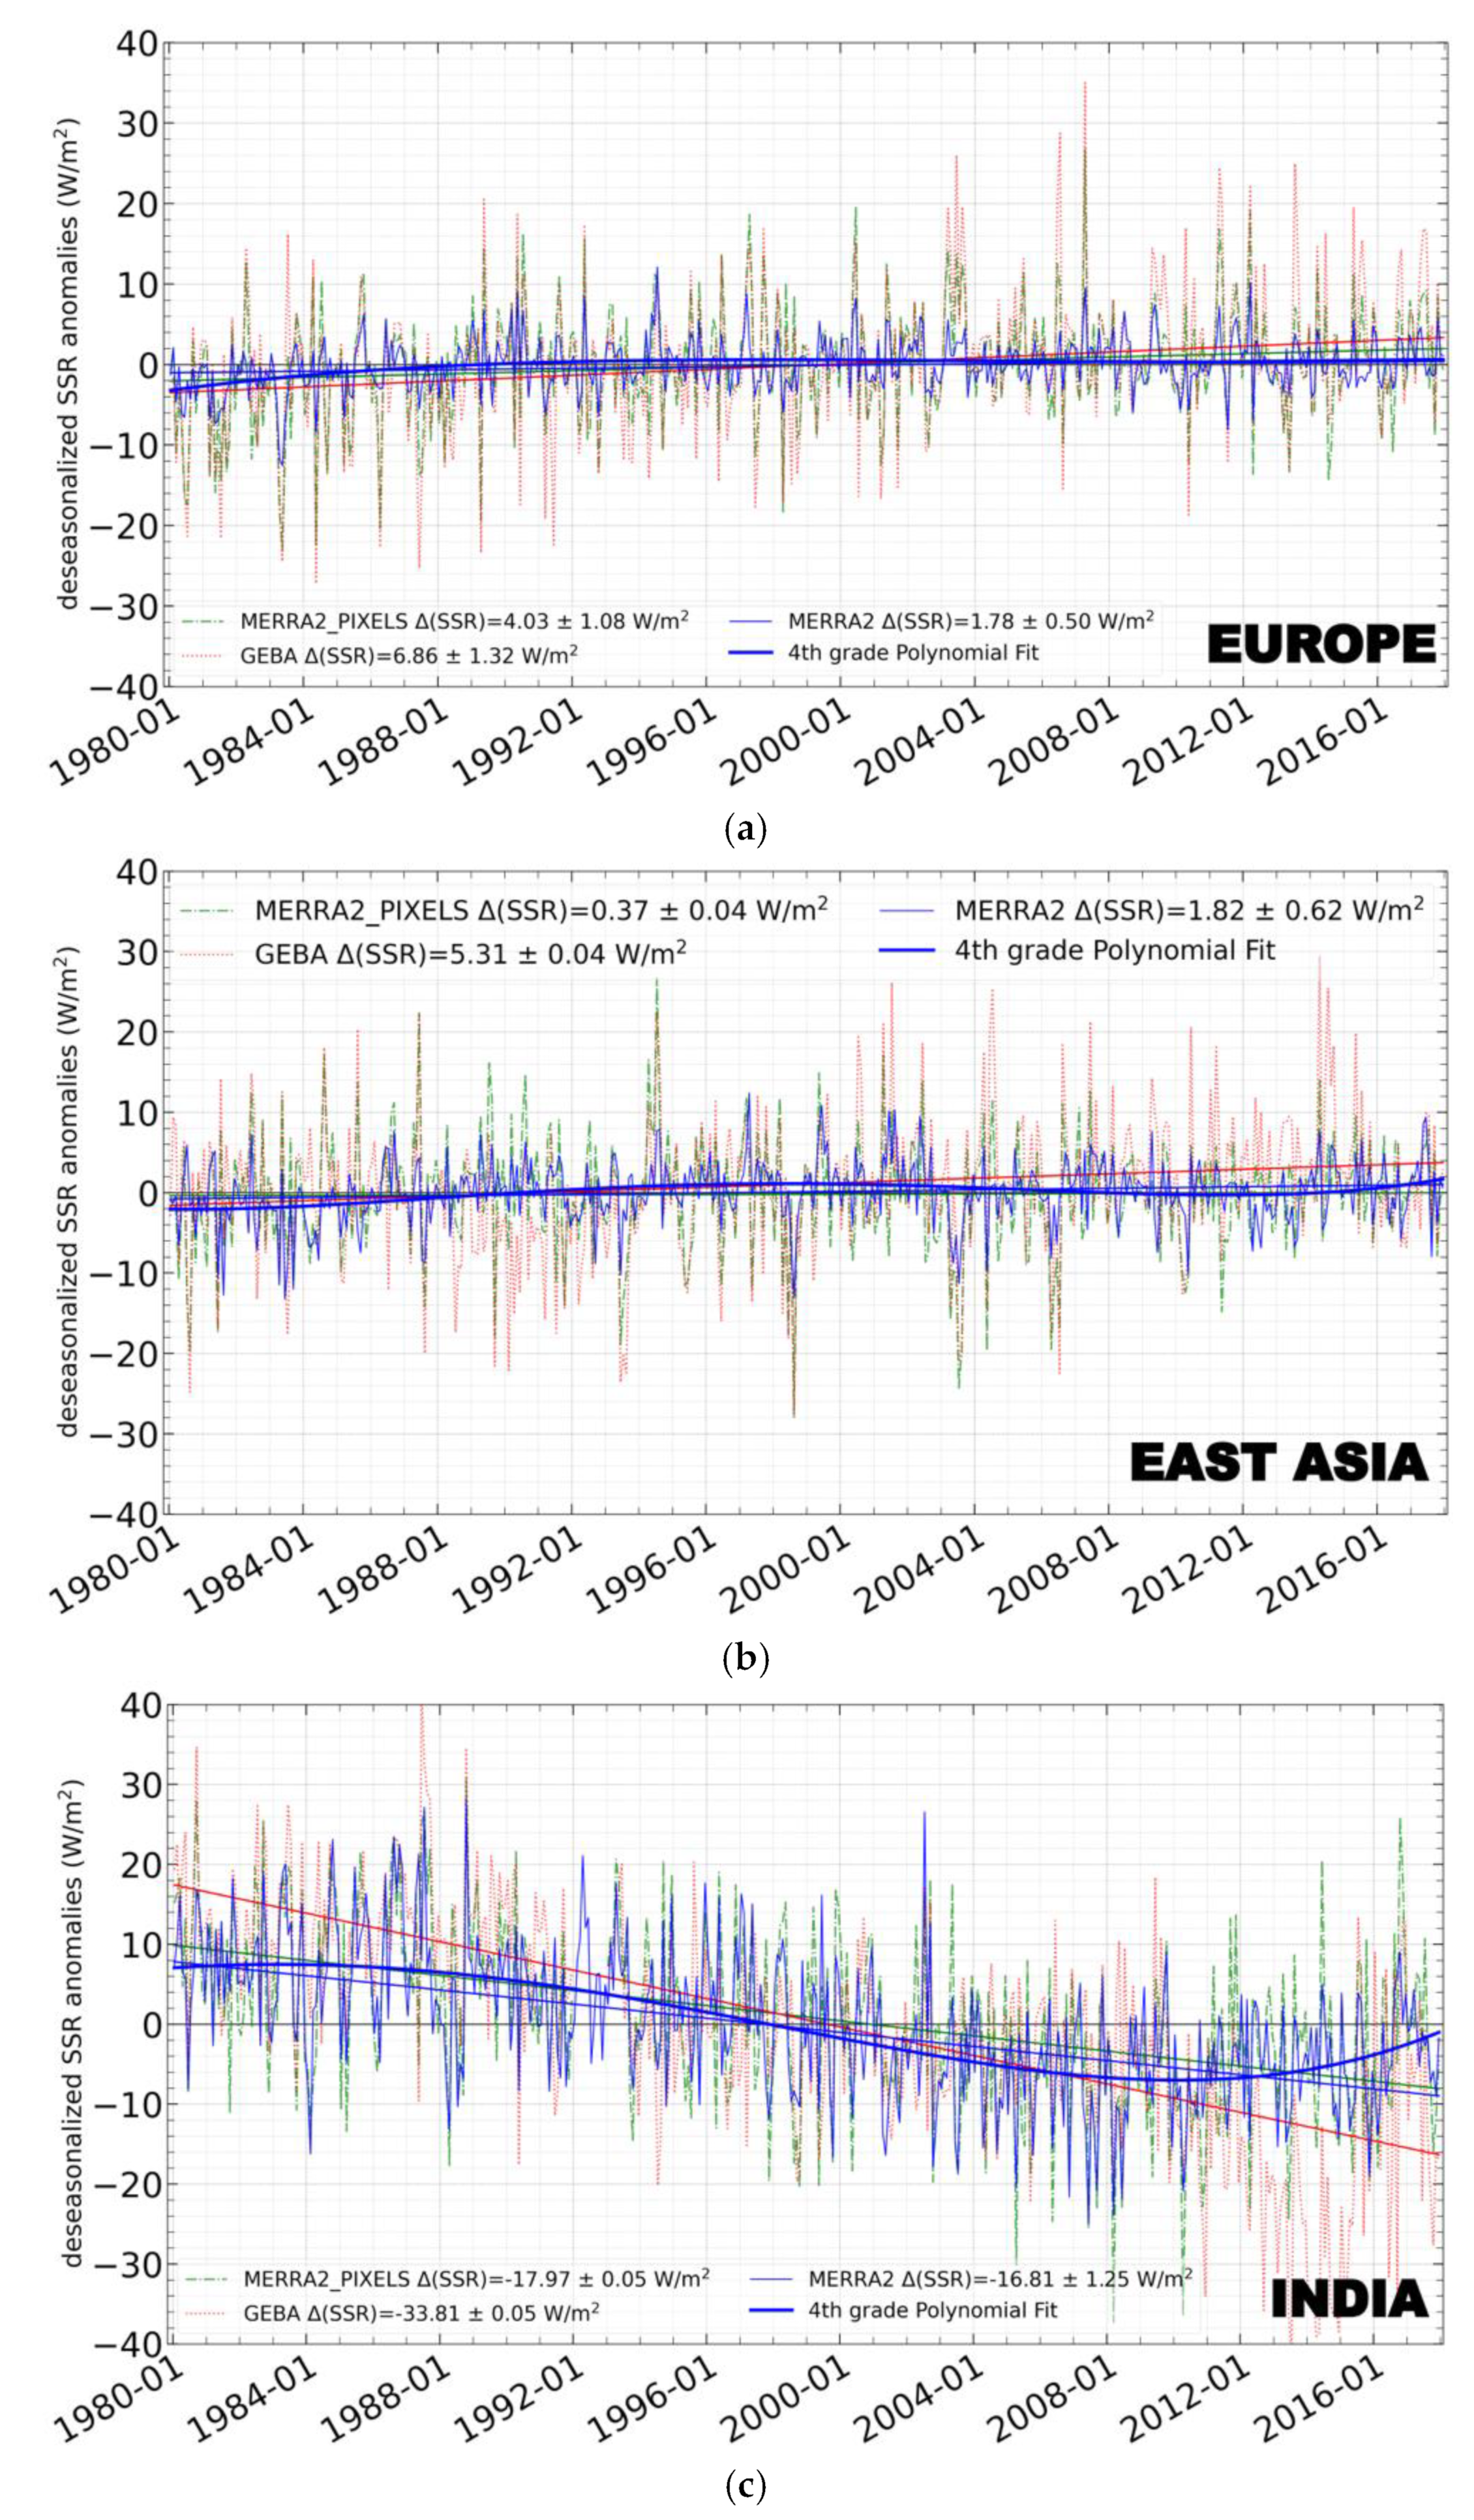
- Comparing the sign of GDB for each station (232 GEBA and 22 BSRN) and MERRA-2 pixels where the stations are located, an agreement is found for 63.4% of matched MERRA-2 and GEBA pairs (for the period 1980–2017), with the corresponding number being equal to 50% for the matched MERRA-2 and BSRN pairs (for the period 1992–2020). A very good agreement between the Reanalysis and stations in terms of signs of GDB is found for Europe and India, opposite to a strong disagreement in Japan.
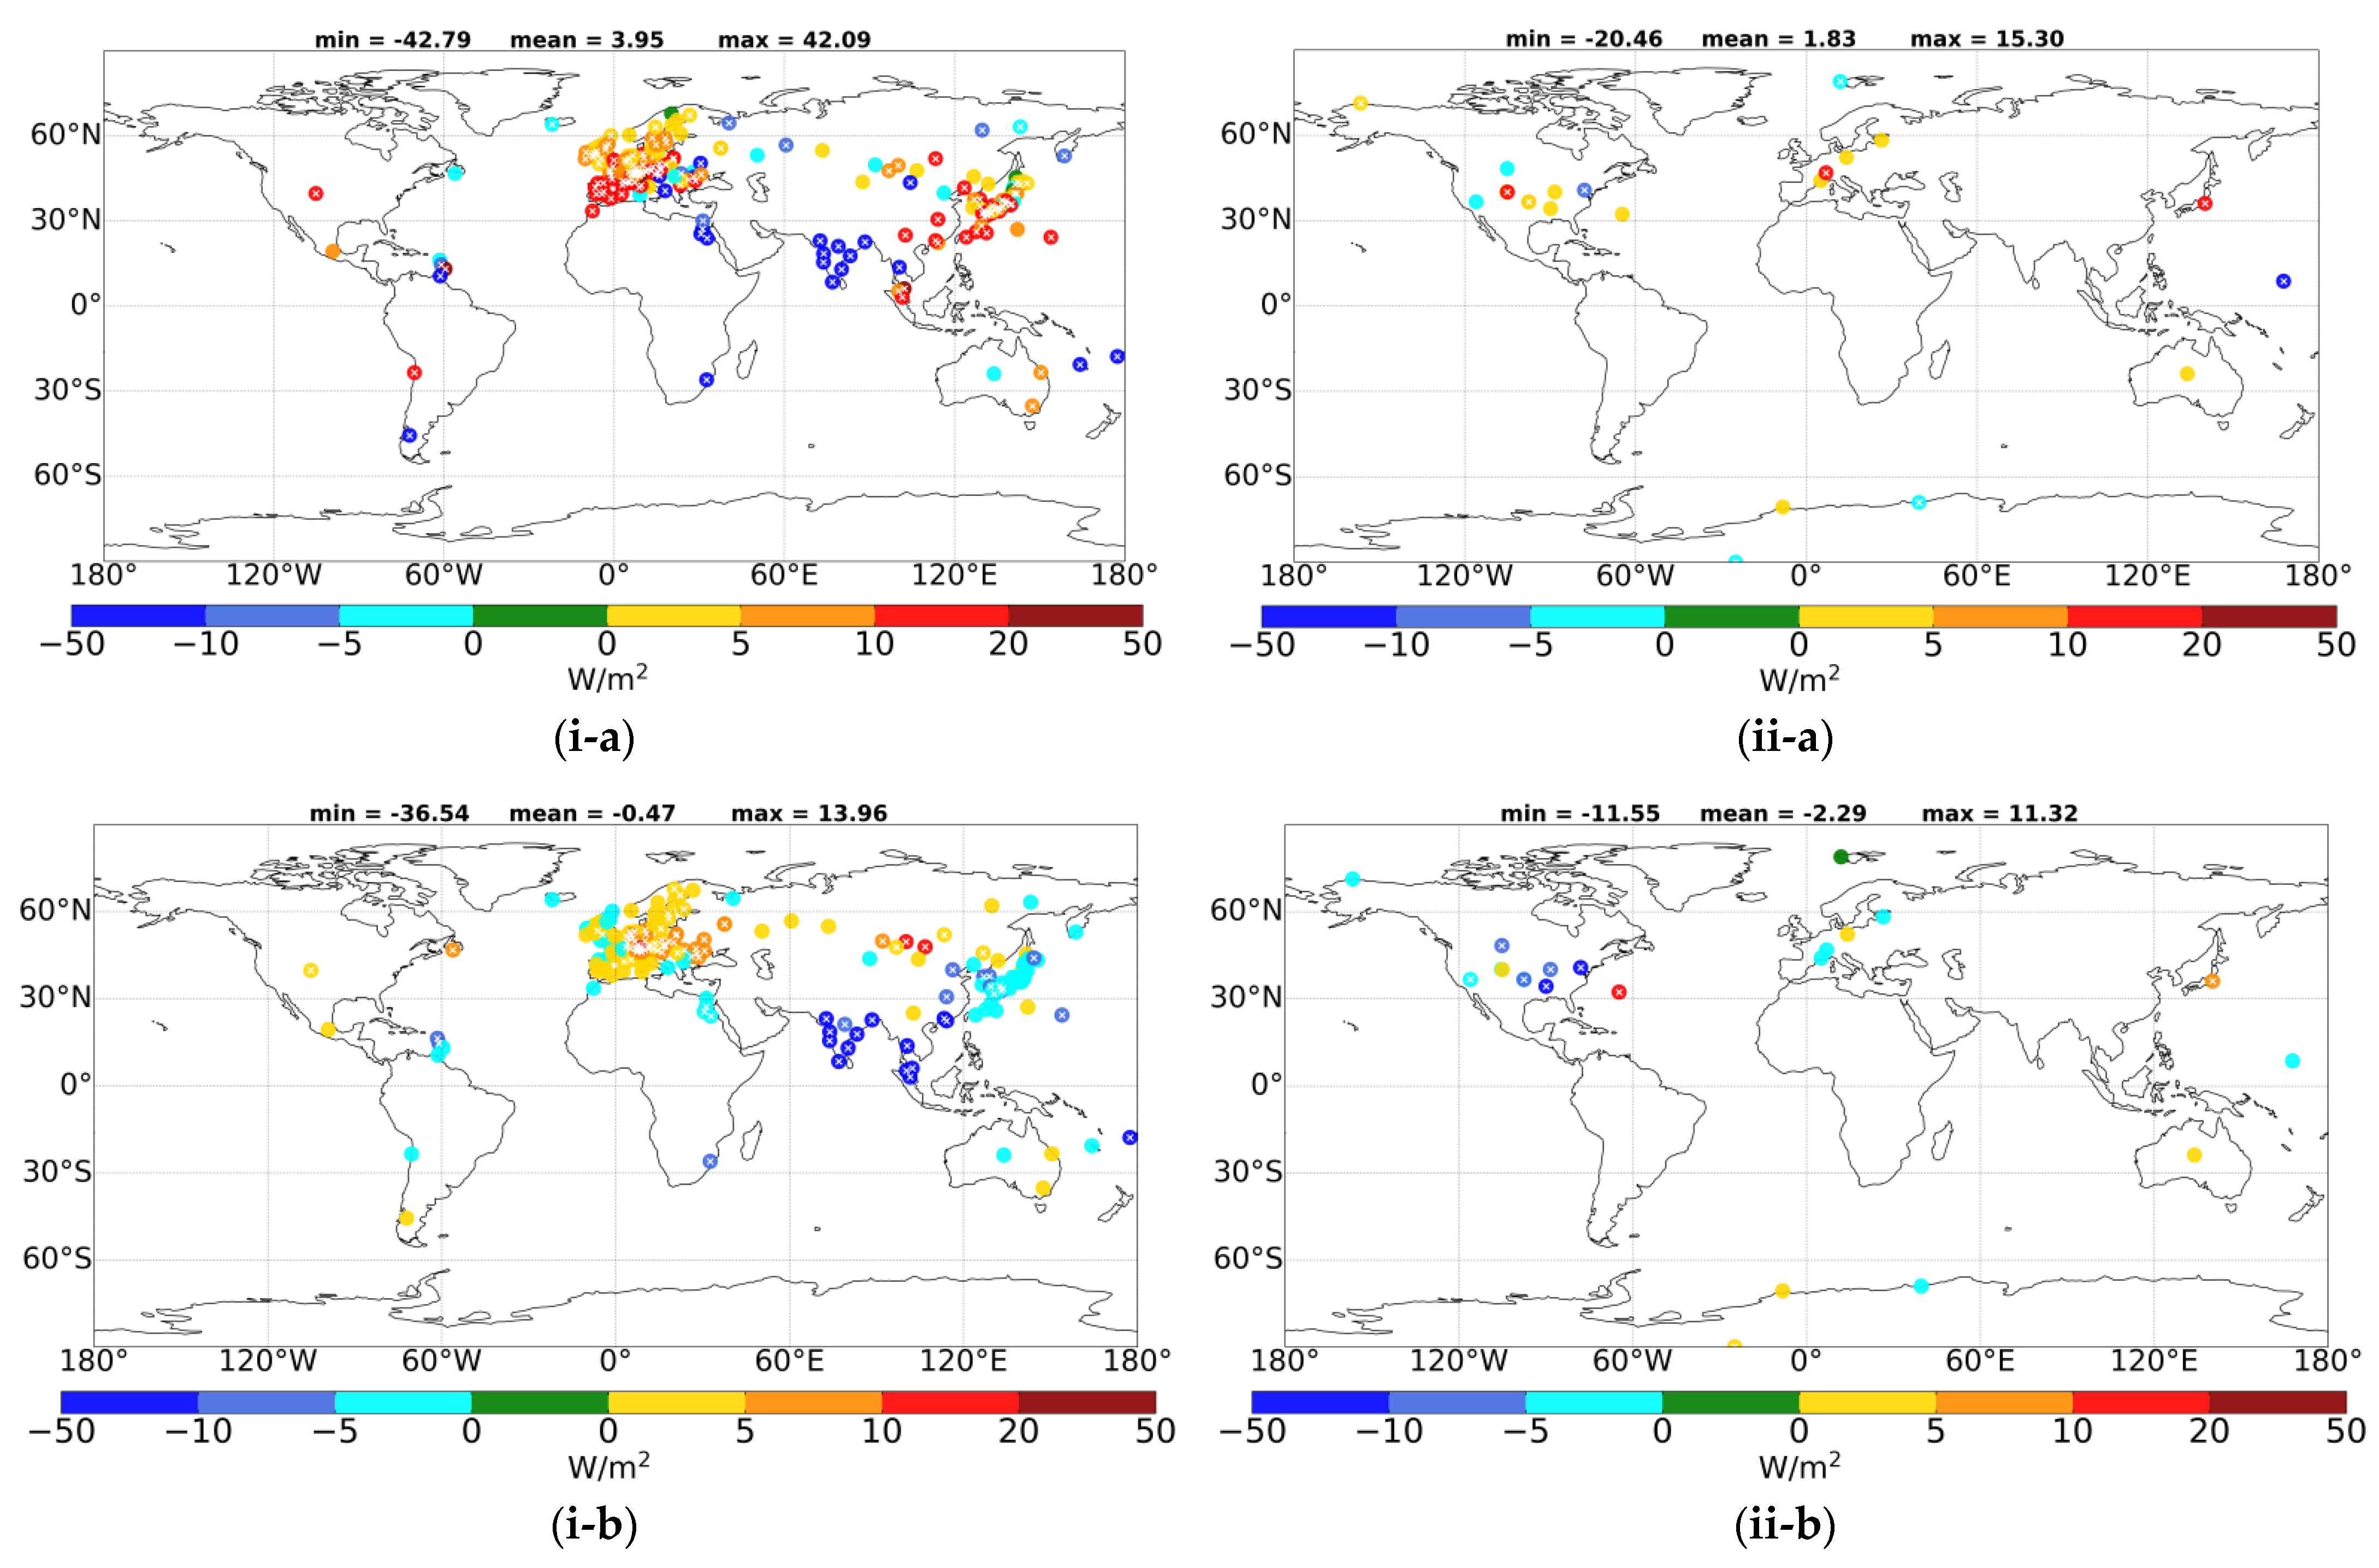
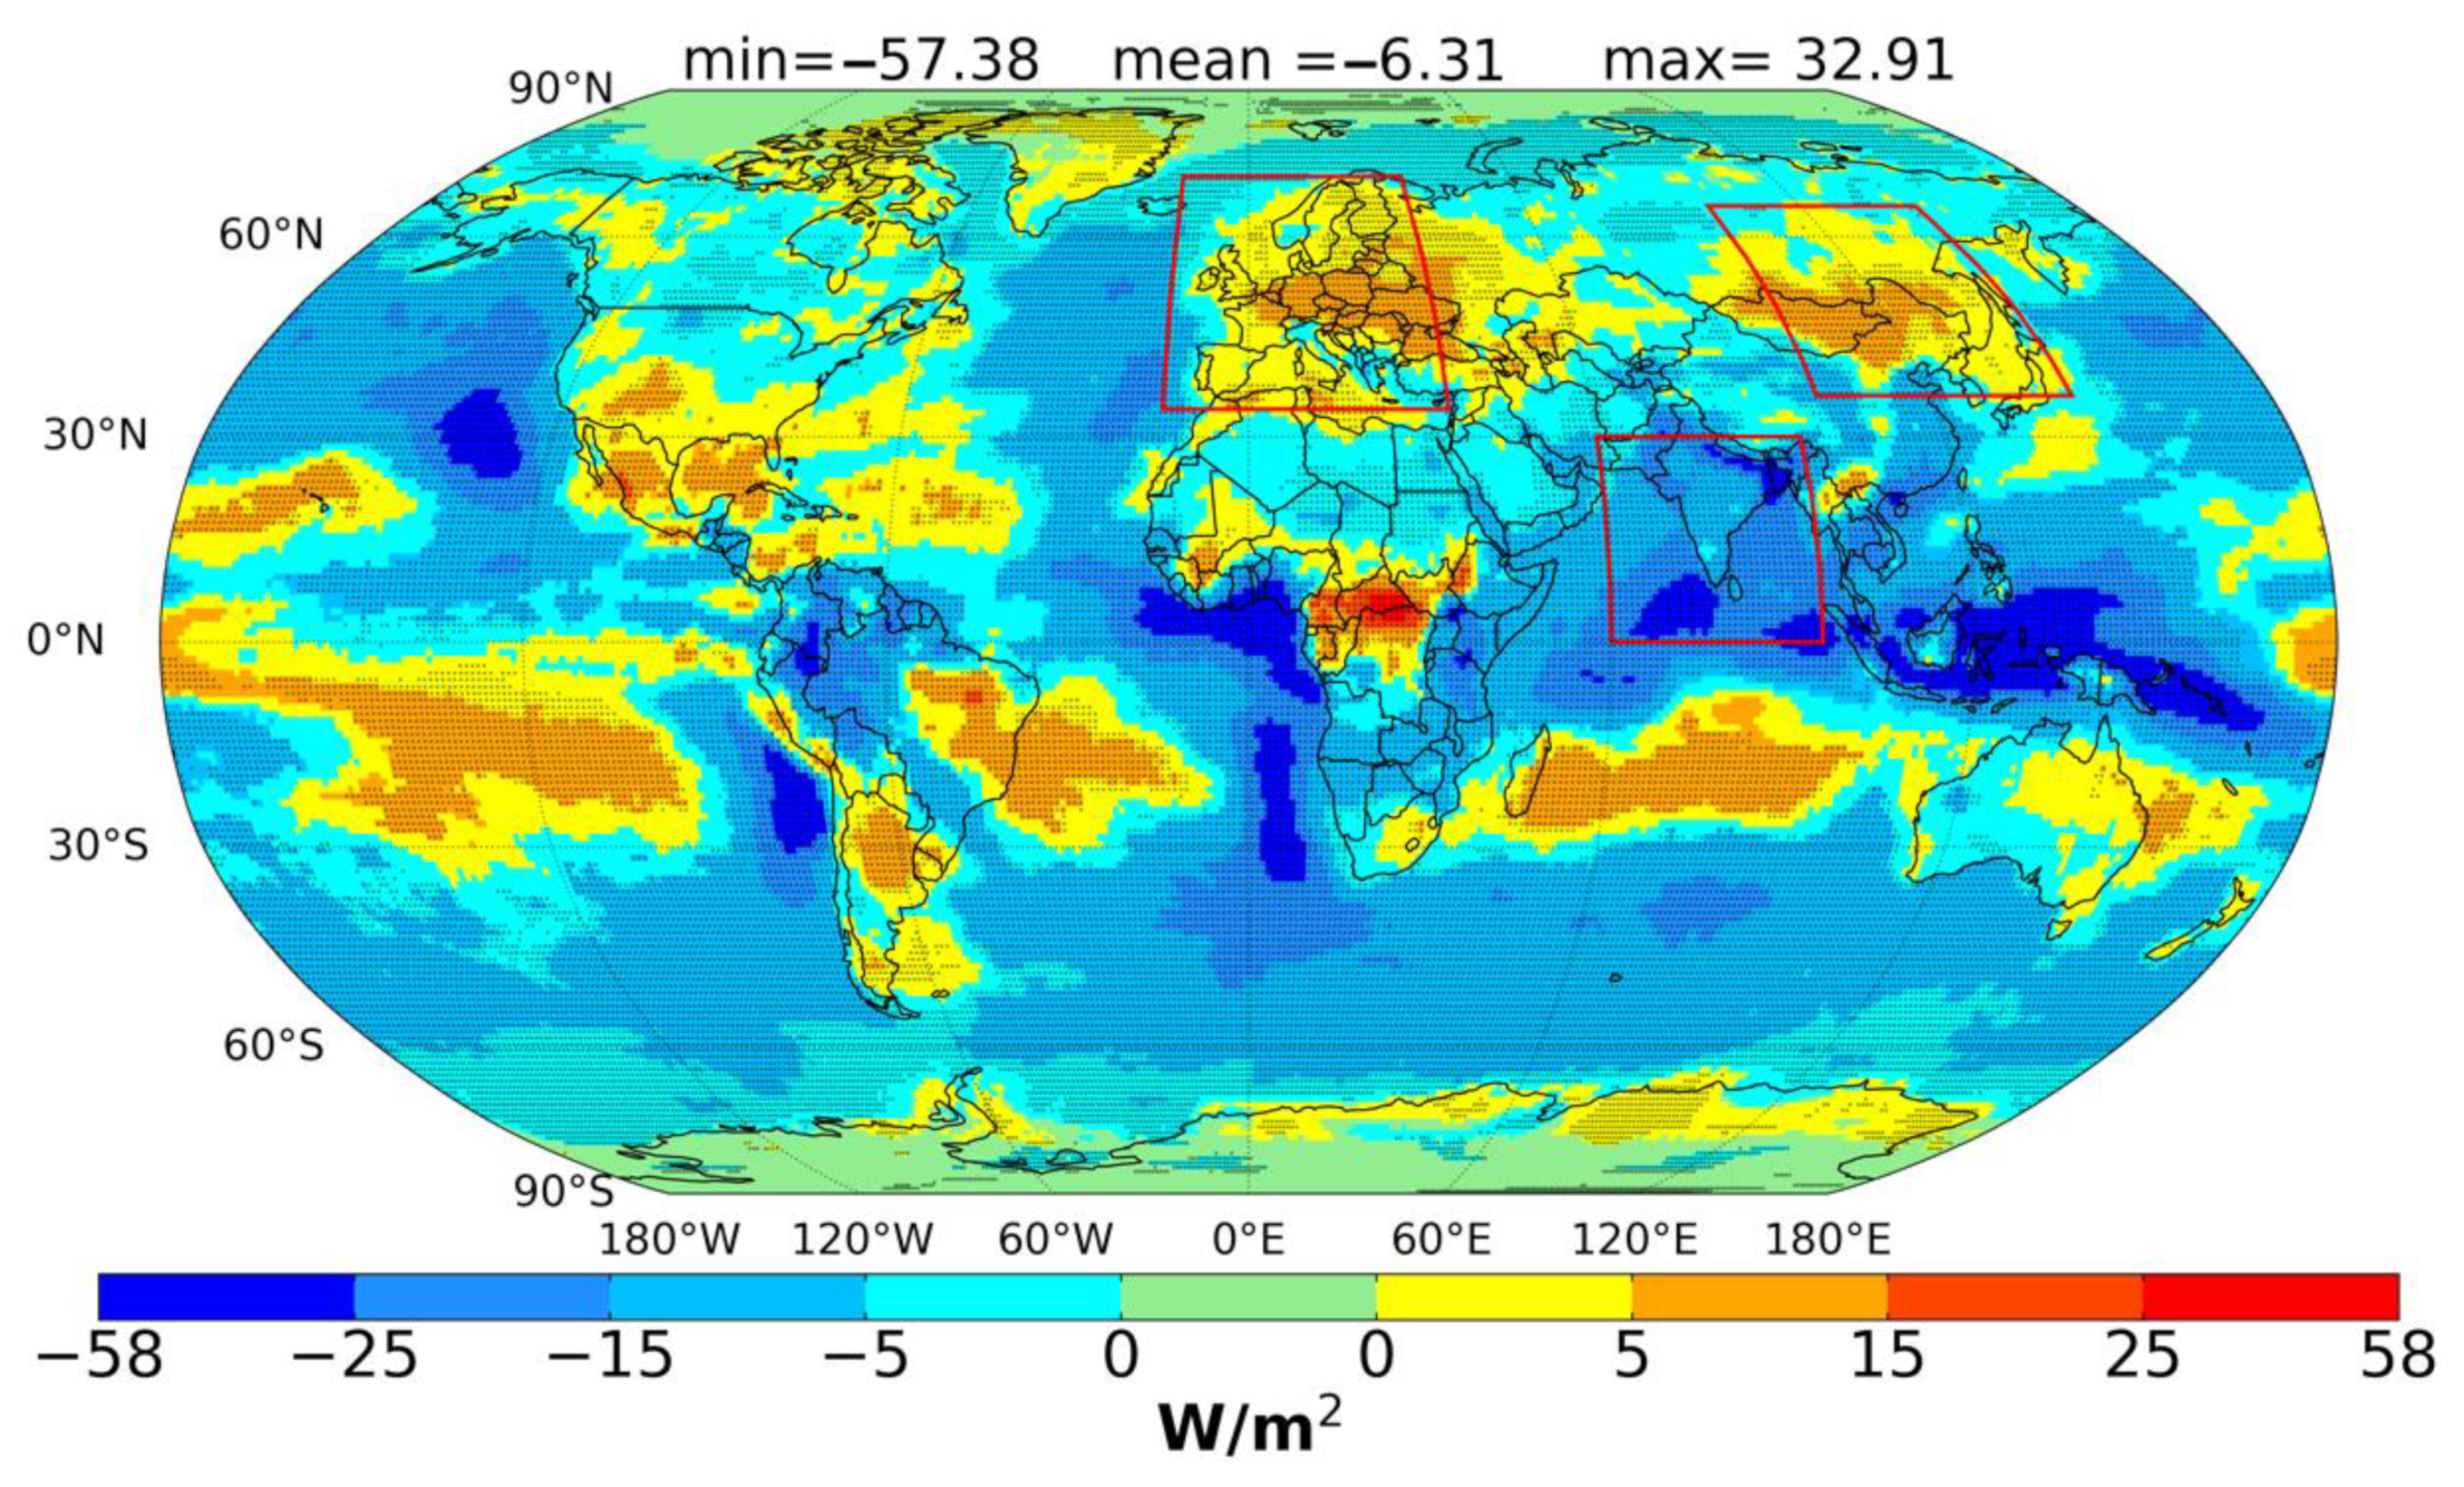
- The estimated MERRA-2 SSR changes (GDB) during the 40-year period 01/1980–12/2019, reveal a statistically significant brightening in Europe, Central Africa, Mongolia, Mexico, parts of the tropical oceans, Brazil and Argentina. In contrast, statistically significant dimming is found over the western Tropical Warm Pool, India, Southern East China, Amazonia, stratocumulus covered marine areas off the western coasts of Africa and America and some parts of oceans.
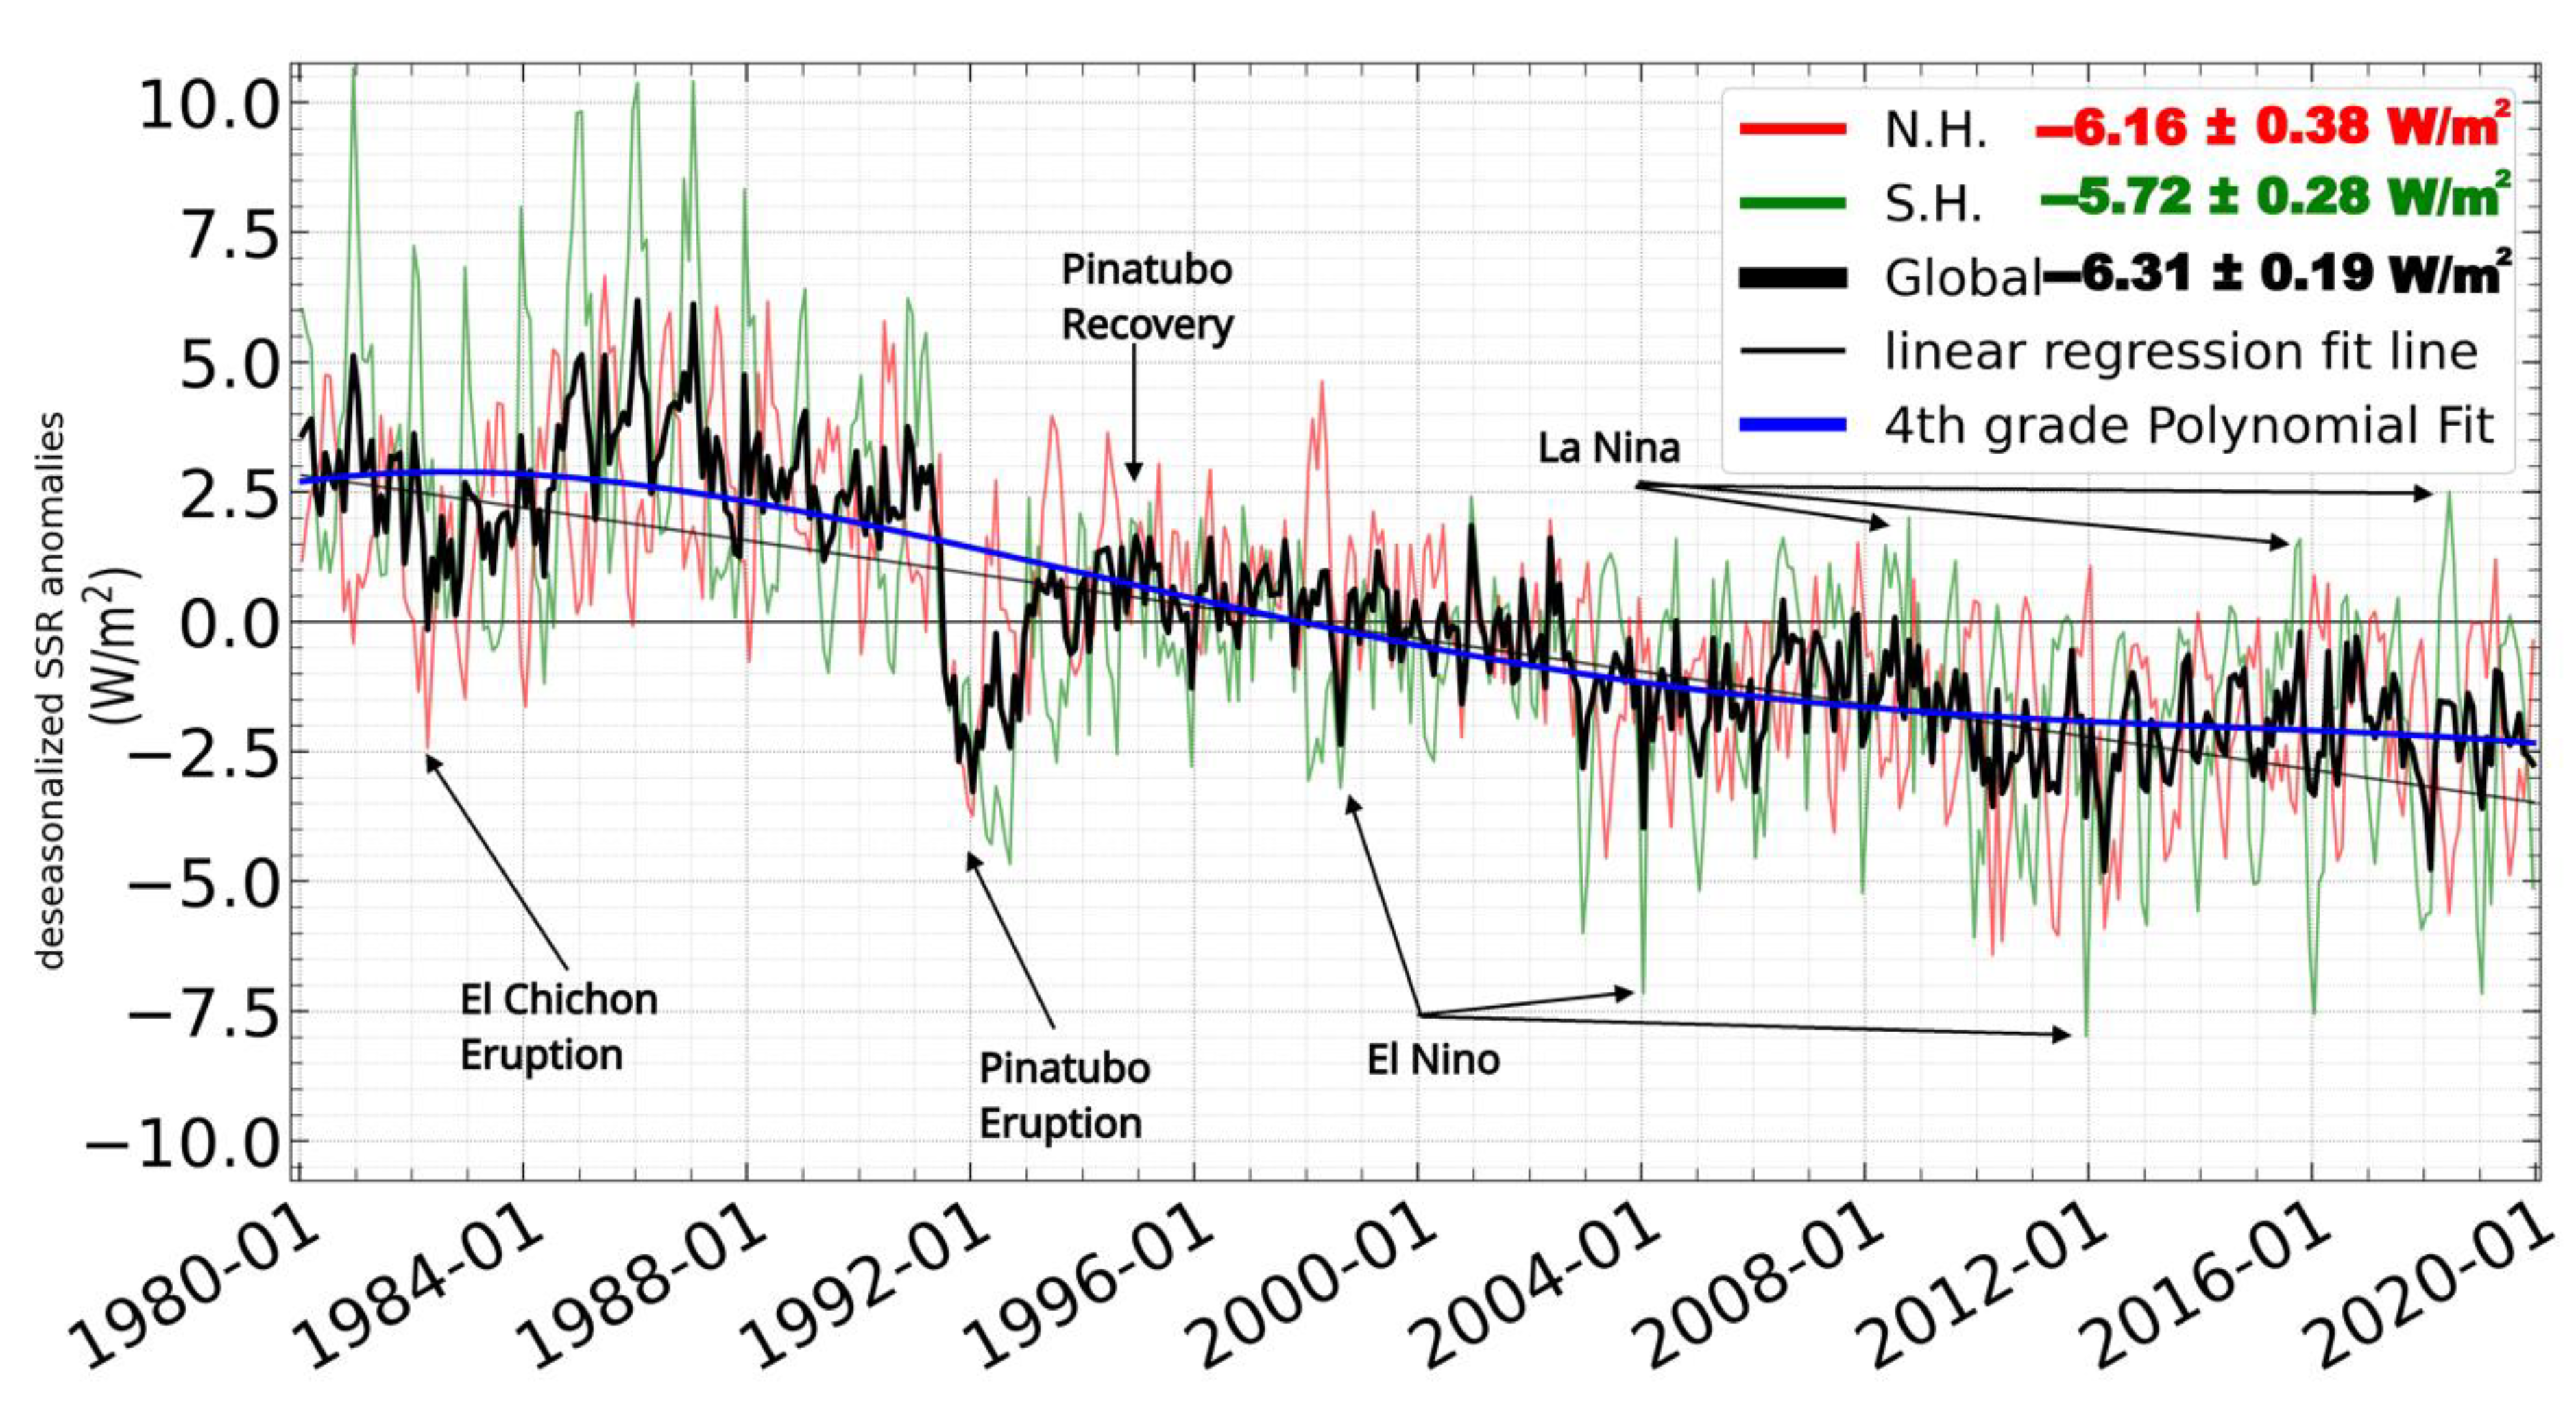
- Globally, MERRA-2 SSR shows a dimming (decreasing SSR) from 1980 to 2019, equal to −6.31 ± 0.19 W/m2 or −0.158 ± 0.005 W/m2/year, with 62.8% of the global MERRA-2 geographic cells showing dimming. This dimming is found over both land and ocean areas of the globe, but oceans underwent a stronger dimming (−7.81 ± 0.25 W/m2 or −0.195 ± 0.006 W/m2/year) than land (−2.58 ± 0.25 W/m2 or −0.065 ± 0.006 W/m2/year). Solar dimming also occurred on hemispherical basis, being stronger in the Southern than Northern Hemisphere (−5.72 ± 0.28 W/m2 versus −6.16 ± 0.38 W/m2 or −0.143 ± 0.007 W/m2/year versus −0.154 ± 0.01 W/m2/year, respectively).
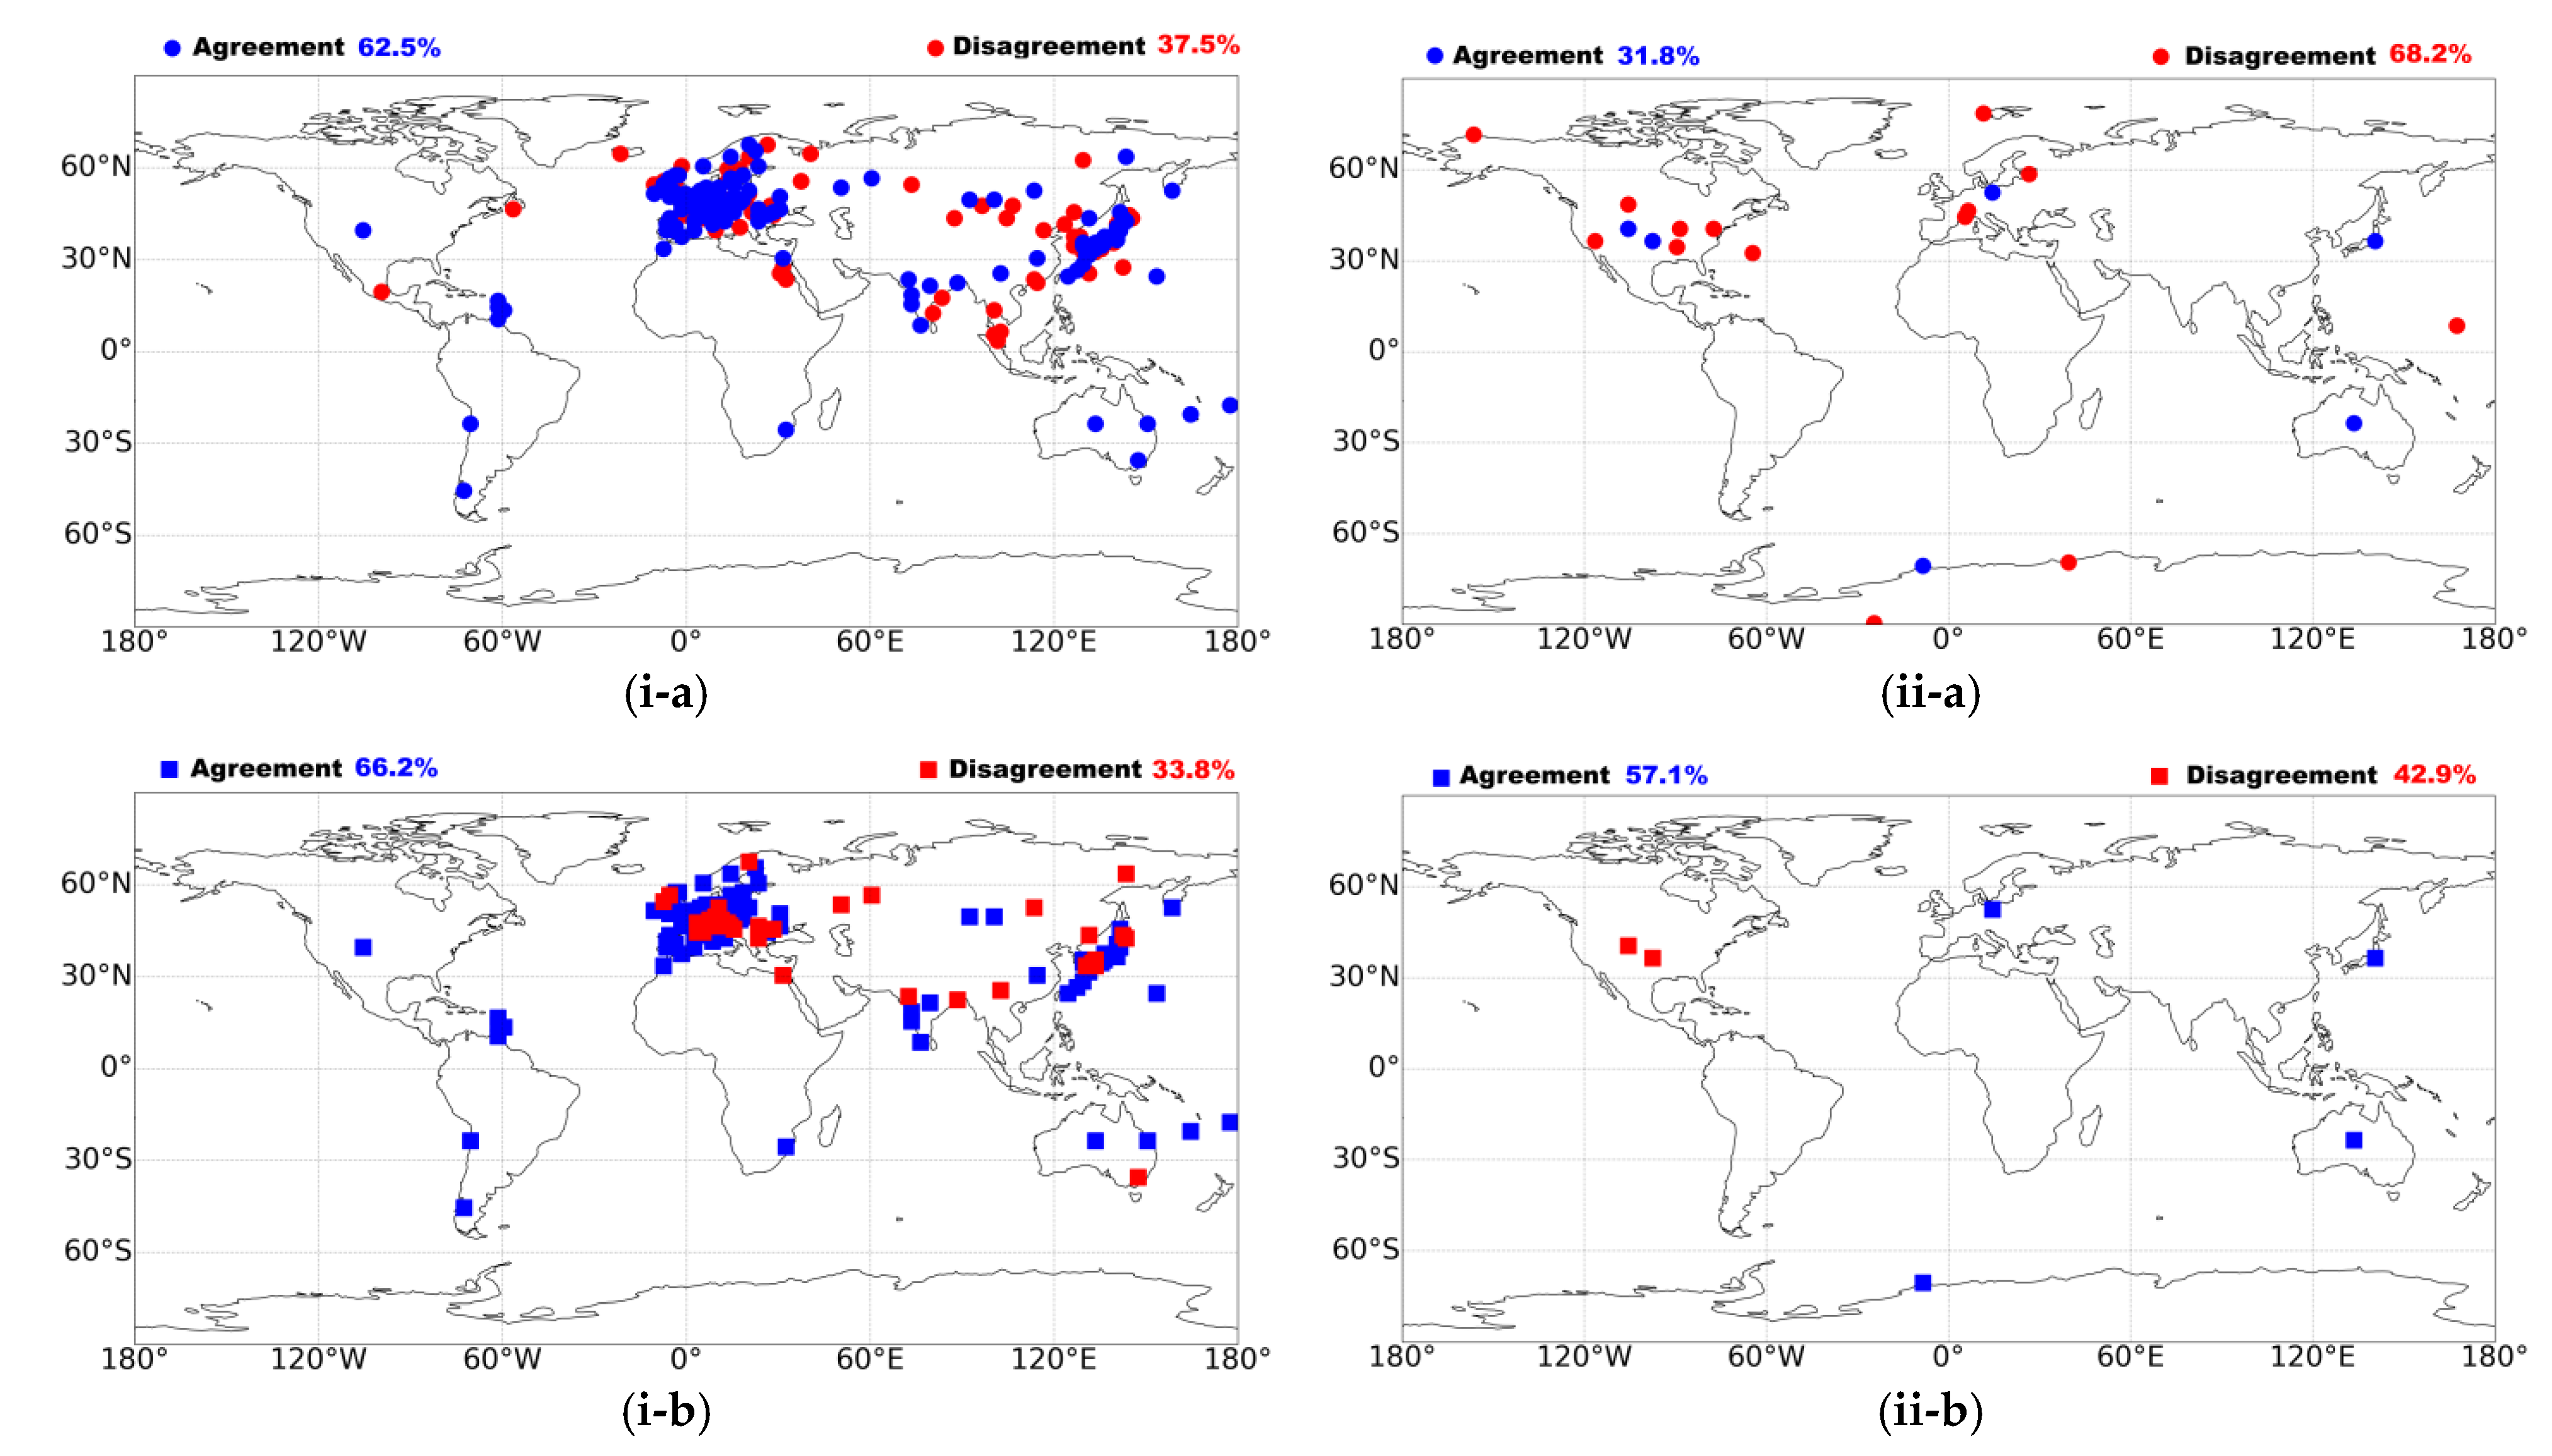
- Examining possible changes of the agreement between the signs of GDB of GEBA stations and MERRA-2 with time, an improvement is found since 1985, and especially in the post-2000 period, which can be related to the assimilation of state-of-the-art satellite data (MODIS, MISR) in MERRA-2 after 2000.
- During the reported brightening in the literature in the 1980s and 1990s, MERRA-2 reproduces brightening only over land, which is in line with the rapid global warming in the North Hemisphere driven by anthropogenic greenhouse gases. In the 2000s, when a recent hiatus has been recorded, MERRA-2 indicates a dimming both on a global basis (−1.19 ± 0.26 W/m2 or −0.119 ± 0.026 W/m2/year) and on a hemispherical one, which seems to be in line with the deceleration of global warming. In the 2010s, MERRA-2 suggests a weak global brightening (+0.44 ± 0.24 W/m2 or +0.044 ± 0.024 W/m2/year), which is in accord with the recurring accelerated warming of the Globe. Thus, overall, the MERRA-2 GDB phases, especially in the Northern Hemisphere, seem to be consistent with the accelerating and decelerating decadal phases of global warming since 2000.
Supplementary Materials
Author Contributions
Funding
Institutional Review Board Statement
Informed Consent Statement
Data Availability Statement
Acknowledgments
Conflicts of Interest
Abbreviations
| MERRA-2 | Modern-Era Retrospective Analysis for Research and Applications v.2 |
| GEBA | Global Energy Balance Archive |
| BSRN | Baseline Surface Radiation Network |
| SSR | Surface Solar Radiation |
| Δ(SSR) | change of SSR (equivalent to GDB) |
| GDB | Global Dimming and Brightening |
| R | Pearson’s correlation coefficient |
| BIAS | mean value of MERRA-2 minus mean value of stations |
| BIAS (%) | 100*BIAS/mean value of stations |
| RMSE | Root Mean Squared Error |
| RRMSE | Relative Root Mean Squared Error |
| M | mean value of MERRA-2 |
| Mi | monthly (for the -i month) value of MERRA-2 |
| G | mean value of stations |
| Gi | monthly (for the -i month) value of stations |
| n | number of monthly data |
| TOA | Top of the Atmosphere |
| OSR | Outgoing Solar Radiation |
| Δ(OSR) | Changes of OSR |
| NH | Northern Hemisphere |
| SH | Southern Hemisphere |
References
- Besharat, F.; Dehghan, A.A.; Faghih, A.R. Empirical Models for Estimating Global Solar Radiation: A Review and Case Study. Renew. Sustain. Energy Rev. 2013, 21, 798–821. [Google Scholar] [CrossRef]
- Wang, Y.; Yang, K.; Pan, Z.; Qin, J.; Chen, D.; Lin, C.; Chen, Y.; Tang, W.; Han, M.; Lu, N.; et al. Evaluation of Precipitable Water Vapor from Four Satellite Products and Four Reanalysis Datasets against GPS Measurements on the Southern Tibetan Plateau. J. Clim. 2017, 30, 5699–5713. [Google Scholar] [CrossRef]
- López, G.; Rosales, S.; Gueymard, C.; Marzo, A.; Alonso-Montesinos, J.; Polo, J.; Martin Chivelet, N.; Ferrada, P.; Batlles, F.; Vela, N.; et al. Effect of Cloudiness on Solar Radiation Forecasting. In Solar Energy Resource Management for Electricity Generation from Local Level to Global Scale; Nova Science Publishers: New York, NY, USA, 2019; pp. 1–11. [Google Scholar]
- Luo, H.; Ge, F.; Yang, K.; Zhu, S.; Peng, T.; Cai, W.; Liu, X.; Tang, W. Assessment of ECMWF Reanalysis Data in Complex Terrain: Can the CERA-20C and ERA-Interim Data Sets Replicate the Variation in Surface Air Temperatures over Sichuan, China? Int. J. Climatol. 2019, 39, 5619–5634. [Google Scholar] [CrossRef]
- Wild, M. Enlightening Global Dimming and Brightening. Bull. Am. Meteorol. Soc. 2012, 93, 27–37. [Google Scholar] [CrossRef]
- Yang, E.-G.; Kim, H.M. Evaluation of Short-Range Precipitation Reforecasts from East Asia Regional Reanalysis. J. Hydrometeorol. 2019, 20, 319–337. [Google Scholar] [CrossRef]
- Yeom, J.-M.; Deo, R.; Adamowski, J.; Park, S.; Lee, C.S. Spatial Mapping of Short-Term Solar Radiation Prediction Incorporating Geostationary Satellite Images Coupled with Deep Convolutional LSTM Networks for South Korea. Environ. Res. Lett. 2020, 15, 094025. [Google Scholar] [CrossRef]
- Philipona, R.; Behrens, K.; Ruckstuhl, C. How Declining Aerosols and Rising Greenhouse Gases Forced Rapid Warming in Europe since the 1980s. Geophys. Res. Lett. 2009, 36, L02806. [Google Scholar] [CrossRef] [Green Version]
- Wang, Y.; Wild, M. A New Look at Solar Dimming and Brightening in China. Geophys. Res. Lett. 2016, 43, 777–785. [Google Scholar] [CrossRef]
- Hatzianastassiou, N.; Matsoukas, C.; Fotiadi, A.; Pavlakis, K.G.; Drakakis, E.; Hatzidimitriou, D.; Vardavas, I. Global Distribution of Earth’s Surface Shortwave Radiation Budget. Atmos. Chem. Phys. 2005, 5, 2847–2867. [Google Scholar] [CrossRef] [Green Version]
- Wild, M. Decadal Changes in Radiative Fluxes at Land and Ocean Surfaces and Their Relevance for Global Warming. WIREsClim. Chang. 2016, 7, 91–107. [Google Scholar] [CrossRef]
- Hatzianastassiou, N.; Ioannidis, E.; Korras-Carraca, M.-B.; Gavrouzou, M.; Papadimas, C.D.; Matsoukas, C.; Benas, N.; Fotiadi, A.; Wild, M.; Vardavas, I. Global Dimming and Brightening Features during the First Decade of the 21st Century. Atmosphere 2020, 11, 308. [Google Scholar] [CrossRef] [Green Version]
- Greenwald, R.; Bergin, M.H.; Xu, J.; Cohan, D.; Hoogenboom, G.; Chameides, W.L. The Influence of Aerosols on Crop Production: A Study Using the CERES Crop Model. Agric. Syst. 2006, 89, 390–413. [Google Scholar] [CrossRef]
- Roderick, M.L.; Farquhar, G.D. Hazy, Cool and Well Fed? Nat. Clim. Chang. 2012, 2, 76–77. [Google Scholar] [CrossRef]
- Gupta, R.; Somanathan, E.; Dey, S. Global Warming and Local Air Pollution Have Reduced Wheat Yields in India. Clim. Chang. 2017, 140, 593–604. [Google Scholar] [CrossRef]
- Wild, M.; Roesch, A.; Ammann, C. Global Dimming and Brightening—Evidence and Agricultural Implications. CABI Rev. 2012, 2012, 1–7. [Google Scholar] [CrossRef]
- Liepert, B.; Romanou, A. Global Dimming and Brightening and the Water Cycle. Bull. Am. Meteorol. Soc. 2005, 86, 622–623. [Google Scholar]
- Wild, M.; Ohmura, A.; Makowski, K. Impact of Global Dimming and Brightening on Global Warming. Geophys. Res. Lett. 2007, 34, L04702. [Google Scholar] [CrossRef] [Green Version]
- Gilgen, H.; Wild, M.; Ohmura, A. Means and Trends of Shortwave Irradiance at the Surface Estimated from Global Energy Balance Archive Data. J. Clim. 1998, 11, 2042–2061. [Google Scholar] [CrossRef]
- Stanhill, G.; Cohen, S. Global Dimming: A Review of the Evidence for a Widespread and Significant Reduction in Global Radiation with Discussion of Its Probable Causes and Possible Agricultural Consequences. Agric. For. Meteorol. 2001, 107, 255–278. [Google Scholar] [CrossRef]
- Liepert, B.G. Observed Reductions of Surface Solar Radiation at Sites in the United States and Worldwide from 1961 to 1990. Geophys. Res. Lett. 2002, 29, 61-1–61-4. [Google Scholar] [CrossRef] [Green Version]
- Wild, M. Global Dimming and Brightening: A Review. J. Geophys. Res. Atmos. 2009, 114, D00D16. [Google Scholar] [CrossRef]
- Wild, M.; Gilgen, H.; Roesch, A.; Ohmura, A.; Long, C.N.; Dutton, E.G.; Forgan, B.; Kallis, A.; Russak, V.; Tsvetkov, A. From Dimming to Brightening: Decadal Changes in Solar Radiation at Earth’s Surface. Science 2005, 308, 847–850. [Google Scholar] [CrossRef] [Green Version]
- Wild, M.; Trüssel, B.; Ohmura, A.; Long, C.N.; König-Langlo, G.; Dutton, E.G.; Tsvetkov, A. Global Dimming and Brightening: An Update beyond 2000. J. Geophys. Res. Atmos. 2009, 114, D00D13. [Google Scholar] [CrossRef] [Green Version]
- Norris, J.R.; Wild, M. Trends in Aerosol Radiative Effects over China and Japan Inferred from Observed Cloud Cover, Solar “Dimming,” and Solar “Brightening”. J. Geophys. Res. Atmos. 2009, 114, D00D15. [Google Scholar] [CrossRef]
- Ohmura, A. Observed Decadal Variations in Surface Solar Radiation and Their Causes. J. Geophys. Res. Atmos. 2009, 114, D00D05. [Google Scholar] [CrossRef] [Green Version]
- Badarinath, K.V.S.; Sharma, A.R.; Kaskaoutis, D.G.; Kharol, S.K.; Kambezidis, H.D. Solar Dimming over the Tropical Urban Region of Hyderabad, India: Effect of Increased Cloudiness and Increased Anthropogenic Aerosols. J. Geophys. Res. Atmos. 2010, 115, D21208. [Google Scholar] [CrossRef] [Green Version]
- Kambezidis, H.D. The Solar Radiation Climate of Greece. Climate 2021, 9, 183. [Google Scholar] [CrossRef]
- Easterling, D.R.; Wehner, M.F. Is the Climate Warming or Cooling? Geophys. Res. Lett. 2009, 36, L08706. [Google Scholar] [CrossRef] [Green Version]
- Foster, G.; Rahmstorf, S. Global Temperature Evolution 1979–2010. Environ. Res. Lett. 2011, 6, 044022. [Google Scholar] [CrossRef]
- Kosaka, Y.; Xie, S.-P. Recent Global-Warming Hiatus Tied to Equatorial Pacific Surface Cooling. Nature 2013, 501, 403–407. [Google Scholar] [CrossRef] [Green Version]
- Haywood, J.M.; Bellouin, N.; Jones, A.; Boucher, O.; Wild, M.; Shine, K.P. The Roles of Aerosol, Water Vapor and Cloud in Future Global Dimming/Brightening. J. Geophys. Res. Atmos. 2011, 116, D20203. [Google Scholar] [CrossRef]
- Ruckstuhl, C.; Norris, J.R. How Do Aerosol Histories Affect Solar “Dimming” and “Brightening” over Europe?: IPCC-AR4 Models versus Observations. J. Geophys. Res. Atmos. 2009, 114, D00D04. [Google Scholar] [CrossRef] [Green Version]
- Hatzianastassiou, N.; Papadimas, C.D.; Matsoukas, C.; Pavlakis, K.; Fotiadi, A.; Wild, M.; Vardavas, I. Recent Regional Surface Solar Radiation Dimming and Brightening Patterns: Inter-Hemispherical Asymmetry and a Dimming in the Southern Hemisphere. Atmos. Sci. Lett. 2012, 13, 43–48. [Google Scholar] [CrossRef]
- Pinker, R.T.; Zhang, B.; Dutton, E.G. Do Satellites Detect Trends in Surface Solar Radiation? Science 2005, 308, 850–854. [Google Scholar] [CrossRef] [Green Version]
- Hinkelman, L.M.; Stackhouse, P.W., Jr.; Wielicki, B.A.; Zhang, T.; Wilson, S.R. Surface Insolation Trends from Satellite and Ground Measurements: Comparisons and Challenges. J. Geophys. Res. Atmos. 2009, 114, D00D20. [Google Scholar] [CrossRef] [Green Version]
- Zhang, X.; Liang, S.; Wild, M.; Jiang, B. Analysis of Surface Incident Shortwave Radiation from Four Satellite Products. Remote Sens. Environ. 2015, 165, 186–202. [Google Scholar] [CrossRef]
- Wang, Z.; Zhang, M.; Wang, L.; Qin, W. A Comprehensive Research on the Global All-Sky Surface Solar Radiation and Its Driving Factors during 1980–2019. Atmos. Res. 2022, 265, 105870. [Google Scholar] [CrossRef]
- Zhang, X.; Liang, S.; Wang, G.; Yao, Y.; Jiang, B.; Cheng, J. Evaluation of the Reanalysis Surface Incident Shortwave Radiation Products from NCEP, ECMWF, GSFC, and JMA Using Satellite and Surface Observations. Remote Sens. 2016, 8, 225. [Google Scholar] [CrossRef] [Green Version]
- Kistler, R.; Kalnay, E.; Collins, W.; Saha, S.; White, G.; Woollen, J.; Chelliah, M.; Ebisuzaki, W.; Kanamitsu, M.; Kousky, V.; et al. The NCEP–NCAR 50-Year Reanalysis: Monthly Means CD-ROM and Documentation. Bull. Am. Meteorol. Soc. 2001, 82, 247–268. [Google Scholar] [CrossRef]
- Hersbach, H.; Bell, B.; Berrisford, P.; Hirahara, S.; Horányi, A.; Muñoz-Sabater, J.; Nicolas, J.; Peubey, C.; Radu, R.; Schepers, D.; et al. The ERA5 Global Reanalysis. Q. J. R. Meteorol. Soc. 2020, 146, 1999–2049. [Google Scholar] [CrossRef]
- Kobayashi, S.; Ota, Y.; Harada, Y.; Ebita, A.; Moriya, M.; Onoda, H.; Onogi, K.; Kamahori, H.; Kobayashi, C.; Endo, H.; et al. The JRA-55 reanalysis: General specifications and basic characteristics. J. Meteorol. Soc. Jpn. 2015, 93, 5–48. [Google Scholar] [CrossRef]
- Slivinski, L.C.; Compo, G.P.; Whitaker, J.S.; Sardeshmukh, P.D.; Giese, B.S.; McColl, C.; Allan, R.; Yin, X.; Vose, R.; Titchner, H.; et al. Towards a More Reliable Historical Reanalysis: Improvements for Version 3 of the Twentieth Century Reanalysis System. Q. J. R. Meteorol. Soc. 2019, 145, 2876–2908. [Google Scholar] [CrossRef] [Green Version]
- Hinkelman, L.M. The Global Radiative Energy Budget in MERRA and MERRA-2: Evaluation with Respect to CERES EBAF Data. J. Clim. 2019, 32, 1973–1994. [Google Scholar] [CrossRef]
- Chakraborty, T.; Lee, X. Large Differences in Diffuse Solar Radiation among Current-Generation Reanalysis and Satellite-Derived Products. J. Clim. 2021, 34, 6635–6650. [Google Scholar] [CrossRef]
- Jia, B.; Xie, Z.; Dai, A.; Shi, C.; Chen, F. Evaluation of Satellite and Reanalysis Products of Downward Surface Solar Radiation over East Asia: Spatial and Seasonal Variations. J. Geophys. Res. Atmos. 2013, 118, 3431–3446. [Google Scholar] [CrossRef]
- Zhang, X.; Lu, N.; Jiang, H.; Yao, L. Evaluation of Reanalysis Surface Incident Solar Radiation Data in China. Sci. Rep. 2020, 10, 3494. [Google Scholar] [CrossRef] [Green Version]
- Zhao, L.; Lee, X.; Liu, S. Correcting Surface Solar Radiation of Two Data Assimilation Systems against FLUXNET Observations in North America. J. Geophys. Res. Atmos. 2013, 118, 9552–9564. [Google Scholar] [CrossRef]
- Boilley, A.; Wald, L. Comparison between Meteorological Re-Analyses from ERA-Interim and MERRA and Measurements of Daily Solar Irradiation at Surface. Renew. Energy 2015, 75, 135–143. [Google Scholar] [CrossRef]
- Trolliet, M.; Walawender, J.P.; Bourlès, B.; Boilley, A.; Trentmann, J.; Blanc, P.; Lefèvre, M.; Wald, L. Downwelling Surface Solar Irradiance in the Tropical Atlantic Ocean: A Comparison of Re-Analyses and Satellite-Derived Data Sets to PIRATA Measurements. Ocean Sci. 2018, 14, 1021–1056. [Google Scholar] [CrossRef] [Green Version]
- Sianturi, Y.; Marjuki; Sartika, K. Evaluation of ERA5 and MERRA2 Reanalyses to Estimate Solar Irradiance Using Ground Observations over Indonesia Region. AIP Conf. Proc. 2020, 2223, 020002. [Google Scholar] [CrossRef]
- Tahir, Z.U.R.; Azhar, M.; Mumtaz, M.; Asim, M.; Moeenuddin, G.; Sharif, H.; Hassan, S. Evaluation of the Reanalysis Surface Solar Radiation from NCEP, ECMWF, NASA, and JMA Using Surface Observations for Balochistan, Pakistan. J. Renew. Sustain. Energy 2020, 12, 023703. [Google Scholar] [CrossRef]
- Urraca, R.; Huld, T.; Gracia-Amillo, A.; Martinez-de-Pison, F.J.; Kaspar, F.; Sanz-Garcia, A. Evaluation of Global Horizontal Irradiance Estimates from ERA5 and COSMO-REA6 Reanalyses Using Ground and Satellite-Based Data. Sol. Energy 2018, 164, 339–354. [Google Scholar] [CrossRef]
- Babar, B.; Graversen, R.; Boström, T. Solar Radiation Estimation at High Latitudes: Assessment of the CMSAF Databases, ASR and ERA5. Sol. Energy 2019, 182, 397–411. [Google Scholar] [CrossRef]
- Fu, L.; Bian, L.; Xiao, C. Evaluation of the Applicability of Four Reanalyzed Radiometric Data in the East Antarctic Plateau. Chin. J. Polar Res. 2015, 27, 56–64. [Google Scholar] [CrossRef]
- Yue, K. Influence of Aerosol Optical Depth on Solar Radiation in Yangtze River Delta; Nanjing University of Information Science and Technology: Nanjing, China, 2016. [Google Scholar]
- Slater, A.G. Surface Solar Radiation in North America. J. Hydrometeorol. 2016, 17, 401–420. [Google Scholar] [CrossRef]
- Doddy Clarke, E.; Griffin, S.; McDermott, F.; Monteiro Correia, J.; Sweeney, C. Which Reanalysis Dataset Should We Use for Renewable Energy Analysis in Ireland? Atmosphere 2021, 12, 624. [Google Scholar] [CrossRef]
- Mabasa, B.; Lysko, M.D.; Moloi, S.J. Validating Hourly Satellite Based and Reanalysis Based Global Horizontal Irradiance Datasets over South Africa. Geomatics 2021, 1, 429–449. [Google Scholar] [CrossRef]
- Stettz, S.; Zaitchik, B.F.; Ademe, D.; Musie, S.; Simane, B. Estimating Variability in Downwelling Surface Shortwave Radiation in a Tropical Highland Environment. PLoS ONE 2019, 14, e0211220. [Google Scholar] [CrossRef] [Green Version]
- Troy, T.J.; Wood, E.F. Comparison and Evaluation of Gridded Radiation Products across Northern Eurasia. Environ. Res. Lett. 2009, 4, 045008. [Google Scholar] [CrossRef]
- Wild, M.; Schmucki, E. Assessment of Global Dimming and Brightening in IPCC-AR4/CMIP3 Models and ERA40. Clim. Dyn. 2011, 37, 1671–1688. [Google Scholar] [CrossRef] [Green Version]
- Yang, D.; Bright, J.M. Worldwide Validation of 8 Satellite-Derived and Reanalysis Solar Radiation Products: A Preliminary Evaluation and Overall Metrics for Hourly Data over 27 Years. Spec. Issue Grid Integr. 2020, 210, 3–19. [Google Scholar] [CrossRef]
- Peng, X.; She, J.; Zhang, S.; Tan, J.; Li, Y. Evaluation of Multi-Reanalysis Solar Radiation Products Using Global Surface Observations. Atmosphere 2019, 10, 42. [Google Scholar] [CrossRef] [Green Version]
- Feng, F.; Wang, K. Determining Factors of Monthly to Decadal Variability in Surface Solar Radiation in China: Evidences From Current Reanalyses. J. Geophys. Res. Atmos. 2019, 124, 9161–9182. [Google Scholar] [CrossRef] [Green Version]
- Jiang, H.; Yang, Y.; Wang, H.; Bai, Y.; Bai, Y. Surface Diffuse Solar Radiation Determined by Reanalysis and Satellite over East Asia: Evaluation and Comparison. Remote Sens. 2020, 12, 1387. [Google Scholar] [CrossRef]
- Wang, K.; Ma, Q.; Li, Z.; Wang, J. Decadal Variability of Surface Incident Solar Radiation over China: Observations, Satellite Retrievals, and Reanalyses. J. Geophys. Res. Atmos. 2015, 120, 6500–6514. [Google Scholar] [CrossRef]
- Zhou, Z.; Lin, A.; Wang, L.; Qin, W.; Zhong, Y.; He, L. Trends in Downward Surface Shortwave Radiation from Multi-Source Data over China during 1984–2015. Int. J. Climatol. 2020, 40, 3467–3485. [Google Scholar] [CrossRef]
- You, Q.; Sanchez-Lorenzo, A.; Wild, M.; Folini, D.; Fraedrich, K.; Ren, G.; Kang, S. Decadal Variation of Surface Solar Radiation in the Tibetan Plateau from Observations, Reanalysis and Model Simulations. Clim. Dyn. 2013, 40, 2073–2086. [Google Scholar] [CrossRef]
- Perdigão, J.C.; Salgado, R.; Costa, M.J.; Dasari, H.P.; Sanchez-Lorenzo, A. Variability and Trends of Downward Surface Global Solar Radiation over the Iberian Peninsula Based on ERA-40 Reanalysis. Int. J. Climatol. 2016, 36, 3917–3933. [Google Scholar] [CrossRef] [Green Version]
- Galanaki, E.; Emmanouil, G.; Lagouvardos, K.; Kotroni, V. Long-Term Patterns and Trends of Shortwave Global Irradiance over the Euro-Mediterranean Region. Atmosphere 2021, 12, 1431. [Google Scholar] [CrossRef]
- Zuluaga, C.F.; Avila-Diaz, A.; Justino, F.B.; Wilson, A.B. Climatology and Trends of Downward Shortwave Radiation over Brazil. Atmos. Res. 2021, 250, 105347. [Google Scholar] [CrossRef]
- Wohland, J.; Brayshaw, D.; Bloomfield, H.; Wild, M. European Multidecadal Solar Variability Badly Captured in All Centennial Reanalyses except CERA20C. Environ. Res. Lett. 2020, 15, 104021. [Google Scholar] [CrossRef]
- Jiao, B.; Li, Q.; Sun, W.; Martin, W. Uncertainties in the Global and Continental Surface Solar Radiation Variations: Inter-Comparison of in-Situ Observations, Reanalyses, and Model Simulations. Clim. Dyn. 2022, 59, 2499–2516. [Google Scholar] [CrossRef]
- Randles, C.A.; Da Silva, A.M.; Buchard, V.; Colarco, P.R.; Darmenov, A.; Govindaraju, R.; Smirnov, A.; Holben, B.; Ferrare, R.; Hair, J.; et al. The MERRA-2 Aerosol Reanalysis, 1980—Onward, Part I: System Description and Data Assimilation Evaluation. J. Clim. 2017, 30, 6823–6850. [Google Scholar] [CrossRef]
- The Second Modern-Era Retrospective Analysis for Research and Applications (MERRA-2). Available online: http://disc.sci.gsfc.nasa.gov/mdisc/ (accessed on 30 August 2022).
- Gelaro, R.; McCarty, W.; Suárez, M.J.; Todling, R.; Molod, A.; Takacs, L.; Randles, C.A.; Darmenov, A.; Bosilovich, M.G.; Reichle, R.; et al. The Modern-Era Retrospective Analysis for Research and Applications, Version 2 (MERRA-2). J. Clim. 2017, 30, 5419–5454. [Google Scholar] [CrossRef]
- Chou, M.D.; Suarez, M.J. A Solar Radiation Parameterization (CLIRAD-SW) for Atmospheric Studies; NASA Technical Memorandum NASA/TM-1999-104606, 40; NASA Goddard Space Flight Center: Greenbelt, MD, USA, 1999.
- Joseph, J.H.; Wiscombe, W.J.; Weinman, J.A. The Delta-Eddington Approximation for Radiative Flux Transfer. J. Atmos. Sci. 1976, 33, 2452–2459. [Google Scholar] [CrossRef]
- Loeb, N.G.; Doelling, D.R.; Wang, H.; Su, W.; Nguyen, C.; Corbett, J.G.; Liang, L.; Mitrescu, C.; Rose, F.G.; Kato, S. Clouds and the Earth’s Radiant Energy System (CERES) Energy Balanced and Filled (EBAF) Top-of-Atmosphere (TOA) Edition-4.0 Data Product. J. Clim. 2018, 31, 895–918. [Google Scholar] [CrossRef]
- Loeb, N.G.; Priestley, K.J.; Kratz, D.P.; Geier, E.B.; Green, R.N.; Wielicki, B.A.; Hinton, P.O.; Nolan, S.K. Determination of Unfiltered Radiances from the Clouds and the Earth’s Radiant Energy System Instrument. J. Appl. Meteorol. 2001, 40, 822–835. [Google Scholar] [CrossRef]
- Su, W.; Corbett, J.; Eitzen, Z.; Liang, L. Next-Generation Angular Distribution Models for Top-of-Atmosphere Radiative Flux Calculation from CERES Instruments: Methodology. Atmos. Meas. Tech. 2015, 8, 611–632. [Google Scholar] [CrossRef] [Green Version]
- Doelling, D.R.; Loeb, N.G.; Keyes, D.F.; Nordeen, M.L.; Morstad, D.; Nguyen, C.; Wielicki, B.A.; Young, D.F.; Sun, M. Geostationary Enhanced Temporal Interpolation for CERES Flux Products. J. Atmos. Ocean. Technol. 2013, 30, 1072–1090. [Google Scholar] [CrossRef]
- CERES Data Products. Available online: https://ceres.larc.nasa.gov/Data (accessed on 30 August 2022).
- Michalsky, J.; Dutton, E.; Rubes, M.; Nelson, D.; Stoffel, T.; Wesely, M.; Splitt, M.; Deluisi, J. Optimal Measurement of Surface Shortwave Irradiance Using Current Instrumentation. J. Atmos. Ocean Technol. 1999, 16, 55–69. [Google Scholar] [CrossRef]
- Wild, M.; Folini, D.; Schär, C.; Loeb, N.; Dutton, E.G.; König-Langlo, G. The Global Energy Balance from a Surface Perspective. Clim. Dyn. 2013, 40, 3107–3134. [Google Scholar] [CrossRef]
- Global Energy Balance Archive. Available online: https://geba.ethz.ch/ (accessed on 30 August 2022).
- Wild, M.; Folini, D.; Schär, C.; Loeb, N.; Dutton, E.G.; König-Langlo, G. Basic Measurements of Radiation from the Baseline Surface Radiation Network (BSRN) in the Years 1992 to 2012, Reference List of 6378 Datasets. 2013. [Google Scholar]
- World Radiation Monitoring Center (WRMC) Baseline Surface Radiation Network (BSRN). Available online: https://bsrn.awi.de/data/ (accessed on 30 August 2022).
- Ohring, G.; Romanov, P.; Ferraro, R.; Heidinger, A.; Laszlo, I.; Zou, C.-Z.; Foster, M. Satellite Observations of North American Climate Change. In Climate Change in North America; Ohring, G., Ed.; Springer International Publishing: Cham, Switzerland, 2014; pp. 95–165. ISBN 978-3-319-03768-4. [Google Scholar]
- Stocker, T.F.; Qin, D.; Plattner, G.K.; Tignor, M.M.; Allen, S.K.; Boschung, J.; Nauels, A.; Xia, Y.; Bex, V.; Midgley, P.M. Climate Change 2013: The Physical Science Basis. In Contribution of Working Group I to the Fifth Assessment Report of the Intergovernmental Panel on Climate Change; Cambridge University Press: Cambridge, UK; New York, NY, USA, 2014. [Google Scholar]
- Theil, H. A Rank-Invariant Method of Linear and Polynomial Regression Analysis. In Henri Theil’s Contributions to Economics and Econometrics: Econometric Theory and Methodology; Raj, B., Koerts, J., Eds.; Springer: Dordrecht, The Netherlands, 1992; pp. 345–381. ISBN 978-94-011-2546-8. [Google Scholar]
- Sen, P.K. Estimates of the Regression Coefficient Based on Kendall’s Tau. J. Am. Stat. Assoc. 1968, 63, 1379–1389. [Google Scholar] [CrossRef]
- Mann, H.B. Nonparametric Tests against Trend. Econometrica 1945, 13, 245–259. [Google Scholar] [CrossRef]
- Kendall, M.G. Rank Correlation Methods, 4th ed.; Charles Griffin: London, UK, 1975. [Google Scholar]
- Wang, Y.; Trentmann, J.; Yuan, W.; Wild, M. Validation of CM SAF CLARA-A2 and SARAH-E Surface Solar Radiation Datasets over China. Remote Sens. 2018, 10, 1977. [Google Scholar] [CrossRef] [Green Version]
- Baker, M.B.; Peter, T. Small-Scale Cloud Processes and Climate. Nature 2008, 451, 299–300. [Google Scholar] [CrossRef] [Green Version]
- Stensrud, D.J. Parameterization Schemes: Keys to Understanding Numerical Weather Prediction Models; Cambridge University Press: Cambridge, UK, 2007. [Google Scholar]
- Cullather, R.I.; Bosilovich, M.G. The Energy Budget of the Polar Atmosphere in MERRA. J. Clim. 2012, 25, 5–24. [Google Scholar] [CrossRef] [Green Version]
- Xia, X.A.; Wang, P.C.; Chen, H.B.; Liang, F. Analysis of Downwelling Surface Solar Radiation in China from National Centers for Environmental Prediction Reanalysis, Satellite Estimates, and Surface Observations. J. Geophys. Res. Atmos. 2006, 111, D09103. [Google Scholar] [CrossRef] [Green Version]
- Ma, Q.; Wang, K.; Wild, M. Impact of Geolocations of Validation Data on the Evaluation of Surface Incident Shortwave Radiation from Earth System Models. J. Geophys. Res. Atmos. 2015, 120, 6825–6844. [Google Scholar] [CrossRef] [Green Version]
- Korras-Carraca, M.-B.; Gkikas, A.; Matsoukas, C.; Hatzianastassiou, N. Global Clear-Sky Aerosol Speciated Direct Radiative Effects over 40 Years (1980–2019). Atmosphere 2021, 12, 1254. [Google Scholar] [CrossRef]
- Ramanathan, V.; Ramana, M.V.; Roberts, G.; Kim, D.; Corrigan, C.; Chung, C.; Winker, D. Warming Trends in Asia Amplified by Brown Cloud Solar Absorption. Nature 2007, 448, 575–578. [Google Scholar] [CrossRef]
- Ruckstuhl, C.; Philipona, R.; Behrens, K.; Collaud Coen, M.; Dürr, B.; Heimo, A.; Mätzler, C.; Nyeki, S.; Ohmura, A.; Vuilleumier, L.; et al. Aerosol and Cloud Effects on Solar Brightening and the Recent Rapid Warming. Geophys. Res. Lett. 2008, 35, L12708. [Google Scholar] [CrossRef]
- NOAA National Centers for Environmental Information. Climate at a Glance: Global Mapping 2022; NOAA National Centers for Environmental Information: Washington, DC, USA, 2022.
- Sanchez-Lorenzo, A.; Wild, M.; Brunetti, M.; Guijarro, J.A.; Hakuba, M.Z.; Calbó, J.; Mystakidis, S.; Bartok, B. Reassessment and Update of Long-Term Trends in Downward Surface Shortwave Radiation over Europe (1939–2012). J. Geophys. Res. Atmos. 2015, 120, 9555–9569. [Google Scholar] [CrossRef] [Green Version]
- Padma Kumari, B.; Goswami, B.N. Seminal Role of Clouds on Solar Dimming over the Indian Monsoon Region. Geophys. Res. Lett. 2010, 37, L06703. [Google Scholar] [CrossRef]


| MERRA-2–GEBA | Annual | DJF | MAM | JJA | SON |
|---|---|---|---|---|---|
| N | 197,302 | 49,067 | 49,501 | 49,357 | 49,377 |
| slope | 1.04 (0.47) | 1.05 (0.46) | 0.92 (0.51) | 0.85 (0.44) | 1.02 (0.46) |
| BIAS | 24.25 | 15.49 | 26.37 | 33.52 | 21.58 |
| BIAS(%) | 15.3 | 15.5 | 14.1 | 15.6 | 16.5 |
| RMSE | 36.07 | 27.62 | 38.65 | 44.58 | 30.95 |
| RRMSE(%) | 22.8 | 27.7 | 20.7 | 20.7 | 23.7 |
| R | 0.95 (0.61) | 0.96 (0.56) | 0.88 (0.65) | 0.85 (0.60) | 0.95 (0.59) |
| mean_GEBA | 158.36 | 99.78 | 186.89 | 215.50 | 130.85 |
| mean_MERRA-2 | 182.61 | 115.27 | 213.26 | 249.03 | 152.42 |
| id | 1099 | 1099 | 1099 | 1099 | 1099 |
| MERRA-2–BSRN | Annual | DJF | MAM | JJA | SON |
| N | 11,259 | 2807 | 2826 | 2800 | 2826 |
| slope | 0.99 (0.50) | 0.96 (0.51) | 1.00 (0.50) | 0.99 (0.46) | 0.98 (0.53) |
| BIAS | 10.31 | 5.84 | 10.46 | 14.45 | 10.51 |
| BIAS(%) | 5.9 | 4.1 | 5.5 | 6.8 | 6.8 |
| RMSE | 26.12 | 22.32 | 27.15 | 29.88 | 24.51 |
| RRMSE(%) | 15.1 | 15.9 | 14.4 | 14.1 | 15.9 |
| R | 0.97 (0.62) | 0.98 (0.61) | 0.95 (0.63) | 0.96 (0.60) | 0.97 (0.63) |
| mean_BSRN | 173.57 | 139.60 | 188.90 | 212.10 | 153.82 |
| mean_MERRA-2 | 183.89 | 145.44 | 199.4 | 226.5 | 164.33 |
| id | 70 | 70 | 70 | 70 | 70 |
| GEBA Periods | Agreement (%) | GEBA Δ(SSR) (W/m2) | GEBA (BRI, DIM) | MERRA-2_pixel Δ(SSR) (W/m2) | MERRA-2_pixel (BRI, DIM) |
|---|---|---|---|---|---|
| 1980–1985 | 60.6 (75) | 0.94  | (107, 101) | 3.56 | (156, 52) |
| 1986–2000 | 49.1 (47.4) | 1.92 | (161, 71) | −1.33  | (108, 124) |
| 2001–2010 | 58.6 (62.5) | 0.19 | (135, 97) | −1.75 | (100, 132) |
| 2011–2017 | 74.2 (80) | −1.68 | (70, 89) | −0.54 | (65, 94) |
| BSRN Periods | Agreement (%) | BSRN Δ(SSR) (W/m2) | BSRN (BRI, DIM) | MERRA-2_pixel Δ(SSR) (W/m2) | MERRA-2_pixel (BRI, DIM) |
|---|---|---|---|---|---|
| 1992–2000 | 81.8 (0) | 2.82 | (14, 8) | 2.08 | (14, 8) |
| 2001–2010 | 68.2 (0) | −0.89 | (9, 13) | −0.08 | (8, 14) |
| 2011–2020 | 63.6 (0) | 3.78 | (8, 14) | −2.43 | (6, 16) |
| Δ(SSR) ± S.E. (W/m2) | January 1980–December 2019 | January 1980–December 1999 | January 2000–December 2009 | January 2010–December 2019 |
|---|---|---|---|---|
| Globe | −6.31± 0.19 | −3.64 ± 0.31 | −1.19 ± 0.26 | 0.44 ± 0.24 |
| N.H. | −5.72 ± 0.28 | −1.64 ± 0.35 | −1.92 ± 0.35 | 0.39 ± 0.37 |
| S.H. | −6.16 ± 0.38 | −5.58 ± 0.47 | −0.33 ± 0.46 | −0.08 ± 0.39 |
| Land-Globe | −2.58 ± 0.25 | 0.53 ± 0.35 | −2.45 ± 0.38 | 0.25 ± 0.39 |
| Land-N.H. | −2.07 ± 0.30 | 0.60 ± 0.43 | −2.44± 0.48 | −0.59 ± 0.41 |
| Land-S.H. | −2.98 ± 0.42 | 0.36 ± 0.53 | −2.46 ± 0.77 | 1.63 ± 0.73 |
| Ocean-Globe | −7.81 ± 0.25 | −5.29 ± 0.35 | −0.67 ± 0.31 | 0.45 ± 0.31 |
| Ocean-N.H. | −8.06 ± 0.38 | −3.12 ± 0.43 | −1.45 ± 0.43 | 1.16 ± 0.54 |
| Ocean-S.H. | −6.67 ± 0.43 | −6.88 ± 0.54 | 0.16 ± 0.53 | −0.44 ± 0.45 |
Publisher’s Note: MDPI stays neutral with regard to jurisdictional claims in published maps and institutional affiliations. |
© 2022 by the authors. Licensee MDPI, Basel, Switzerland. This article is an open access article distributed under the terms and conditions of the Creative Commons Attribution (CC BY) license (https://creativecommons.org/licenses/by/4.0/).
Share and Cite
Stamatis, M.; Hatzianastassiou, N.; Korras-Carraca, M.B.; Matsoukas, C.; Wild, M.; Vardavas, I. Interdecadal Changes of the MERRA-2 Incoming Surface Solar Radiation (SSR) and Evaluation against GEBA & BSRN Stations. Appl. Sci. 2022, 12, 10176. https://doi.org/10.3390/app121910176
Stamatis M, Hatzianastassiou N, Korras-Carraca MB, Matsoukas C, Wild M, Vardavas I. Interdecadal Changes of the MERRA-2 Incoming Surface Solar Radiation (SSR) and Evaluation against GEBA & BSRN Stations. Applied Sciences. 2022; 12(19):10176. https://doi.org/10.3390/app121910176
Chicago/Turabian StyleStamatis, Michael, Nikolaos Hatzianastassiou, Marios Bruno Korras-Carraca, Christos Matsoukas, Martin Wild, and Ilias Vardavas. 2022. "Interdecadal Changes of the MERRA-2 Incoming Surface Solar Radiation (SSR) and Evaluation against GEBA & BSRN Stations" Applied Sciences 12, no. 19: 10176. https://doi.org/10.3390/app121910176