1. Introduction
The massive and continuous growth of biomedical data of a heterogeneous nature requires ever greater efforts aimed at their integration. Indeed, the proliferation of non-integrated and non-interoperable data greatly hinders their interpretation and prevents computer-assisted reasoning. Data integration and reproducibility are essential to biomedical studies; it becomes extremely important to observe the FAIR guiding principles where research works are recommended to be findable, accessible, interoperable, and reusable [
1].
Generally, a key requirement for allowing data to be FAIR is the use of open approaches and standardized representation formalisms such as ontologies. Indeed, ontologies have proved crucial in supporting omics data integration [
2]. However, since hundreds of biomedical ontologies have been designed and are currently available, a new problem has arisen, i.e., how to integrate different ontological schemes and make them interoperable [
3]. To this end, in addition to syntactic issues related to the variety of models and formats, semantic problems arising from context-related different interpretations need to be encountered [
4].
To get the most out of these data, different approaches are required for querying multiple ontologies and databases to provide researchers with biomedical information organized as interconnected entities in a semantic fashion [
5]. The research described in this paper attempts to contribute toward this end within a specific domain, through an ontology-based
linked data application. An approach to data aggregation and analysis in the field of rare
neuroendocrine neoplasms (NENs) is proposed.
In previous research by the same authors [
6] a novel linked data application was described for the same domain, integrating several existing biomedical ontologies including the
National Cancer Institute Thesaurus, the
Mondo Disease Ontology, the
MedGen database, the
Disease Ontology, the
Orphanet Rare Disease Ontology, the
DisGeNet database, and the
Gene Ontology. Such data sources provided the relevant information to build a single knowledge model about NENs that is accessible via a client–server application.
In this work, an extension of the previous model through the integration of additional data sources is proposed. The knowledge model relies on the
multilayer network formalism to semantically link heterogeneous data sources while grouping them into several “layers”, each corresponding to a specific “aspect” of the domain [
7]. The original model consisted of three interconnected layers representing: information about diseases, affected genes, biological processes, and molecular functions of such genes and related gene products.
In addition to the information included in the original model, the extended version integrates information from new sources including the Human Phenotype Ontology, the HPO-ORDO Ontological Module, the Human Protein Atlas, the Drug–Gene Interaction Database as well as the ChEMBL database. Starting from the previous model, three additional layers have been designed and integrated to consider further aspects.
The first additional layer provides details about disease-related phenotypes such as morphology, development, biochemical, physiological, and other features. It has been shown that a deep understanding of rare diseases together with the identification of prognostic and therapeutic implications can be accelerated by analyzing and correlating phenotypic and genomic data.
The second additional layer provides an association between genes responsible for diseases and human tissue. This allows us to find commonalities between organs and illustrate the role of genes related to NENs.
The third additional layer provides details about drugs with documented interactions with genes affected by NENs. The complexity in the extraction of relevant information about these tumors is motivated by the great heterogeneity in their biological features that can also determine heterogeneous responses to therapeutic agents. They often present subpopulations of cells with different angiogenic, invasive, and metastatic properties.
According to [
8], biomedical ontologies pose several integration challenges due to both the complexity of the domain and the characteristics of the ontologies themselves which include thousands of classes. Furthermore, biomedical ontologies present profound organizational differences to the point of often being difficult to reconcile due to syntactic and semantic heterogeneity. Although properly integrated, such ontologies are often difficult for researchers to use due to the lack of user-friendly interfaces.
The developed model is aimed to meet these challenges by improving the way information is stored, enhancing interoperability while simplifying the work of scientists studying these rare diseases. Moreover, a user-friendly interface can guide healthcare professionals and researchers through the process of searching for relationships between pathologies (and their related genes) also highlighting the effectiveness of adopted drugs. The adopted multilayer network formalism is useful for organizing the model into a manageable and layered structure. In accordance with [
4], a
workflow-based approach has been adopted to integrate data from external sources “on the fly” on a frequently updated local copy, based on user requests, therefore without the need to modify the original datasets and without the risk of using obsolete data.
The paper is organized as follows: in
Section 2 some background information on NENs is provided and the related work on biomedical data integration is summarized; in
Section 3 the starting point of this research is described, including the previous integration model as well the additional biomedical data sources; in
Section 4 the structure of the new model and the related integration issues are presented; in
Section 5 the extension of the developed application for browsing and querying the updated model is described. The last section summarizes the conclusions and outlines the ongoing work.
2. Background and Related Work
The research work described in this paper aims at supporting biologists, researchers, and specialists in the collection, organization, and analysis of existing biomedical data on
neuroendocrine neoplasms (NENs) through the definition and development of a linked data application. During the last four decades, these neoplasms have shown a 6.4-times increasing age-adjusted annual incidence [
9]. NENs have been observed in almost every tissue, either in the pure endocrine organs, the nerve structures, or in the diffuse neuroendocrine system.
The
World Health Organization has defined two groups of NENs to enable consistent management of diseases regardless of their anatomical location [
10]:
neuroendocrine carcinomas (NECs) and
neuroendocrine tumors (NETs). Although NETs appear as well-differentiated neoplasms and can be categorized into three levels—G1, G2, and G3 (low, intermediate, and high grade)—NECs are poorly differentiated neoplasms with only high grade (i.e., G3). Cell grade and differentiation often depend on different factors such as mitotic count and Ki-67 cell labeling index [
11]. Moreover, NECs can be also classified into small- or large-cell-type NECs.
The integration of information about NENs is still quite difficult since variations depending on anatomical sites often lead to definitions different from the accepted and established ones. Heterogeneous data sources with different schemes and formats make the information retrieval and analysis process quite difficult to perform and often require the clinician to have advanced programming skills.
Some projects have been proposed to integrate and harmonize biological data sources. For example, in the
Gene Expression Data Warehouse (GEDAW) project a data warehouse has been proposed to manage relevant information on liver gene expression data and related biomedical resources [
12]. It provides the integration of gene information from several data sources, including
GenBank and
BioMeKe.
Bio2RDF also has the purpose of transforming heterogeneous biomedical information into linked data using semantic Web technologies [
13]. It currently consists of 11 billion triples and 35 connected datasets.
Bio2RDF is part of the
Life Sciences Linked Open Data (LSLOD), in the context of the
Linked Open Data initiative [
14].
The
Knowledge Base of Biomedicine (KaBOB) integrates 18 biomedical data sources using 14 ontologies from the Open Biomedical Ontologies (OBO) initiative [
15]. Such a model integrates data sources by producing a single biomedical entity for each set of data source-specific equivalent identifiers. Similarly, the
Genomic and Proteomic Knowledge Base (GPKB) links several biomedical data sources such as
Entrez Gene,
UniProt,
IntAct,
Expasy Enzyme,
GO,
GOA,
BioCyc,
Kegg,
Reactome, and
OMIM [
16]. It provides a set of maintenance procedures to update the knowledge base depending on the evolutions of its sources and their consistency.
The
Software for Flexible Integration of Annotation (SoFIA) aims at integrating omics information from several sources [
17]. It relies on a minimal workflow that, given a starting goal indicated by the researchers, allows one to complete the task and return a relevant subset of information. More recently, the R package
Onassis has been introduced to easily associate samples from large-scale biomedical repositories to ontology-based annotations [
18]. Onassis leverages NLP techniques, biomedical ontologies, and the R statistical framework to identify, relate, and analyze datasets from public repositories.
In the domain of cancer research,
SysCancer has the aim to provide an integrated system that combines different stages of cancer studies [
19]. The data warehouse can allow a multidimensional analysis of collected and integrated data meant for public access. In [
20] the authors developed a cancer staging ontology based on the guidelines of the
American Joint Commission on Cancer. The initial knowledge graph has been augmented by integrating additional open-source information about treatment and monitoring options depending on the inferred stage.
A network-based data integration framework for the semantic integration of clinical and omic data on breast cancer and neuroblastoma is presented in [
21]. Here, a NoSQL database is used to combine heterogeneous raw data records and external knowledge sources. A cervical cancer ontology has been developed by [
22] where the authors define 880 standardized concepts, 1182 common terms, 16 relations, and 6 attributes which are organized into 6 levels and 11 classes.
The first example of a linked data application, aimed at integrating and harmonizing existing information on NENs was reported in [
6]. It connects data from several sources, providing a single access point to a detailed network of information, organized on three interconnected layers. The ontology developed in this latest paper and the related software prototype constitutes the starting point of the present study.
As anticipated in the introductory section, this work extends the existing ontological model by designing and integrating three additional layers, which refer to further aspects of the domain. On the other hand, the new model exhibits the innovations already proposed in the previous version compared to the existing literature, i.e., the use of multilayer networks to organize the model in a manageable structure, the use of a workflow-based approach to integrating external data “on the fly”, and the use of a user-friendly interface based on a multi-modal database with polyglot persistence.
3. Initial Model and New Information Sources
As anticipated in the previous section, the starting point of this work is the linked data application for NENs described in [
6]. The next sub-section summarizes the content and the structure of the previous knowledge model whereas
Section 3.2 provides a brief overview of the new biomedical information sources that, in the present study, have been integrated on top of the former model.
3.1. The Initial Integration Model
The former model already integrates several existing biomedical ontologies and databases that describe diseases, genes, gene products, biological processes, molecular functions, and the gene–disease and disease–disease associations. The entire list of the integrated data sources is reported in
Table 1. A single knowledge model has been built by extracting and linking relevant information for research on NENs.
Our model relies on the formalism of
multilayer networks to address the heterogeneity of interconnected information; this allows us to represent complexity by generalizing a graph structure where the nodes and edges are distributed on different layers, each representing an “aspect” of the domain [
23].
We define a multilayer network as a triple
where the sets
and
represent, respectively, the nodes and edges of the network, whereas
is the set of network layers [
24]. In turn, each
is a subgraph
composed by the nodes
and the edges
such that
and
.
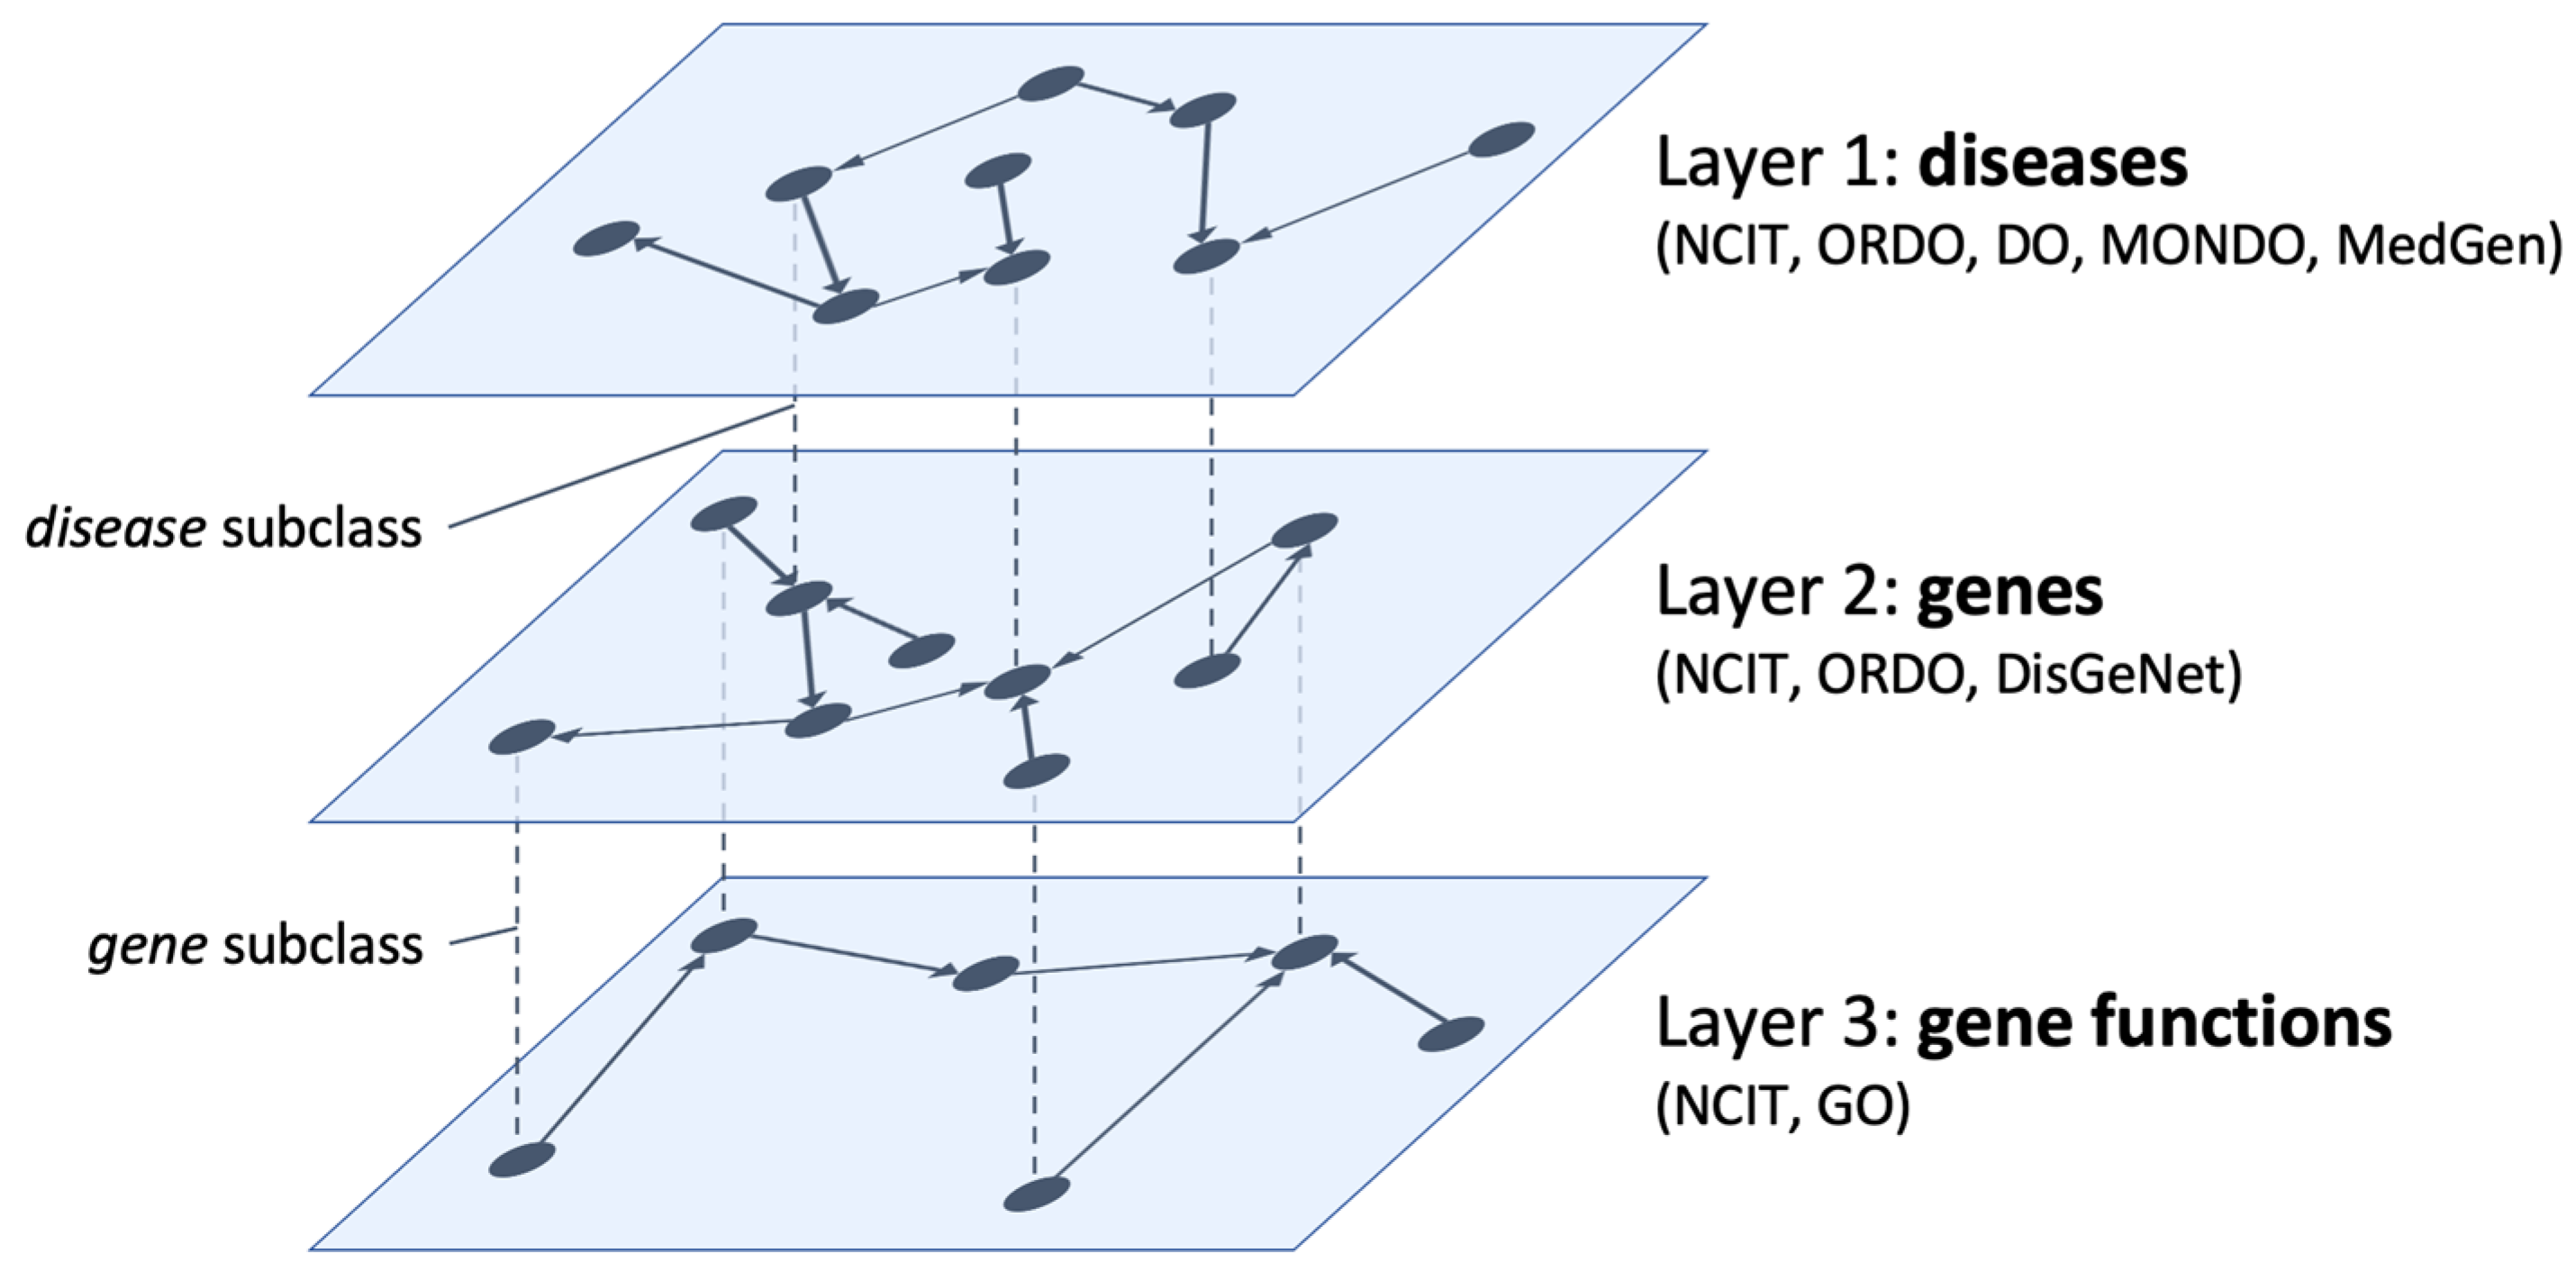
In
Figure 1 a sketch of the former model is depicted. The three interconnected layers represent information on diseases, affected genes, and their functions. We define specific concepts as shared nodes that realize bridges between layers. Layer 1 collects information about NENs as available in NCIT, ORDO, and DO ontologies. The
disease class (and its subclasses) acts as a bridge from layer 1 to layer 2 to highlight the variations in the human genome (available in the DisGeNet database) that lead to the NENs described at the first level as well as disease–disease associations based on their molecular causes.
Then, the gene class (and its subclasses) acts as a bridge from layer 2 to layer 3 to highlight additional information on genes and gene products responsible for the onset of NENs (available in the Gene Ontology). This also includes genes’ molecular functions (i.e., the elementary activities of a gene product at the molecular level, such as binding or catalysis) and biological processes (i.e., the operations or sets of events relevant to the operation of living units: cells, tissues, organs, and organisms).
We implement interlayer relations with the equivalent-class OWL statement. In the same way, newly defined ontologies are linked with the original ontological sources. We developed a client–server application to access, browse, and query the defined model.
3.2. The Additional Biomedical Information Sources
The list of additional data sources integrated with the updated knowledge model is reported in
Table 2 which also includes a reference to the official website.
The
Human Phenotype Ontology (HPO) provides a standardized vocabulary of phenotypic abnormalities found in human diseases. It currently includes over 13,000 terms and more than 156,000 annotations describing phenotypic anomalies divided into five sub-ontologies that classify anomalies, link them to diseases, describe the mode of inheritance, the modifiers of clinical symptoms, the clinical course, and the frequency of specific clinical features. The ontological scheme is developed by the
Monarch Initiative, using medical literature to improve biomedical research on rare diseases [
25].
The HPO-ORDO Ontological Module (HOOM) is an ontology that integrates ORDO information on rare diseases with HPO information on phenotypic anomalies. HOOM qualifies the annotations between clinical entities and phenotypic anomalies according to the frequency and integrates the notion of diagnostic criterion. HOOM is intended for researchers and pharmaceutical companies wishing to co-analyze associations of rare and common disease phenotypes. Being designed to integrate the information of two different models, it does not contain instances but only classes and relationships.
The
Human Protein Atlas (HPA) maps human proteins in cells, tissues, and organs using the integration of several omic technologies, including antibody-based imaging, mass spectrometry-based proteomics, transcriptomics, and systems biology [
26]. It has contributed to thousands of publications in the field of human biology and disease and is recognized by the intergovernmental organization ELIXIR as a central European resource for the life science community. HPA consists of ten parts, each focusing on a particular aspect of the genome-wide analysis of human proteins.
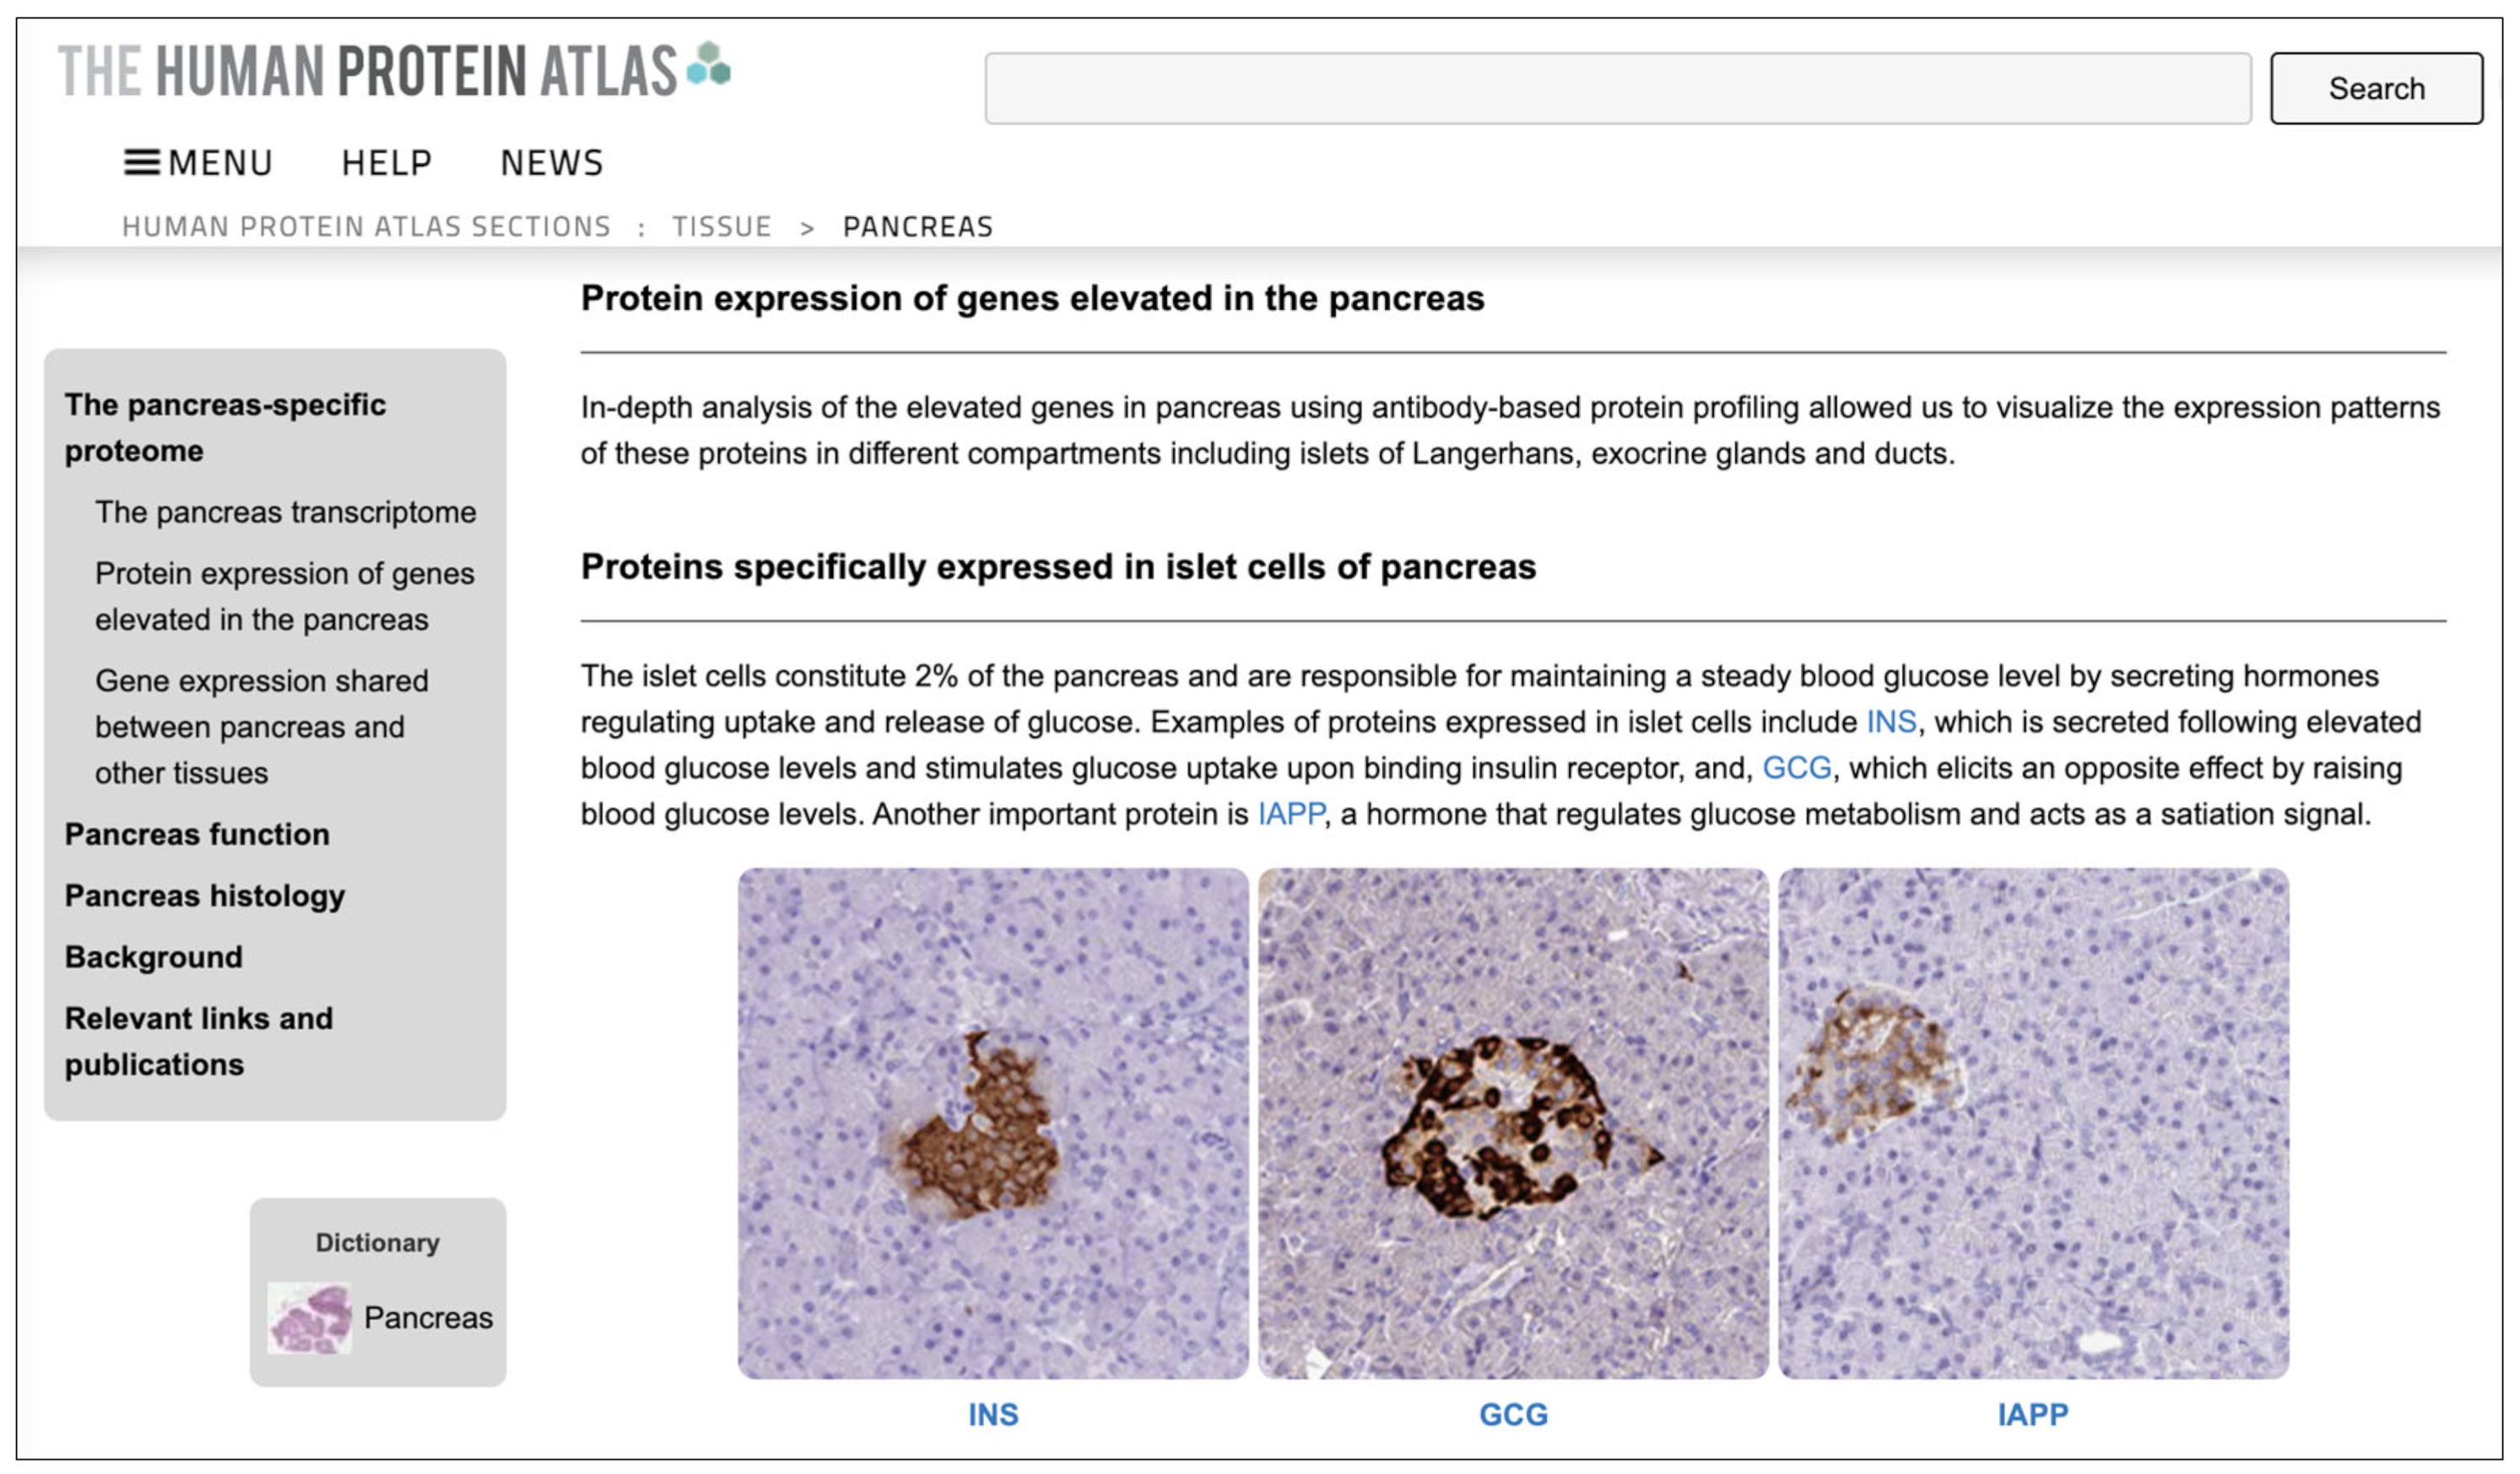
In particular, the HPA Tissue Section has been used in this work. This section describes the expression profiles in human tissues of genes at both the mRNA and protein levels. The protein expression data of 44 normal human tissue types is derived from antibody-based protein profiling using immunohistochemistry. Protein data covers 15,323 genes (i.e., 76% of protein-coding genes) for which antibodies are available. The mRNA expression data is derived from deep RNA sequencing (RNA-seq) from 256 different types of normal tissue.
The
Drug–Gene Interaction Database (DGIdb) is a Web resource that provides information on drug–gene interactions and druggable genes from publications, databases, and other Web sources [
27]. Data on drugs, genes, and interactions are normalized and merged into conceptual groups. In the current version (4.0), DGIdb includes 100,273 interaction statements and 33,577 druggable gene category claims. In total, it includes 10,606 druggable genes and 54,591 drug–gene interactions, covering 41,102 genes and 14,449 drugs. DGIdb is accessible via a Web-based search interface, an application programming interface (API), and is downloadable as a collection of TSV archives.
The
ChEMBL database is a large open-access drug discovery database managed by the
European Molecular Biology Laboratory (EMBL). It is handled manually and has the purpose of capturing data and knowledge across the pharmaceutical research and development process. Information on molecules and their biological activity is extracted from full-text articles in several journals and supplemented with data on approved drugs and clinical development candidates, such as the mechanism of action and therapeutic indications [
28]. It includes information on more than 2 million compounds and 14,000 drugs from more than 84,000 publications and about 200 datasets. It is accessible via a Web-based interface and can be downloaded as an SQL database or a collection of RDF files.
4. The Integration and Harmonization Process
To integrate the biomedical data sources described in
Section 3.2, three additional layers were designed and harmonized with the initial model.
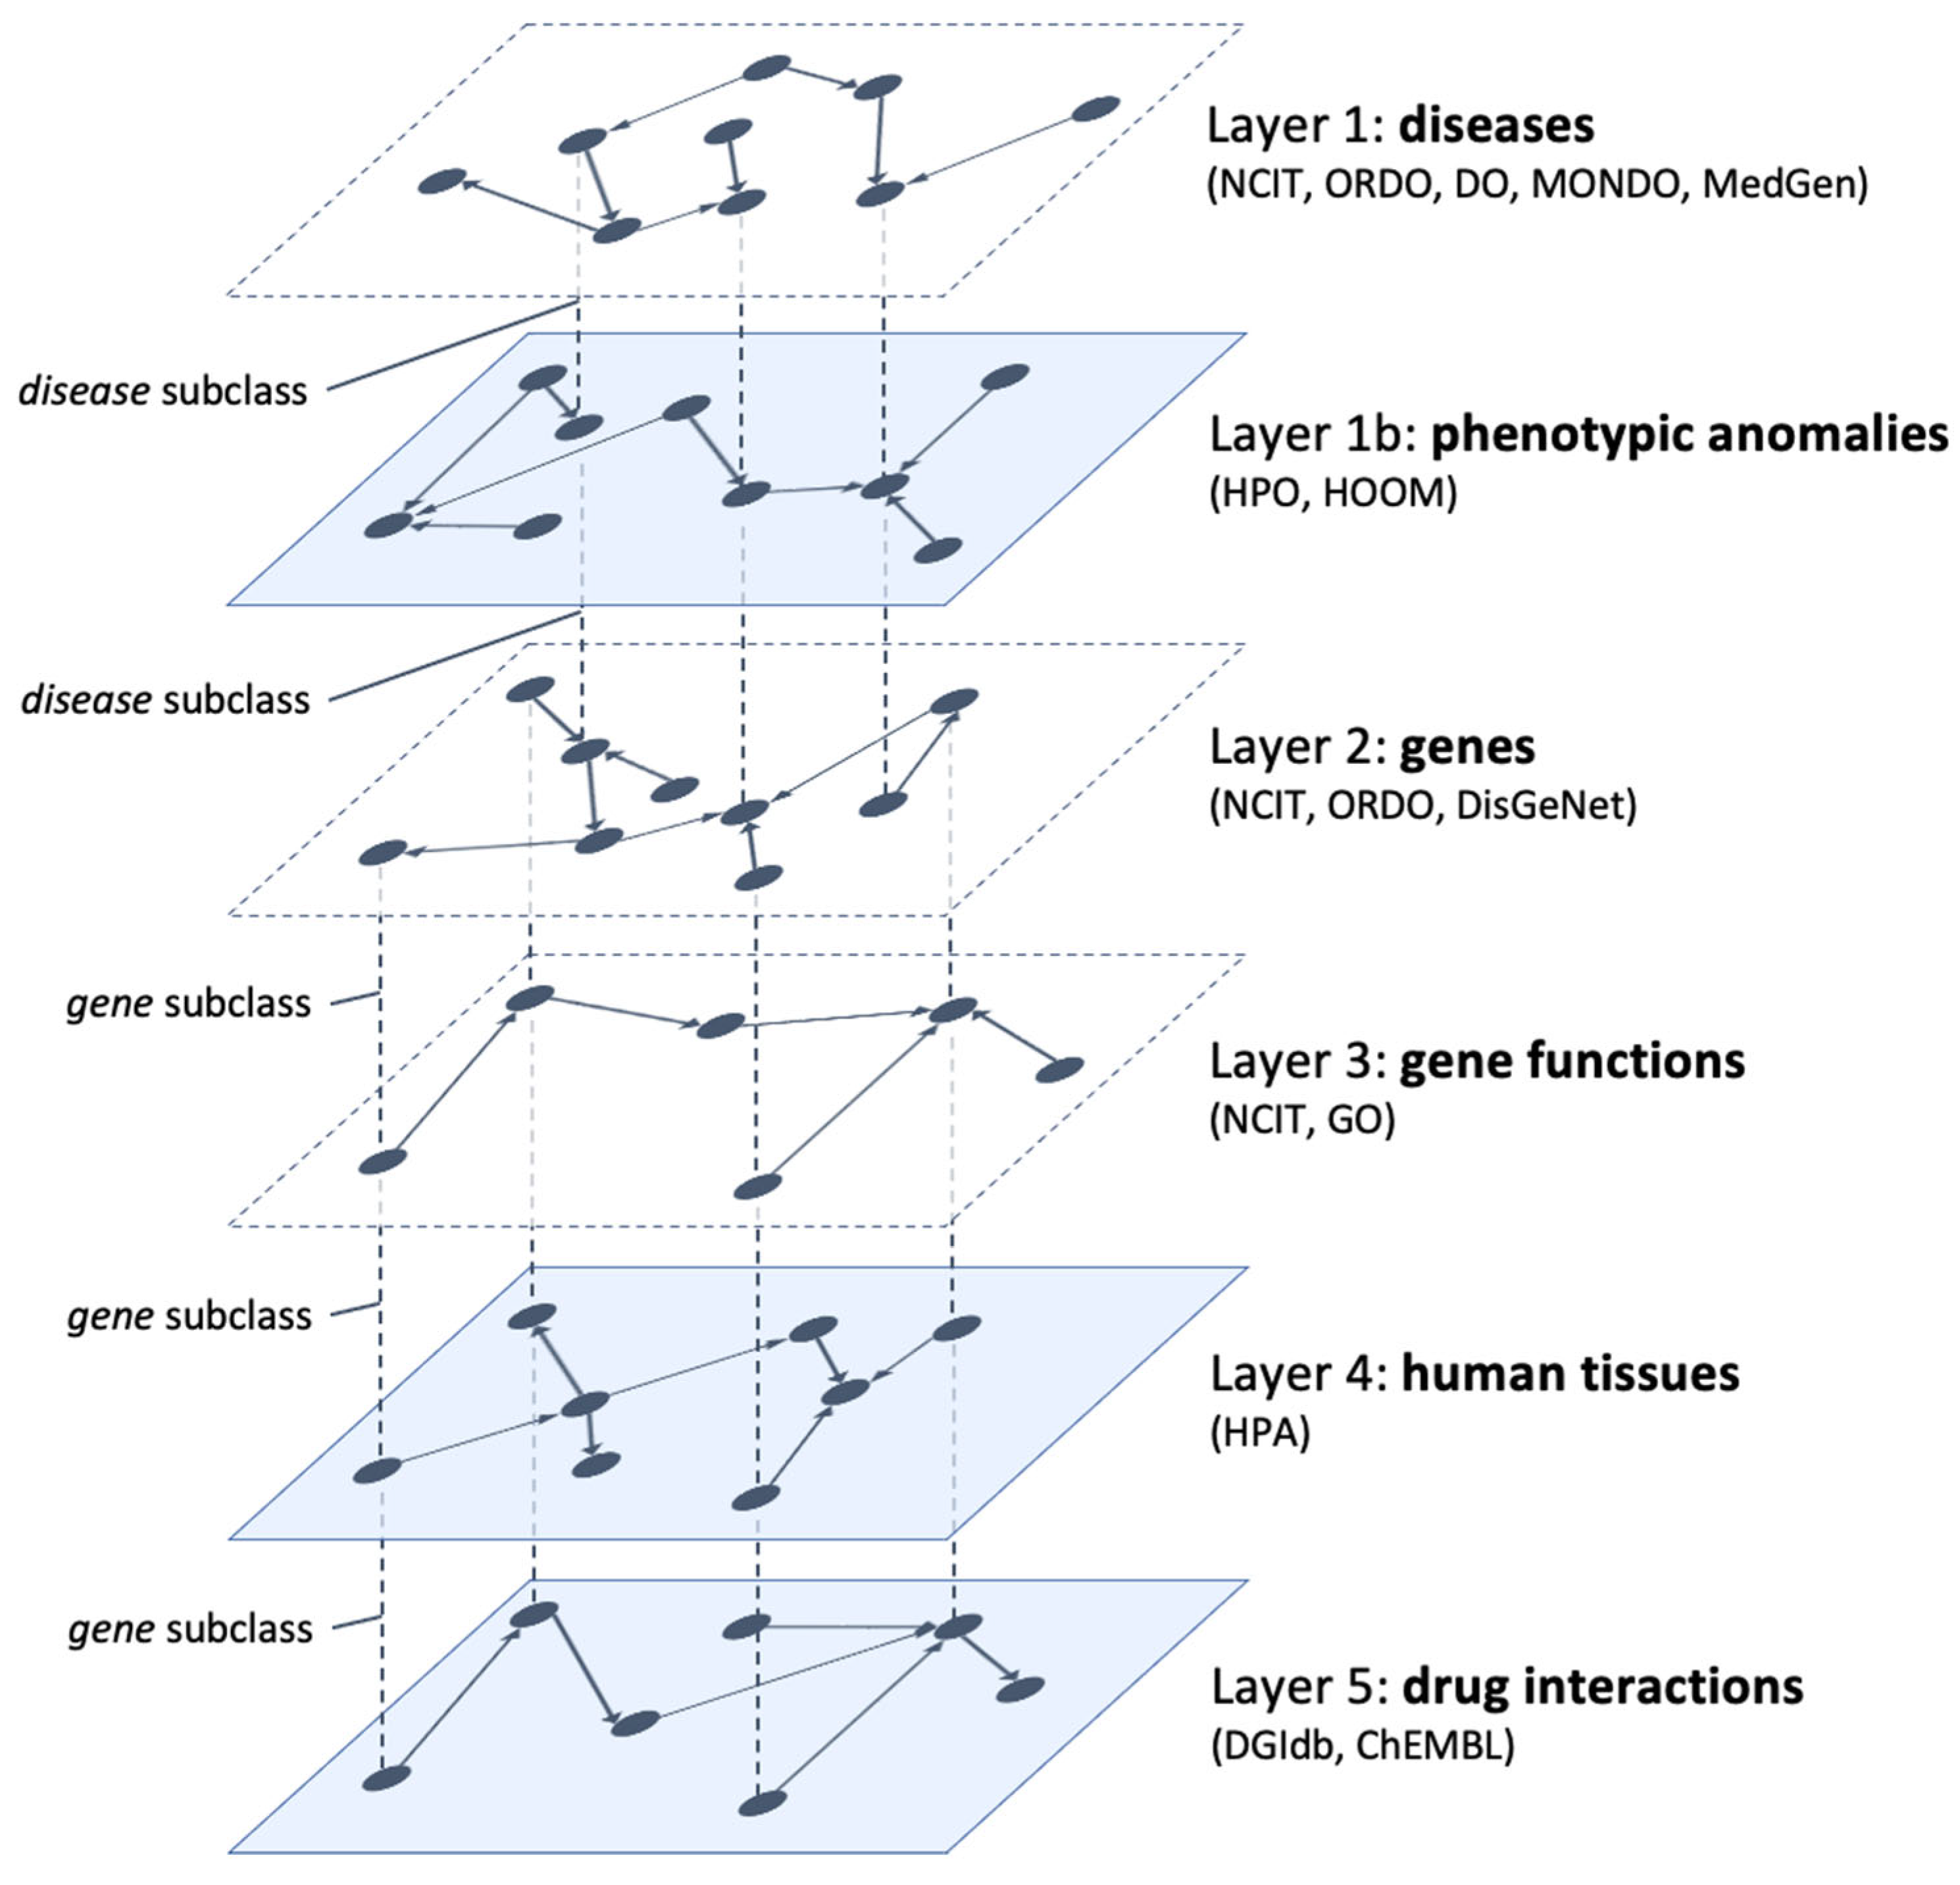
Figure 2 shows the updated model which now consists of six interconnected layers. The additional layers (opaque in the figure) contain information on the phenotypic anomalies connected to the NENs (layer 1b), the involved human tissues (layer 4), and the pharmacological interactions with the connected genes (layer 5). As in the original model, we don’t include explicit interlayer connections since they can be inferred from the projections of the same node in different layers. Furthermore, each pair of adjacent layers shares at least one node.
The new layer describing phenotypic anomalies, being closely related to diseases, is placed directly between layers 1 (diseases) and 2 (genes). In this way, the disease class (and its subclasses) allows a transition from layer 1 to layer 1b (to discover phenotypic anomalies related to diseases) and to layer 2 (to discover disease–gene connections). In turn, the gene class (and its subclasses) allows a transition from layer 2 to layer 3 (to discover gene functions), to layer 4 (to discover human tissues where gene products are expressed), and to layer 5 (to find drugs that have documented interactions with genes). In the next subsections, we describe in more detail the composition of each additional layer.
4.1. Layer 1b: Phenotypic Anomalies
As introduced in
Section 2, NENs are rare diseases that include heterogeneous neoplasms such as high-grade NETs in the lung, mixed medullary and follicular cell carcinomas, intrathyroidal NENs with paraganglioma features, NENs of the breast, NETs in the kidney, NETs of the bladder, etc. [
10]. Although a rare disease occurs in less than 1 in 2000 individuals, due to the high number of such diseases (about 8000 according to Orphanet), it is estimated that around 4% of the European population has a rare disease diagnosis [
29].
According to [
30], about 80% of rare diseases are of genetic origin. However, due to a lack of clinical and scientific knowledge, the molecular cause is unknown for about 40% of them. The second level of the proposed model already includes information on known genetic variants linked to NENs. However, despite the increasing number of identified genetic variants, their functional impact and, consequently, the connection with rare diseases is still largely unknown. Furthermore, even for diseases for which one or more causative genes have been identified, these often do not explain the totality of cases.
This lack of knowledge often prevents patients from receiving adequate and timely care. It is estimated that specific therapies are available for less than 10% of rare diseases, including NENs. For this reason, having available detailed phenotypic data combined with ever-increasing amounts of genomic data is of enormous importance to accelerate the identification of clinically actionable prognostic or therapeutic implications and to improve the understanding of rare diseases [
31]. Moreover, phenotype-based genomic analysis has also been shown to improve the diagnostic rate in patients with rare diseases [
32].
Phenotypes are the observable traits of an organism. In medical contexts, however, the word phenotype is more often used to refer to some deviation from normal morphology, physiology, or behavior. A disease is commonly characterized by one or more phenotypic features which can affect all or only a subset of individuals with the disease as well as a time course over which the phenotypic features may have onset and evolve. The HPO ontology (see
Section 3.2) describes a deep hierarchy of phenotypic abnormalities whereas the HOOM ontology (see
Section 3.2) associates the phenotypic anomalies described in HPO with the clinical entities included in the ORDO ontology of rare diseases.
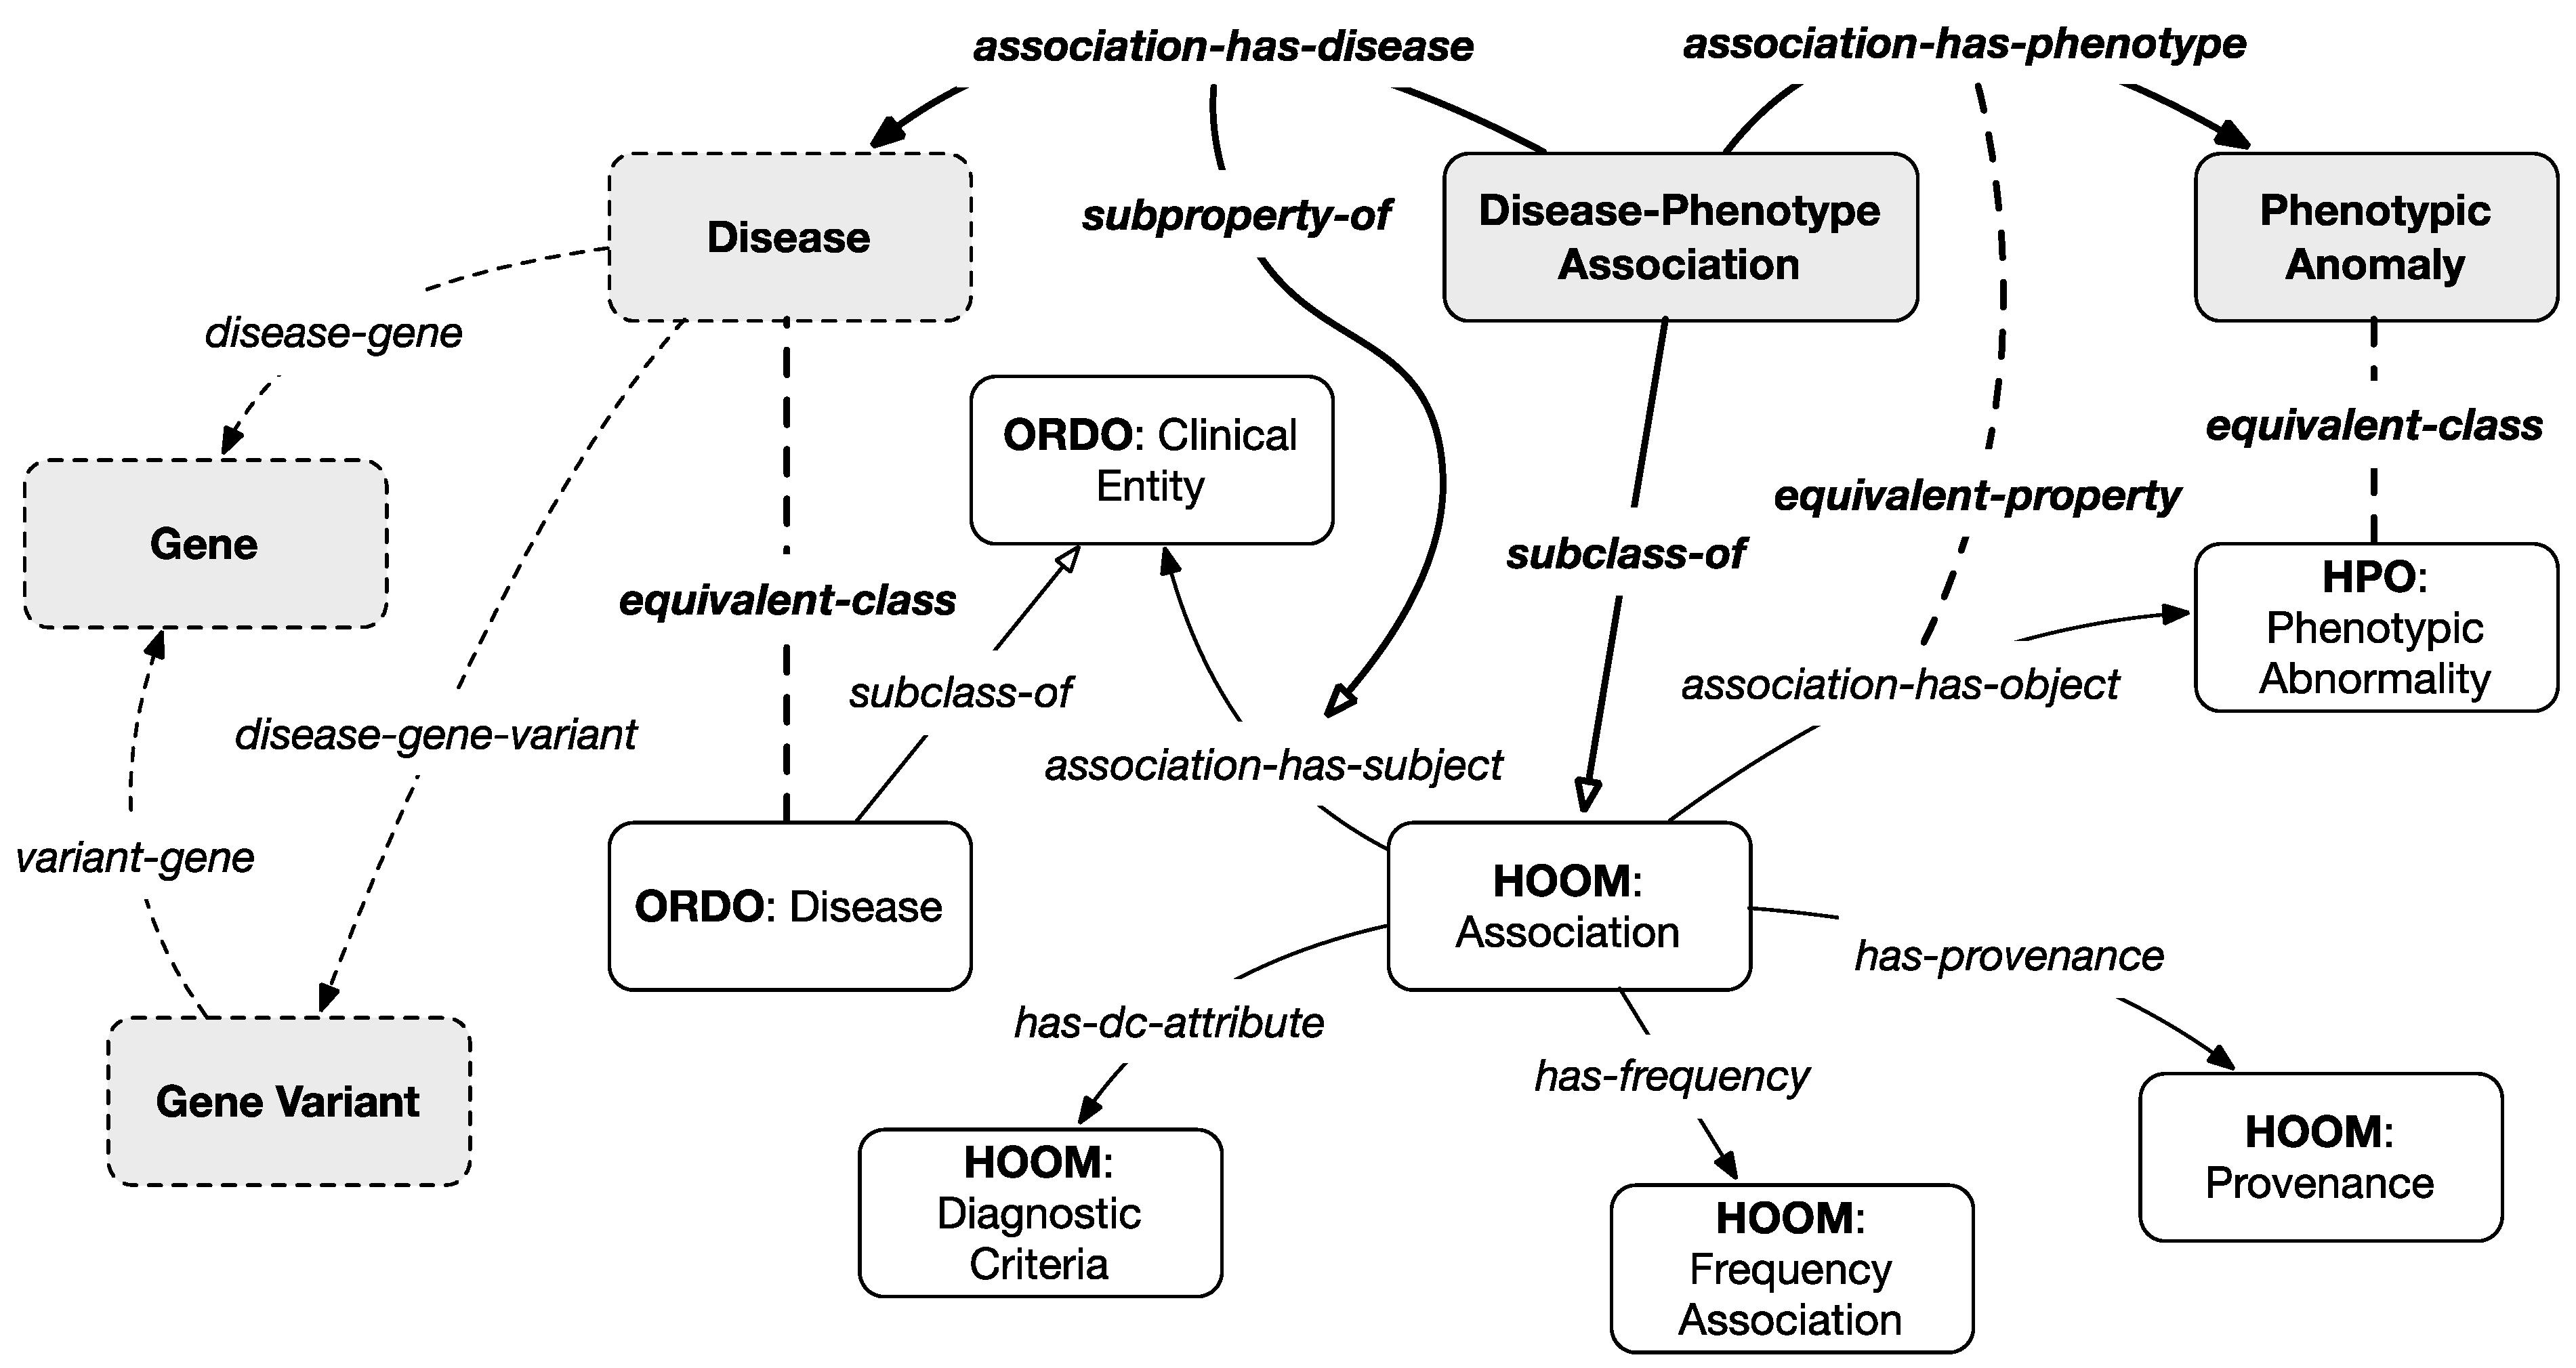
By harmonizing the information included in HPO and HOOM with the classes and properties of the first three layers of the initial knowledge model, we were able to construct layer 1b, aimed at describing known associations between NENs and phenotypic anomalies.
Figure 3 represents the main classes and relations of our model. Gray classes and bold relationships are introduced by the integration scheme of layer 1b except for the dotted classes which are projected from the previous and subsequent layers.
The main classes of this layer are
phenotypic anomaly, equivalent to the
phenotypic abnormality class from HPO (i.e., the ancestor class of all described phenotypic anomalies), and the
disease–phenotype association class, a subclass of the
association class from HOOM (describing known associations between phenotypes and clinical entities). Only associations related to diseases classified as NENs in the first layer have been considered. Furthermore, a set of properties, inherited from HOOM and described in
Table 3, are linked to each association, to qualify it with information about the frequency and the diagnostic criteria, and the provenance (e.g., scientific articles or expert opinions).
It should be noted that indirect connections between genes, gene variants, and phenotypic anomalies can be inferred from the model based on information from layer 2 that associates genes and gene variants with diseases.
4.2. Layer 4: Human Tissues
This layer enhances the model with information, inherent to NENs, on the human tissues associated with the genes that cause these diseases. This information is retrieved from the
Human Tissues section of the HPA (see
Section 3.2) which defines the distribution of gene products in the main tissues and organs of the human body. The collection and analysis of information relating to normal tissues are important and allow us to compare a pathological state with normality. On the other hand, inter-individual variations in the norm (e.g., age-related) can present a challenge in distinguishing a physiological condition from a pathological one.
The Human Tissues section of the HPA describes the level of expression of gene products in 44 different non-diseased tissues. These gene products and related genes play an important role in organ physiology and provide the basis for organ-specific research. By correlating genes and tissues it is possible to highlight genes that are simultaneously present in groups of tissues, compared to all other human tissues. Such information helps to find similar characteristics between different organs and allows us to elucidate the function of the genes associated with NENs.
Table 4 shows the main fields of the
HPA Normal Tissue Data Archive. It is a tabular TSV file where each row represents the association between a gene and a human tissue. We filtered this extensive dataset to consider only the associations with a
medium or
high level of protein expression (
level field), only for the subset of genes already included in layer 2 of the integrated model (therefore related to NENs). Then the value of the
reliability field was considered. This value indicates the level of reliability of the analyzed protein expression pattern based on knowledge-based evaluation of available RNA-seq data, protein/gene characterization data, and immunohistochemical data from one or several antibodies designed toward non-overlapping sequences of the same gene. In our case, only the associations that are considered as
enhanced,
supported, or
approved were retained whereas
uncertain associations were discarded.
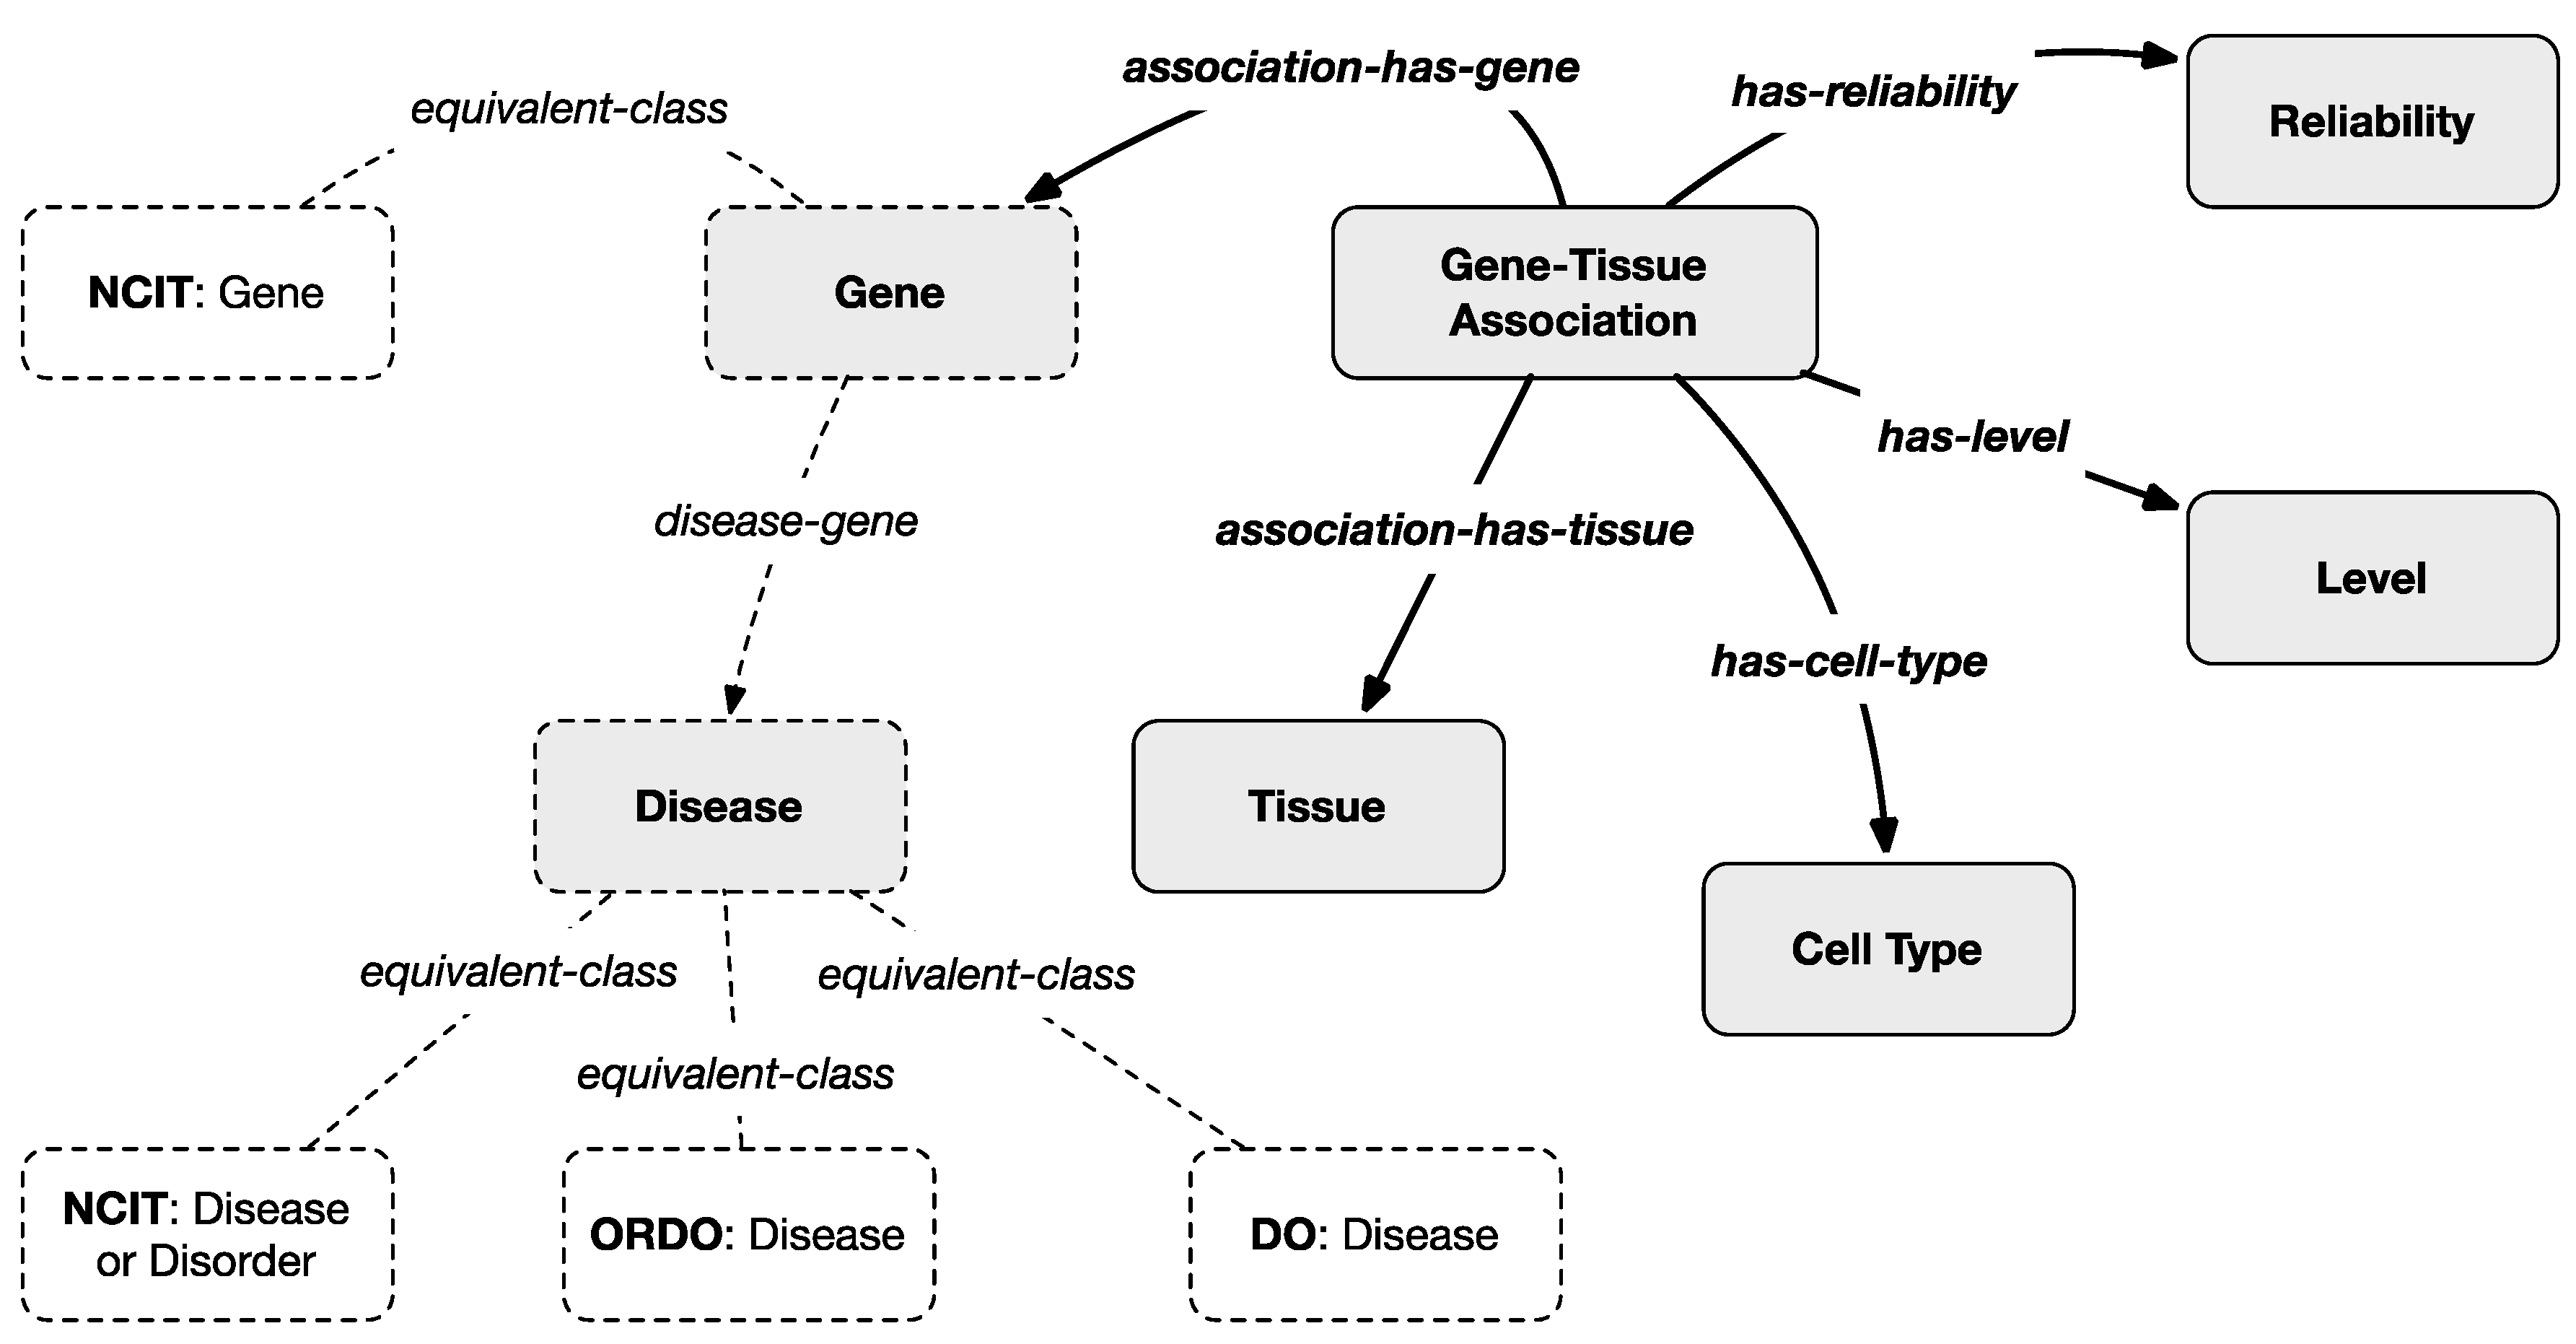
To harmonize the filtered information with the multi-layered knowledge model, an ontological representation of gene–tissue association is created as represented in
Figure 4 where gray classes and bold relationships are introduced by the scheme of this layer except for the dotted classes which are projected from the previous layers. In particular, the classes
Tissues and
Cell-Types were introduced whose instances are taken from the
HPA-controlled vocabularies.
A Gene–Tissue Association class was also introduced whose instances are dynamically generated from the filtered version of the HPA Normal Tissue Data Archive. Each instance maps a gene with a tissue and a cell type by also specifying the related level (medium or high, which are instances of the Level class) and reliability (enhanced, supported, or approved which are instances of the Reliability class). Even in this case, indirect connections between diseases and tissues can be inferred from the model based on information from the previous layers that associate genes and diseases.
4.3. Layer 5: Drug Interactions
NENs are biologically heterogeneous and contain subpopulations of cells with different angiogenic, invasive, and metastatic properties. As their response to therapeutic agents is equally heterogeneous, their treatment still represents an important clinical problem [
33]. Understanding drugs’ effects on NENs has been importantly investigated in the last years also using in vitro studies that have been essential to clarifying drug mechanism of action. Some innovative therapeutic options are also based on the study of the molecular pathways involved in the development and growth of NENs.
In this context, the research has recently focused on the so-called
druggable genome that is, genes and gene products known or expected to interact with bioavailable compounds. In addition to the presence of a protein structure that can be powerfully bound by small molecules, good potential targets are proteins for which modulation of biological function could provide therapeutic benefits for the patient. Targeted therapy has proven to be a successful strategy in oncology, with the introduction of new therapeutic agents, including monoclonal antibodies and small molecule kinase inhibitors [
34].
Following this trend, whereas the previous levels of the model offer researchers the ability to find mutated or altered genes implicated in NENs, the last level is designed to provide them with information on compounds and drugs that show documented interactions with these genes. The main external information sources integrated into this level are
ChEMBL and
DGIdb (see
Section 3.2) describing, respectively, drugs and drug–gene interactions.
Table 5 shows the main fields of the
DGIdb Interactions Archive. It is a tabular TSV file where each row represents a documented interaction between a drug and a gene. We filtered this information (made of more than 85,000 associations) to consider only interactions with genes already included in the model. The standardized
HGNC (Human Genome Organization Gene Nomenclature Committee) gene name was used to associate the correct
Gene class from layer 2. Instead, the
drug-concept-id field was used to link the right instance of the
Substance class from the
ChEMBL ontology.
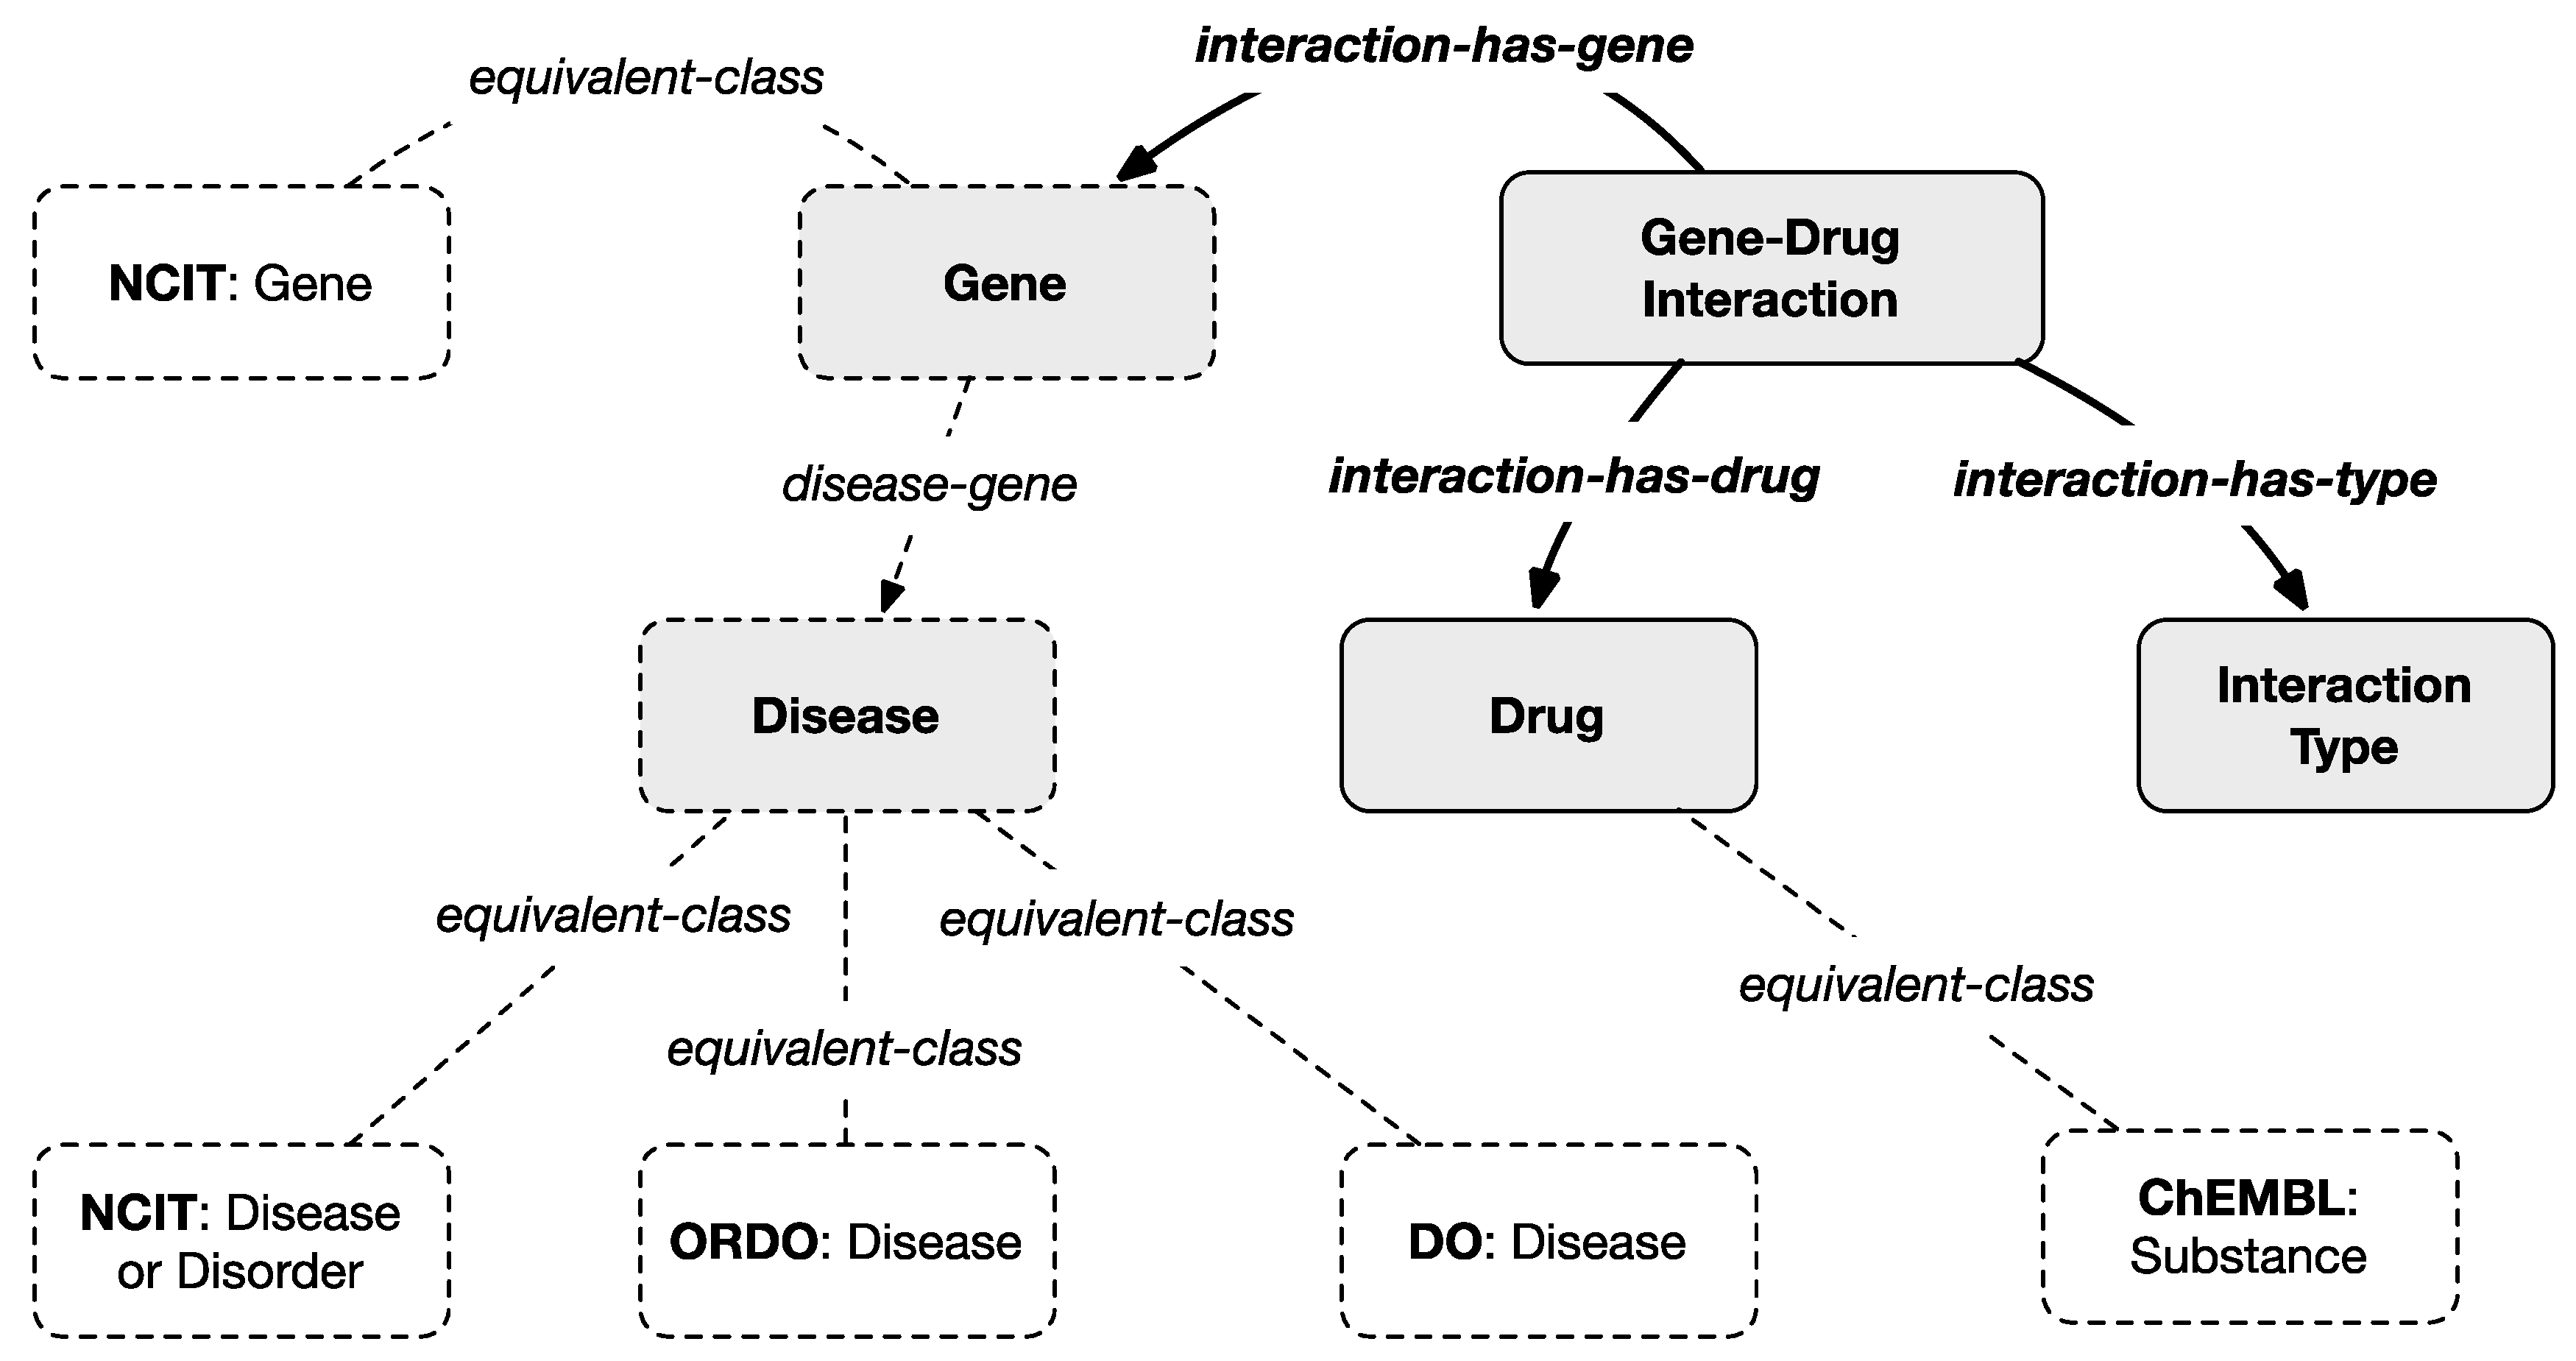
To harmonize the filtered information with the multi-layered knowledge model, an ontological representation of drug–gene interaction is created as represented in
Figure 5 where gray classes and bold relationships are introduced by the scheme of this layer except for the dotted classes which are projected from the previous layers. In particular, the new class
Drug maps, through the
equivalent-class relation, the external general
Substance class from
ChEMBL. The class
Gene–Drug Interaction maps a row of the
DGIdb Interactions Archive and connects the
Gene class with the
Drug class with the
interaction-has-gene and the
interaction-has-drug object properties, respectively.
Additional information, connected to the
Gene–Drug Interaction class through the
interaction-has-type property, is the
Interaction Type that explains the way a dug or compound interacts with a gene according to a controlled vocabulary defined by
DGIdb as reported in
Table 6. Each term is represented within the model as an individual of the
Interaction Type class. The meaning of each term is explained in the same table. Additional information like the interaction score (see
Table 5) and a link to the
ChEMBL Web page describing in detail each substance is included in the model through data properties.
5. Developed Prototype and Validation Results
A client–server application was developed as an extension of the one already presented in [
6] to retrieve the relevant information from our integrated model. We selected
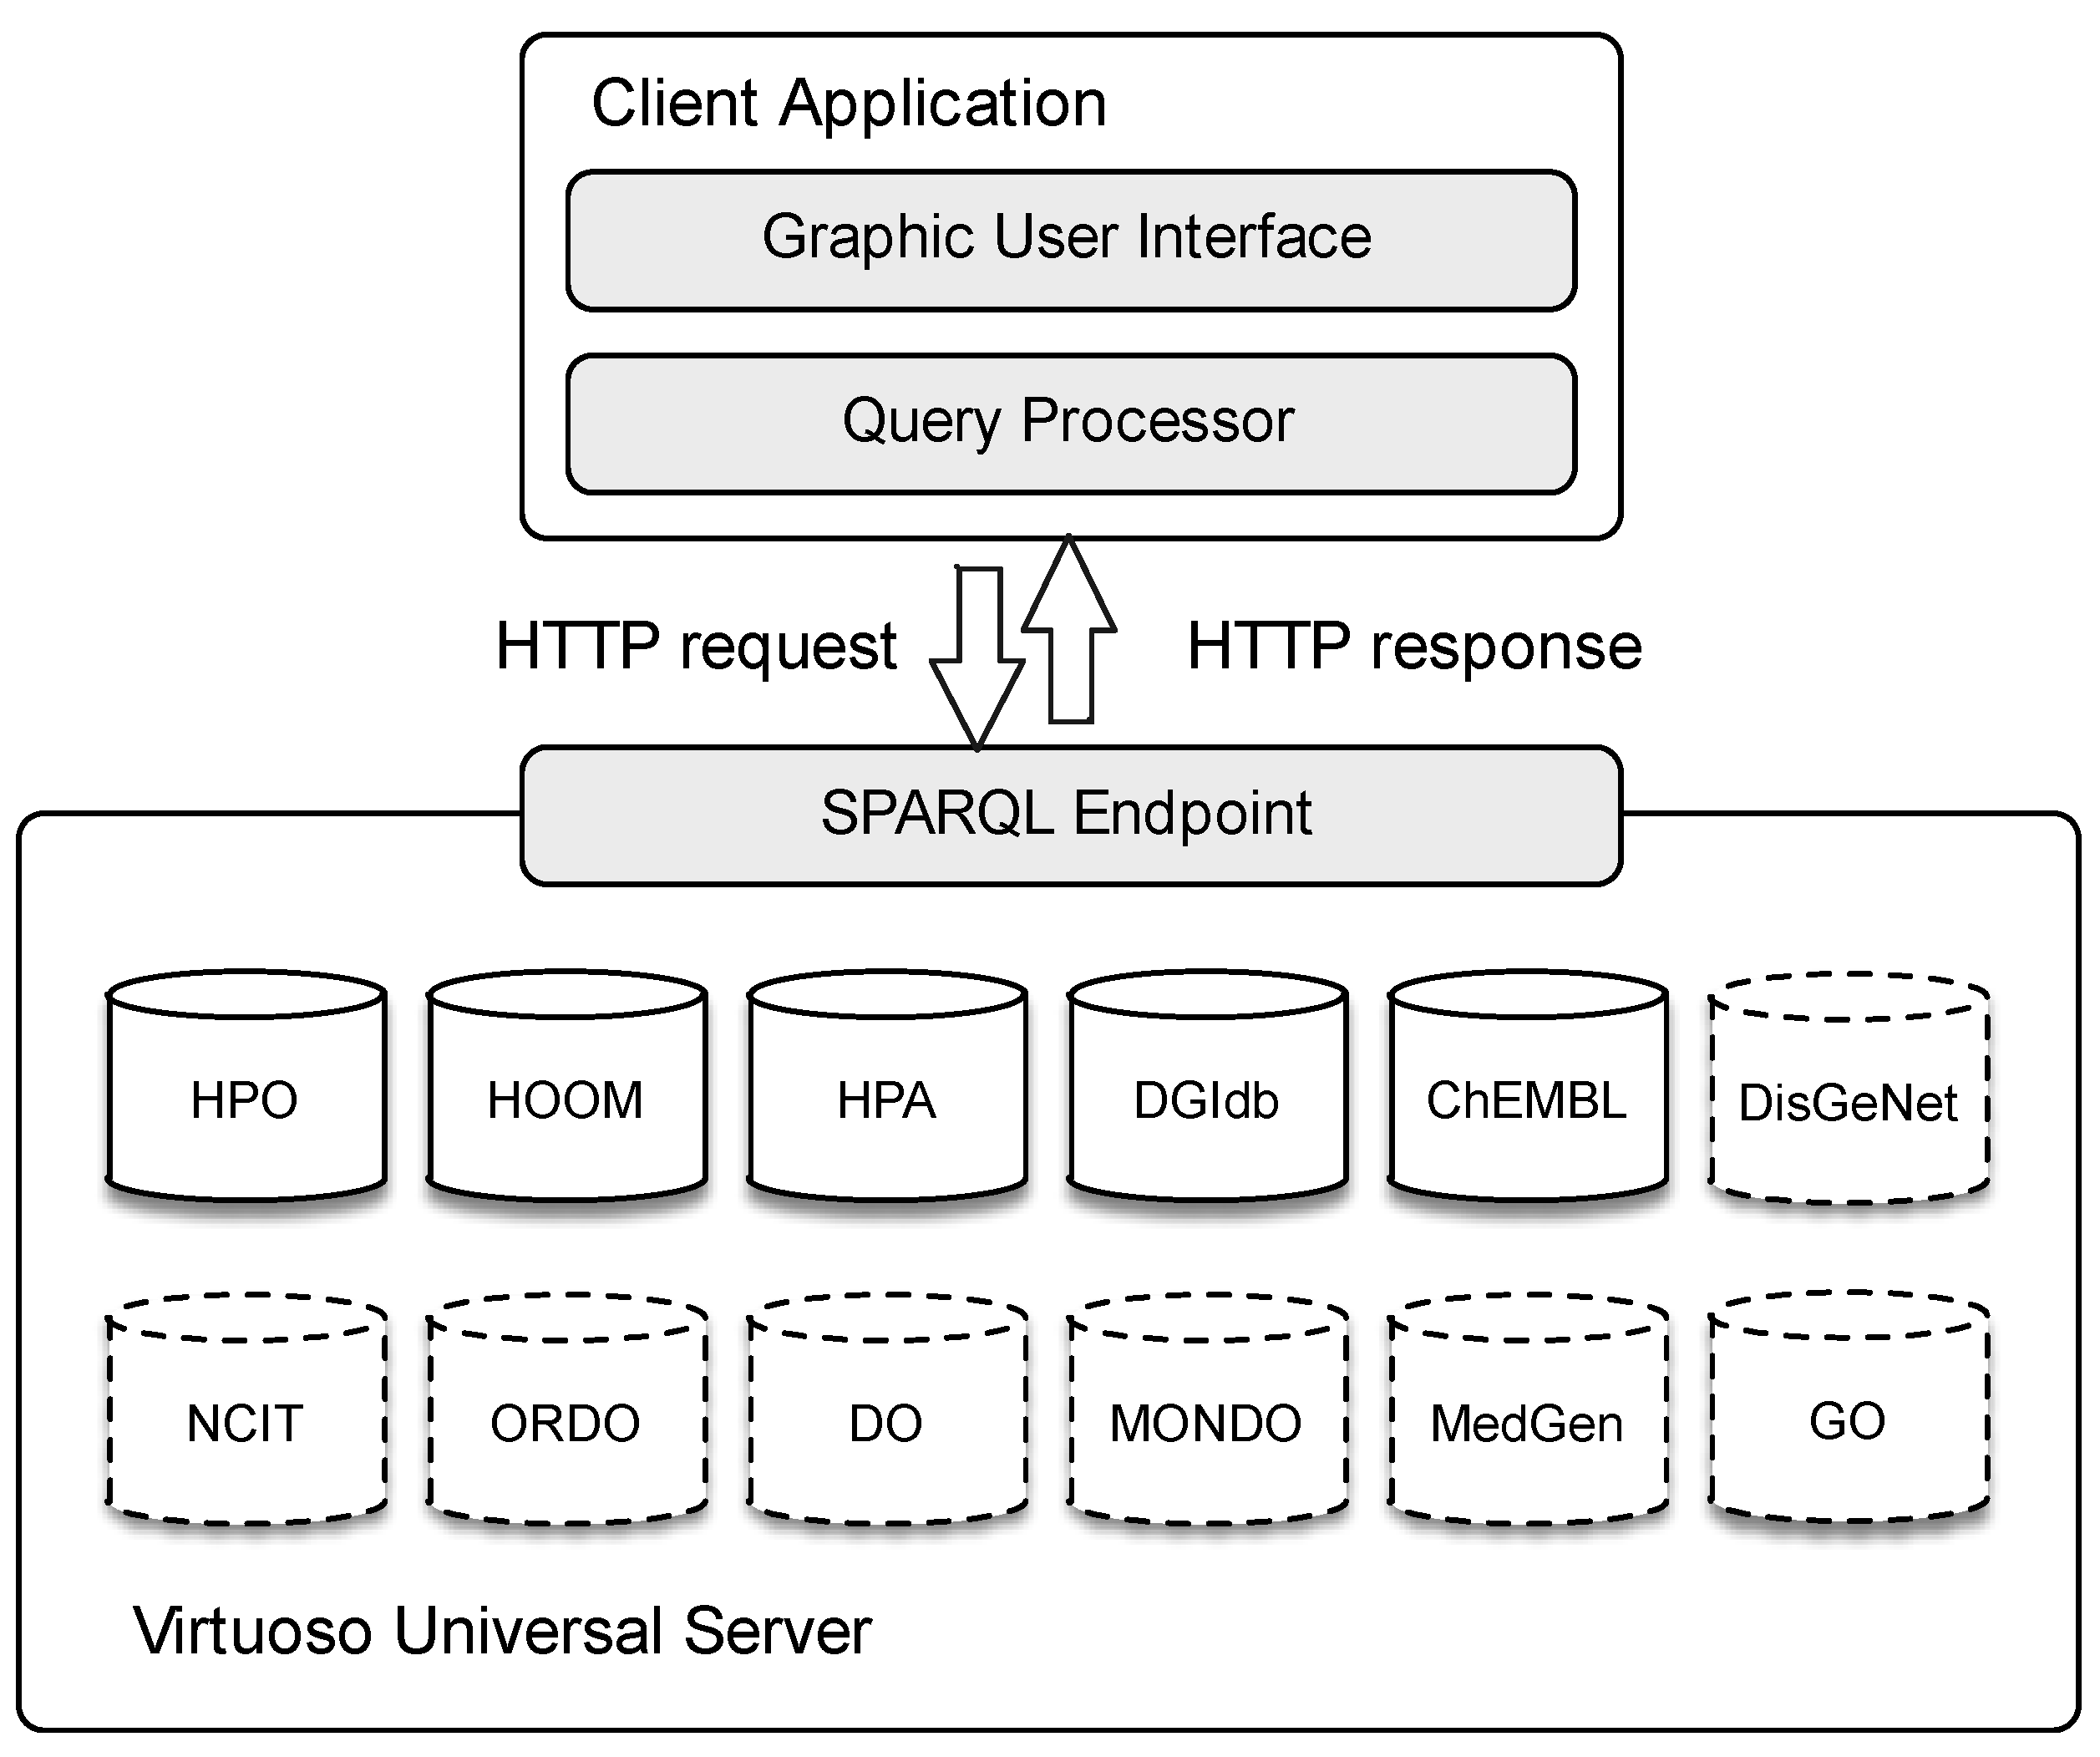
Virtuoso Universal Server as the middleware to store the original biomedical ontologies and databases; such an open-source solution allows us to manage different data formats with several access protocols. We store the original datasets to the server, scheduling periodical updates starting from the original endpoints (not straightly used for performance issues). Our multilayer integration model is also hosted on the same server.
We developed a lightweight Java desktop application to allow quick and easy user interaction. A visual interface is provided to specify input queries, which are in turn translated as SPARQL sequences and forwarded via HTTP to the server. Obtained results are shown graphically to the user. For RDF and SPARQL management, our client application relies on the Jena Framework. We also use
OWL API for the client-side manipulation of OWL ontologies.
Figure 6 summarizes our system architecture highlighting the main modules. Notice that the dashed dataset comes from the previous version.
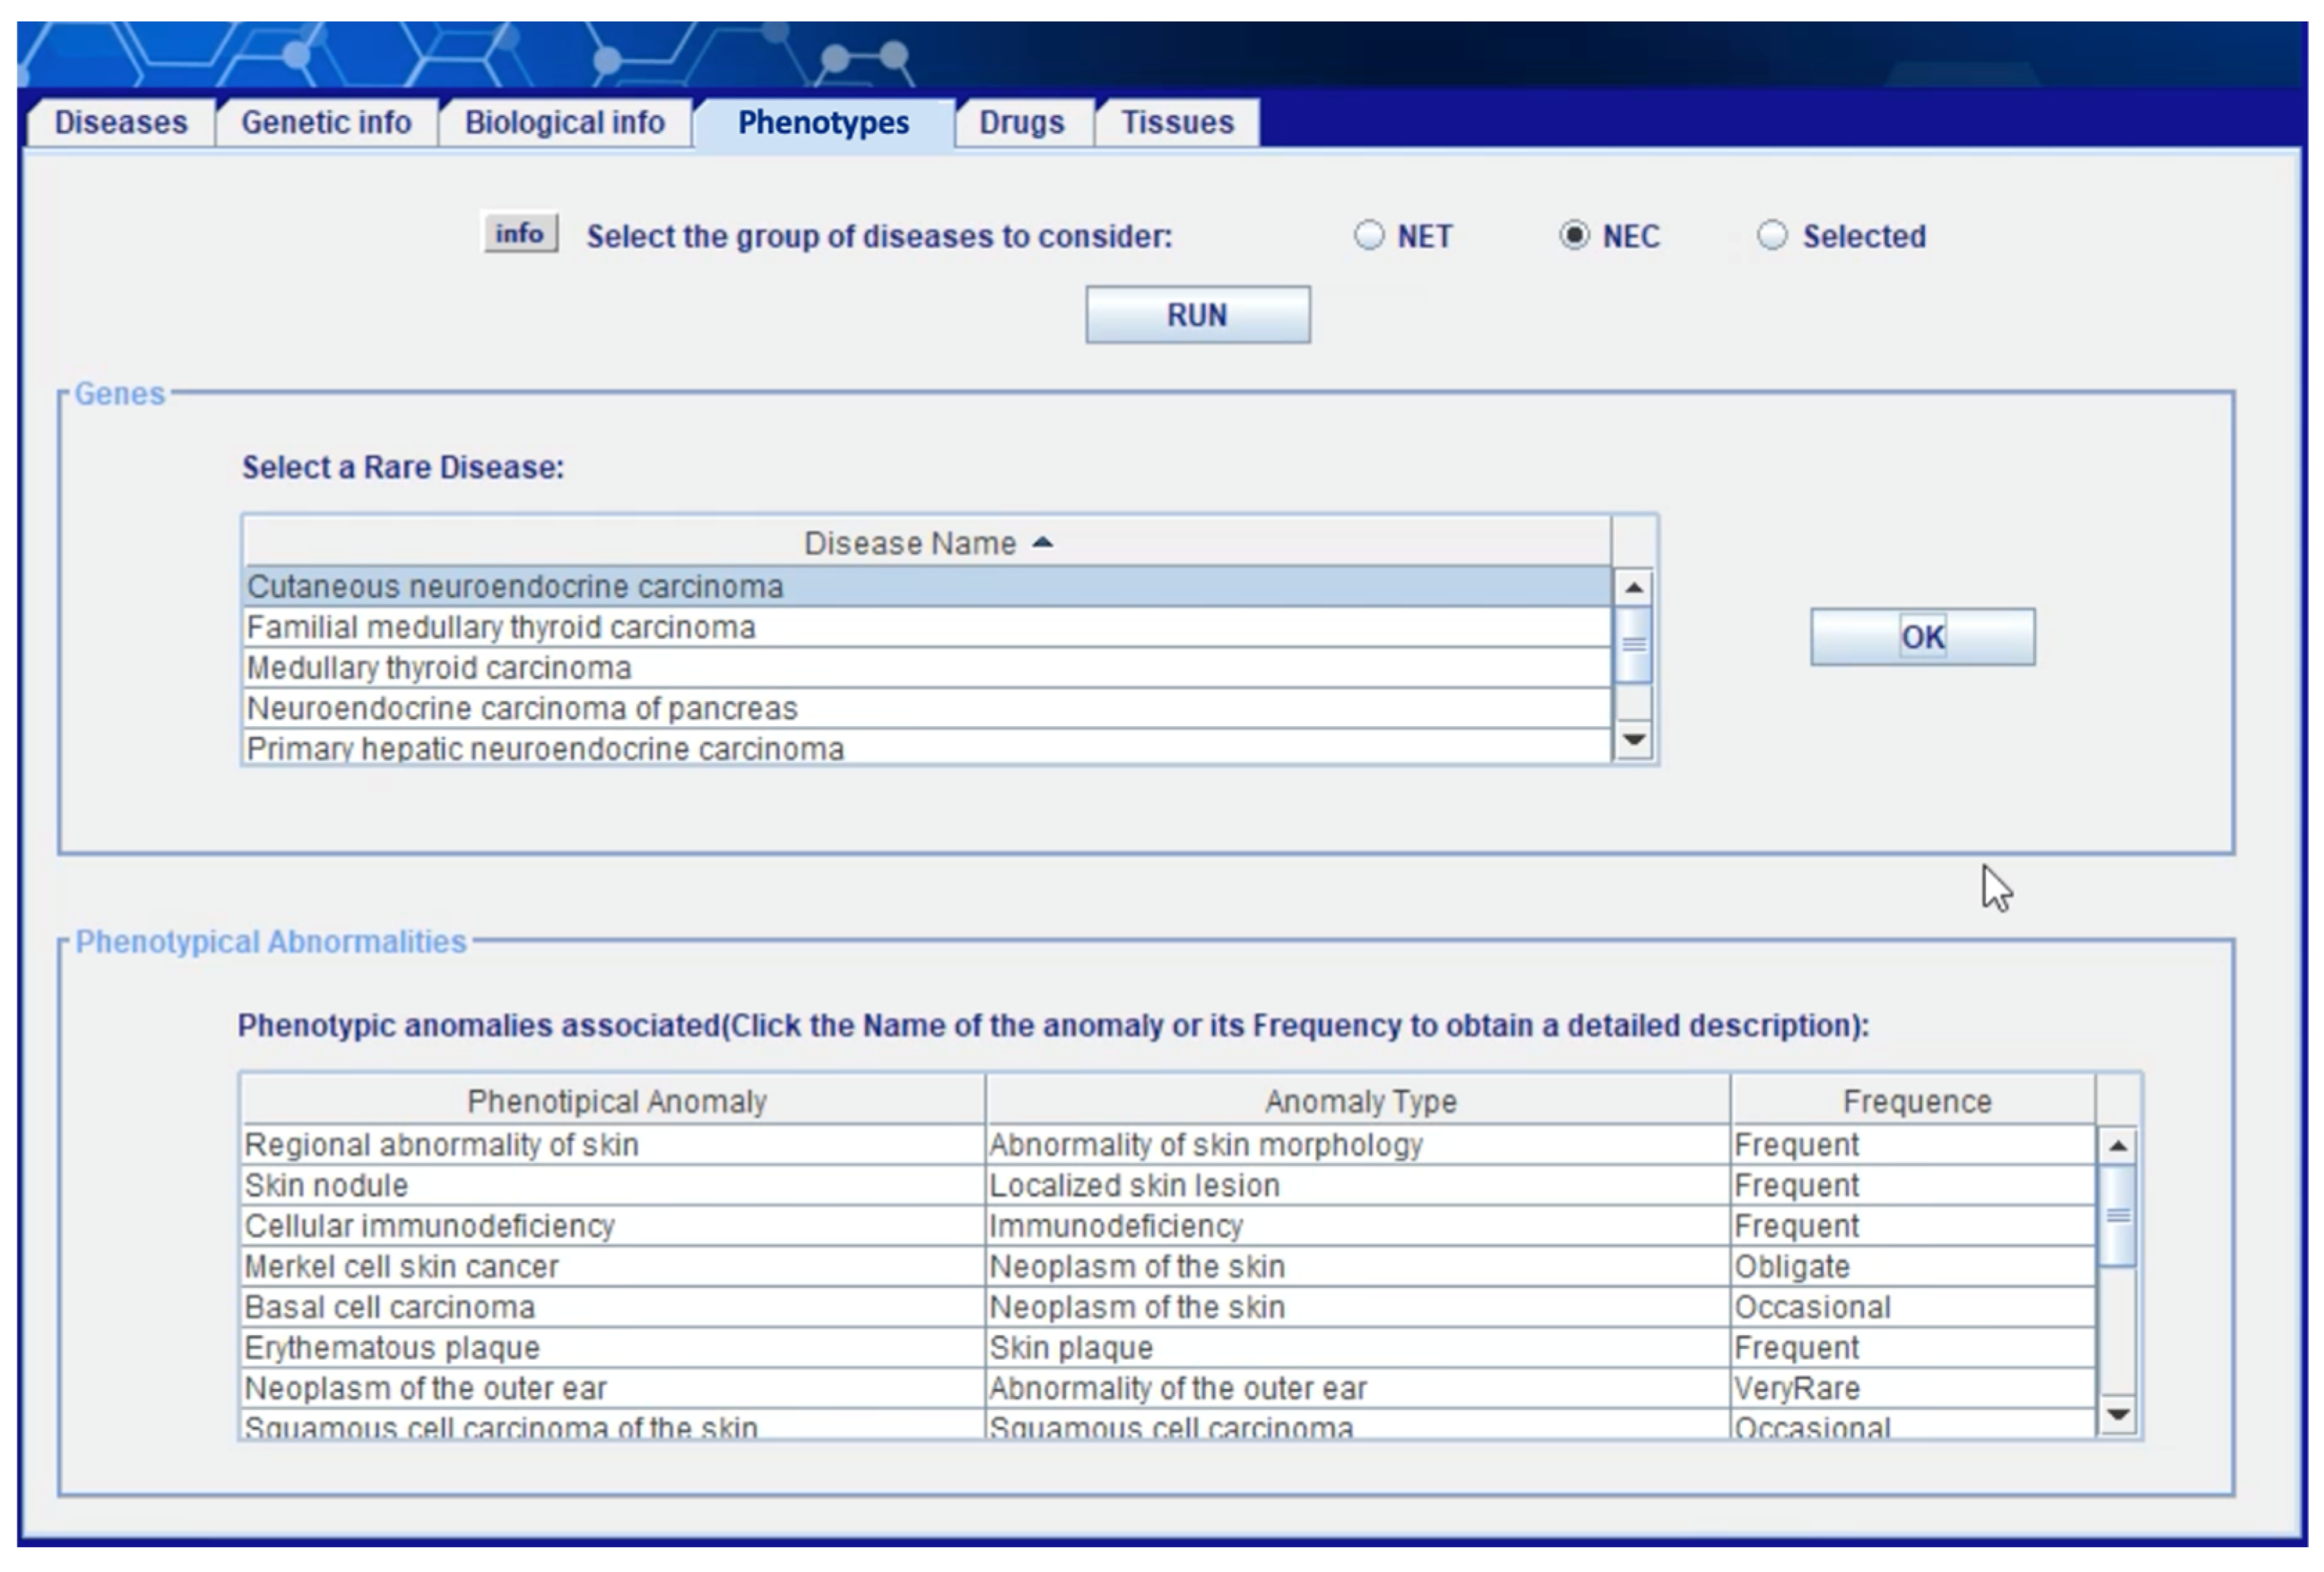
Figure 7 shows the “phenotypes” section of the client application. Once the user has selected a subset of NETs and/or NECs from the “diseases” area—see (Capuano, Foggia, Greco, and Ritrovato, 2022)—this section allows him to obtain the phenotypic anomalies associated with the selected diseases. The user can decide whether to carry out the analysis only on the previously selected diseases or not. The information obtained in this phase is extracted from layer 1b (see
Section 4.1) starting from the rare diseases present in the ORDO ontology, and then extrapolating the associations with the anomalies in ORDO-HOOM and finally the information relating to the anomalies in HPO. The user can click on the
name of the anomaly and on the
frequency value to get more information.
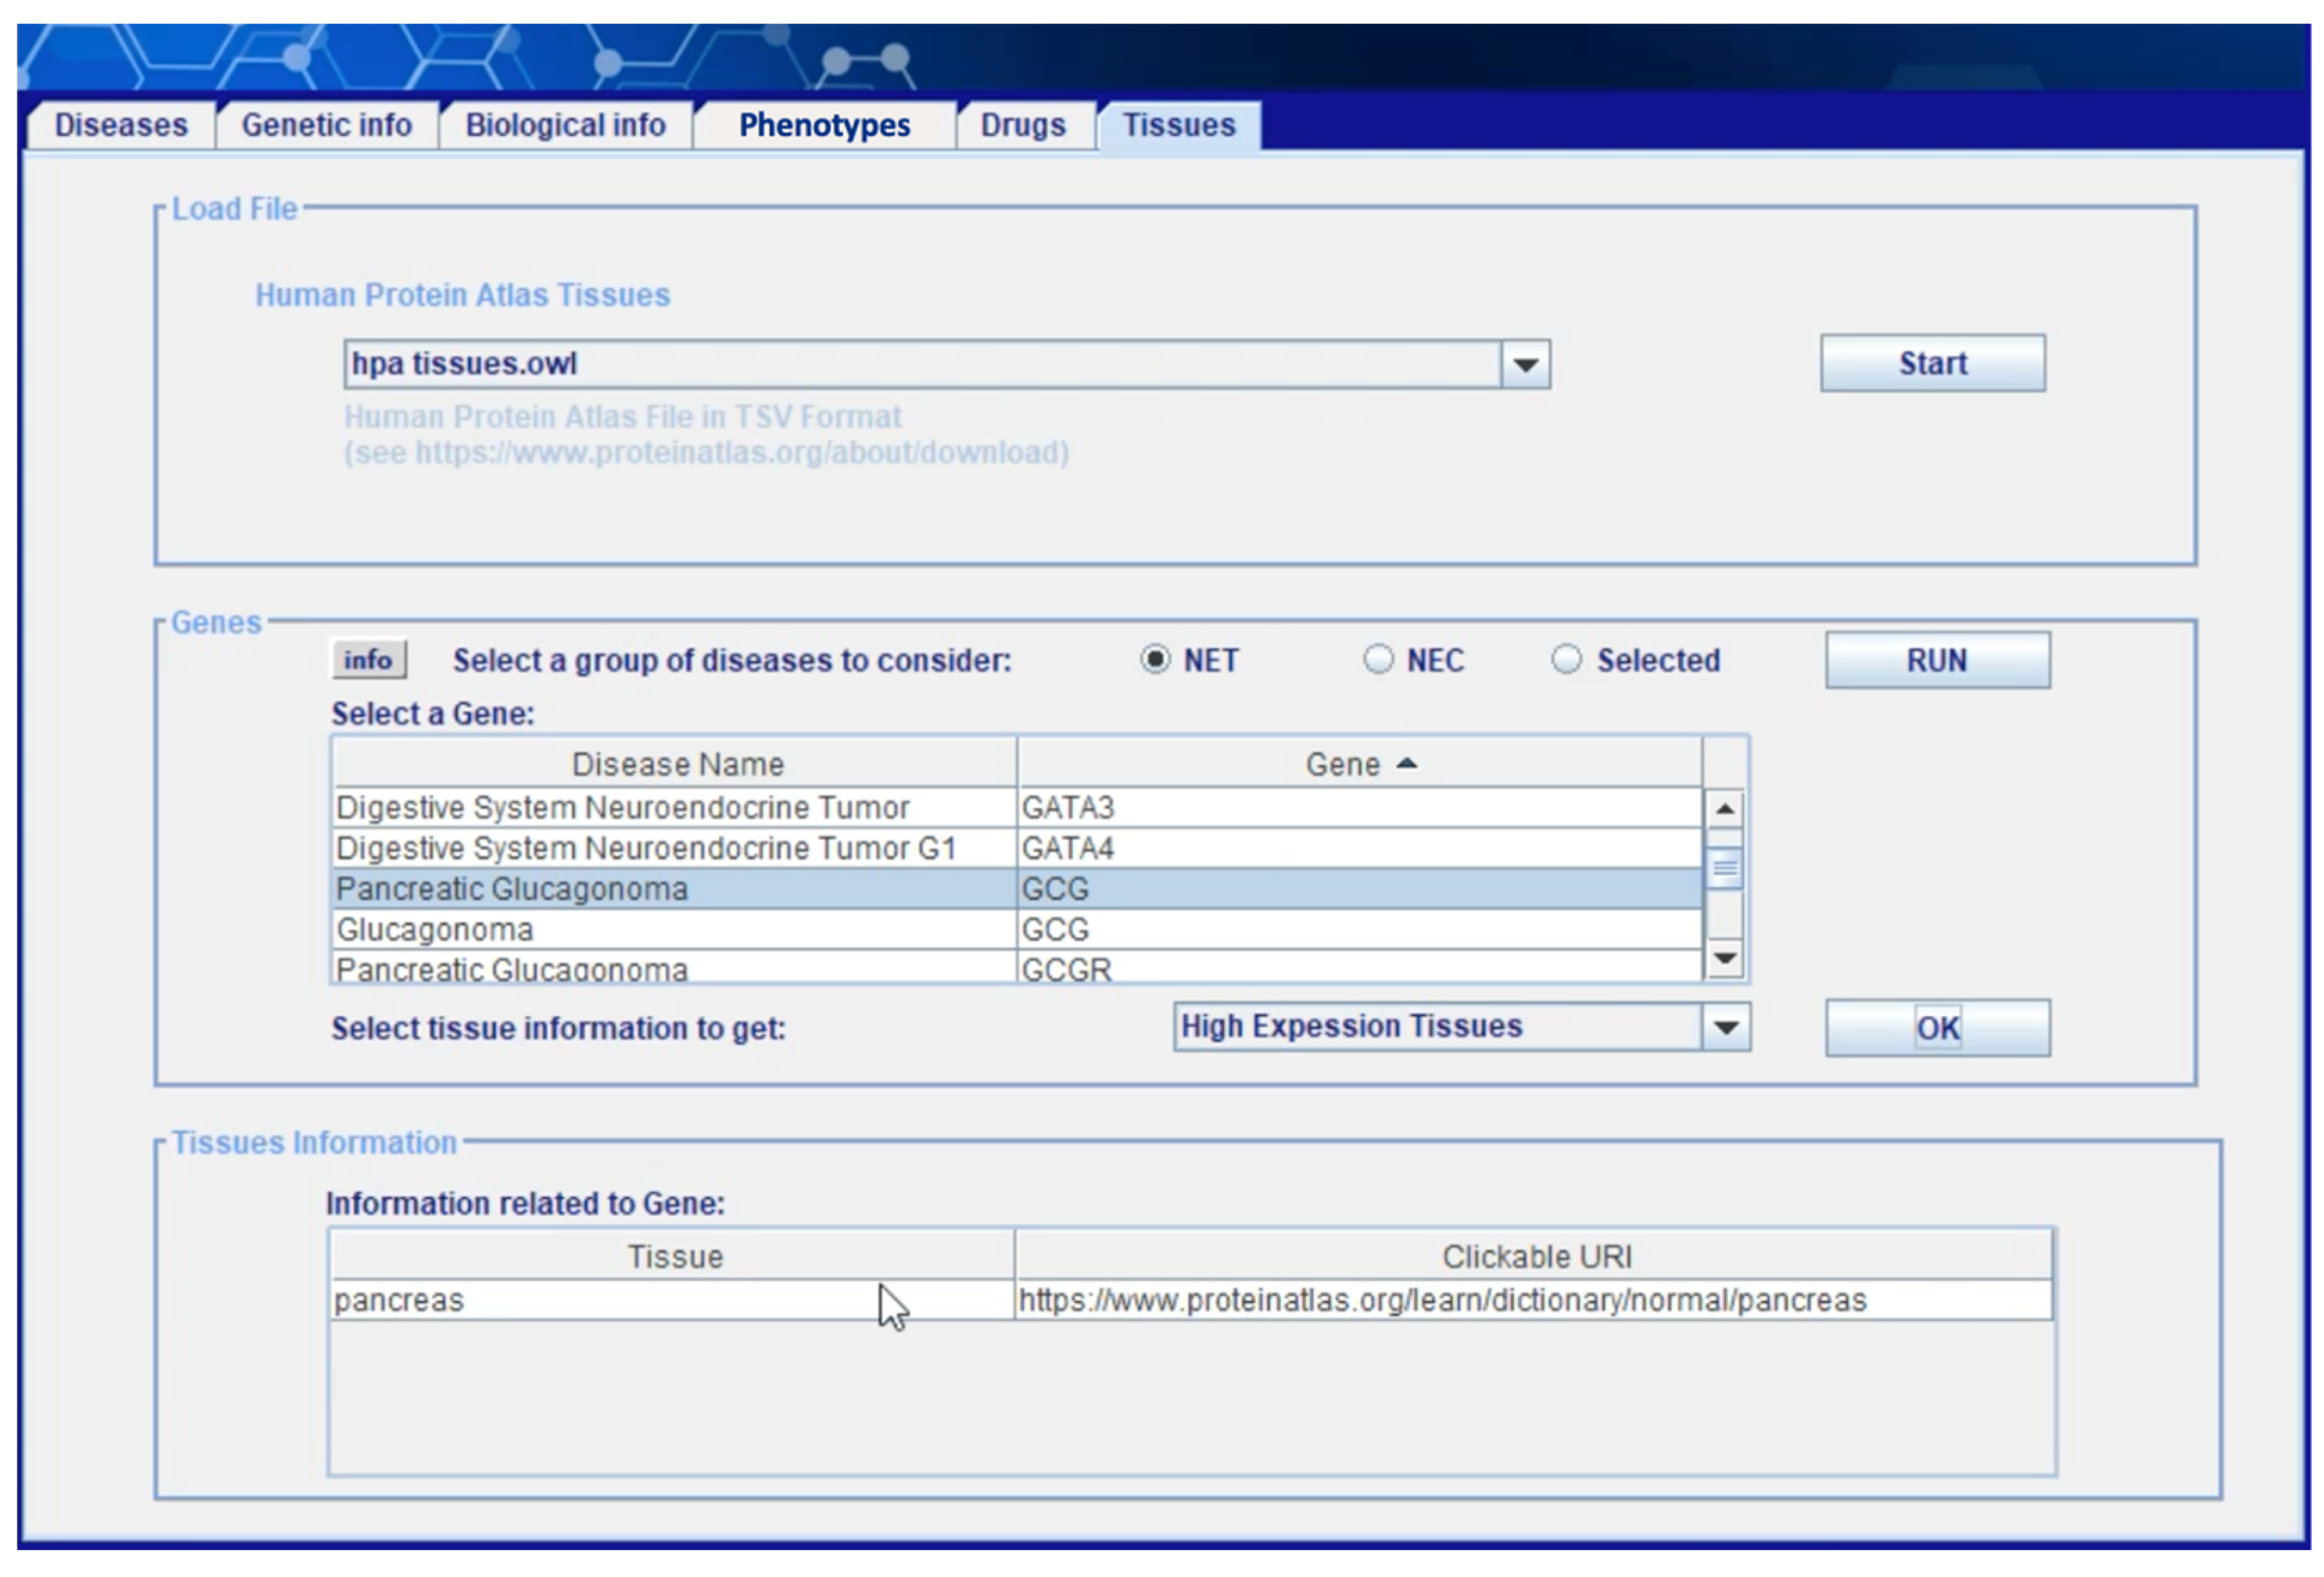
Figure 8 shows the “tissue” section of the client application. Information about the human tissues in which a neoplasm can occur is extracted from layer 4 (see
Section 4.2) starting from the
Normal Tissue Data Archive of HPA. Once the user has selected a subset of genes involved in NETs and/or NECs under investigation (including gene–disease, variation–disease, and disease–disease associations, cytogenetics anomalies, molecular anomalies, etc.)—through the “genetic information” tab described in (Capuano, Foggia, Greco, and Ritrovato, 2022)—he can obtain here the list of human tissues in which each gene has a medium or high level of expression. Displayed data on each tissue is associated with a link to the online version of HPA where the user can find additional information (see
Figure 9).
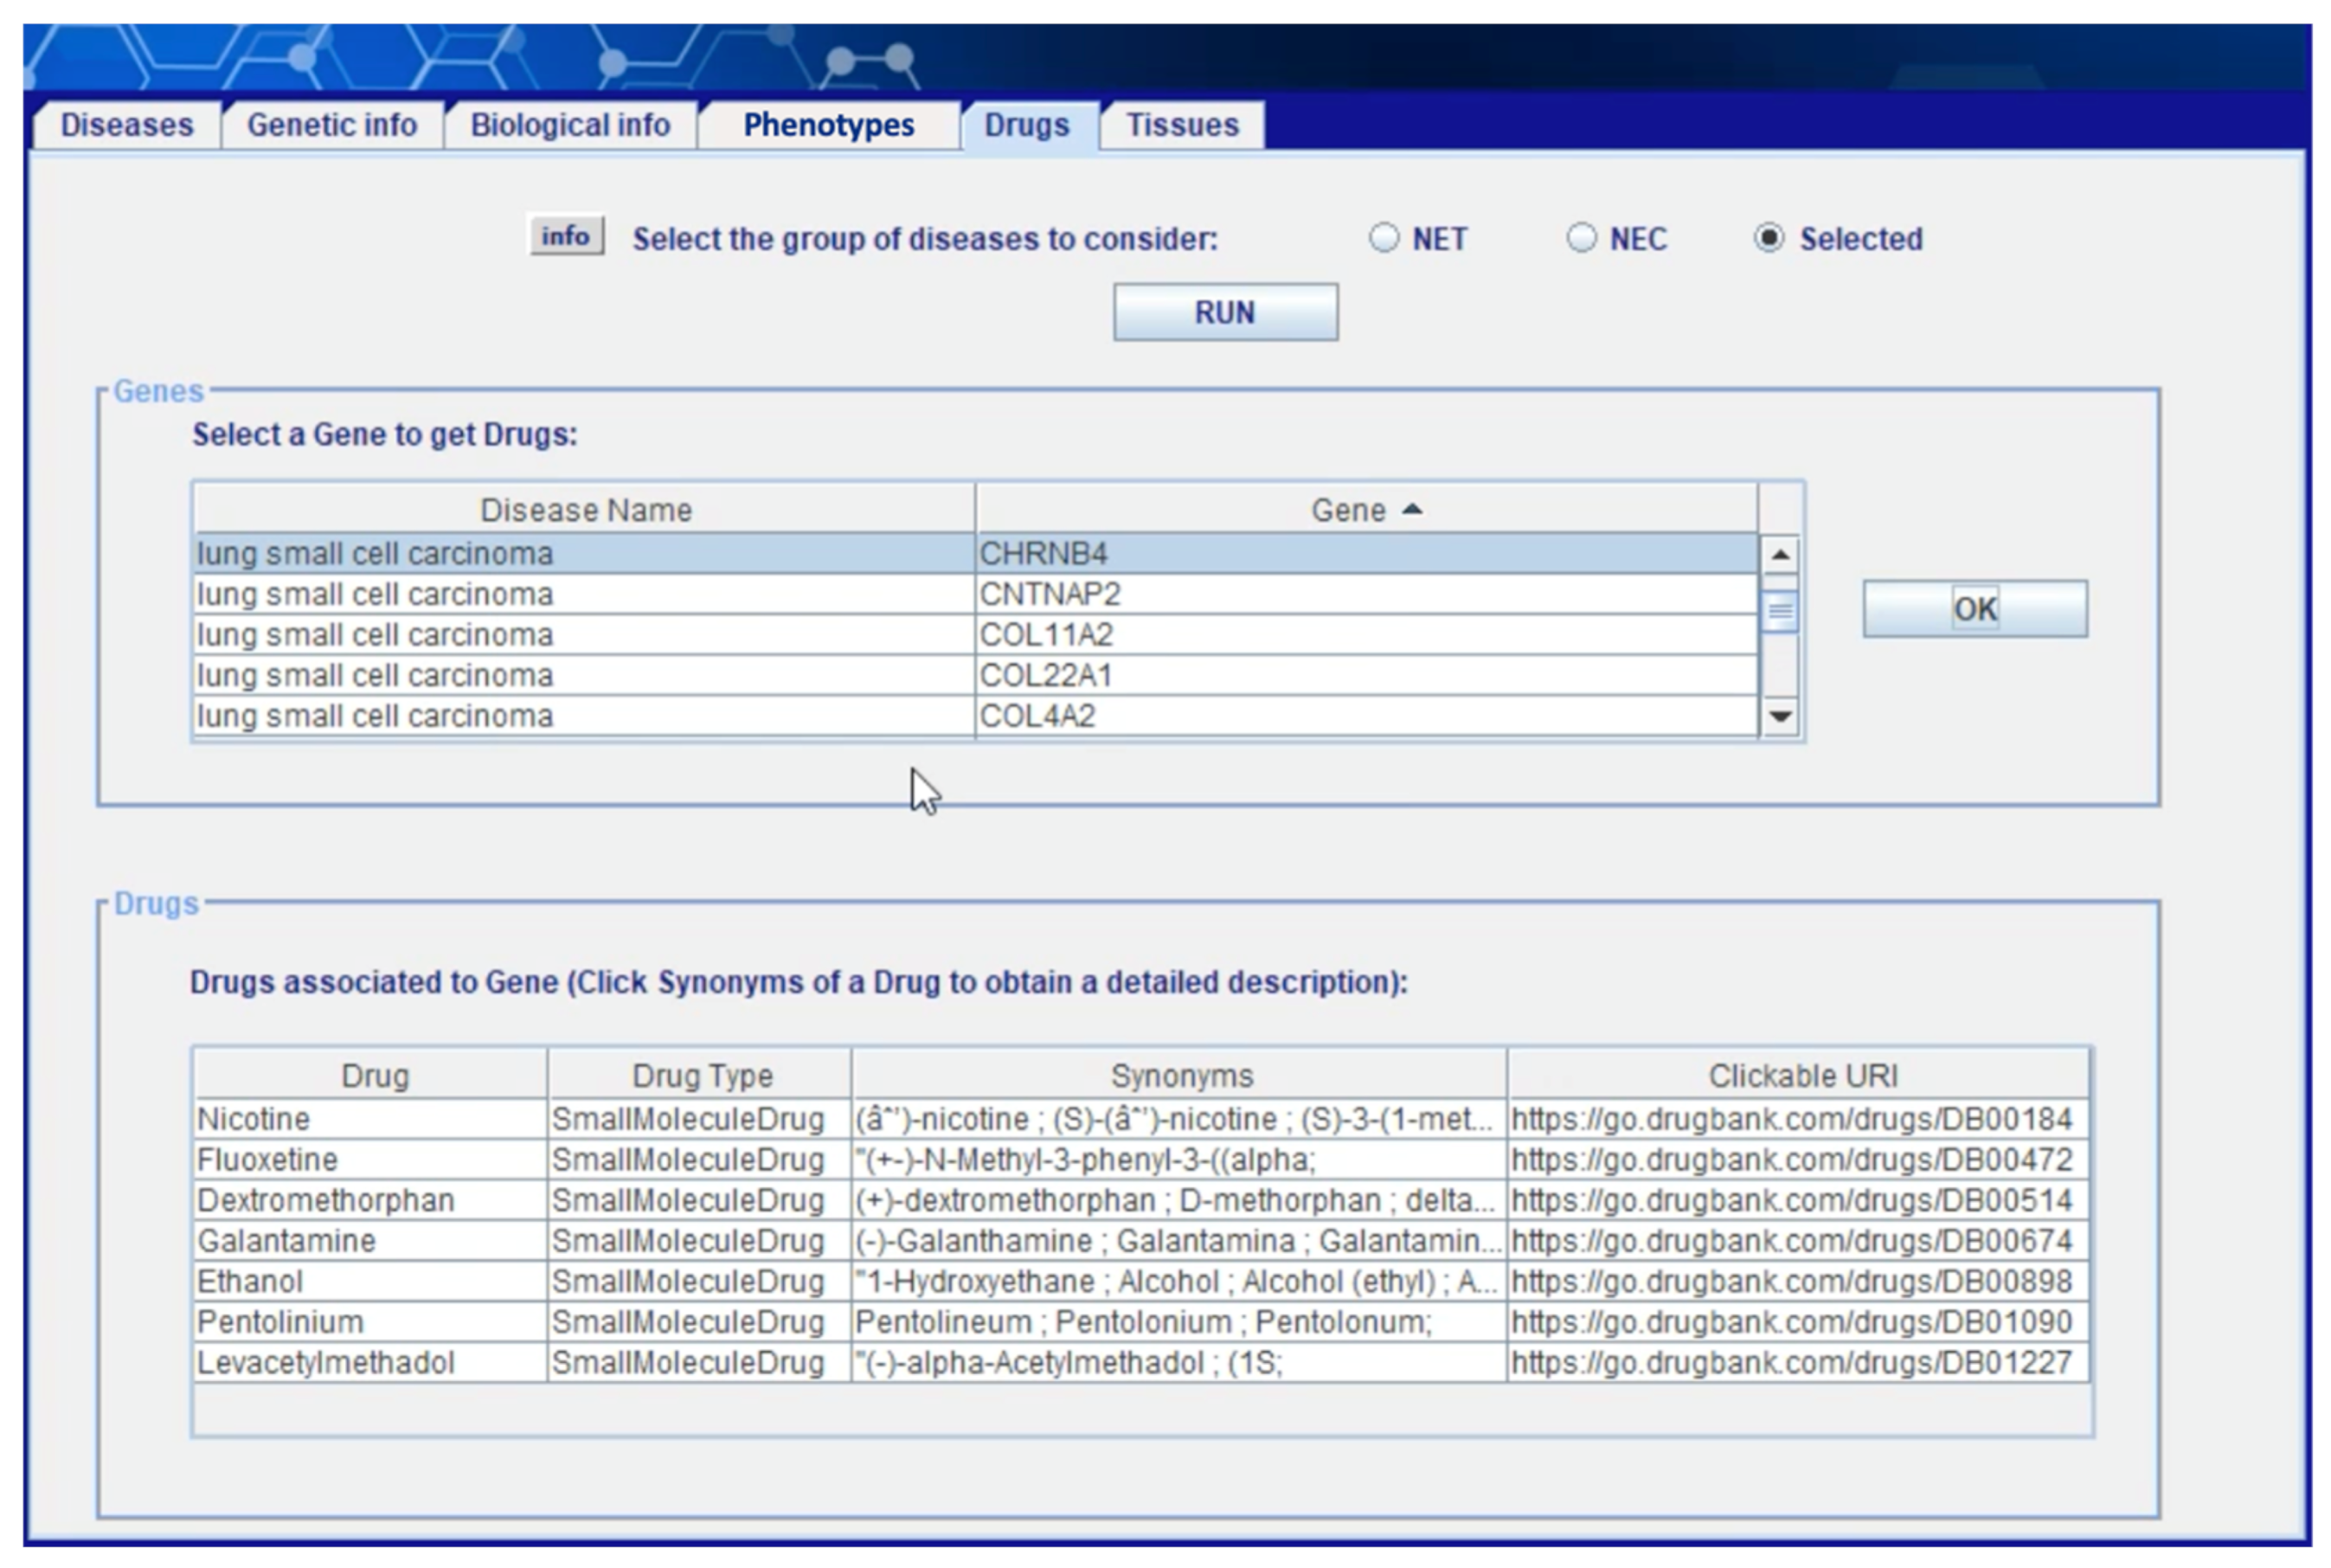
Figure 10 shows the “drugs” section of the client application where the user can obtain information on compounds and drugs that show documented interactions with the genes selected in one of the preceding steps and, as consequence, can potentially impact the associated diseases. The information obtained in this phase is extracted from layer 5 (see
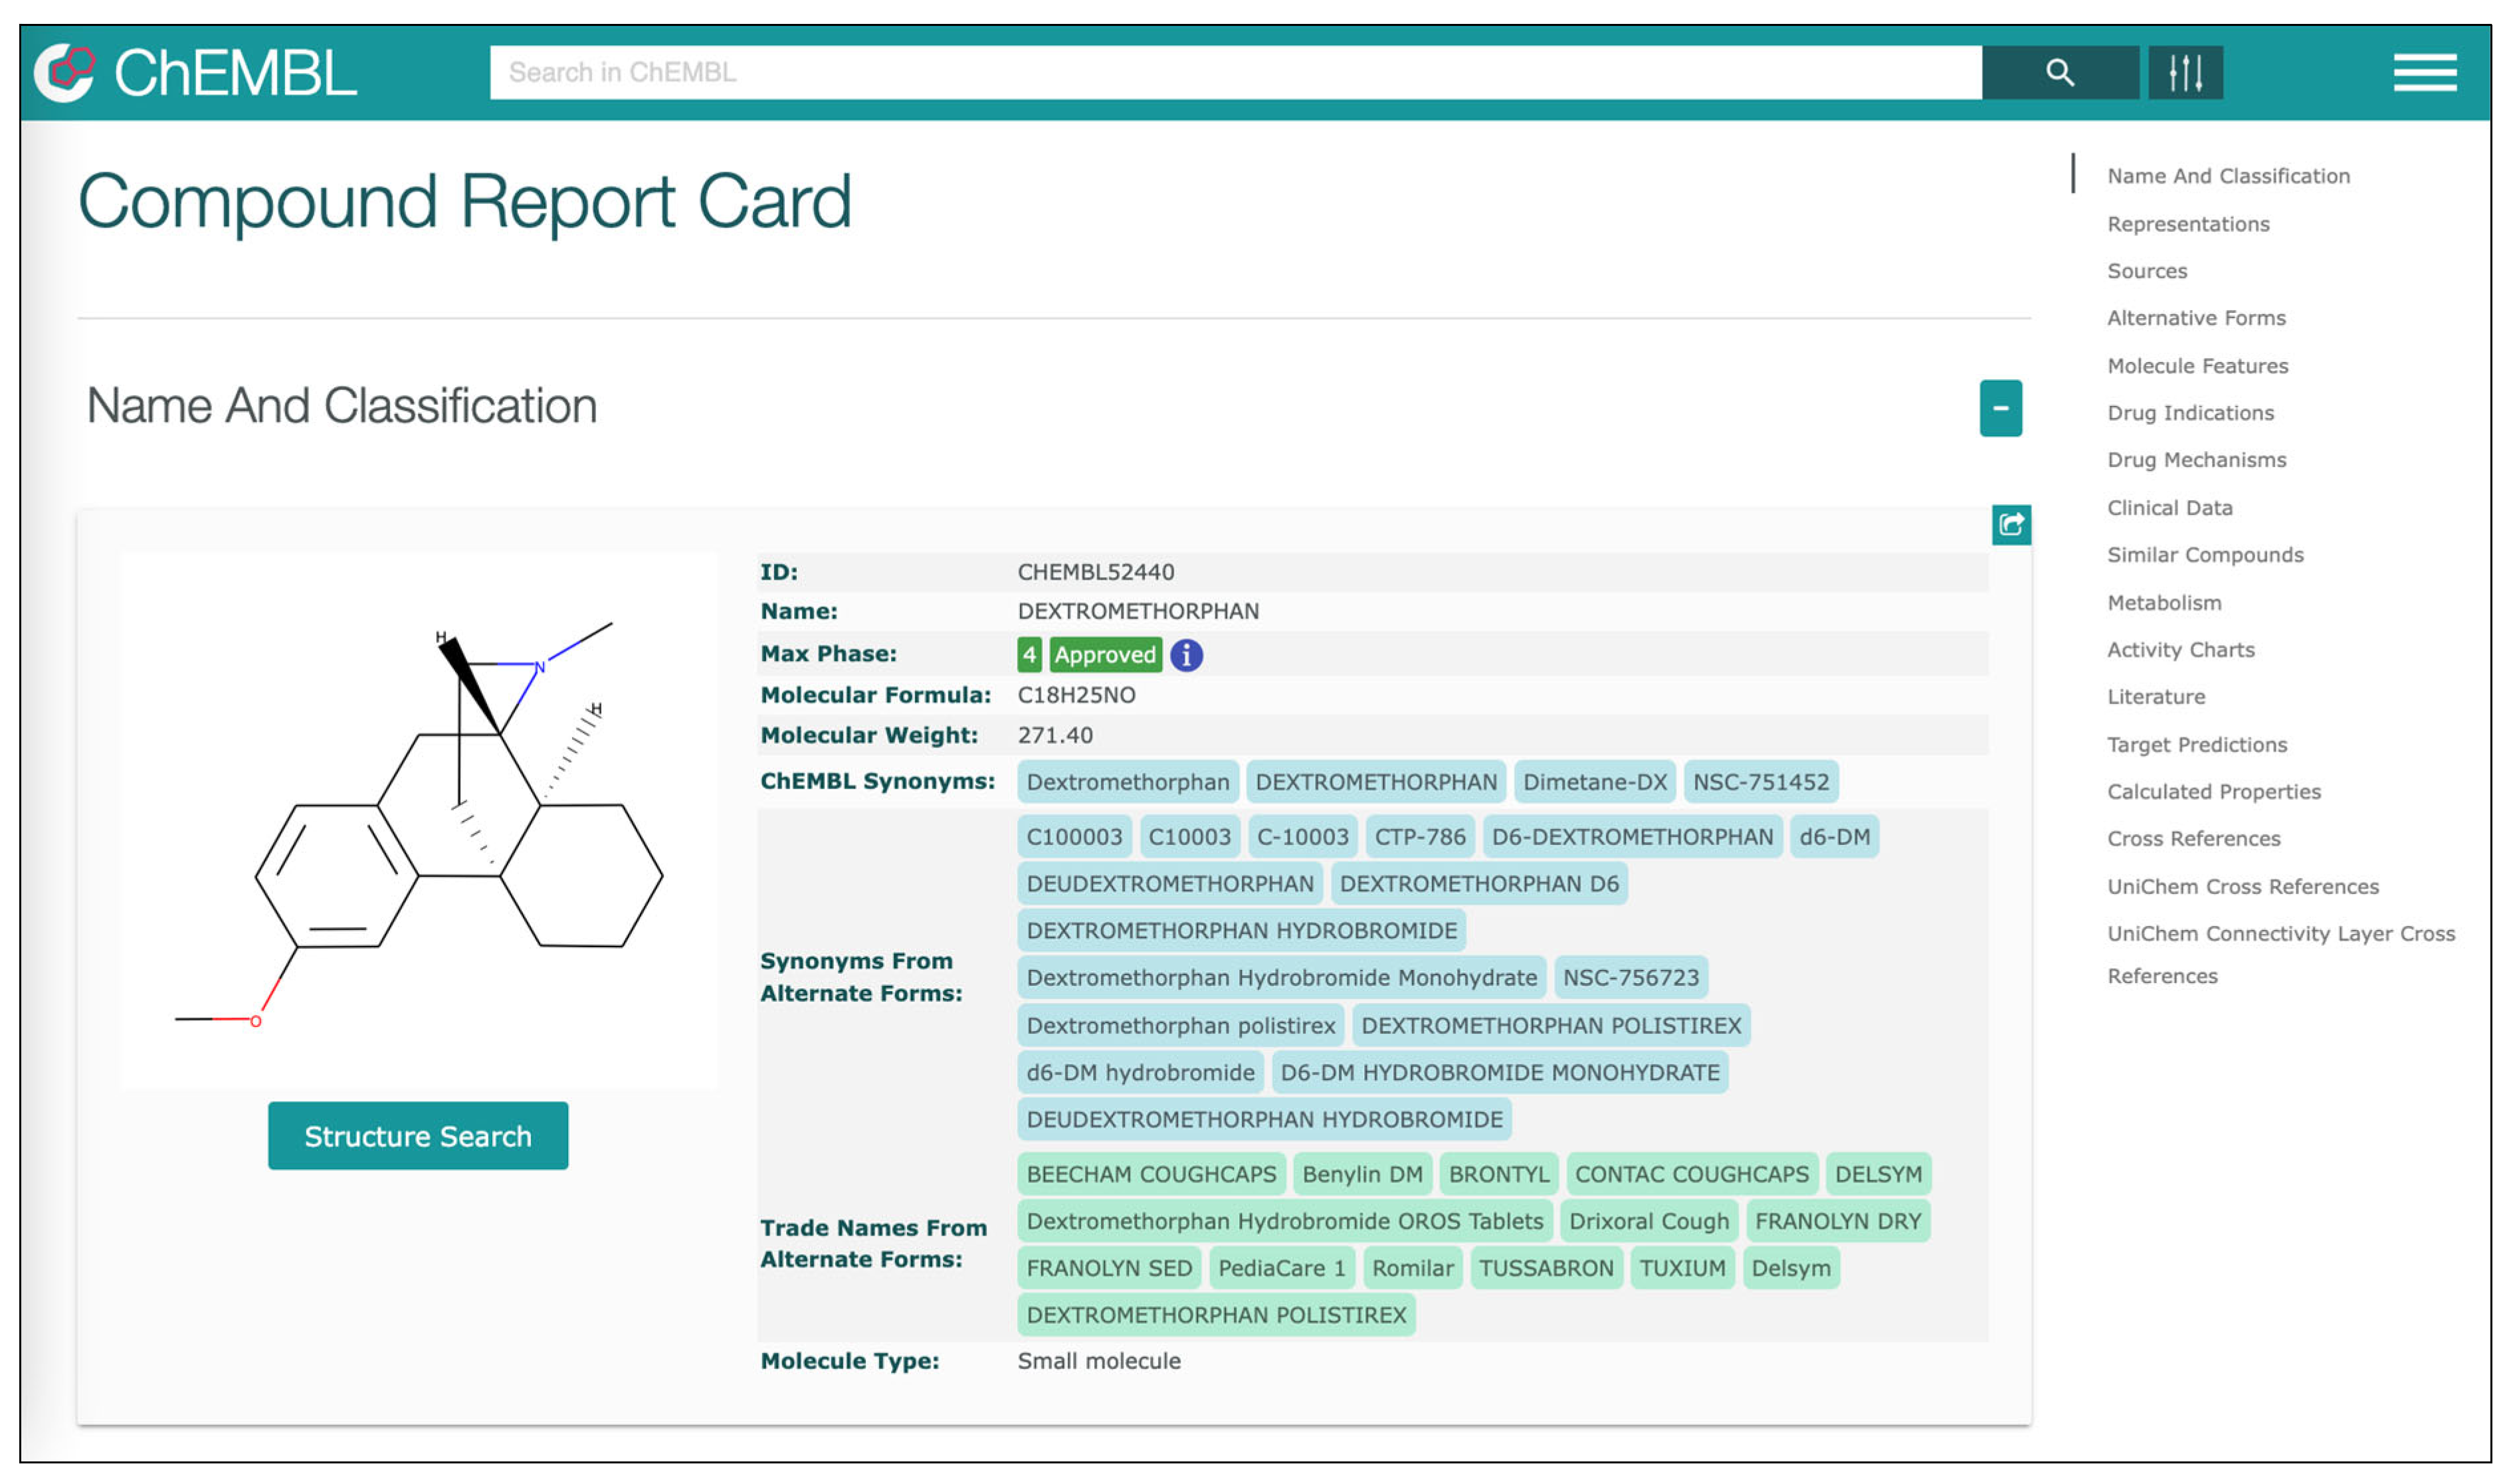
Section 4.3) starting the integration of gene information included in GO with information on drugs included in ChEMBL and drug–gene interactions included in DGIdb. Displayed data on each drug is associated with a link to the online version of ChEMBL where the user can find additional information (see
Figure 11).
A test installation of the server was conducted on a
Linux machine with a 2.3 GHz quad-core Intel Core i7 processor and 16 Gb of RAM. With this hardware configuration, most of the queries are answered in a fraction of a second, and only the most complex ones (that combine information from semantic and non-semantic sources) require longer: in rare cases more than 2 s. These results are in line with recent RDF store benchmarks [
35] which rank Virtuoso Universal Server as one of the fastest triple stores for both instant and analytical queries.
Our system validation was performed with the contribution of a domain expert that helped verify the consistency and correctness of the ontological knowledge as well as the quality of the alignment between the information sources. We adopted an iterative approach where the expert was asked to use the system and provide feedback; this allowed us to improve the level of alignment [
36]. In the specific case, two validation iterations led to satisfactory results.
6. Conclusions and Further Work
In this paper, we have described the extension of previous research work aimed at designing and implementing a domain-specific linked data application for integrating relevant biomedical information on NENs. Additional biomedical aspects covered by the updated model include the phenotypic anomalies linked to these diseases, the involved human tissues, and the documented pharmacological interactions of existing drugs and compounds. Through the alignment and the integration of existing semantic and non-semantic biomedical sources, we were able to compose a knowledge base as a multilayer network managed through a multi-model database providing polyglot persistence. The model can be easily navigated and queried using a client application that provides a user-friendly graphical interface.
Several directions of extension of the proposed system can be envisaged. On the one hand, there is the possibility of integrating additional information sources within existing layers (integrating aspects already considered) as well as on additional layers (considering further aspects). On the other hand, it would be possible to apply the model to a connected biomedical domain, for example considering a different subset of rare diseases. The experimentation of the proposed system with researchers and professionals involved in the treatment of this type of neoplasms is also foreseen to collect feedback for system improvement as well as to assess the risks and critical success factors associated with the introduction of this kind of technology in real medical contexts [
37].
Beyond the specific domain, the paper introduces and analyzes a way to integrate heterogeneous data sources, capable of being adapted to other contexts. Linked data makes the possible aggregation of information quite unlimited. Each information level can be enriched with further details so that the system becomes increasingly useful for user support. On the other hand, the multi-layer organization would help to deal with the variety of information in a more organized and governable way.
Another promising research direction is the application of existing metrics, such as those defined in [
38], to measure the quality of the integrated knowledge model in terms of
relationship richness,
attribute richness,
inheritance richness, etc. Indeed, evaluating such metrics on the integrated model, which includes ontological and non-ontological information, could be an interesting but challenging task that would require revising the definition of such metrics to support hybrid models. Moreover, approaches to automatic ontology alignment could be investigated and incorporated into the proposed system as integrated schemas.


