
An Accelerated Degradation Durability Evaluation Model for the Turbine Impeller of a Turbine Based on a Genetic Algorithms Back-Propagation Neural Network


Abstract
:1. Introduction
2. Characterization Parameters of the Turbine Impeller Degradation Failure Mechanism for a Bench Test
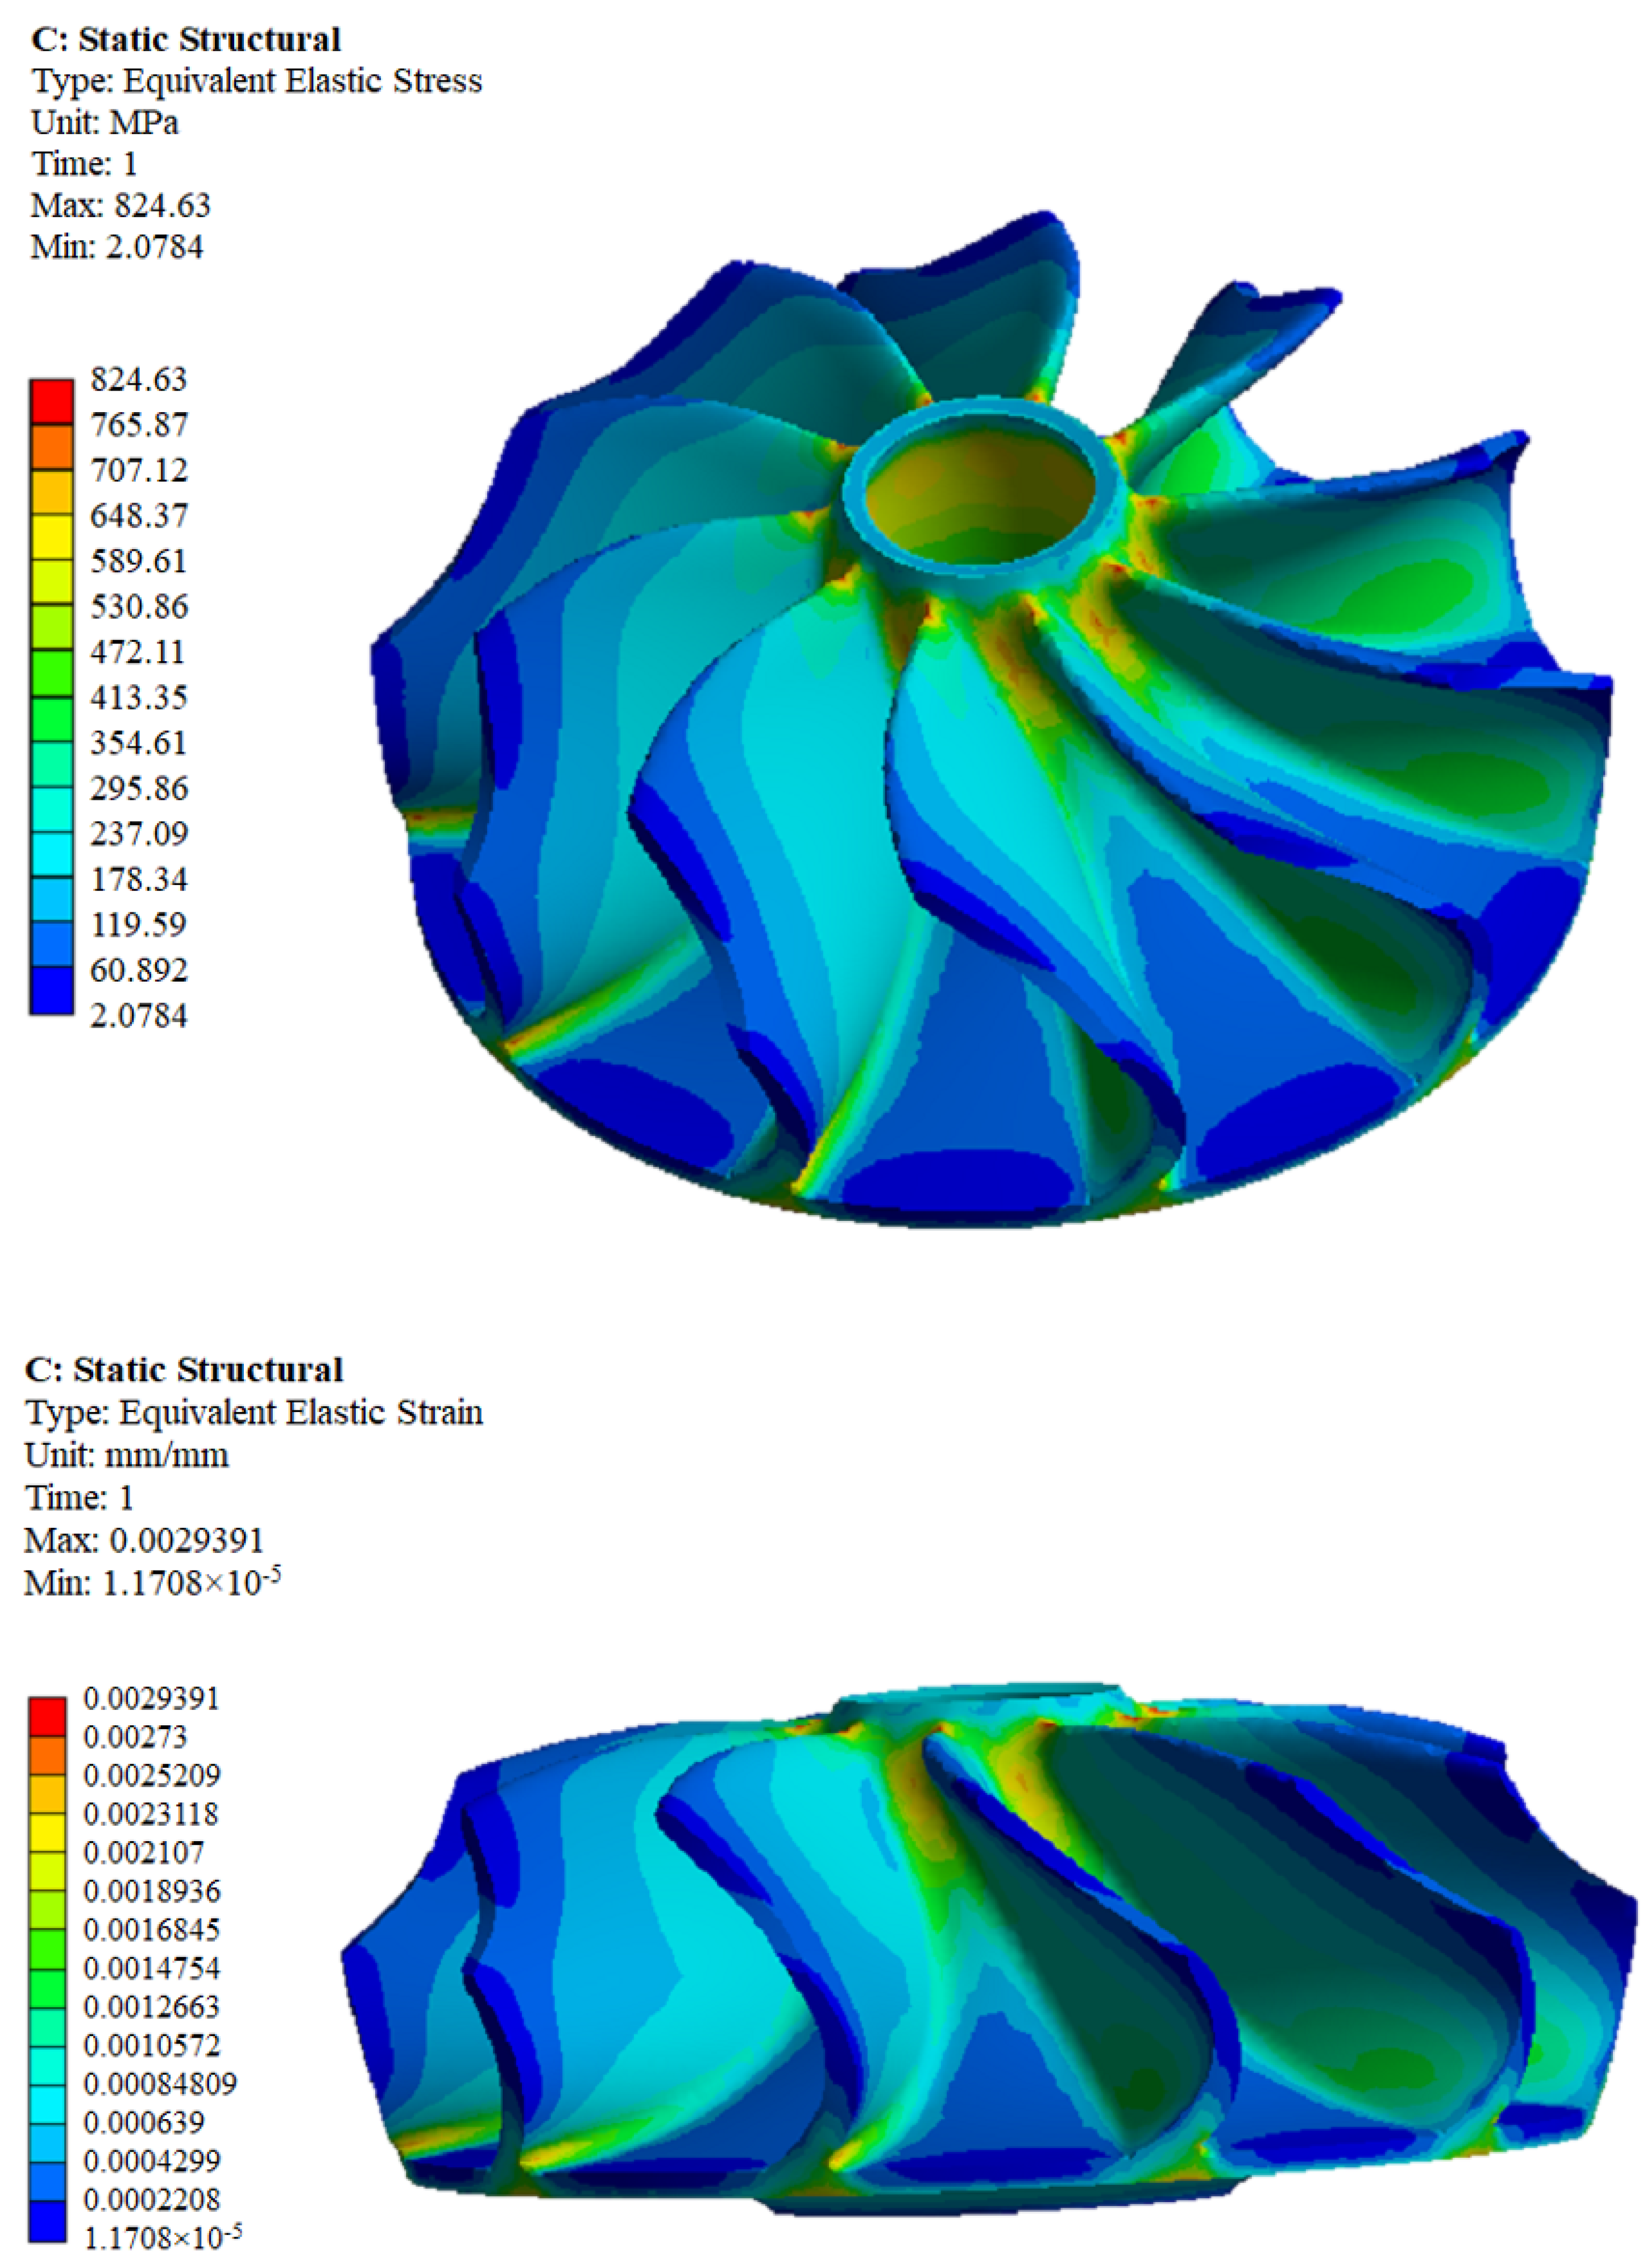
2.1. Failure Mechanism and Sensitive Stress Analysis
2.2. Determining the Sensitive Stress
- As shown in Figure 2, the 120-h turbocharger standard structure assessment test includes three stages: (i) The first stage is the 100-h endurance performance test under constant stress. (ii) The second stage is the 5-min over-temperature and over-velocity test. (iii) The third stage is the 20-cycle alternating stress test. The endurance performance is assessed throughout the whole test cycle. However, the 20 cycles of the alternating stress test are very limited for fatigue performance assessment. Therefore, the assessment of endurance performance for a turbine impeller is more important in this case.
- As can be seen in Table 1, the test profile of the 350-h complete machine test for a diesel engine is mainly composed of four working conditions. Condition 1 is the calibration speed, and the torque is in accordance with the external characteristics. Condition 2 is 85–90% of the standard speed, and the torque is in accordance with the external characteristics. Condition 3 is 80% of the standard speed, and the torque is per the external characteristics. Condition 4 is the maximum torque speed, and the torque is the maximum torque. Condition 1–Condition 3 account for a high percentage of the entire test cycle, and the supercharger speed is generally not high during the no-load operation. In addition, the test is conducted in one cycle of 10 h, with 35 cycles in total. For a turbine impeller, the alternating stress test is very limited for fatigue performance assessment. Therefore, the test also mainly assesses the endurance performance of a turbine impeller.
3. The Performance Degradation Model Based on a BP Neural Network
3.1. Data Process
3.1.1. Data Expansion
3.1.2. Data Normalization
3.2. Construction of a Turbine Performance Degradation Model Based on the Material Endurance Limit
3.2.1. Define the Network Structure
3.2.2. Determine the Network Parameter
3.2.3. Select the Excitation Function
3.2.4. Select the Training Algorithm
3.2.5. Determine the Basic Elements of the GA
3.2.6. Modeling
3.3. Turbine Endurance Limit Calculation Model
4. Results Analysis
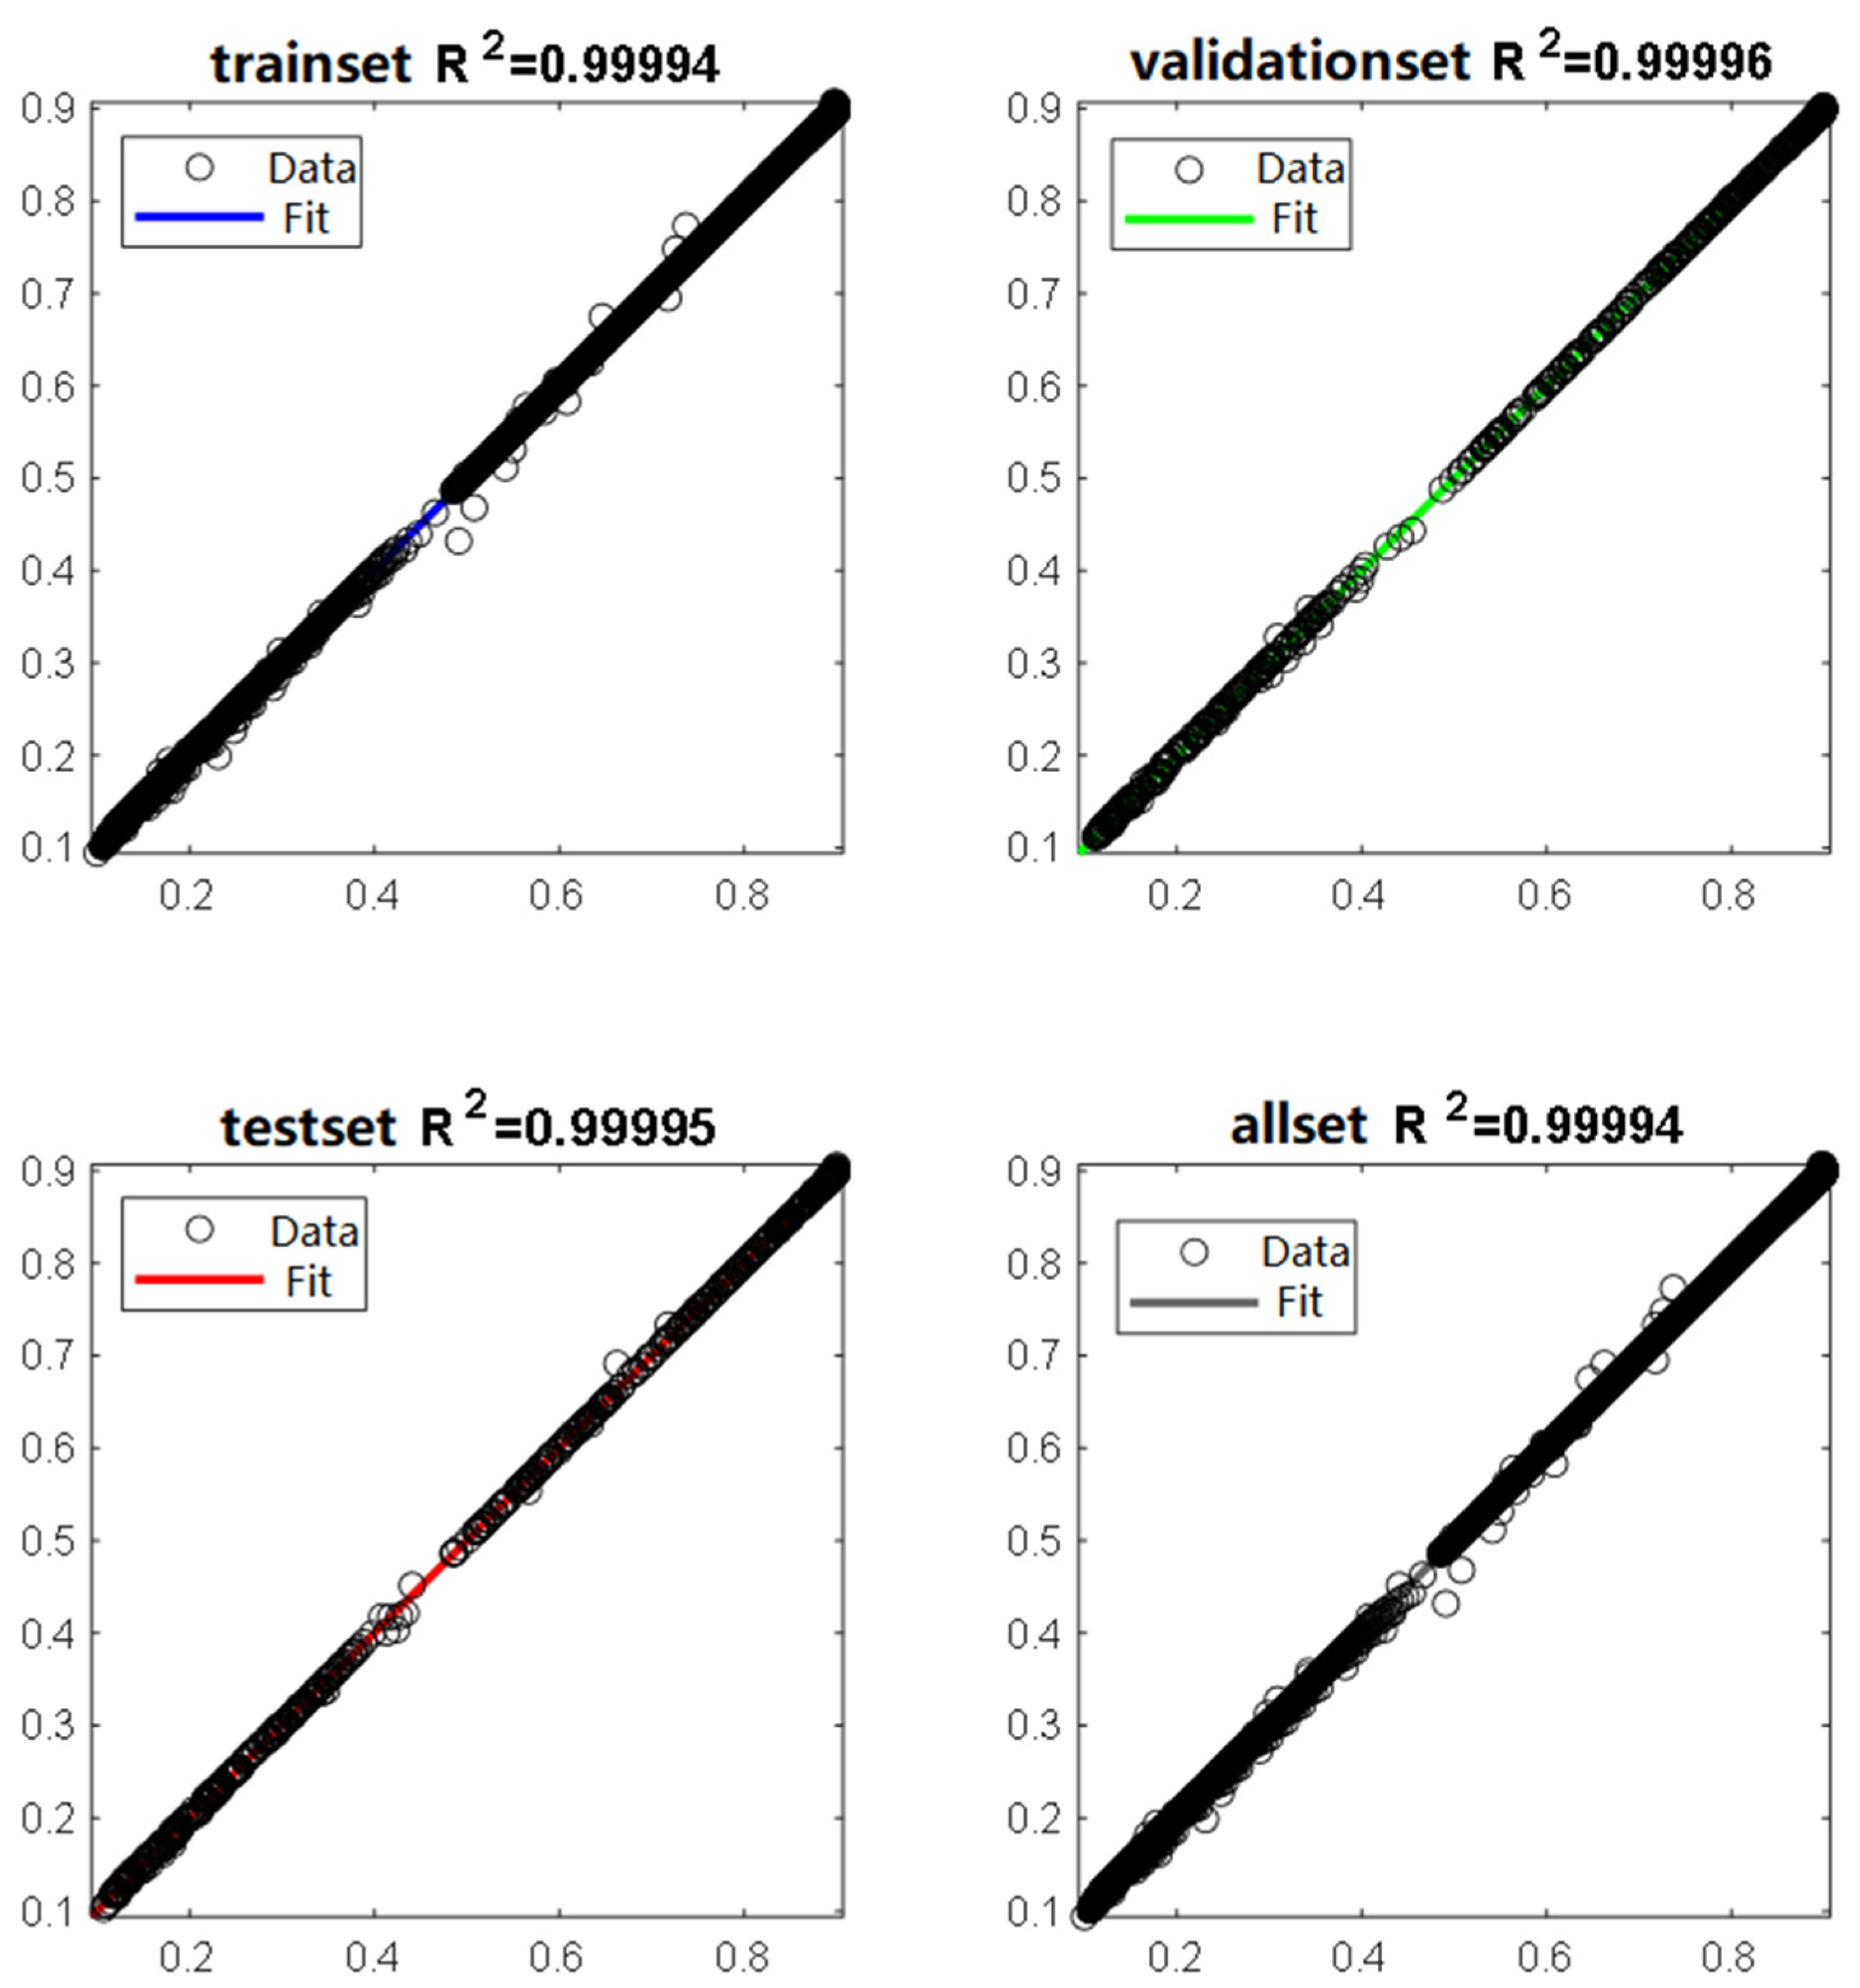
4.1. Model Validity
4.2. Model Application
4.2.1. Discussion of Problem I
4.2.2. Discussion of Problem II
- Calculate the cumulative load ratio. According to the 120-h structural test and 350-h complete machine test, it can be calculated that the cumulative load ratio is: .
- Calculate the cumulative load required for the new structural assessment test. According to the ratio 0.4467, when the complete engine test reaches 500 h, the 350 h test is designed to do 50 cycles. Then, one can calculate the cumulative load of the required supercharger structure assessment experiment.
- Design the new supercharger assessment test. The 120 h calibration parameter assessment test is roughly divided into two stages. The first stage (5/6) is the uniform speed rotation. The second stage (1/6) applies the alternating stress. Based on the rotation speed, it is calculated that the test time of the supercharger structure assessment required to pass the 500 h complete engine test is 172 h.
- Validation based on the degradation model. According to the method in Section 3 of this paper, ; that is, the supercharger’s 172 h of structural assessment can meet the requirements of the 500 h complete machine test assessment.
- Suggestions for the design of the 500-h assessment test: to facilitate the actual operation of the project, it is recommended to use a multiple of 10 as the actual intensive assessment time, i.e., take the assessment time of 180 h.
5. Conclusions
- Firstly, in terms of model-building ideas, we combined the failure mechanism and bench test analysis, and the endurance limit was determined as the degradation quantity, which could effectively avoid the difficulty of observing and measuring the degradation quantity of the traditional method, which selects the wear quantity and wear size for the degradation analysis of mechanical products. Meanwhile, the temperature and RPM were selected as the sensitive monitoring parameters.
- Then, in terms of modeling methods, based on the turbine material endurance limit data, we obtained a large amount of sample data by resampling as the input quantity and target quantity for training, which helped to ensure the model’s accuracy. Based on the GA-BP neural network, the nonlinear relationship between the endurance limit and the cumulative load temperature was fitted, which effectively avoided the problem that the traditional method needs to solve a complex system of likelihood equations, and it could map the mathematical relationship between variables well. Then, the performance degradation model of the turbine impeller during the test was provided to realize the evaluation of the endurance limit.
- Finally, in terms of model applications, we analyzed the validity of the model, and based on the model calculation results, we reasonably explained whether the current structural assessment test for turbochargers (according to the component level) could meet the requirements of the complete engine assessment test. Meanwhile, we illustrated how the corresponding component-level assessment test time should be adjusted when the whole engine test time is adjusted. In other words, using the proposed model for the scientific explanation of the above two types of problems can provide technical support for the design of the critical component-level assessment test in a turbocharger durability assessment, thus effectively controlling the cost of a turbocharger durability assessment test and providing guidance for other similar problems.
Author Contributions
Funding
Institutional Review Board Statement
Informed Consent Statement
Data Availability Statement
Acknowledgments
Conflicts of Interest
References
- Zengquan, W.; Zheng, W. Structural Reliability of Automotive Turbocharger; Beijing Science Press: Beijing, China, 2013; p. 305. (In Chinese) [Google Scholar]
- Daxin, Z. Turbocharging and Turbochargers; China Machine Press: Beijing, China, 1992; p. 548. (In Chinese) [Google Scholar]
- Meeker, W.Q.; Hamada, M. Statistical tools for the rapid development and evaluation of high-reliability products. IEEE T. Reliab. 1995, 44, 187–198. [Google Scholar] [CrossRef]
- Jiao, J.; De, X.; Chen, Z.; Zhao, T. Integrated circuit failure analysis and reliability prediction based on physics of failure. Eng. Fail. Anal. 2019, 104, 714–726. [Google Scholar] [CrossRef]
- Xu, J.; Wang, L.; Li, Y.; Zhang, Z.; Wang, G.; Hong, C. A unified MMC reliability evaluation based on physics-of-failure and SM lifetime correlation. Int. J. Electr. Power Energy Syst. 2019, 106, 158–168. [Google Scholar] [CrossRef]
- Xu, D.; Wei, Q.; Chen, Y.; Kang, R. Reliability Prediction Using Physics-Statistics-Based Degradation Model. IEEE Trans. Compon. Packag. Manuf. Technol. 2015, 5, 1573–1581. [Google Scholar]
- Lu, L.; Wang, B.; Hong, Y.; Ye, Z. General Path Models for Degradation Data with Multiple Characteristics and Covariates. Technometrics 2021, 63, 354–369. [Google Scholar] [CrossRef]
- Veloso, G.A.; Loschi, R.H. Dynamic linear degradation model: Dealing with heterogeneity in degradation paths. Reliab. Eng. Syst. Saf. 2021, 210, 107446. [Google Scholar] [CrossRef]
- Firoozeh, H.; Mikhail, N. On the linear degradation model with multiple failure modes. J. Appl. Stat. 2010, 37, 1499–1507. [Google Scholar]
- Chen, X.; Sun, X.; Ding, X.; Tang, J. The inverse Gaussian process with a skew-normal distribution as a degradation model. Commun. Stat. Simul. Comput. 2020, 49, 2827–2843. [Google Scholar] [CrossRef]
- Aryal, G.R.; Pokhrel, K.P.; Khanal, N.; Tsokos, C.P. Reliability Models Using the Composite Generalizers of Weibull Distribution. Ann. Data Sci. 2019, 6, 807–829. [Google Scholar] [CrossRef]
- Fuqing, Y.; Barabadi, A.; Jinmei, L. Reliability modelling on two-dimensional life data using bivariate Weibull distribution: With case study of truck in mines. Eksploat. Niezawodn. Maint. Reliab. 2017, 19, 650–659. [Google Scholar] [CrossRef]
- Kudryavtsev, A.A.; Titova, A.I. Bayesian queuing and reliability models: Degenerate-Weibull case. Inform. Its Appl. 2016, 10, 68–71. [Google Scholar]
- Li, N.; Lei, Y.; Yan, T.; Li, N.; Han, T. A Wiener-Process-Model-Based Method for Remaining Useful Life Prediction Considering Unit-to-Unit Variability. IEEE T. Ind. Electron. 2019, 66, 2092–2101. [Google Scholar] [CrossRef]
- Zhang, Z.; Si, X.; Hu, C.; Lei, Y. Degradation data analysis and remaining useful life estimation: A review on Wiener-process-based methods. Eur. J. Oper. Res. 2018, 271, 775–796. [Google Scholar] [CrossRef]
- Zhai, Q.; Ye, Z. RUL Prediction of Deteriorating Products Using an Adaptive Wiener Process Model. IEEE T. Ind. Inform. 2017, 13, 2911–2921. [Google Scholar] [CrossRef]
- Wang, Y.F.; Huang, Y.; Liao, W.C. Degradation analysis on trend gamma process. Qual. Reliab. Eng. Int. 2021, 38, 941–956. [Google Scholar] [CrossRef]
- Duan, F.; Wang, G. Optimal design for constant-stress accelerated degradation test based on gamma process. Commun. Stat. Theory Methods 2019, 48, 2229–2253. [Google Scholar] [CrossRef]
- Rodríguez-Picón, L.A.; Rodríguez-Picón, A.P.; Méndez-González, L.C.; Rodríguez-Borbón, M.I.; Alvarado-Iniesta, A. Degradation modeling based on gamma process models with random effects. Commun. Stat. Simul. Comput. 2018, 47, 1796–1810. [Google Scholar] [CrossRef]
- Park, S.; Kim, J. Application of gamma process model to estimate the lifetime of photovoltaic modules. Sol. Energy 2017, 147, 390–398. [Google Scholar] [CrossRef]
- Li, L.; Wan, H.; Gao, W.; Tong, F.; Li, H. Reliability based multidisciplinary design optimization of cooling turbine blade considering uncertainty data statistics. Struct. Multidiscip. Optim. 2019, 59, 659–673. [Google Scholar] [CrossRef]
- Zhu, S.; Liu, Q.; Lei, Q.; Wang, Q. Probabilistic fatigue life prediction and reliability assessment of a high pressure turbine disc considering load variations. Int. J. Damage Mech. 2018, 27, 1569–1588. [Google Scholar] [CrossRef]
- Zhou, J.; Huang, H.; Li, Y.; Guo, J. A framework for fatigue reliability analysis of high-pressure turbine blades. Ann. Oper. Res. 2022, 311, 489–505. [Google Scholar] [CrossRef]
- Yue, P.; Ma, J.; Zhou, C.; Zu, J.W.; Shi, B. Dynamic fatigue reliability analysis of turbine blades under combined high and low cycle loadings. Int. J. Damage Mech. 2021, 30, 825–844. [Google Scholar] [CrossRef]
- Zhang, C.; Wei, J.; Wang, Z.; Yuan, Z.; Fei, C.; Lu, C. Creep-Based Reliability Evaluation of Turbine Blade-Tip Clearance with Novel Neural Network Regression. Materials 2019, 12, 3552. [Google Scholar] [CrossRef] [PubMed] [Green Version]
- Zhao, Q.; Yuan, Y.; Sun, W.; Fan, X.; Fan, P.; Ma, Z. Reliability analysis of wind turbine blades based on non-Gaussian wind load impact competition failure model. Measurement 2020, 164, 107950. [Google Scholar] [CrossRef]
- Wang, Z.; Ma, T. Fatigue and Creep Life Prediction Method of Turbine Blades for Turbocharger. China Mech. Eng. 2019, 30, 2521–2526. [Google Scholar]
- Manual, C.O.T.C. Chinese Aeronautical Materials Manual; Standards Press of China: Beijing, China, 2002. [Google Scholar]


| Sub Circulation | Calibration RPM | Torque (N·m) | Time (min) | Requirement |
|---|---|---|---|---|
| 1 | Start | Gradually increase the RPM, load, cooling medium, and oil temperature to meet the specified requirements. | ||
| 2 | Increase from the lowest no-load RPM to the highest no-load RPM three times | |||
| 3 | 100% | By external properties | 60 | Every 1 h to reduce the amount of oil supply and to reduce the speed of cooling, and the load switch remains unchanged and the speed of rotation slows down to the lowest stable operating speed, which is timed for 2–3 min (not counted in the assessment time). |
| 4 | 85%~90% | By external properties | 420 | |
| 5 | 80% | By external properties | 100 | |
| 6 | Maximum torque RPM | Maximum torque | 20 | |
| 7 | Check minimum no-load RPM | 3 | ||
| 8 | Cooled parking | Gradually cool the diesel engine to the stopping specifications | ||
| 9 | The parking time is no more than 60 min. | |||
| Sampling | θ/°C | |||||||||
|---|---|---|---|---|---|---|---|---|---|---|
| Precision cast test rod | 650 | —— | 833 | 820 | 810 | 804 ① | 774 ① | —— | —— | —— |
| 700 | 810 | 725 | 720 | 710 | 666 | 627 ① | 610 ① | —— | —— | |
| 732 | 710 | 666 | 650 | 630 | 588 | 549 | 530 ① | 470 ① | 441 ① | |
| 750 | 680 | 617 | 610 | 600 | 539 | 510 | 480 | 412 ① | 372 ① | |
| 800 | 560 | 480 | 470 | 460 | 412 | 363 | 340 | 294 | 255 ① | |
| 816 | 540 | 441 | 430 | 400 | 363 | 323 | 300 ① | 255 ① | 235 ① | |
| 850 | 410 | 372 | 350 | 310 | 294 | 265 | 240 ① | 206 ① | 167 ① | |
| 900 | 300 | 274 | 250 | 230 | 216 | 176 | 160 | 137 | 108 ① | |
| 930 | 250 | 216 | 190 | 180 | 167 ① | 137 ① | —— | —— | —— | |
| 950 | 230 | 167 | 155 | 150 | 137 | 118 ① | 100 ① | —— | —— | |
| 982 | 170 | 137 | 125 | 120 | 108 ① | 88 ① | —— | —— | —— | |
| 1000 | 140 | 118 | 113 | 110 | 88 ① | —— | —— | —— | —— | |
| RPM | The Total Temperature at the Outlet | Total Pressure at the Outlet | Total Pressure at the Inlet |
|---|---|---|---|
| r/min | K | KPa | KPa |
| 46,000 | 969 | 100 | 54 |
| 80,000 | 959 | 100 | 272 |
| 88,000 | 919 | 100 | 389 |
| 96,000 | 1050 | 100 | 495 |
| RPM | Total Temperature at the Outlet | Total Pressure at the Outlet | Total Pressure at the Inlet |
|---|---|---|---|
| r/min | K | KPa | KPa |
| 72,000 | 923 | 100 | 250 |
| 64,000 | 923 | 100 | 220 |
| RPM | Turbine Blade Root Stress/MPa | Turbine Blade Root Temperature/K |
|---|---|---|
| 46,000 |  |  |
| 125 | 890 | |
| 80,000 |  |  |
| 462 | 835 | |
| 88,000 |  |  |
| 537 | 792 | |
| 96,000 |  |  |
| 971 | 855 |
| RPM | Turbine Blade Root Stress/MPa | Turbine Blade Root Temperature/K |
|---|---|---|
| 72,000 |  |  |
| 321 | 799 | |
| 64,000 |  |  |
| 363 | 813 |
| Training Algorithm | Iterations | MSE | GOF-R2 | RMSE |
|---|---|---|---|---|
| trainlm | 19 | 0.996 × 10⁻⁵ | 0.99994 | 3.155 × 10⁻³ |
| trainbr | 106 | 0.977 × 10⁻⁵ | 0.99994 | 3.126 × 10⁻³ |
| trainscg | 189 | 0.983 × 10⁻⁴ | 0.99937 | 9.915 × 10⁻³ |
| Connection Weights of the Input Layer and the Implied Layer | Threshold of the Implied Layer | Connection Weights of the Implicit Layer and the Output Layer | Threshold for the Output Layer |
|---|---|---|---|
| 10 | 5 | 5 | 1 |
| Number | Temperature T/K | |||
|---|---|---|---|---|
| 1 | 80,000 | 100 | 835 | 462 |
| 2 | 96,000 | 0.0833 | 855 | 971 |
| 3 | 88,000 | 20 | 792 | 537 |
| Number | Temperature T/K | |||
|---|---|---|---|---|
| 1 | 95,500 | 60 | 756 | 538 |
| 2 | 87,000 | 420 | 771 | 434 |
| 3 | 81,800 | 100 | 798 | 371 |
| 4 | 76,200 | 20 | 824 | 303 |
Publisher’s Note: MDPI stays neutral with regard to jurisdictional claims in published maps and institutional affiliations. |
© 2022 by the authors. Licensee MDPI, Basel, Switzerland. This article is an open access article distributed under the terms and conditions of the Creative Commons Attribution (CC BY) license (https://creativecommons.org/licenses/by/4.0/).
Share and Cite
Yi, X.; Wang, Z.; Liu, S.; Hou, X.; Tang, Q. An Accelerated Degradation Durability Evaluation Model for the Turbine Impeller of a Turbine Based on a Genetic Algorithms Back-Propagation Neural Network. Appl. Sci. 2022, 12, 9302. https://doi.org/10.3390/app12189302
Yi X, Wang Z, Liu S, Hou X, Tang Q. An Accelerated Degradation Durability Evaluation Model for the Turbine Impeller of a Turbine Based on a Genetic Algorithms Back-Propagation Neural Network. Applied Sciences. 2022; 12(18):9302. https://doi.org/10.3390/app12189302
Chicago/Turabian StyleYi, Xiaojian, Zhezhe Wang, Shulin Liu, Xinrong Hou, and Qing Tang. 2022. "An Accelerated Degradation Durability Evaluation Model for the Turbine Impeller of a Turbine Based on a Genetic Algorithms Back-Propagation Neural Network" Applied Sciences 12, no. 18: 9302. https://doi.org/10.3390/app12189302