Article

Validation of a Wind Tunnel Propeller Dynamometer for Group 2 Unmanned Aircraft

School of Mechanical and Aerospace Engineering, Oklahoma State University, Stillwater, OK 74078, USA
*
Author to whom correspondence should be addressed.
Appl. Sci. 2022, 12(17), 8908; https://doi.org/10.3390/app12178908
Submission received: 28 June 2022 / Revised: 31 August 2022 / Accepted: 2 September 2022 / Published: 5 September 2022
(This article belongs to the Special Issue Unmanned Aerial Vehicles)

Abstract

:
This paper presents an approach to validate a wind tunnel propeller dynamometer applicable to Group 2 unmanned aircraft. The intended use of such a dynamometer is to characterize propellers over a relevant range of sizes and operating conditions, under which such propellers are susceptible to low-Reynolds-number effects that can be challenging to experimentally detect in a wind tunnel. Even though uncertainty analysis may inspire confidence in dynamometer data, it is possible that a dynamometer design or experimental arrangement (e.g., configuration and instrumentation) is not able to detect significant propeller characteristics and may even impart artifacts in the results. The validation method proposed here compares analytical results from Blade Element Momentum Theory (BEMT) to experimental data to verify that a dynamometer captures basic propeller physics, as well as self-similar experimental results to verify that a dynamometer is able to resolve differences in propeller diameter and pitch. Two studies were conducted to verify that dynamometer experimental data match the performance predicted by BEMT. The first study considered three propellers with the same 18-inch (0.457 m) diameter and varied pitch from 10 to 14 inches (0.254 to 0.356 m). The second study held pitch constant and varied diameter from 14 to 18 inches (0.356 to 0.457 m). During testing, wind tunnel speeds ranged from 25 ft/s to 50 ft/s ( 7.62 to 15.24 m/s), and propeller rotational speeds varied from 1500 to 5500 revolutions per minute (RPM). Analytical results from a BEMT code were compared to available experimental data from previous work to show proper application of the code to predict performance. Dynamometer experimental results for thrust coefficient and propeller efficiency were then compared to BEMT results. Experimental results were consistent with the expected effect of varying pitch and diameter and were in close agreement with BEMT predictions, lending confidence that the dynamometer performed as expected and is dependable for future data collection efforts. The method used in this study is recommended for validating wind tunnel propeller dynamometers, especially for Group 2 unmanned aircraft, to ensure reliable performance data.

1. Introduction

Unmanned aircraft systems (UAS) continue to prove their utility in the performance of both missions that were once conducted by manned platforms and those that are entirely novel altogether. In the United States, the current regulatory environment permits the commercial operation of unmanned vehicles weighing less than 55 pounds in the National Airspace System (NAS). Services such as pipeline patrol, communication relay, surveillance, and surveying for agricultural and security purposes are offered for hire by businesses utilizing this rule-set. For-profit entities and the public continue to demand services via UAS. The Federal Aviation Administration (FAA), the regulator in the United States, has been responsive to the demand, as evidenced by recent expansion of the existing Part 107 rules to allow for limited operations over people and nighttime flights. The economic value of expanding UAS operations has been recognized by the agency, including the generation of a road map to expand operations, such as beyond visual line-of-sight flights based on the risk on a risk-management framework proposed under the upcoming Modernization of Special Airworthiness Certificates (MOSAIC) rule-set.
As UAS operations expand and businesses are growing to meet customer demand, the need to optimize mission performance becomes paramount to efficiently and profitably provide services. Propulsion system optimization is among the many areas a designer considers. Group 2 UAS are based on medium-sized unmanned aerial vehicles (UAVs), with 21–55 lbs maximum take-off weight and flying lower than a 3500-foot operational ceiling and under 250 knots cruise airspeed, according to the US Department of Defense. Among Group 2 UAS, common power plants include low-cost electric motors and internal combustion engines. These devices convert stored energy to propulsion with a simple fixed-pitch propeller, as weight and cost constraints most often preclude the use of variable-pitch propeller options. The use of fixed-pitch propellers requires a compromise between climb and cruise performance. Thus, accurately understanding propeller performance is an important factor contributing to the operating envelope and mission capability of the vehicle.
Early in the design cycle for a new platform, performance estimates are developed using low-order models to take advantage of the ability to perform rapid design iterations and mission performance evaluations. As the design matures, an increase in fidelity of the estimates is desired. Commonly, models such as Blade Element Momentum Theory (BEMT) are applied in early design stages to predict propeller performance. However, BEMT models are subject to limitations, particularly at low Reynolds numbers and low advance ratios [1]. Researchers have demonstrated the ability to accurately predict propeller performance using computational fluid dynamics (CFD), even in difficult-to-resolve flow conditions [2,3]. Although such examples commendably replicate performance characteristics based on available data, CFD practitioners still require validation of their modeling results. Besides its use as a validation tool, experimental propeller characterization remains a viable option, especially for the UAS community, due to the smaller wind tunnel facility requirements compared to full-scale aircraft propeller testing.
There is an ever-growing body of knowledge from wind tunnel experiments using different configurations to assess propeller performance; however, there does not appear to be a unifying method to ensure that the different configurations are valid. Czyz et al., 2022, studied the aerodynamic performance of propellers with various pitch in a wind tunnel for electric propulsion applications [4]. Podsedkowski et al., 2020, conducted experimental tests of variable pitch propellers for UAVs [5], the study involved a propeller of 16 inches in diameter and various pitch. Podsedkowski et al. designed and built a measuring station that operated similarly to a propeller dynamometer. Avanzini et al., 2020, developed a test bench for measuring propeller aerodynamic performance and electrical parameters; this involved using measurements of thrust, torque, and electric power to validate models used for preliminary designs of UAVs [6]. Islami and Hartono, 2019, developed a small propeller test bench system; this study involved the use of a rig with loads cells to measure thrust and torque for small propellers (10 inches in diameter) [3]. Experimental measurements were compared to results obtained from CFD and BEMT [3]. These studies [3,4,5,6,7,8] have formed a basis of knowledge useful to Group 2 UAS; however, they do not specifically address a method for validating a wind tunnel dynamometer, which is essential for credible experimental results. There are many potential sources of experimental artifacts that can affect data and yet not be manifest from an uncertainty analysis. For example, the presence of fluid–structure interaction between the propeller, motor, instrumentation and support structure can influence results in a way that does not effect bias (systematic) or precision (random) error. This current paper proposes a novel method to be adopted as common practice for validating such wind tunnel dynamometers.

1.1. Previous Dynamometer Work

There are many existing wind tunnel propeller dynamometers, which can generally be categorized by scale and configuration. Small-scale dynamometers are typically used to evaluate propellers with up to about 10-inch diameter, and include those at the University of Illinois at Urbana–Champaign (UIUC) and Ohio State University ([9,10,11,12,13,14]). Brandt and Selig ([9,10]) and Deters et al. ([11,12]) noted the effect of low-Reynolds-number operation on such propellers from a wind tunnel propeller dynamometer, and Dantsker et al. ([13]) reported the performance of small folding propellers. McCrink and Gregory ([14]) compared blade element momentum (BEM) modeling results with wind tunnel experimental data for small propellers operating at low Reynolds numbers. Van Trueren et al. ([15]) evaluated small UAS propellers designed for minimum induced drag using a wind tunnel propeller dynamometer at the United States Air Force Academy. Gamble and Arena ([16]) described automatic dynamic propeller testing at low Reynolds numbers and designed a dynamometer. Bellcock and Rouser ([17]) described the design of a wind tunnel propeller dynamometer at Oklahoma State University (OSU) for evaluating a jet-blowing flow controller on small propellers to suppress boundary layer separation. 
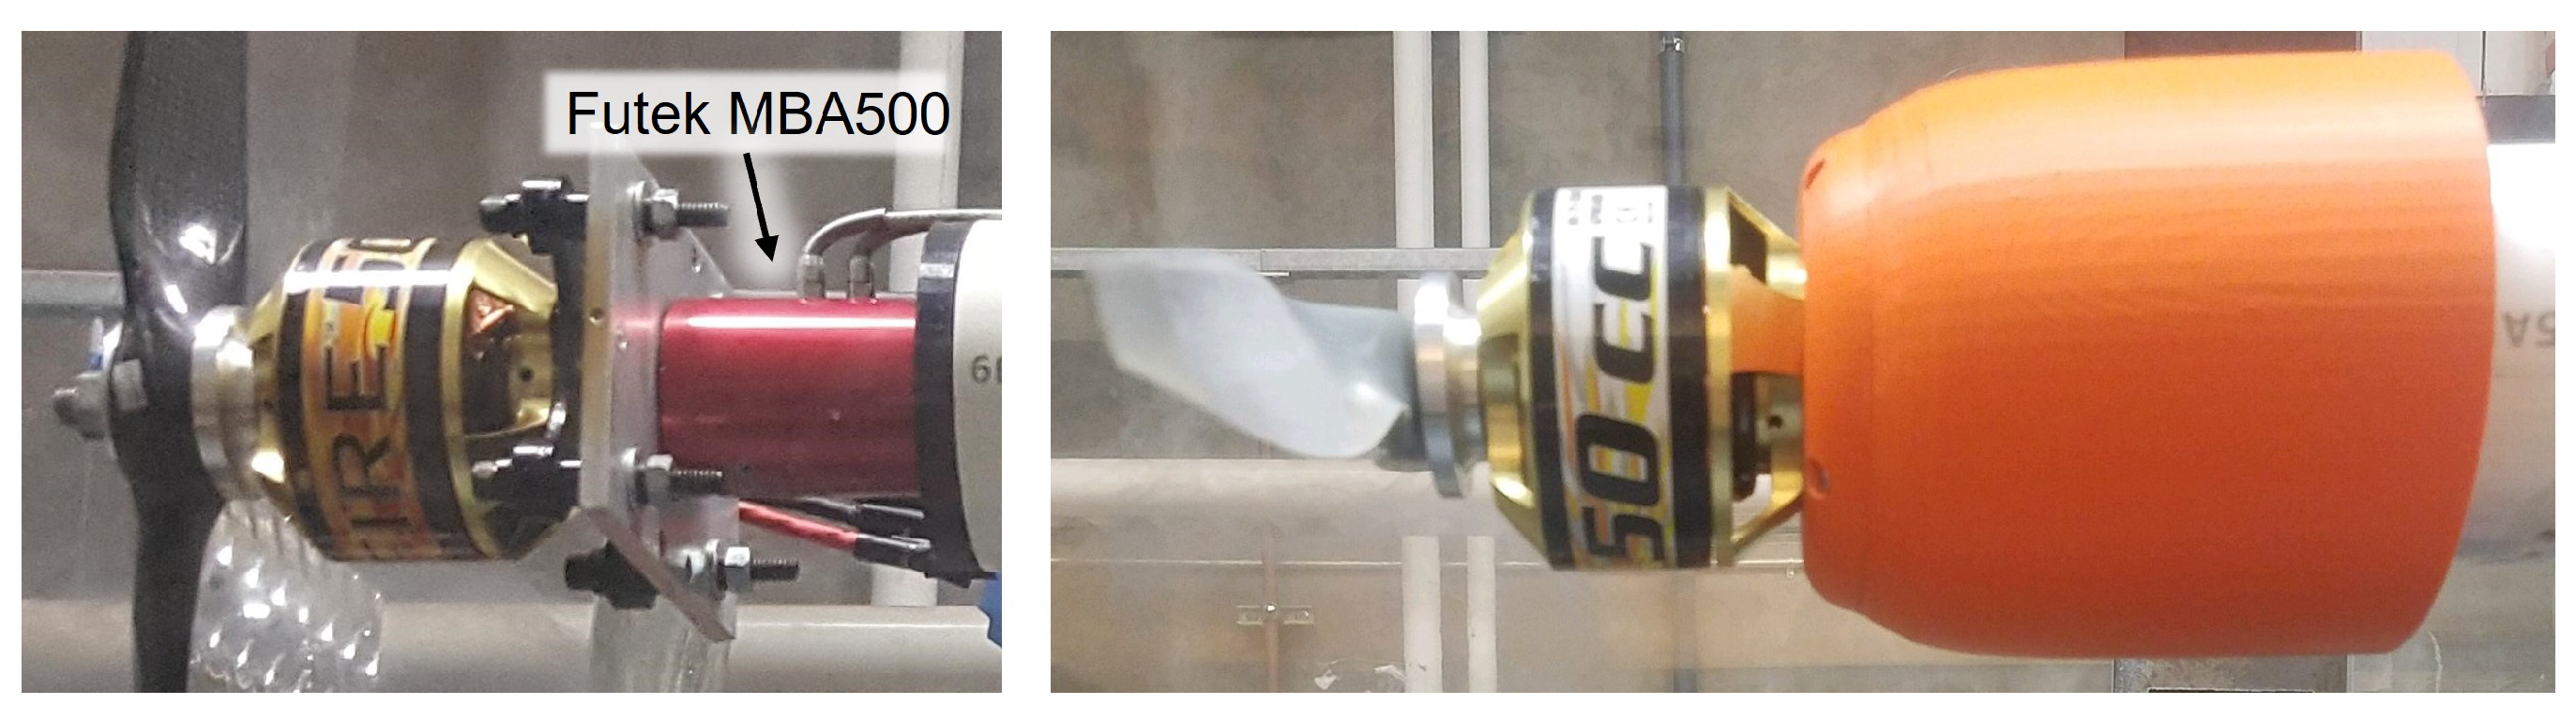
Figure 1 shows the previous OSU wind tunnel propeller dynamometer design described by Bellcock and Rouser to evaluate a modified 10-inch diameter electric propeller. Morris ([18]) presented a method for validating a mobile propeller dynamometer for UAS applications; however, there has not otherwise been previous work on a method to validate a wind tunnel propeller dynamometer for Group 2 UAS applications.
Examples of large wind tunnel propeller dynamometers are typically found in government and industry. Boldman et al. ([19]) described a dynamometer used in the United Technologies Technology Research Center: a 10 ft by 15 ft large subsonic wind tunnel used to evaluate an advanced ducted propeller. National Aeronautics and Space Administration (NASA) facilities have been previous described, including a 2000 hp dynamometer at NASA Langley used in a 16 ft, high-speed wind tunnel ([20]), shown in Figure 2, and a 1000 hp dynamometer at NASA Ames used in a 12 ft wind tunnel ([21]), shown in Figure 3. The propeller diameters used in these NASA facilities range from 4 ft to 10 ft and are roughly one half to one third of the test section size. Further, the propellers are located between one half to two diameters ahead of the vertical strut. In order to collect credible propeller performance data, it is important for wind tunnel dynamometers to be designed to reduce fluid–structure interaction between the propeller flow-field and the wind tunnel test section and dynamometer vertical support.
Dynamometer configurations generally can be classified by the means by which they measure thrust and torque. Thrust is typically measured with a linear load cell that is inline or offset from the propeller shaft, or in a moment arm arrangement. The aforementioned OSU dynamometer includes a linear, offset load cell for measuring thrust, which requires accounting for moment created by the offset distance. Alternatively, the NASA dynamometer in Figure 2 includes inline thrust measurement with a pneumatic thrust capsule. Torque is also typically measured inline or by using a moment arm arrangement. Figure 1 shows an example of an inline torque meter integrated into the previous OSU dynamometer, whereas the NASA Langley dynamometer includes torque arms for taking measurements with a moment. The advantages and disadvantages of these measurement approaches are discussed later in the design rationale for our proposed dynamometer.

1.2. Proposed Validation Method

The method includes a comparison of experimental results to BEMT analytical results over a relevant range of test conditions. A validated dynamometer should be able to resolve low-Reynolds-number effects. Furthermore, the method includes comparing experimental results for propellers of at least three different diameters and pitch over the same range of relevant test conditions. A validated dynamometer should distinguish a consistent trend in performance across different diameters and pitch. Finally, the proposed performance figures of merit should at least include thrust coefficient and propeller efficiency, noting that the power coefficient can be derived from those two figures of merit. The motivation for establishing this method is to assist those conducting propeller wind tunnel experiments, especially for Group 2 UAS, to improve the credibility of their results. This, in turn, will improve the confidence of those using propeller wind tunnel data in mission planning and aircraft design.

1.3. Objectives

The wind tunnel propeller dynamometer in this current study is intended to measure the propeller performance of Group 2 UAS. This paper will address the details and rationale for the dynamometer design. The objective of this paper is to present a method to validate the design using BEMT and experimental data from a 3 ft by 3 ft subsonic wind tunnel test section. The study evaluates the performance of three different propeller diameters, ranging from 14 to 18 inches, and three different magnitudes of pitch, ranging from 10 to 14 inches. Tunnel airspeeds range from 25 to 50 ft/s, and shaft speeds range from 1500 to 5500 revolutions per minute (RPM). The propeller dimensions considered in this paper are common and a good representation of Group 2 UAS propellers. However, there is a wide range of propellers in the Group 2 category. The objective of this paper is not to measure or improve propeller performance nor to present or improve dynamometer design (both of these are already well-documented), but rather, it is about a method for validating a propeller dynamometer.

1.4. Propeller Theory

This section provides a brief overview of parameters used to characterize propeller performance, and then presents the methodology for the BEMT code implemented over the course of this research to provide comparison data to contrast with the experimental results to validate our proposed propeller dynamometer.

1.4.1. Performance Characterization

Propellers are characterized by the amount of torque and thrust they produce at a given shaft speed, and by the ratio of the power transferred to the air versus the mechanical power supplied, known as propeller efficiency [10,11,14]. As is typical in aerodynamics applications, the dimensional thrust and power are not typically specified; rather, non-dimensional coefficients are presented to allow the end-user of the data to adapt the results to their application (i.e., operating with a different atmospheric density or at a different velocity). Unlike aircraft wing aerodynamics, which are non-dimensionalized using freestream velocity, propeller performance coefficients are based in the propeller frame of reference, using chord-wise velocity at a given radial location as a function of both freestream and rotational velocities.
Reynolds number is defined as the ratio of momentum force to viscous shear force. For propellers, Reynolds number is based on chord length (c), relative velocity ( V r e l ), air density ( ρ ), and dynamic viscosity ( μ ). In order to satisfy the objectives of this research for validating a wind tunnel propeller dynamometer for Group 2 UAS, testing was conducted at low Reynolds numbers.
R e = ρ c V r e l μ
Propeller characteristics are typically cataloged as a function of the ratio between freestream and angular velocity to allow for translation to arbitrary operating speeds. This ratio is known as the advance ratio (J), and is shown symbolically in Equation (2), where V is freestream velocity, n is the rotational speed in revolutions per second, and D is propeller diameter.
J = V n D
Thrust coefficient, defined as shown in Equation (3), is a non-dimensional quantity that relates thrust produced (T) to the rotational velocity (n) and propeller diameter (D), where ρ is the density of the air the propeller is acting on.
C T = T ρ n 2 D 4
Similarly, power and torque coefficients are non-dimensional quantities that relate power (P) and torque (Q), respectively, to the rotational velocity and propeller diameter, as in Equation (4).
C p = P ρ n 3 D 5
C Q = Q ρ n 2 D 5
Finally, propeller efficiency ( η p ) is the ratio of power transferred to the air by the propeller to the mechanical power required to turn the propeller, as shown in Equation (6).
η p = J C T C p

1.4.2. Blade Element Momentum Theory

Blade Element Momentum Theory (BEMT) is a common methodology for predicting propeller performance in terms of the coefficients defined in Section 1.4.1. BEMT requires only a few inputs. The code implemented for this research is described succinctly by the flowchart presented as Figure 4, and is similar to examples found in [22,23,24,25].
The first step in the BEMT solution process is to discretize propeller geometry for analysis. Input files catalog propeller twist and the local airfoil profile for n radial segments, specified by distance from the hub (r), each of length d r , from the hub to the tip. The measurements describing propeller geometry specification are shown as Figure 5.
In addition to propeller geometry data, the propeller operating condition is input by specifying freestream velocity ( V ) and RPM for a given run of the BEMT code.
After a run case begins, the code takes on assumed values for the axial and angular inflow factors, a a x i a l i and a a n g u l a r i , respectively, for each propeller segment of length d r i . The initial assumed values for a a x i a l i and a a n g u l a r i are 0.1 and 0.01, respectively. These terms are induction factors describing the axial and angular velocity components, V a x i a l i and V Θ i , respectively, within an annular streamtube containing d r i . Due to the propeller rotation, the fluid within streamtube i acquires the velocity components modeled as
V a x i a l i = [ a a x i a l i ] V
and
V Θ i = [ a a n g u l a r i ] ω r i
which are accounted for during application of momentum conservation equations.
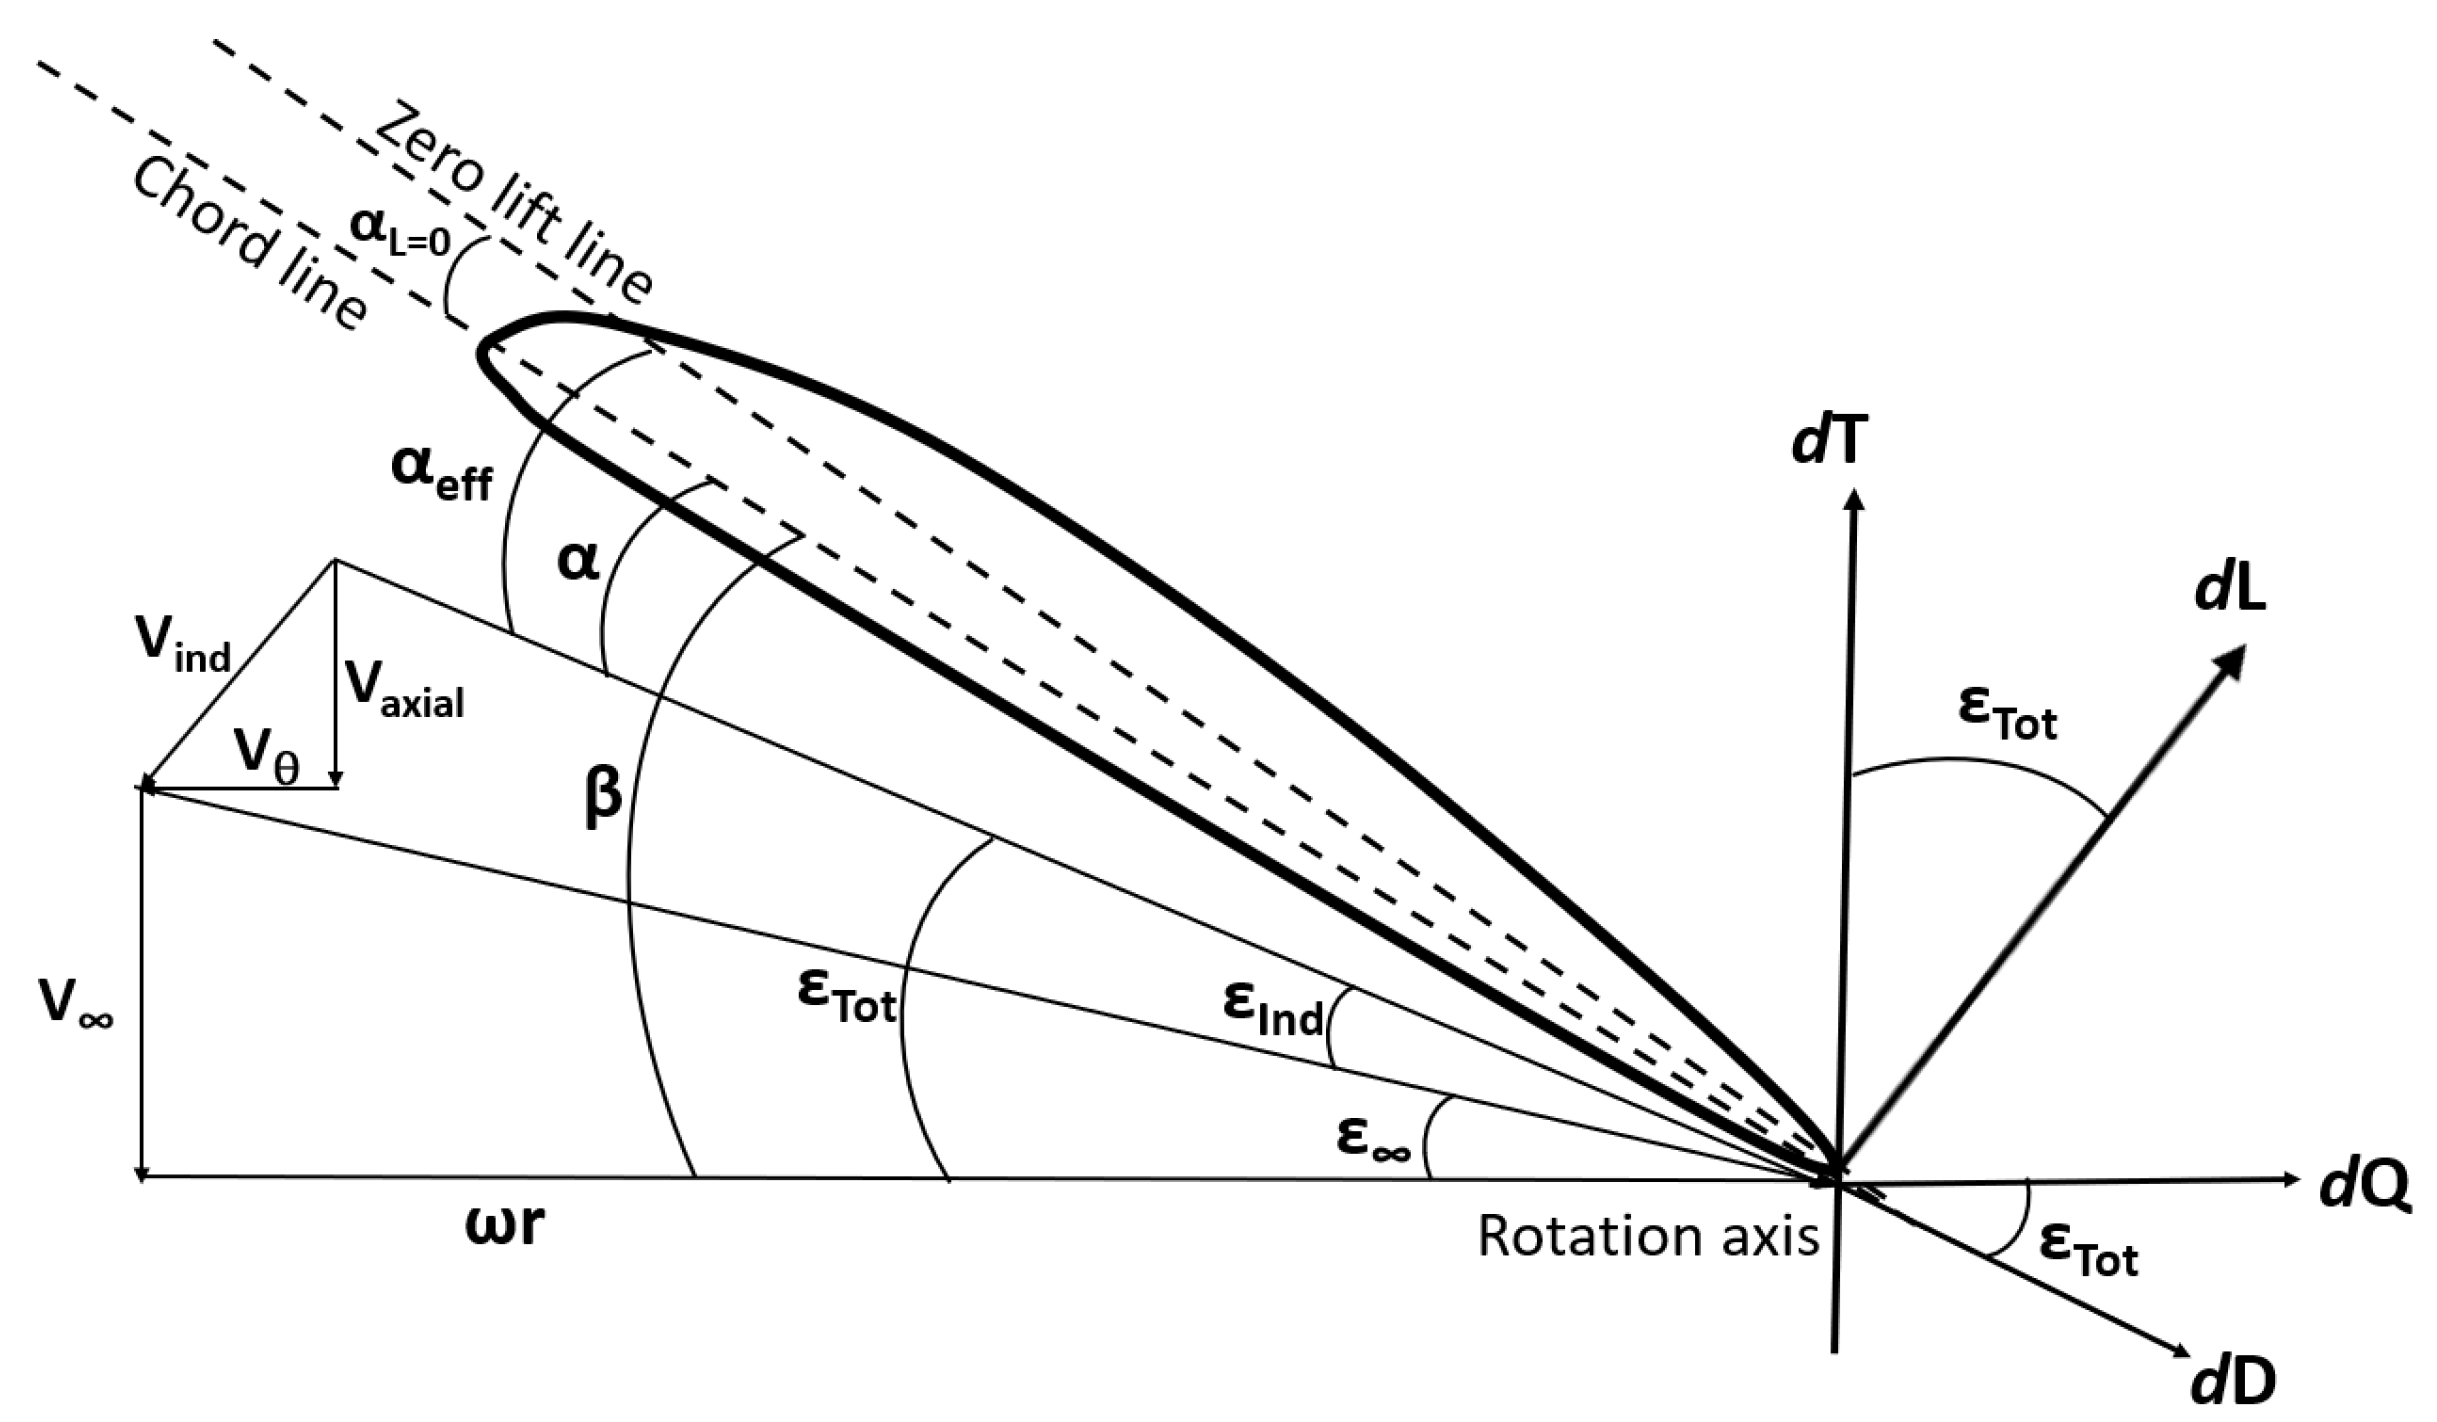
Subsequently, the total downwash angle is computed for each blade segment. The local flow geometry and definitions for force directions for a blade segment are shown in Figure 6.
Given the freestream velocity, rotational velocity at the radial location under consideration, and the induced velocities due to the propeller motion, the total downwash angle at segment i is computed as shown in Equation (7).
ε T o t i = tan 1 V + V a x i a l i ω r i V Θ i
Next, with the total downwash angle defined, the local lift and drag coefficients for the airfoil sections can be determined. For each blade segment, the effective angle of attack α e f f i is the sum of the geometric angle of attack (AOA), α i and zero-lift AOA, α L = 0 i . The geometric AOA is defined in Equation (8), where β i is the geometric pitch angle
α i = β i ε T o t i .
Given the effective angle of attack, α e f f i , the C l and C d for each section is straightforward to determine from tables of 2-D aerodynamic data. As the APC (Advanced Precision Composites) propellers studied experimentally are predominately made up of National Advisory Committee for Aeronautics (NACA) 4412 airfoils [14], this cross-section was assumed for each propeller segment in the BEMT code. In this work, the 2-D input aerodynamic data are developed from XFOIL [26] analysis at the Reynolds number computed based on the vector sum of the freestream and rotational velocity and chord at the 75% radial location, as is common in propeller aerodynamics [11].
Then, the total thrust and torque the propeller is producing are estimated. For each blade segment, the incremental thrust and torque are shown as Equations (9) and (10), respectively.
d T i = q i c i [ C l i cos ( ε T o t i ) C d i sin ( ε T o t i ) ] A d r i
d Q i = q i c i r i [ C l i sin ( ε T o t i ) + C d i cos ( ε T o t i ) ] A d r i
where dynamic pressure at radial location i is defined as shown in Equation (11).
q i = 1 2 ρ ( V + V a x i a l i ) 2 + ( ω r i V Θ i ) 2
The total thrust and torque produced by the propeller are estimated by integrating the incremental thrust and torque contributions along the blade span, and multiplying by the number of blades (N) on the propeller. The total power of the propeller is obtained by multiplying angular velocity with total torque of the propeller ( P = ω Q ) [22].
Finally, in order to determine if the conservation of axial and angular momentum is satisfied by the current solution, the induction factors a a x i a l i and a a n g u l a r i are computed for each radial section using Equations (12) and (13) and the incremental thrust and torque found previously using Equations (9) and (10).
d T i = 4 π r i ρ V 2 ( 1 + [ a a x i a l i ] ) [ a a x i a l i ] d r i
d Q i = 4 π r i 2 ρ ω V ( 1 + [ a a x i a l i ] ) [ a a n g u l a r i ] d r i
If the induction factors match the values at the beginning of the solution procedure within a user-defined tolerance, outputs are stored for the flow condition under consideration. Otherwise, the induction factors are updated with an average of the newly calculated and initial inflow factor guess, and the solution procedure is repeated until convergence is achieved; the solution is considered converged when the new a a x i a l i and a a n g u l a r i are less than 1 × 10 5 .

2. Materials and Methods

2.1. Propeller Dynamometer Design

The scale of the dynamometer components is dictated by size of the wind tunnel test section (3 ft by 3 ft) and max propeller diameter (18 inch) such that the propeller diameter is half that of the wind tunnel (consistent with dynamometer designs noted in the previous work in Section 1.1). A typical highly loaded APC 18 in propeller is expected to draw about 4 kW of power at 6000 RPM and low airspeeds. Therefore, a 4 kW Magna-Power direct current (DC) power supply is selected.
To avoid overloading the dynamometer motor, a 5 kW Great Planes Rimfire 50 cc electric motor is selected to drive the propeller. The dynamometer drive motor has a max voltage of 55 V, which is higher than the DC power supply’s 32 V range, avoiding the potential for the supply to over-volt the drive system. The motor has a 230 kV rating, which limits max shaft speed to 7360 RPM at 32 V, well within the dyno motor limit of about 12,500 RPM.
A Castle Creations Phoenix Edge 160 HV electronic speed controller (ESC) is selected, as its 50 V and 160 A range is greater than the DC power supply output. The ESC is placed outside the dynamometer cowling such that freestream air and propeller wake provide adequate cooling flow. The ESC receives a pulse-width modulation (PWM) throttle signal from a GT Power Professional Digital Servo Tester that is powered by a 7.4 V to 12 V DC input and provides a 4.8 V output. Table 1 includes a summary of the dynamometer electrical and instrumentation components.
A Honeywell SS460S Hall-effect sensor is epoxied inside the motor to detect shaft speed. A Futek MBA500 torque and thrust bi-axial load cell is mounted between and inline with the drive motor and dynamometer horizontal support, using custom-designed and 3D-printed cowling components, as shown in Figure 7 and Figure 8. The inline arrangement is an improvement over the previous OSU dynamometer design, minimizing the effect of vibrations that can be experienced with an offset, moment-arm arrangement. The load cell has a 50 lb thrust limit and 50 in-lb torque limit with an error of 0.25% of read-out.
The dynamometer support structure is fabricated from 2 in by 2 in quad-rail, t-slot aluminum extrusion. The horizontal support is shrouded in a 3 in diameter polyvinyl chloride (PVC) pipe, as shown in Figure 9. The space between the rail and pipe is filled with sand to damp vibrations induced by fluid–structure interactions. The length of the vertical support is such that the horizontal support is in the center-line of the wind tunnel when mounted to a 2.5 in thick, 6 ft long, 2 ft wide optical breadboard that rests on the bottom of the wind tunnel test section.
The vertical support includes symmetric airfoil fairing pieces that were 3D printed from polylactic acid (PLA) filament and inserted into the quad rail slots. The airfoil leading edge extends 1.5 inches ahead of the quad rail, and the trailing edge extends 6.5 inches behind, such that the total chord length of the vertical support is 10 inches. The distance between the propeller plane of rotation and the leading edge of the vertical support fairing is 36 inches, equal to twice the distance of the maximum 18 in propeller diameter, consistent with that of NASA designs noted in previous work, and also an improvement over the previous OSU design.

2.2. Wind Tunnel and Data Acquisition System

The dynamometer is in operation at Oklahoma State University in the Advanced Technology Research Center (ATRC). The wind tunnel has a 125 hp draw down drive motor. The test section has a 3 ft by 3 ft area. The wind tunnel has a pitot-static probe positioned at the entrance of the test section, 18 in from the bottom of the test section. The pitot-static probe is 3 ft from the propeller rotational plane on the propeller dynamometer, and it is plumbed to an Omega differential pressure transducer with a 0.072 psi range. The pressure transducer is driven by a 24 V, 10 A National Instruments (NI) power supply. The transducer signal passes through a Phoenix Contact interface module that converts the wired signal to a D-SUB port. The signal is then sent into an NI analog input module. This analog input module is attached to an NI 8-slotted chassis that compiles the signals received and transmits the data to a Dell Precision Tower 5810 computer. This computer also uses the same NI chassis for sending signals to drive the wind tunnel fan through an NI analog output module and a corresponding Phoenix Contact D-SUB interface.
The wires from the dynamometer Hall-effect sensor are connected to an Arduino Uno to compute RPM measurements. The Arduino Uno sends this RPM data to the Dell computer through a USB cable. The dynamometer Futek thrust and torque load cell is connected to the Dell computer by two USB connectors corresponding to each measurement, as shown in Figure 10 and Table 2.

2.3. Experimental Procedures

Experiments in this study obtained data for five APC propellers, as depicted in Table 3. Data include wind tunnel air speed (ranging from 25 ft/s to 50 ft/s); propeller RPM (ranging from 1500 to 5500), thrust, and torque; and power supply voltage and current. Airspeed, RPM, and power supply data were obtained by visually reading measurement displays. Thrust and torque data were recorded using Sensit software. The wind tunnel utilizes a closed-loop speed controller to maintain airspeed at a desired value. The procedure used in this study for obtaining propeller data is as follows:
  • Open Arduino software for displaying propeller RPM; the Arduino measures the RPM at 4 Hz.
  • Open Sensit software to tare instruments and adjust settings for autonomous testing to record thrust and torque.
  • Turn on wind tunnel fan drive motor power and set test section speed to 25 ft/s.
  • Set propeller speed to 1500 RPM using servo tester and Arduino display.
  • Visually read and manually record all displays, averaging five measurements for propeller RPM and power supply voltage and current.
  • Run Sensit software autonomous recorder for 10 s at 100 samples per second.
  • Repeat steps 5 through 8 at propeller speeds ranging from 1500 to 5500 RPM.
  • Repeat steps 5 through 9 for wind tunnel air speeds ranging from 25 to 50 ft/s.

3. Results

The method proposed to validate the dynamometer is to first show proper application of the BEMT code to match existing experimental data for propellers with geometry similar to those used in this study. Then, the BEMT code is used to validate experimental propeller performance from the dynamometer used here. Equation (1) is used to estimate the range of Reynolds number conditions for each propeller tested. Reynolds numbers for the study stay between 28,000 to 94,000 for the 14-inch diameter propeller and between 68,000 to 230,000 for 18-inch propellers. The low-Reynolds-number conditions are associated with low freestream velocity and low angular velocity.

3.1. Manufacturer-Published Propeller Data and BEMT Results

Figure 11, is a plot of BEMT results including thrust coefficient and propeller efficiency versus the advance ratio for an 18 × 12E APC propeller. The plot includes results from blade element momentum theory (BEMT) and APC published data. The published APC data are obtained analytically according to the APC database website, and no further information is provided regarding data methodology. The BEMT results cover a range of propeller speeds from 1500 to 5500 RPM, whereas the APC data range is from 1000 to 6000 RPM. Each line on the plot represents a different RPM. The plot indicates that thrust coefficient decreases as advance ratio increases. Initially, propeller efficiency increases as advance ratio increases, then rapidly decreases for advance ratios greater than 0.63. APC results extend to a maximum advance ratio greater than 0.7, but BEMT results in this study are less than 0.7. Increasing RPM results in both higher thrust coefficient and propeller efficiency. The BEMT propeller efficiency peaks are lower than those from APC and occur at lower advance ratios. Thrust coefficient results from BEMT are lower than those from APC; however, they are similar in slope.
Figure 12 shows experimental results from UIUC for a 14 × 12E APC propeller compared to those from the BEMT code. The plot for BEMT and UIUC experimental results includes thrust coefficient and propeller efficiency as a function of advance ratio at 3500 RPM [27]. The results are in close agreement in terms of propeller efficiency up to an advance ratio of 0.6. The BEMT code under-predicts thrust coefficient by as much as 15% for advance ratios below 0.3. In general, the BEMT results are more reliable than the APC published performance in the previous figure. Though the BEMT results are only reliable for validating performance over advance ratios of 0.3 to 0.6, they capture the general trends beyond that range, including the slope of the thrust coefficient for advance ratios between 0.6 and 0.8 and the rapid drop in propeller efficiency at an advance ratio of about 0.8. The other main take-away is that the BEMT code used in this study is indeed properly applied, acknowledging that the analytical model is not expected to capture complicated viscous flow effects at high and low advance ratios where the blade experiences very low and high relative angles of attack. Discrepancies may also possibly result from experimental uncertainty and airfoil aerodynamic data that does not capture three-dimensional flow effects.

3.2. Experimental Results Compared to Blade Element Momentum Theory (BEMT) Results

Figure 13 shows the experimental and BEMT results for 18 × 10E, 18 × 12E, and 18 × 14 APC propellers. The first two propellers are of a comparable thin, electric type, and the third propeller is classified as a sport propeller. The plotted results include thrust coefficient and propeller efficiency as functions of the advance ratio. All of the plots indicate that the thrust coefficient decreases as the advance ratio increases. Initially, propeller efficiency increases as advance ratio increases, then rapidly decreases at high advance ratios. Observations from Plots A and B in Figure 13 indicate the experimental peak efficiency for propellers 18 × 10E and 18 × 12E occurs at higher advance ratios as pitch increases. The experimental thrust coefficient lines increase with pitch for the 18 × 10E and 18 × 12E propellers, which is expected. The BEMT results are generally consistent with experimental results for advance ratios between 0.3 and 0.6, such that the dynamometer appears to produce valid performance. The BEMT results have less agreement with the 18 × 14 sport propeller than with the thin electric propellers. It also appears that the dynamometer is able to show that performance trends are not consistent across the 18 × 12E thin electric and 18 × 14 sport propellers with increasing pitch.
Figure 14 shows experimental and BEMT results in plots A, B, and C for 18 × 12E, 16 × 12E, and 14 × 12 APC propellers, respectively. The first two propellers are more comparable, both being of a thin electric type. Consistent with aforementioned results for all the propellers, efficiency initially increases as advance ratio increases, then rapidly decreases, and thrust coefficient decreases with increasing advance ratio. Results from plots D and E in Figure 14 indicate peak efficiency occurs at a lower advance ratio with decreasing diameter, which is expected. The slope of the thrust coefficient for both experimental and BEMT decreases as the propeller diameter decreases. The BEMT results are in good agreement with experimental results over advance ratios from 0.3 to 0.6 for the thin electric propellers, but under-predict performance for the 14 × 12 sport propeller. The BEMT code appears to be better for validating dynamometer data from thin electric propellers, and the propeller dynamometer appears to be able to resolve differences between propeller types: thin electric and sport.

4. Discussion

4.1. Comparison of BEMT and Experimental Results

As indicated in Figure 11, there is a significant difference between the BEMT code and APC results, likely due to different analytical methods and application of airfoil data. The APC published data have been found inconsistent by other studies: Alves, 2014 [28] and Trevor’s master thesis, 2009 [29]. Figure 12 furthermore shows that the BEMT code produces more reliable data for validating dynamometer experimental data, which is likely due to the treatment of Reynolds number effects. Increasing the Reynolds number results in increased thrust coefficient and propeller efficiency because an increase in the Reynolds number increases the sectional lift coefficient and decreases the blade drag coefficient [11]. The BEMT analysis captures these effects by incorporating airfoil data, rendering a more conservative prediction for both propeller efficiency and thrust coefficient.
As the advance ratio increases to a magnitude of about 0.6 at either low airspeed or low rotational speeds, the propeller is expected to encounter a sufficiently low Reynolds number that it is susceptible to boundary layer separation. The resulting effect is a sharp decline in propeller efficiency and near zero thrust coefficient as the flow relative to the propeller may render a negative angle of attack. Under this condition, flow is expected to separate around the bottom (pressure side) of the propeller. The experimental data from the dynamometer is consistent with this expectation, having better agreement with the BEMT results than those of APC. Thus, the BEMT code is shown to be accurate and useful to validate dynamometer performance over a range of advance ratios from about 0.3 to 0.6.

4.2. Effect of Pitch and Diameter

Increasing propeller pitch from 10 to 12 inches increases the susceptibility of boundary layer separation. This is apparent in Figure 13, where experimental results for efficiency peak at lower advance ratios with increasing pitch, particularly for thin electric propellers. The dynamometer is able to resolve the difference between thin electric and sport propellers, though the trend in pitch is not comparable across the propeller types. Therefore, the BEMT code appears to be more effective for validating a dynamometer with thin electric propellers, and a reliable dynamometer should be able to indicate a trend in pitch and difference in propeller types.
Likewise, as propeller diameter decreases from 18 to 16 inches, peak propeller efficiency shifts to lower advance ratios due to low operating Reynolds numbers, which is apparent from experimental data in Figure 14. At low Reynolds numbers, the flow is dominated by viscous forces [11], hence increasing the sectional drag coefficient and flow separation; therefore hindering propeller efficiency and thrust coefficient, as manifested in the experimental results. Thus, a reliable dynamometer should also be able to resolve the effects of propeller diameter.

4.3. Uncertainty Analysis

Instrument bias error in this study is summarized in Table 4. The thrust–torque load cell measured the thrust and torque produced by the propeller, the pressure transducer measured the dynamic pressure, and the Hall-effect sensor measured the rotational speed of the propeller. Bias error is sufficiently low in this study to support conclusions.
In this study, an uncertainty analysis was performed on 18 × 10 propeller data. The standard deviation of measurements from the torque and thrust sensors are computed and used to determine precision error for thrust coefficient and propeller efficiency calculations. Figure 15 includes a plot of error for an 18 × 10 APC propeller. The plot of precision error shows how insignificant the error contribution is in the measurement data, as it is indistinguishable from the actual data measurement points. Therefore, the error in experimental data is sufficiently low.
Table 5 includes a breakdown of precision error contributions from the thrust and torque at a rotational speed of 3500 RPM and various wind tunnel speeds from 25 to 50 ft/s. Percent error for thrust and propeller efficiency is calculated using the standard deviation of thrust and propeller efficiency divided by average thrust and propeller efficiency values. The percent error is higher for thrust coefficient than propeller efficiency but does not exceed 7.7%.

5. Conclusions

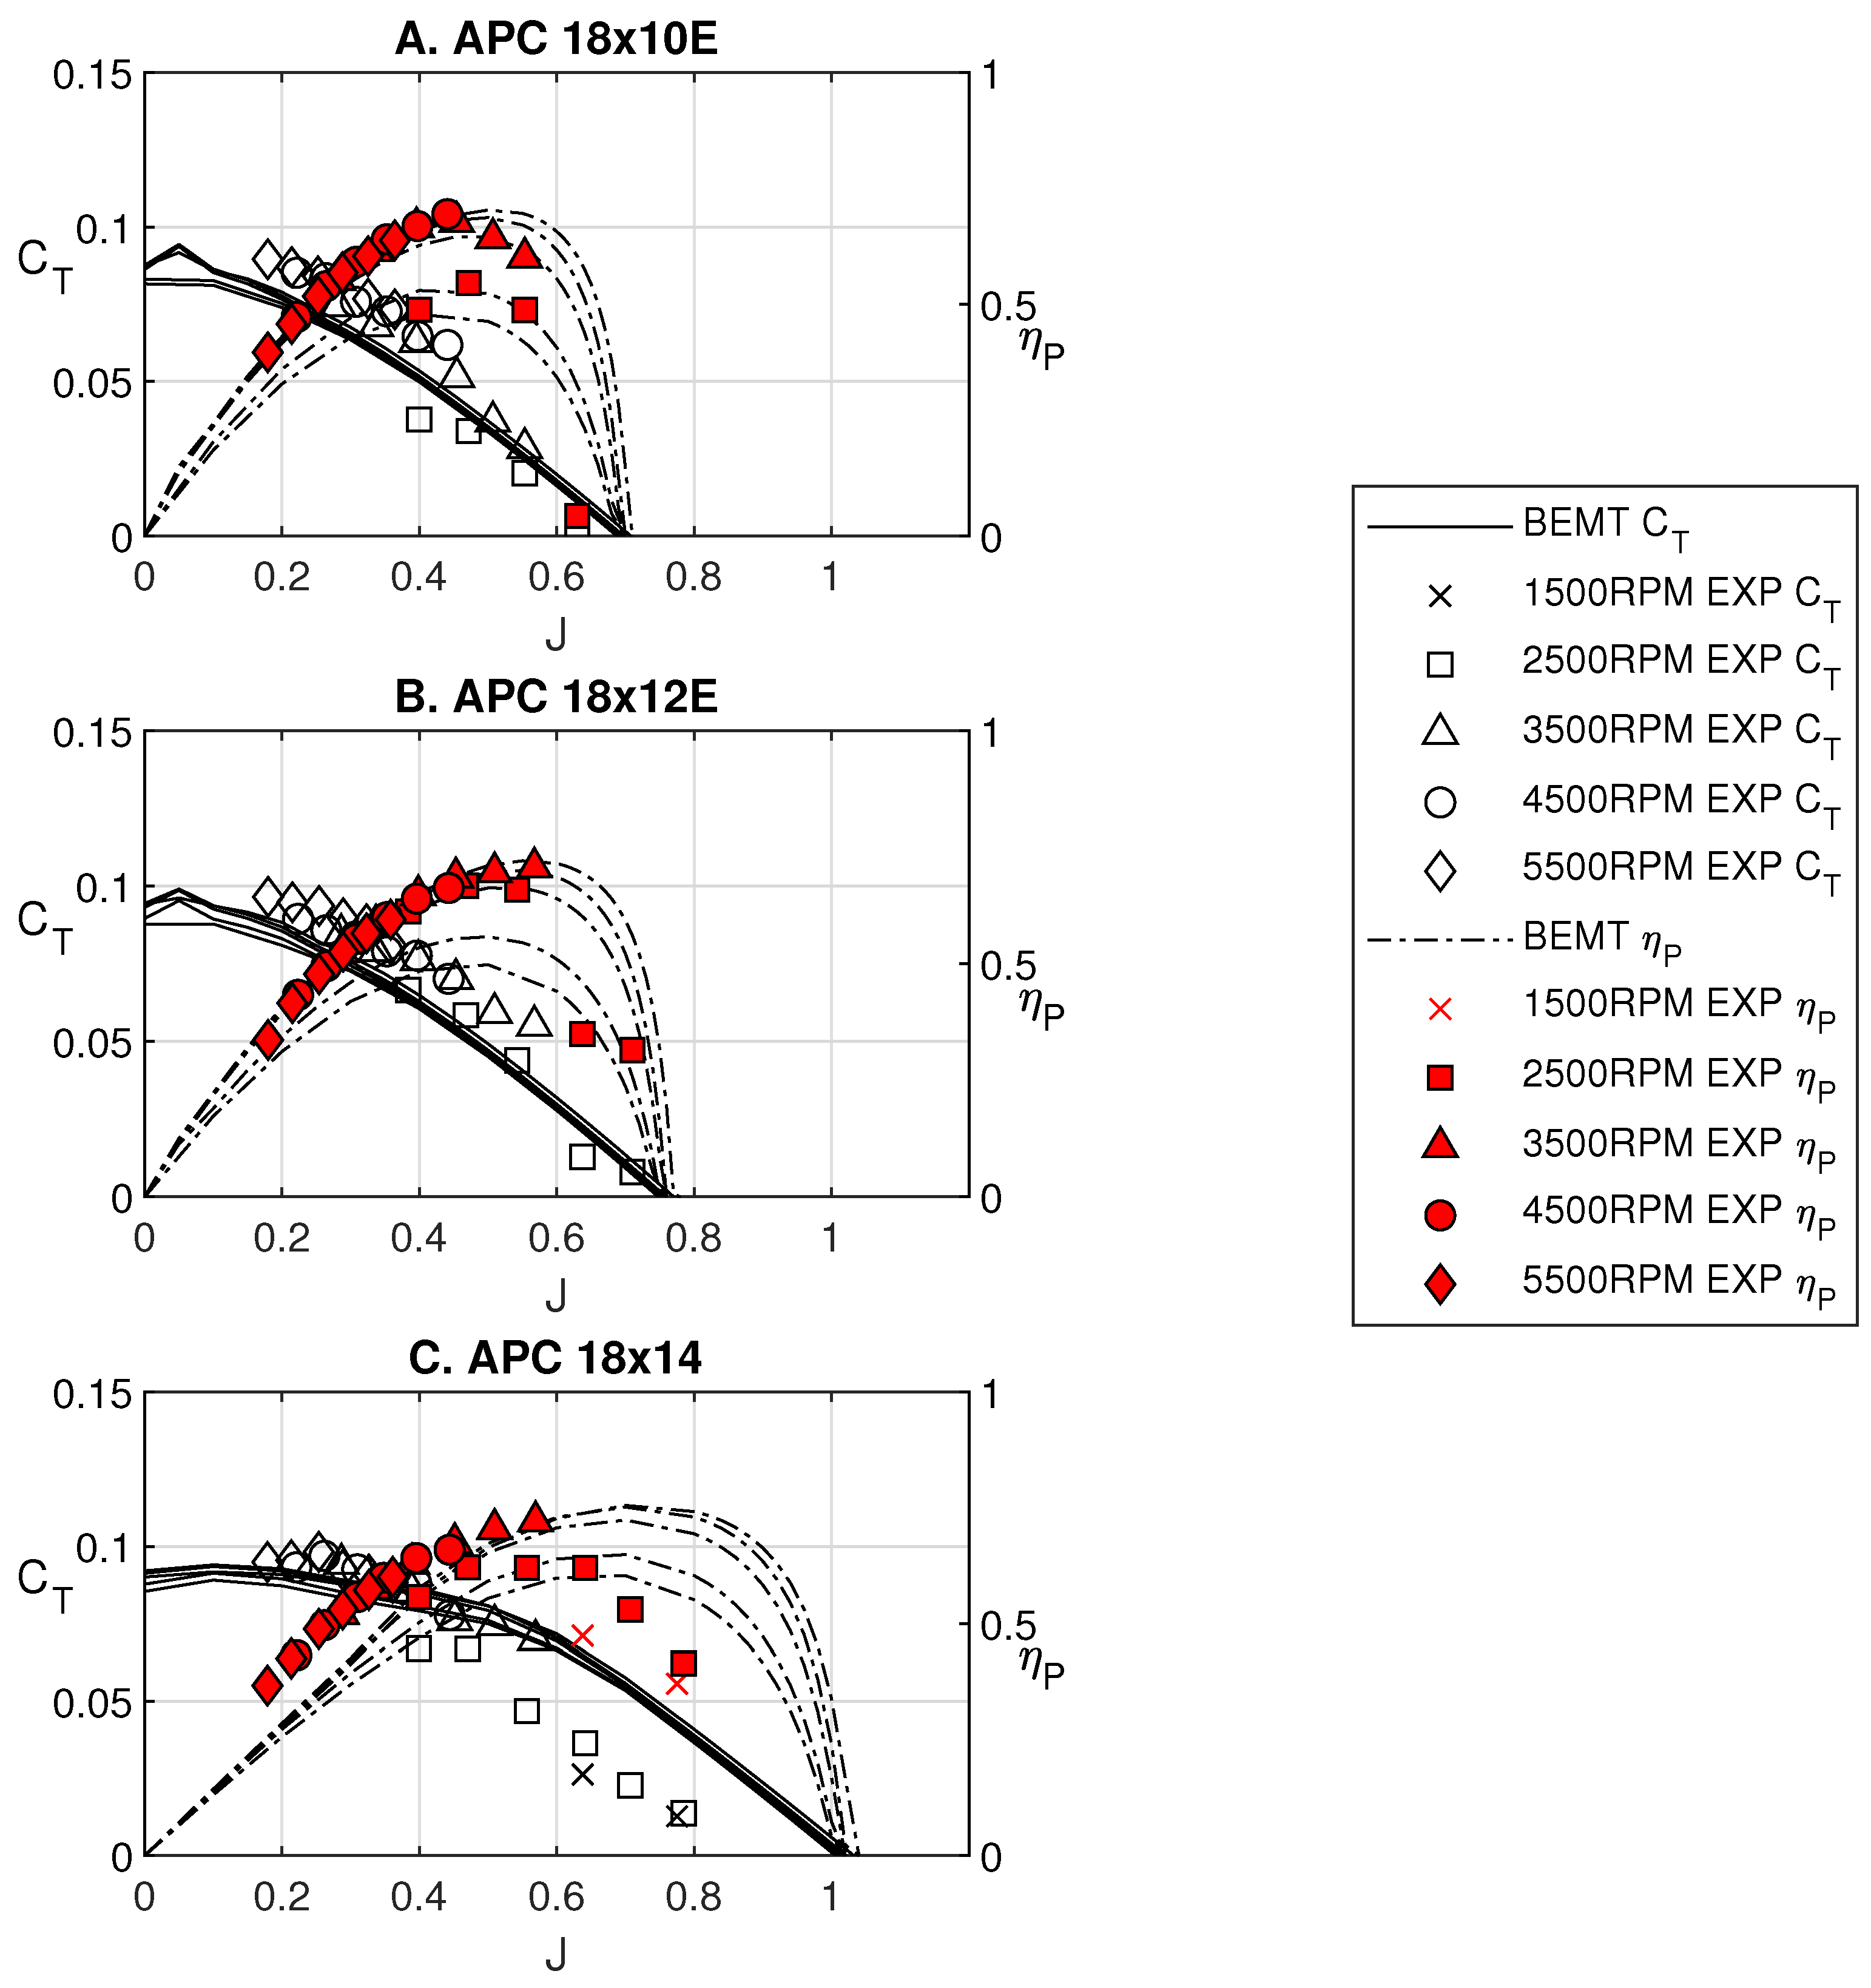
Group 2 unmanned aircraft represent a large and continually growing segment of aerospace operations and businesses that demand optimal mission performance enabled by propulsion systems. It is critical that reliable experimental propeller performance data are available to UAS designers and mission planners, especially when progressing from low-order models to validated, higher-fidelity estimates. Wind tunnel propeller dynamometer designs have been well-documented for a range of propeller sizes, and the principles have been applied to the dynamometer design in this study. However, it is important to have a proper method to validate dynamometer performance, which is particularly challenging for propellers at the low-Reynolds-number operating conditions often associated with Group 2 UAS. Because there is a lack of validated wind tunnel performance data for this particular scale, an approach to validating such wind tunnel propeller dynamometers is presented here. The method includes using BEMT code and experimental results to authenticate a dynamometer.
The proper application of the BEMT code was shown by comparing results to existing propeller data of a smaller scale (14 × 12E), revealing less than 10% difference between BEMT and experimental results over a range of advance ratios from 0.3 to 0.6. The BEMT code was then applied to larger-scale propellers to predict performance with a wind tunnel dynamometer at airspeeds relevant to Group 2 UAS. BEMT and experimental results were in good agreement, particularly for thin electric propellers, up to advance ratios of about 0.6, above which Reynolds number effects become problematic such that BEMT predicted propeller efficiency increases as thrust coefficient approaches zero.
The validation method proposed here also involved experimentally demonstrating expected effects of propeller diameter and pitch. Results showed that a reliable dynamometer should resolve that peak efficiency occurs at higher advance ratios with increasing pitch, showing peak efficiency at about a 25% higher advance ratio when increasing pitch from an 18 × 10E to 18 × 12E propeller. This effect was particularly noticeable for thin electric propellers. Peak efficiency also shifts to lower advance ratios as propeller diameter decreases. Peak efficiency occured at a 10% lower advance ratio from an 18 × 12E to 16 × 12E propeller. Furthermore, a dynamometer should be able to resolve differences in propeller type, as shown by results for thin electric and sport propellers, particularly apparent when comparing 18 × 12E thin electric propeller results to those of an 18 × 14 sport propeller.
Use of the method presented here is recommended for validating wind tunnel propeller dynamometers for Group 2 UAS. It is important to apply it to advance ratios between about 0.3 and 0.6 to ensure reliable propeller performance data. A validated dynamometer should produce thrust coefficient and propeller efficiency results within 10% of the results from BEMT analysis. Furthermore, a validated dynamometer should be able to resolve performance effects associated with varying propeller diameter and pitch, as well as propeller type. Future work related to this study is recommended to show the effects of novel flow control methods to mitigate degraded propeller performance due to low-Reynolds-number operating conditions. Results from such a study will be enabled with a validated propeller dynamometer.

Author Contributions

M.J.—Primary author, developer of BEMT code, experimental data post-processing. K.R.—Developed propeller dyno, writing and editing. R.P.—Writing and editing, assisting with BEMT code. A.R.—Assisting with experimental data collection. All authors have read and agreed to the published version of the manuscript.

Funding

The work described in this article received no external funding.

Data Availability Statement

Tabular data are included as Appendix A and Appendix B.

Acknowledgments

The authors acknowledge the effort expended by Brian Pizana on integration of the LabView data display system. Additionally, David Kelley’s load cell shroud design, build, and installation into the test facility is gratefully acknowledged. Finally, Thomas Rannock’s assistance mounting the hall-effect sensor to collect RPM data is acknowledged.

Conflicts of Interest

The authors declare no conflict of interest.

Appendix A. Propeller Modelling

The BEM code requires inputs of (1) propeller geometry and (2) 2-D sectional aerodynamic characteristics along the span. The data used in the BEM analysis in this paper are presented in this Appendix.

Appendix A.1. Propeller Geometry

The blade element model requires a geometric description of the propeller geometry to specify the twist distribution and airfoil profile along the length of the blade. Beta is the measured geometric pitch angle between the chord line and fixed plane of rotation. The tables below capture the inputs to the BEM code used to generate the theoretical data in Figure 11, Figure 12, Figure 13 and Figure 14. As documented in the narrative, since the vast majority of the propeller blade was reported to feature the NACA 4412 cross-section, the BEM results for all radial stations used airfoil data from this profile at the appropriate Reynolds number.
Table A1. APC 14 × 12 propeller geometry.
r/Rc/RBeta
0.080.13433.34
0.150.13643.37
0.230.14750.88
0.300.14646.08
0.370.14840.23
0.440.15334.88
0.510.15731.33
0.580.15728.22
0.650.15425.52
0.730.14723.64
0.800.13221.06
0.870.11018.89
0.940.07616.25
Table A2. APC 16 × 12 propeller geometry.
r/Rc/RBeta
0.060.10525.96
0.120.10233.08
0.190.11849.51
0.250.13647.22
0.310.15140.52
0.370.16134.33
0.440.16330.69
0.500.16127.12
0.560.15323.56
0.620.14220.87
0.690.13019.29
0.750.11318.19
0.810.09816.78
0.870.08415.80
0.940.07114.66
1.000.05613.21
Table A3. APC 18 × 10 propeller geometry.
r/Rc/RBeta
0.070.11817.45
0.120.11323.32
0.180.12239.95
0.240.13839.84
0.290.15034.43
0.350.15830.05
0.400.16226.22
0.460.16122.68
0.510.15519.17
0.570.14618.71
0.620.13615.91
0.680.12115.76
0.740.10714.77
0.790.09214.12
0.850.07613.54
0.900.06413.29
0.960.03611.60
Table A4. APC 18 × 12 propeller geometry.
r/Rc/RBeta
0.070.11620.10
0.120.10826.44
0.180.11941.44
0.240.13545.10
0.290.14638.65
0.350.15833.53
0.400.16227.55
0.460.16225.11
0.510.15723.11
0.570.15020.21
0.620.13919.13
0.680.12817.51
0.740.11415.91
0.790.09814.50
0.850.08513.07
0.900.07212.63
0.960.06012.43
Table A5. APC 18 × 14 propeller geometry.
r/Rc/RBeta
0.100.16625.85
0.150.16031.05
0.210.16436.02
0.260.16841.86
0.320.16139.68
0.370.15436.01
0.430.14533.35
0.490.13731.61
0.540.12729.28
0.600.11727.61
0.650.10525.28
0.710.09423.91
0.760.08121.55
0.820.07119.34
0.870.05819.07
0.930.04516.94

Appendix A.2. 2-D Sectional Aerodynamic Characteristics for APC Propeller Airfoils

Figure A1. Lift coefficient from XFOIL at different Reynolds numbers ranging from 2 × 10 4 to 1 × 10 6 .
Applsci 12 08908 g0a1
Figure A2. Drag coefficient from XFOIL at different Reynolds numbers ranging from 2 × 10 4 to 1 × 10 6 .
Applsci 12 08908 g0a2

Appendix B. Experimental Data

Table A6. APC 14 × 12 propeller wind tunnel raw data.
Speed (ft/s)RPMProp Power (ft-lb/s)Thrust (lb)Torque (ft-lb)
2515172.12−0.00260.0133
25254822.460.49380.0842
25350464.051.31750.1745
254507139.062.54060.2946
255512241.543.90420.4184
3015530.26−0.09540.0016
30253720.950.39070.0789
30349766.531.25980.1817
304611147.112.51090.3047
305464242.123.79590.4231
351506−1.77−0.1895−0.0112
35258519.120.27800.0706
35357067.261.13160.1799
354520137.482.22190.2905
355558262.623.83550.4512
401532−2.81−0.2715−0.0175
40250312.730.08920.0486
40357163.730.94220.1704
404572143.932.17300.3006
405639271.583.71890.4599
451757−5.30−0.4801−0.0288
4525979.19−0.04880.0338
45358661.780.79650.1645
454517143.362.02200.3031
455511265.883.49310.4607
501817−6.93−0.6062−0.0364
5025452.18−0.24600.0082
50352548.380.47290.1311
504554141.671.79640.2971
505559260.343.14040.4472
Table A7. APC 14 × 12 propeller wind tunnel processed data.
JCpCqCteta
0.84750.02690.0043−0.0010−0.0305
0.50460.06040.00960.06570.5496
0.36690.06620.01050.09280.5143
0.28530.06750.01070.10810.4567
0.23330.06410.01020.11110.4041
0.99350.00310.0005−0.0342−10.8215
0.60810.05700.00910.05250.5594
0.44120.06920.01100.08900.5681
0.33460.06670.01060.10210.5121
0.28240.06600.01050.10990.4703
1.1952−0.0230−0.0037−0.07223.7498
0.69630.04920.00780.03600.5089
0.50420.06570.01050.07670.5888
0.39820.06620.01050.09400.5656
0.32390.06800.01080.10730.5112
1.3428−0.0348−0.0055−0.10003.8612
0.82190.03610.00570.01230.2803
0.57610.06220.00990.06390.5913
0.44990.06700.01070.08990.6039
0.36480.06730.01070.10110.5477
1.3172−0.0434−0.0069−0.13444.0793
0.89110.02330.0037−0.0062−0.2387
0.64540.05960.00950.05350.5801
0.51240.06920.01100.08570.6347
0.41990.07060.01120.09940.5912
1.4152−0.0513−0.0082−0.15874.3749
1.01040.00590.0009−0.0328−5.6469
0.72950.04910.00780.03290.4887
0.56470.06670.01060.07490.6340
0.46260.06740.01070.08780.6031
Table A8. APC 16 × 12 propeller wind tunnel raw data.
Speed (ft/s)RPMProp Power (ft-lb/s)Thrust (lb)Torque (ft-lb)
2515173.35760.01230.0211
25253632.84650.82710.1237
25351494.53942.03890.2569
254493207.20603.77270.4404
255558397.24755.91010.6825
301562−0.3397−0.1378−0.0021
30258230.08920.59830.1113
30351298.40492.00620.2676
304581212.57703.65940.4431
305527392.32715.76190.6778
351567−1.9920−0.23945−0.0121
35256320.88150.30980.0778
35353196.52141.81320.2610
354450210.32783.58730.4513
355522384.50775.51790.6649
401583−4.0567−0.3500−0.0245
40256716.54230.15050.0615
40349493.61561.62050.2559
404543216.99243.44300.4561
405577416.56735.73640.7133
451558−5.7658−0.4778−0.0353
4525508.5515−0.09950.0320
45356292.52291.38690.2480
454624221.86073.23770.4582
455555418.47535.54730.7194
501591−7.2435−0.5630−0.0435
5026143.1477−0.25780.0115
50349171.93590.87950.1968
504470202.94322.79010.4335
505560405.07205.06910.6957
Table A9. APC 16 × 12 propeller wind tunnel processed data.
JCpCqCteta
0.74160.02190.00350.00270.0916
0.44360.04590.00730.06520.6295
0.32010.04970.00790.08370.5392
0.25040.05210.00830.09470.4552
0.20240.05280.00840.09690.3719
0.8643−0.0020−0.0003−0.028612.1662
0.52290.03990.00630.04550.5965
0.38440.05180.00820.08240.6116
0.29470.05040.00800.08840.5164
0.24430.05300.00840.09560.4406
1.0051−0.0118−0.0019−0.04944.2061
0.61450.02830.00450.02390.5192
0.44600.05000.00800.07370.6575
0.35390.05440.00870.09180.5970
0.28520.05210.00830.09170.5023
1.1371−0.0233−0.0037−0.07083.4508
0.70120.02230.00350.01160.3639
0.51520.05000.00800.06730.6924
0.39620.05280.00840.08450.6347
0.32280.05480.00870.09350.5508
1.2997−0.0348−0.0055−0.09973.7291
0.79410.01180.0019−0.0078−0.5235
0.56850.04670.00740.05540.6745
0.43790.05120.00810.07670.6567
0.36450.05570.00890.09110.5965
1.4142−0.0410−0.0065−0.11273.8860
0.86070.00400.0006−0.0191−4.0950
0.64450.03860.00610.03660.6113
0.50340.05180.00820.07080.6874
0.40470.05370.00860.08310.6257
Table A10. APC 18 × 10 propeller wind tunnel raw data.
Speed (ft/s)RPMProp Power (ft-lb/s)Thrust (lb)Torque (ft-lb)
2514931.7466−0.07290.0112
25250238.17680.74540.1457
253550134.22742.96540.3611
254516290.60715.49110.6145
255577555.72168.80600.9515
3015870.2933−0.20480.0018
30254538.17150.69410.1432
303563132.88202.72290.3561
304545303.27705.44870.6372
305605566.92478.64150.9659
351491−2.9645−0.3939−0.0190
35253029.50880.41090.1114
353537130.35112.48090.3519
354549293.36804.95740.6158
355548553.01628.17420.9518
401528−5.4990−0.5608−0.0344
40254017.99760.01930.0677
403521119.03182.01670.3228
404540296.01714.73650.6226
405554586.33138.32671.0081
451636−7.4761−0.7072−0.0436
4525407.0606−0.31340.0265
453550103.22121.47350.2777
454531282.44744.19830.5953
455533553.68827.42860.9556
501958−11.9256−0.8949−0.0582
502599−0.6172−0.5372−0.0023
50361497.62771.17330.2580
504538289.64954.02350.6095
505491547.62286.98820.9523
Table A11. APC 18 × 10 propeller wind tunnel processed data.
JCpCqCteta
0.66980.00660.0011−0.0103−1.0433
0.39970.03080.00490.03770.4881
0.28170.03800.00600.07440.5523
0.22140.03990.00640.08520.4724
0.17930.04050.00650.08960.3961
0.75610.00090.0001−0.0257−20.9487
0.47150.02930.00470.03390.5455
0.33680.03720.00590.06780.6147
0.26400.04090.00650.08340.5390
0.21410.04070.00650.08700.4573
0.9390−0.0113−0.0018−0.05614.6505
0.55340.02310.00370.02030.4873
0.39580.03730.00590.06270.6661
0.30780.03940.00630.07580.5914
0.25230.04100.00650.08400.5173
1.0471−0.0195−0.0031−0.07604.0794
0.62990.01390.00220.00090.0428
0.45440.03450.00550.05150.6777
0.35240.04000.00640.07270.6400
0.28810.04330.00690.08540.5681
1.1002−0.0216−0.0034−0.08364.2569
0.70870.00550.0009−0.0154−1.9971
0.50700.02920.00460.03700.6424
0.39730.03840.00610.06470.6689
0.32530.04140.00660.07680.6037
1.0215−0.0201−0.0032−0.07383.7520
0.7695−0.0004−0.0001−0.025243.5244
0.55340.02620.00420.02840.6009
0.44070.03920.00620.06180.6945
0.36420.04190.00670.07330.6380
Table A12. APC 18 × 12 propeller wind tunnel raw data.
Speed (ft/s)RPMProp Power (ft-lb/s)Thrust (lb)Torque (ft-lb)
2514653.2814−0.01760.0214
25260558.25401.42800.2135
253495155.36203.26580.4245
254477326.91325.67010.6973
255563701.10239.44751.2035
3015282.0179−0.06750.0126
30256554.57211.21510.2032
303565163.13833.17770.4370
304537338.48285.58510.7124
305578673.18029.32791.1524
351555−0.3309−0.2151−0.0020
35258249.12410.92510.1817
353514160.94922.97660.4374
354551347.43085.48960.7290
355512658.79738.99661.1413
401545−4.1078−0.4108−0.0254
40251129.41740.25680.1119
403531161.41752.76660.4365
404534342.20565.13650.7207
405535660.17818.68581.1390
451594−7.6263−0.5733−0.0457
45253523.27640.16300.0877
453533150.90182.33570.4079
454543356.35665.06880.7490
455571685.19688.61331.1745
501620−10.5793−0.7594−0.0624
5025114.8097−0.34160.0183
503525153.19122.16570.4150
504518341.66944.52980.7221
505584672.18577.99851.1495
Table A13. APC 18 × 12 propeller wind tunnel processed data.
JCpCqCteta
0.68260.01320.0021−0.0026−0.1341
0.38390.04170.00660.06660.6128
0.28610.04600.00730.08460.5255
0.22340.04610.00730.08950.4336
0.17980.05150.00820.09660.3369
0.78530.00720.0011−0.0091−1.0029
0.46780.04090.00650.05840.6680
0.33660.04560.00730.07910.5844
0.26450.04590.00730.08580.4950
0.21510.04910.00780.09480.4157
0.9003−0.0011−0.0002−0.028122.7538
0.54220.03610.00570.04390.6591
0.39840.04690.00750.07630.6473
0.30760.04660.00740.08380.5530
0.25400.04980.00790.09370.4780
1.0356−0.0141−0.0022−0.05443.9998
0.63720.02350.00370.01290.3492
0.45310.04640.00740.07020.6856
0.35290.04650.00740.07900.6004
0.28910.04930.00780.08970.5263
1.1292−0.0238−0.0038−0.07143.3827
0.71010.01810.00290.00800.3152
0.50950.04330.00690.05920.6965
0.39620.04810.00770.07770.6401
0.32310.05010.00800.08780.5657
1.2346−0.0315−0.0050−0.09153.5890
0.79650.00380.0006−0.0171−3.5512
0.56740.04430.00700.05510.7069
0.44270.04690.00750.07020.6629
0.35820.04880.00780.08110.5950
Table A14. APC 18 × 14 propeller wind tunnel raw data.
Speed (ft/s)RPMProp Power (ft-lb/s)Thrust (lb)Torque (ft-lb)
25156810.76210.20420.0655
25250559.55481.32860.2270
253490174.40103.63460.4772
254529349.58216.04470.7371
255593638.67519.38441.0904
3015487.80840.09670.0482
30255166.43631.37600.2487
303589186.90233.58630.4973
304586389.49336.44690.8110
305620672.26179.53681.1423
3515084.0276−0.04450.0255
35251552.81400.93590.2005
353599194.38043.49650.5157
354523376.06325.98690.7940
355520677.55139.46131.1721
4015571.1586−0.17820.0071
40249446.14920.71570.1767
403544179.51973.02550.4837
404600396.52645.93530.8231
405549678.32208.99541.1673
451509−3.3940−0.3962−0.0215
45254539.62540.46730.1487
453533188.10032.94510.5084
454552404.32745.76310.8482
455514686.69478.73781.1892
501450−3.1609−0.4205−0.0208
50254834.11720.28300.1279
503514188.81472.72350.5131
504504378.13944.98770.8017
505537711.81568.55551.2276
Table A15. APC 18 × 14 propeller wind tunnel processed data.
JCpCqCteta
0.63780.03530.00560.02630.4745
0.39920.04790.00760.06700.5577
0.28650.05190.00830.09440.5210
0.22080.04760.00760.09320.4323
0.17880.04620.00740.09490.3673
0.77520.02660.00420.01280.3715
0.47040.05060.00810.06690.6213
0.33440.05120.00810.08810.5756
0.26170.05110.00810.09700.4966
0.21350.04790.00760.09550.4256
0.92840.01490.0024−0.0062−0.3863
0.55670.04200.00670.04680.6202
0.38900.05280.00840.08540.6296
0.30950.05140.00820.09260.5572
0.25360.05100.00810.09820.4887
1.02760.00390.0006−0.0233−6.1519
0.64150.03760.00600.03640.6204
0.45150.05100.00810.07620.6741
0.34780.05150.00820.08870.5987
0.28830.05020.00800.09240.5305
1.1928−0.0125−0.0020−0.05505.2532
0.70730.03040.00480.02280.5306
0.50950.05400.00860.07460.7046
0.39540.05420.00860.08800.6414
0.32640.05180.00820.09090.5726
1.3793−0.0131−0.0021−0.06336.6513
0.78490.02610.00420.01380.4147
0.56920.05510.00880.06980.7212
0.44400.05240.00830.07780.6595
0.36120.05310.00840.08830.6010
Table A16. BEMT 14 × 12 APC propeller data.
Run at 1500 RPMRun at 2500 RPM
JCtCpetaJCtCpeta
00.1165050.095371000.1204130.091140
0.10.11910.0962040.12380.10.1226060.0926540.1323
0.20.1169870.096980.24130.20.1203890.0928970.2592
0.30.1123230.0961580.35040.30.1148820.0912080.3779
0.40.1079120.0966960.44640.40.1098030.0913890.4806
0.50.101230.0968860.52240.50.1025630.0912090.5622
0.60.0915240.0953270.57610.60.0924710.0892930.6214
0.70.0767850.0898860.5980.70.0776740.0836820.6497
0.80.0577680.0794620.58160.80.0586640.0731210.6418
0.820.0537740.0769320.57320.820.0546750.0705650.6353
0.840.0497370.0742710.56250.840.050640.0678750.6267
0.860.0456650.0714820.54940.860.0465720.0650580.6156
0.880.0415590.0685630.53340.880.042470.0621110.6017
0.90.0374180.0655110.5140.90.0383270.0590250.5844
0.920.0332370.0623220.49060.920.0341570.0558110.5631
0.940.0290320.0590040.46250.940.0299520.052460.5367
0.960.0248040.0555580.42860.960.0257260.0489810.5042
0.980.0205570.0519860.38750.980.0214810.0453770.4639
10.0162750.0482750.337110.0172080.0416380.4133
1.020.0119620.0444240.27471.020.0128980.0377530.3485
1.040.0076270.0404390.19611.040.0085660.0337360.2641
1.060.0032610.0363140.09521.060.0042080.029580.1508
1.08−0.001120.03205501.08−0.000180.0252850
Table A17. BEMT 14 × 12 APC propeller data.
Run at 3500 RPMRun at 4500 RPM
JCtCpetaJCtCpeta
00.1255980.087058000.1263180.0871740
0.10.1261550.0912010.13830.10.1265520.0911890.1388
0.20.1244680.090920.27380.20.1250370.0909540.2749
0.30.119770.0870610.41270.30.1205730.0871460.4151
0.40.1145120.0866130.52880.40.1157480.0865310.5351
0.50.106440.0858370.620.50.1081080.085550.6318
0.60.0951320.0831410.68650.60.096780.0824990.7039
0.70.0793040.0766090.72460.70.0804080.0755320.7452
0.80.060290.0657950.73310.80.0611240.0644040.7593
0.90.0400360.0514930.69980.90.0409530.0500170.7369
0.920.0358850.0482360.68440.920.0368210.0467420.7247
0.940.0316980.044840.66450.940.0326520.0433280.7084
0.960.0274910.0413160.63880.960.0284640.0397860.6868
0.980.0232660.0376660.60530.980.0242570.0361170.6582
10.0190130.033880.561210.0200240.0323120.6197
1.020.0147230.0299480.50151.020.0157550.0283610.5666
1.040.0104120.0258820.41841.040.0114650.0242760.4912
1.060.0060770.0216780.29711.060.0071510.0200530.378
1.080.0017140.0173330.10681.080.002810.0156870.1935
1.1−0.00270.01282201.1−0.001580.0111560
Table A18. BEMT 14 × 12 APC propeller data.
Run at 5500 RPM
JCtCpeta
00.1230140.0889780
0.10.1233620.0923340.1336
0.20.1227950.0921770.2664
0.30.1190540.0883350.4043
0.40.1155020.0877750.5264
0.50.1091830.0871130.6267
0.60.0990420.0845190.7031
0.70.0831770.0776860.7495
0.80.0639670.0664150.7705
0.90.0438950.0519630.7603
0.920.0397790.0486810.7518
0.940.0356290.0452640.7399
0.960.031460.0417220.7239
0.980.0272730.0380570.7023
10.0230570.0342570.6731
1.020.0188080.0303160.6328
1.040.0145280.0262350.5759
1.060.0102310.0220260.4924
1.080.0059040.0176740.3608
1.10.0015520.0131830.1295
1.12−0.002820.0085630
Table A19. BEMT 16 × 12 APC propeller data.
Run at 1500 RPMRun at 2500 RPM
JCtCpetaJCtCpeta
00.0858760.054212000.0879760.0511020.0001
0.10.0878240.0534160.16440.050.091410.0487340.0938
0.20.0841480.0550680.30560.10.0899420.0502720.1789
0.30.0777950.0555870.41990.150.0882940.0512070.2586
0.40.0694330.0551750.50340.20.0859060.0517310.3321
0.50.0569470.0522830.54460.250.0817130.0513910.3975
0.60.0415070.0463490.53730.30.0785070.0516810.4557
0.620.0381660.0447780.52840.350.0747190.0515770.507
0.640.0347720.043090.51650.40.0698870.0510960.5471
0.660.0313090.0413050.50030.450.0640140.0499360.5769
0.680.0278310.039390.48040.50.0573980.0481380.5962
0.70.024310.0373590.45550.550.0499970.0455540.6036
0.720.0207560.0352120.42440.60.0419630.0421330.5976
0.740.0171670.0329470.38560.610.0403090.0413620.5945
0.760.0135430.0305610.33680.620.0386250.0405490.5906
0.780.0098820.0280510.27480.630.0369330.0397110.5859
0.80.0061940.0254220.19490.640.0352350.0388470.5805
0.820.002470.0226650.08940.650.0335230.0379530.5741
0.84−0.001290.01976900.660.0317740.0370460.5661
0.670.0300380.0360940.5576
0.680.0282950.0351160.5479
0.690.0265430.0341080.537
0.70.0247790.0330690.5245
0.710.0230050.0320010.5104
0.720.0212250.0309050.4945
0.730.0194370.0297810.4765
0.740.0176410.0286260.456
0.750.0158330.0274390.4328
0.760.0140180.0262220.4063
0.770.0121950.0249770.376
0.780.0103630.0236990.3411
0.790.0085210.0223880.3007
0.80.0066760.0210510.2537
0.810.0048180.0196790.1983
0.820.0029530.0182750.1325
0.830.0010870.0168460.0535
0.84−0.00080.0153640
Table A20. BEMT 16 × 12 APC propeller data.
Run at 3500 RPMRun at 4500 RPM
JCtCpetaJCtCpeta
00.0916250.0468550.000100.0926690.0466120.0001
0.050.0937240.0480120.09760.050.0938150.0479340.0979
0.10.0934440.0465530.20070.10.094220.0464740.2027
0.150.0916550.0470610.29210.150.0925920.0468070.2967
0.20.0889280.0476650.37310.20.0899050.0475110.3785
0.250.0845020.0471170.44840.250.0856130.0468440.4569
0.30.0809390.0471870.51460.30.0822060.0467320.5277
0.350.0765080.0468170.5720.350.0779140.0461430.591
0.40.071130.046030.61810.40.0723880.045360.6384
0.450.065090.044740.65470.450.0662870.043880.6798
0.50.0583750.0428320.68140.50.0593330.0418520.7088
0.550.0509270.0401520.69760.550.0516220.0389810.7284
0.60.0429140.036670.70220.60.0435370.0354090.7377
0.650.03450.0324270.69160.650.0351380.0311220.7339
0.660.0327560.0315070.68620.660.0333840.0302020.7295
0.670.0310260.0305420.68060.670.0316610.0292310.7257
0.680.0292880.0295490.6740.680.0299280.0282310.7209
0.690.0275420.0285280.66610.690.0281870.0272020.715
0.70.0257830.0274760.65690.70.0264350.0261430.7078
0.710.0240160.0263940.6460.710.0246730.0250530.6992
0.720.0222410.0252840.63340.720.0229050.0239360.689
0.730.020460.0241450.61860.730.0211310.022790.6769
0.740.018670.0229760.60130.740.0193460.0216120.6624
0.750.0168690.0217750.5810.750.0175520.0204040.6452
0.760.015060.0205440.55710.760.015750.0191650.6246
0.770.0132440.0192830.52890.770.0139410.0178960.5998
0.780.0114190.017990.49510.780.0121230.0165960.5697
0.790.0095830.0166650.45430.790.0102930.0152620.5328
0.80.0077450.0153120.40470.80.0084630.0139020.487
0.810.0058950.0139250.34290.810.0066190.0125060.4287
0.820.0040370.0125060.26470.820.0047680.0110790.3529
0.830.0021790.0110610.16350.830.0029180.0096260.2516
0.840.0002950.0095630.02590.840.0010420.0081190.1078
0.85−0.00160.00802400.85−0.000850.0065720
Table A21. BEMT 16 × 12 APC propeller data.
Run at 5500 RPM
JCtCpeta
00.0883530.0490980.0001
0.050.0887590.0477260.093
0.10.0893330.0490540.1821
0.150.0887440.0493110.27
0.20.0872140.0496390.3514
0.250.083910.0488220.4297
0.30.0820310.0487930.5044
0.350.0796580.0485790.5739
0.40.0762480.048430.6298
0.450.0711520.0471930.6785
0.50.064650.045160.7158
0.550.0572350.0422630.7448
0.60.0493230.0386250.7662
0.650.0410450.0342790.7783
0.70.0324590.0292830.7759
0.710.0307230.0281970.7736
0.720.0289790.0270850.7703
0.730.0272250.0259440.7661
0.740.0254630.0247750.7606
0.750.0236890.0235740.7536
0.760.0219090.0223480.7451
0.770.0201210.0210930.7345
0.780.0183270.019810.7216
0.790.016520.0184950.7056
0.80.0147080.0171530.686
0.810.0128890.0157820.6615
0.820.0110580.0143780.6306
0.830.0092250.0129490.5913
0.840.0073880.0114870.5403
0.850.0055520.0099980.472
0.860.0037110.008480.3764
0.870.0018730.006940.2347
0.88−4.6 × 10 5 0.0053060
Table A22. BEMT 18 × 10 APC propeller data.
Run at 1500 RPMRun at 2500 RPM
JCtCpetaJCtCpeta
00.0815980.043840.000100.0831430.0407210.0001
0.10.0811260.0438590.1850.10.0826650.0407360.2029
0.20.0739190.0450840.32790.20.0752510.0418020.36
0.30.0634740.0444020.42890.30.0638440.0406750.4709
0.40.0498340.0416870.47820.40.0501980.0379090.5297
0.50.0336470.0363350.4630.50.0340140.0325010.5233
0.520.0302380.034950.44990.520.0306080.0311050.5117
0.540.026790.0334630.43230.540.027160.0296060.4954
0.560.0232820.0318620.40920.560.0236540.0279930.4732
0.580.0197420.0301440.37990.580.0201150.0262620.4442
0.60.0161610.028310.34250.60.0165360.0244160.4064
0.620.0125320.0263570.29480.620.0129120.0224510.3566
0.640.0088620.0242840.23350.640.0092420.0203650.2904
0.660.0051410.0220840.15360.660.0055240.0181520.2008
0.680.0013680.0197530.04710.680.0017520.0158060.0754
0.7−0.002440.01730100.7−0.002050.0133420
Table A23. BEMT 18 × 10 APC propeller data.
Run at 3500 RPMRun at 4500 RPM
JCtCpetaJCtCpeta
00.0862710.0359990.000100.0875910.0353670.0001
0.050.0937240.0316410.14810.050.0943690.0315210.1497
0.10.0852420.036130.23590.10.0863560.0355810.2427
0.150.08160.0367360.33320.150.0827980.0360010.345
0.20.0765430.0367840.41620.20.0776490.0361090.4301
0.250.070420.036070.48810.250.0715520.0351510.5089
0.30.0646990.0354190.5480.30.0656840.0344240.5724
0.350.0582390.0342830.59460.350.0590060.0332020.622
0.40.0509910.0325240.62710.40.0515960.0313460.6584
0.450.0431190.0300910.64480.450.0436140.0288230.6809
0.50.0348260.0270040.64480.50.0353290.025710.6871
0.550.0262420.0232570.62060.550.0267640.0219290.6712
0.560.0244870.0224240.61150.560.0250120.021090.6642
0.570.0227240.0215610.60080.570.0232540.020220.6555
0.580.0209560.0206680.58810.580.021490.019320.6451
0.590.0191780.0197480.5730.590.0197170.0183920.6325
0.60.0173860.0187960.5550.60.0179290.0174330.617
0.610.0155860.0178170.53360.610.0161330.0164470.5984
0.620.0137720.0168060.50810.620.0143240.0154290.5756
0.630.0119460.0157640.47740.630.0125030.0143790.5478
0.640.0101120.0146930.44050.640.0106750.0133010.5137
0.650.0082660.013590.39540.650.0088340.012190.471
0.660.0064040.0124520.33940.660.0069770.0110450.4169
0.670.0045270.011280.26890.670.0051050.0098640.3468
0.680.0026430.0100780.17830.680.0032270.0086550.2535
0.690.0007580.008850.05910.690.0013480.0074190.1254
0.7−0.001140.00758600.7−0.000550.0061460
Table A24. BEMT 18 × 10 APC propeller data.
Run at 5500 RPM
JCtCpeta
00.0873930.0361920.0001
0.050.0917410.033530.1368
0.10.0859710.0364250.236
0.150.0831880.0368320.3388
0.20.0789030.0370620.4258
0.250.0731940.0361120.5067
0.30.0674770.0353770.5722
0.350.0608220.0340890.6245
0.40.053430.0321730.6643
0.450.0454960.0296080.6915
0.50.0371980.0264450.7033
0.550.0286590.0226380.6963
0.560.0269140.0217950.6915
0.570.025160.0209210.6855
0.580.0234020.0200190.678
0.590.0216330.0190890.6686
0.60.0198520.0181290.657
0.610.0180590.017140.6427
0.620.0162550.0161220.6251
0.630.014440.0150730.6036
0.640.0126140.0139930.5769
0.650.0107790.0128850.5438
0.660.0089280.0117410.5018
0.670.007060.0105630.4478
0.680.0051870.0093560.377
0.690.0033150.0081260.2815
0.70.0014220.0068560.1451
0.71−0.00050.0055410
Table A25. BEMT 18 × 12 APC propeller data.
Run at 1500 RPMRun at 2500 RPM
JCtCpetaJCtCpeta
00.087760.0505780.000100.0896050.0471860.0001
0.10.087840.0506510.17340.050.0953730.0418510.1139
0.20.0809570.0518640.31220.10.0894510.0471360.1898
0.30.0726410.0519390.41960.150.0867550.0478520.2719
0.40.0605560.050.48450.20.083140.0482830.3444
0.50.0451840.0453350.49830.250.0776790.0477460.4067
0.60.0278350.0378340.44140.30.0730760.0476040.4605
0.620.0241880.0359730.41690.350.0674860.0468810.5038
0.640.0205140.0339920.38620.40.0610070.0456020.5351
0.660.0168060.031890.34780.450.0535930.0435610.5536
0.680.0130540.0296650.29920.50.0456320.0408650.5583
0.70.0092610.0273140.23730.550.0371620.0374610.5456
0.720.0054290.0248380.15740.560.0354270.0366920.5407
0.740.0015630.0222350.0520.570.0336610.0358840.5347
0.76−0.002390.01946900.580.0318810.0350470.5276
0.590.0300910.0341830.5194
0.60.0282890.033290.5099
0.610.0264720.0323660.4989
0.620.0246420.0314120.4864
0.630.0228080.0304280.4722
0.640.0209720.0294160.4563
0.650.0191230.0283710.4381
0.660.0172630.0272960.4174
0.670.0153940.0261910.3938
0.680.0135150.0250550.3668
0.690.0116240.0238870.3358
0.70.0097260.0226890.3001
0.710.0078180.0214590.2587
0.720.0058940.0201940.2102
0.730.0039670.01890.1532
0.740.002030.0175730.0855
0.750.0000990.0162260.0046
0.76−0.001920.0147880
Table A26. BEMT 18 × 12 APC propeller data.
Run at 3500 RPMRun at 4500 RPM
JCtCpetaJCtCpeta
00.0931870.0423930.00010.00.0944350.0419460.0001
0.050.0986650.0394790.1250.050.0991020.0394110.1257
0.10.0926520.0424490.21830.10.0937810.0420080.2232
0.150.0896290.0430480.31230.150.0908650.0424780.3209
0.20.0855640.043420.39410.20.0868620.0426660.4072
0.250.0796490.0426950.46640.250.0808470.042060.4805
0.30.0744470.0422970.5280.30.0756640.0414590.5475
0.350.0685980.0414060.57990.350.0697650.0405110.6027
0.40.0619360.0399860.61960.40.0628590.038940.6457
0.450.0545030.0378750.64760.450.0552610.0367430.6768
0.50.0465490.0351170.66280.50.0472120.0339040.6963
0.550.0380950.0316490.6620.550.0386670.0303520.7007
0.560.0363630.0308670.65970.60.0298260.0260730.6864
0.570.0346020.0300460.65640.610.0280180.0251280.6801
0.580.0328260.0291960.65210.620.0261980.0241530.6725
0.590.031040.0283180.64670.630.0243750.0231490.6634
0.60.0292420.0274120.64010.640.0225490.0221140.6526
0.610.027430.0264750.6320.650.0207110.0210490.6396
0.620.0256050.0255070.62240.660.0188610.0199510.6239
0.630.0237760.0245090.61120.670.0170020.0188240.6052
0.640.0219450.0234830.59810.680.0151350.0176660.5826
0.650.0201020.0224240.58270.690.0132550.0164750.5552
0.660.0182470.0213340.56450.70.0113690.0152540.5217
0.670.0163830.0202150.5430.710.0094720.0140010.4803
0.680.014510.0190640.51750.720.0075630.0127140.4283
0.690.0126250.0178810.48720.730.0056470.0113950.3618
0.70.0107320.0166680.45070.740.0037220.0100450.2742
0.710.008830.0154230.40650.750.0018050.0086730.1561
0.720.0069130.0141430.3520.76−0.00020.0072110
0.730.0049920.0128330.284
0.740.0030610.0114910.1971
0.750.0011370.0101280.0842
0.76−0.000870.0086740
Table A27. BEMT 18 × 12 APC propeller data.
Run at 5500 RPM
JCtCpeta
00.094190.0428570.0001
0.050.0962460.0413930.1163
0.10.0936720.0429540.2181
0.150.0916320.0434850.3161
0.20.0883470.0437640.4037
0.250.0825180.0430050.4797
0.30.0775520.0424070.5486
0.350.0717460.0414230.6062
0.40.0648670.039790.6521
0.450.0573050.0375410.6869
0.50.0492810.0346580.711
0.550.0407350.0310630.7213
0.60.0319220.0267650.7156
0.610.030120.0258190.7116
0.620.0283060.0248430.7064
0.630.0264890.0238380.7001
0.640.0246670.0228030.6923
0.650.0228360.0217390.6828
0.660.0209910.0206420.6712
0.670.0191370.0195160.657
0.680.0172750.018360.6398
0.690.01540.0171710.6188
0.70.0135180.0159540.5931
0.710.0116250.0147030.5613
0.720.0097250.0134240.5216
0.730.0078110.0121090.4709
0.740.0058920.0107650.405
0.750.0039620.0093870.3166
0.760.0020190.0079750.1925
0.770.0000530.0065180.0063
0.78−0.001930.0050180
Table A28. BEMT 18 × 14 APC propeller data.
Run at 1500 RPMRun at 2500 RPM
JCtCpetaJCtCpeta
00.0854150.06742000.0877650.0647120
0.10.0890850.0678580.13130.10.0913170.0659660.1384
0.20.0872190.0680080.25650.20.0895020.0655140.2732
0.30.0828290.0672160.36970.30.0845720.0643720.3941
0.40.0791150.0673280.470.40.0806180.0641430.5027
0.50.0749760.0675890.55460.50.0760670.0642410.592
0.60.0664010.0665640.59850.60.0670510.062920.6394
0.70.0535110.0620760.60340.70.054020.0582620.649
0.80.0366230.0531150.55160.80.0371460.0492260.6037
0.820.0331780.0509910.53350.820.0337040.0470870.5869
0.840.0297070.0487610.51180.840.0302350.044840.5664
0.860.0262050.0464220.48550.860.0267380.0424870.5412
0.880.0226690.0439680.45370.880.0232060.0400160.5103
0.90.0191390.041430.41580.90.0196770.037460.4728
0.920.0155880.0387880.36970.920.0161320.0348040.4264
0.940.0120090.0360350.31330.940.0125580.0320340.3685
0.960.0084120.0331770.24340.960.0089630.0291580.2951
0.980.0047790.0301960.15510.980.0053380.0261630.1999
10.0011430.0271230.042110.0017030.023070.0738
1.02−0.002510.0239450
Table A29. BEMT 18 × 14 APC propeller data.
Run at 3500 RPMRun at 4500 RPM
JCtCpetaJCtCpeta
00.0912820.062056000.0920830.0621740
0.10.0934650.065330.14310.10.0940210.0653040.144
0.20.0920490.0648380.28390.20.092760.064880.2859
0.30.0877340.0623280.42230.30.088710.0624690.426
0.40.0844110.0609450.5540.40.0863860.0597780.578
0.50.0792810.0606920.65310.50.080810.060040.673
0.60.0693640.0588860.70680.60.070490.057960.7297
0.70.0550830.0532830.72370.70.0558030.0519710.7516
0.80.038280.0441250.6940.80.0390270.0427690.73
0.820.0348530.0419590.68110.820.0356140.0405870.7195
0.840.0313970.0396850.66460.840.0321730.0382960.7057
0.860.0279150.0373040.64350.860.0287060.0358990.6877
0.880.0243980.0348060.61690.880.0252040.0333830.6644
0.90.0208860.0322220.58340.90.0217070.0307810.6347
0.920.0173570.0295360.54060.920.0181950.0280780.5962
0.940.0137990.0267370.48510.940.0146530.025260.5453
0.960.0102220.0238310.41180.960.0110930.0223360.4768
0.980.0066140.0208060.31150.980.0075030.0192930.3811
10.0029970.0176810.169510.0039050.0161490.2418
1.020.0002970.0129050.0235
1.04−0.003570.0097250
Table A30. BEMT 18 × 14 APC propeller data.
Run at 5500 RPM
JCtCpeta
00.090070.0633080
0.10.0917430.0660010.139
0.20.0908910.0657240.2766
0.30.0872280.0634310.4125
0.40.0854630.060570.5644
0.50.0806950.0607610.664
0.60.0717170.0591750.7272
0.70.057610.0534020.7552
0.80.0409530.0441620.7419
0.820.0375550.0419710.7337
0.840.0341240.0396710.7226
0.860.0306660.0372620.7078
0.880.0271780.0347430.6884
0.90.0236940.0321390.6635
0.920.020190.0294330.6311
0.940.0166630.0266190.5884
0.960.0131160.02370.5313
0.980.0095390.0206640.4524
10.0059480.0175260.3394
1.020.0023530.0142930.1679
1.04−0.001510.011120

References

  1. Gur, O.; Rosen, A. Propeller performance at low advance ratio. J. Aircr. 2005, 42, 435–441. [Google Scholar] [CrossRef]
  2. Kutty, H.A.; Rajendran, P. 3D CFD simulation and experimental validation of small APC slow flyer propeller blade. Aerospace 2017, 4, 10. [Google Scholar] [CrossRef]
  3. Islami, Z.S.; Hartono, F. Development of small propeller test bench system. IOP Conf. Ser. Mater. Sci. Eng. 2019, 645, 012017. [Google Scholar] [CrossRef]
  4. Czyż, Z.; Karpiński, P.; Skiba, K.; Wendeker, M. Wind Tunnel Performance Tests of the Propellers with Different Pitch for the Electric Propulsion System. Sensors 2022, 22, 2. [Google Scholar] [CrossRef] [PubMed]
  5. Podsędkowski, M.; Konopiński, R.; Obidowski, D.; Koter, K. Variable Pitch Propeller for UAV-Experimental Tests. Energies 2020, 13, 5264. [Google Scholar] [CrossRef]
  6. Avanzini, G.; Nisio, A.D.; Lanzolla, A.; Stigliano, D. A test-bench for battery-motor-propeller assemblies designed for multirotor vehicles. In Proceedings of the 2020 IEEE 7th International Workshop on Metrology for AeroSpace (MetroAeroSpace), Pisa, Italy, 22–24 June 2020; pp. 600–605. [Google Scholar] [CrossRef]
  7. Scanavino, M.; Vilardi, A.; Guglieri, G. An Experimental Analysis on Propeller Performance in a Climate-controlled Facility. J. Intell. Robot. Syst. 2020, 100, 505–517. [Google Scholar] [CrossRef]
  8. Speck, S.; Herbst, S.; Kim, H.; Stein, F.G.; Hornung, M. Development, Startup Operations and Tests of a Propeller Wind Tunnel Test Rig. In Proceedings of the 33rd AIAA Applied Aerodynamics Conference, Dallas, TX, USA, 22–26 June 2015. [Google Scholar] [CrossRef]
  9. Brandt, J.B. Small-Scale Propeller Performance at Low Speeds. Master’s Thesis, University of Illinois at Urbana-Champaign, Champaign, IL, USA, 2005. [Google Scholar]
  10. Brandt, J.; Selig, M. Propeller Performance Data at Low Reynolds Numbers. In Proceedings of the 49th AIAA Aerospace Sciences Meeting Including the New Horizons Forum and Aerospace Exposition, Orlando, FL, USA, 4–7 January 2011. [Google Scholar] [CrossRef]
  11. Deters, R.W.; Ananda Krishnan, G.K.; Selig, M.S. Reynolds number effects on the performance of small-scale propellers. In Proceedings of the 32nd AIAA Applied Aerodynamics Conference, Atlanta, GA, USA, 16–20 June 2014; p. 2151. [Google Scholar] [CrossRef] [Green Version]
  12. Deters, R.W. Performance and Slipstream Characteristics of Small-Scale Propellers at Low Reynolds Numbers; University of Illinois at Urbana-Champaign: Champaign, IL, USA, 2014. [Google Scholar]
  13. Dantsker, O.; Caccamo, M.; Deters, R.W.; Selig, M.S. Performance Testing of Aero-Naut CAM Folding Propellers. In Proceedings of the AIAA AVIATION 2020 FORUM, Virtual Event, 15–19 June 2020; p. 2762. [Google Scholar]
  14. McCrink, M.H.; Gregory, J.W. Blade Element Momentum Modeling of Low-Re Small UAS Electric Propulsion Systems. In Proceedings of the 33rd AIAA Applied Aerodynamics Conference 2015, Dallas, TX, USA, 22–26 June 2015. [Google Scholar]
  15. Van Treuren, K.; Sanchez, R.; Bennett, B.; Wisniewski, C. Testing UAS Propellers Designed for Minimum Induced Drag. In Proceedings of the AIAA AVIATION 2021 FORUM, Virtual Event, 2–6 August 2021. [Google Scholar] [CrossRef]
  16. Gamble, D.; Arena, A. Automated Dynamic Propeller Testing at Low Reynolds Numbers. In Proceedings of the 48th AIAA Aerospace Sciences Meeting Including the New Horizons Forum and Aerospace Exposition, Orlando, FL, USA, 4–7 January 2010; p. 853. [Google Scholar]
  17. Bellcock, A.; Rouser, K. Design of Vortex Generator Jets for Small UAS Propellers at Low Reynolds Number Operation. In Proceedings of the 2018 AIAA Information Systems-AIAA Infotech @ Aerospace, Kissimmee, FL, USA, 8–12 January 2018. [Google Scholar] [CrossRef]
  18. Lowe, T.E. Mobile Propeller Dynamometer Validation. Master’s Thesis, Oklahoma State University, Stillwater, AK, USA, 2013. Available online: http://argo.library.okstate.edu/login?url=https://www.proquest.com/dissertations-theses/mobile-propeller-dynamometer-validation/docview/1517984259/se-2?accountid=4117 (accessed on 27 June 2022).
  19. Boldman, D.R.; Iek, C.; Hwang, D.P.; Larkin, M.; Schweiger, P. Effect of a Rotating Propeller on the Separation Angle of Attack and Distortion in Ducted Propeller Inlets. In Proceedings of the 31st Aerospace Sciences Meeting, Reno, NV, USA, 11–14 January 1993. [Google Scholar]
  20. Corson, B.; Maynard, J. The Langley 2000-Horsepower Propeller Dynamometer and Tests at High Speed of an NACA 10-(3)(08)-03 Two-Blade Propeller; NACA TN 2859. 1952. Available online: https://ntrs.nasa.gov/citations/19930083637 (accessed on 27 June 2022).
  21. Reynolds, R.M.; Samonds, R.I.; Walker, J.H. An Investigation of Single- and Dual-Rotation Propellers at Positive and Negative Thrust, and in Combination with an NACA 1-series D-Type Cowling at Mach Numbers up to 0.84; NACA TR 1336. 1957. Available online: https://ntrs.nasa.gov/citations/19930092325 (accessed on 27 June 2022).
  22. Theodorsen, T. Theory of Propellers; McGraw-Hill: New York, NY, USA, 1948; Chapter 7; p. 14. [Google Scholar]
  23. Bangga, G. Comparison of Blade Element Method and CFD Simulations of a 10 MW Wind Turbine. Fluids 2018, 3, 73. [Google Scholar] [CrossRef]
  24. Plaza, B.; Bardera, R.; Visiedo, S. Comparison of BEM and CFD results for MEXICO rotor aerodynamics. J. Wind. Eng. Ind. Aerodyn. 2015, 145, 115–122. [Google Scholar] [CrossRef]
  25. Abdelhamid, B.; Smaïli, A.; Guerri, O.; Masson, C. Comparison of BEM and Full Navier-Stokes CFD Methods for Prediction of Aerodynamics Performance of HAWT Rotors. In Proceedings of the 2017 International Renewable and Sustainable Energy Conference (IRSEC), Tangier, Morocco, 4–7 December 2017. [Google Scholar] [CrossRef]
  26. Drela, M. XFOIL: An Analysis and Design System for Low Reynolds Number Airfoils. In Low Reynolds Number Aerodynamics; Springer: Berlin/Heidelberg, Germany, 1989. [Google Scholar]
  27. Selig, M.S. UIUC Airfoil Data Site; Department of Aeronautical and Astronautical Engineering University of Illinois at Urbana-Champaign: Champaign, IL, USA, 2007. [Google Scholar]
  28. Alves, P.J.F. Low Reynolds Number Propeller Performance Measurement in Wind Tunnel Test Rig. Master’s Thesis, Universidade da Beira Interior, Covilhã, Portugal, 2014. Available online: https://ubibliorum.ubi.pt/bitstream/10400.6/6454/1/3828_7604.pdf (accessed on 27 June 2022).
  29. Lowe, T.E. Development of a Microsoft Excel Based Uav Propeller Design and Analysis Tool. Master’s Thesis, Oklahoma State University, Stillwater, OK, USA, 2009. Available online: https://shareok.org/bitstream/handle/11244/48995/Lowe_okstate_0664M_14425.pdf?sequence=1 (accessed on 27 June 2022).
Figure 1. Previous OSU dynamometer for propeller flow control.
Applsci 12 08908 g001
Figure 2. NASA Langley 2000 hp dynamometer schematic [20].
Applsci 12 08908 g002
Figure 3. NASA Ames 1000 hp dynamometer schematic [21].
Applsci 12 08908 g003
Figure 4. BEMT solution process.
Applsci 12 08908 g004
Figure 5. Propeller discretized into blade segments.
Applsci 12 08908 g005
Figure 6. Velocities and force directions on propeller blade segment i.
Applsci 12 08908 g006
Figure 7. Motor mount backside (left) and cowling assembly (right).
Applsci 12 08908 g007
Figure 8. Dynamometer load cell arrangement (left) with cowling (right).
Applsci 12 08908 g008
Figure 9. Dynamometer dimensions in the wind tunnel.
Applsci 12 08908 g009
Figure 10. Wind tunnel data acquisition schematic.
Applsci 12 08908 g010
Figure 11. BEMT and APC C T , η P of a 18 × 12 APC propeller. Each line represents a constant RPM increasing from bottom to top of the plot.
Applsci 12 08908 g011
Figure 12. BEMT and UIUC C T , η P of a 14 × 12E APC propeller at 3500 RPM [27].
Applsci 12 08908 g012
Figure 13. BEMT and experimental C T and η P for APC propellers 18 × 10E, 18 × 12E, and 18 × 14.
Applsci 12 08908 g013
Figure 14. BEMT and experimental C T and η P for APC propellers 18 × 12E, 16 × 12, and 14 × 12.
Applsci 12 08908 g014
Figure 15. Plot of error on an 18 × 10 APC propeller.
Applsci 12 08908 g015
Table 1. Dynamometer electrical and instrumentation components.
ComponentManufacturerModelSpecifications
Drive MotorGreat PlainsRimfire 50CC5 kW, 55 V, 230 kV
DC Power SupplyMagna-PowerSL32-125/208
+LXI
4 kW, 32 V, 125 A
Electronic
Speed Controller
Castle CreationsPhoenix Edge
HV160
50 V, 160 A
Throttle ControllerGT PowerPro Digital
Servo Tester
7.4 V to 12 V DC input;
4.8 V output
Hall-Effect SensorHoneywellSS460S1.5 micro-sec
rise–fall
Thrust–Torque
Load Cell
FutekMBA50050 lb, 50 in-lb;
Error 0.25% RO
Table 2. Wind tunnel data acquisition instruments.
InstrumentsManufacturerModelSpecifications
Differential Pressure
Transducer
Omega
Engineering
PX653
-02D5V
Range  0.072 psi,
+/−0.3% of full scale
Power SupplyNational
Instruments
NI PS-1624 V, 10 A, 240 W
Signal Interface
to D-SUB
Phoenix
Contact
228121237-pole
Signal Management
Chassis
National
Instruments
NI
cDAQ-9188
8 slots for modules
Analog Signal
Input Module
National
Instruments
NI 922016-bit, +/−10 V,
16 channels
Analog Signal
Output Module
National
Instruments
NI 926416-bit, +/−10 V, 4 mA
16 channels
RPM Signal
Processor
ArduinoUno Rev3Operates at 5 V,
Clock Speed 16 MHz
Computer DAQDellPrecision
5810 Tower
64-bit, 32 GB RAM,
3.6 GHz processor
Table 3. Propeller test matrix to study effects of diameter and pitch.
Pitch
Diameter101214
18xxx
16 x
14 x
Table 4. Instrumentation error.
InstrumentBias Error
Thrust–Torque load cell0.25% RO
Temperature probe0.05
Pressure transducer0.3%
Hall-effect sensor1.5 ms
Table 5. Thrust and propeller efficiency error at 3500 RPM for an 18 × 10 APC propeller.
Speed (ft/s)C T η P C T Error η P Error% C T Error% η P Error
250.07440.55230.00060.00290.78120.5255
300.06780.61470.00090.00551.33420.8993
350.06270.66610.00250.01814.05772.7155
400.05150.67770.00130.01132.56791.6712
450.03700.64240.00200.02195.32653.4038
500.02840.60090.00220.02837.67104.7056
Publisher’s Note: MDPI stays neutral with regard to jurisdictional claims in published maps and institutional affiliations.

