
Experimental Study on Lateral and Vertical Capacity of Piled Raft and Pile Group System in Sandy Soil
 , , and
Abstract
:1. Introduction
2. Experimental Setup
2.1. Soil Tests
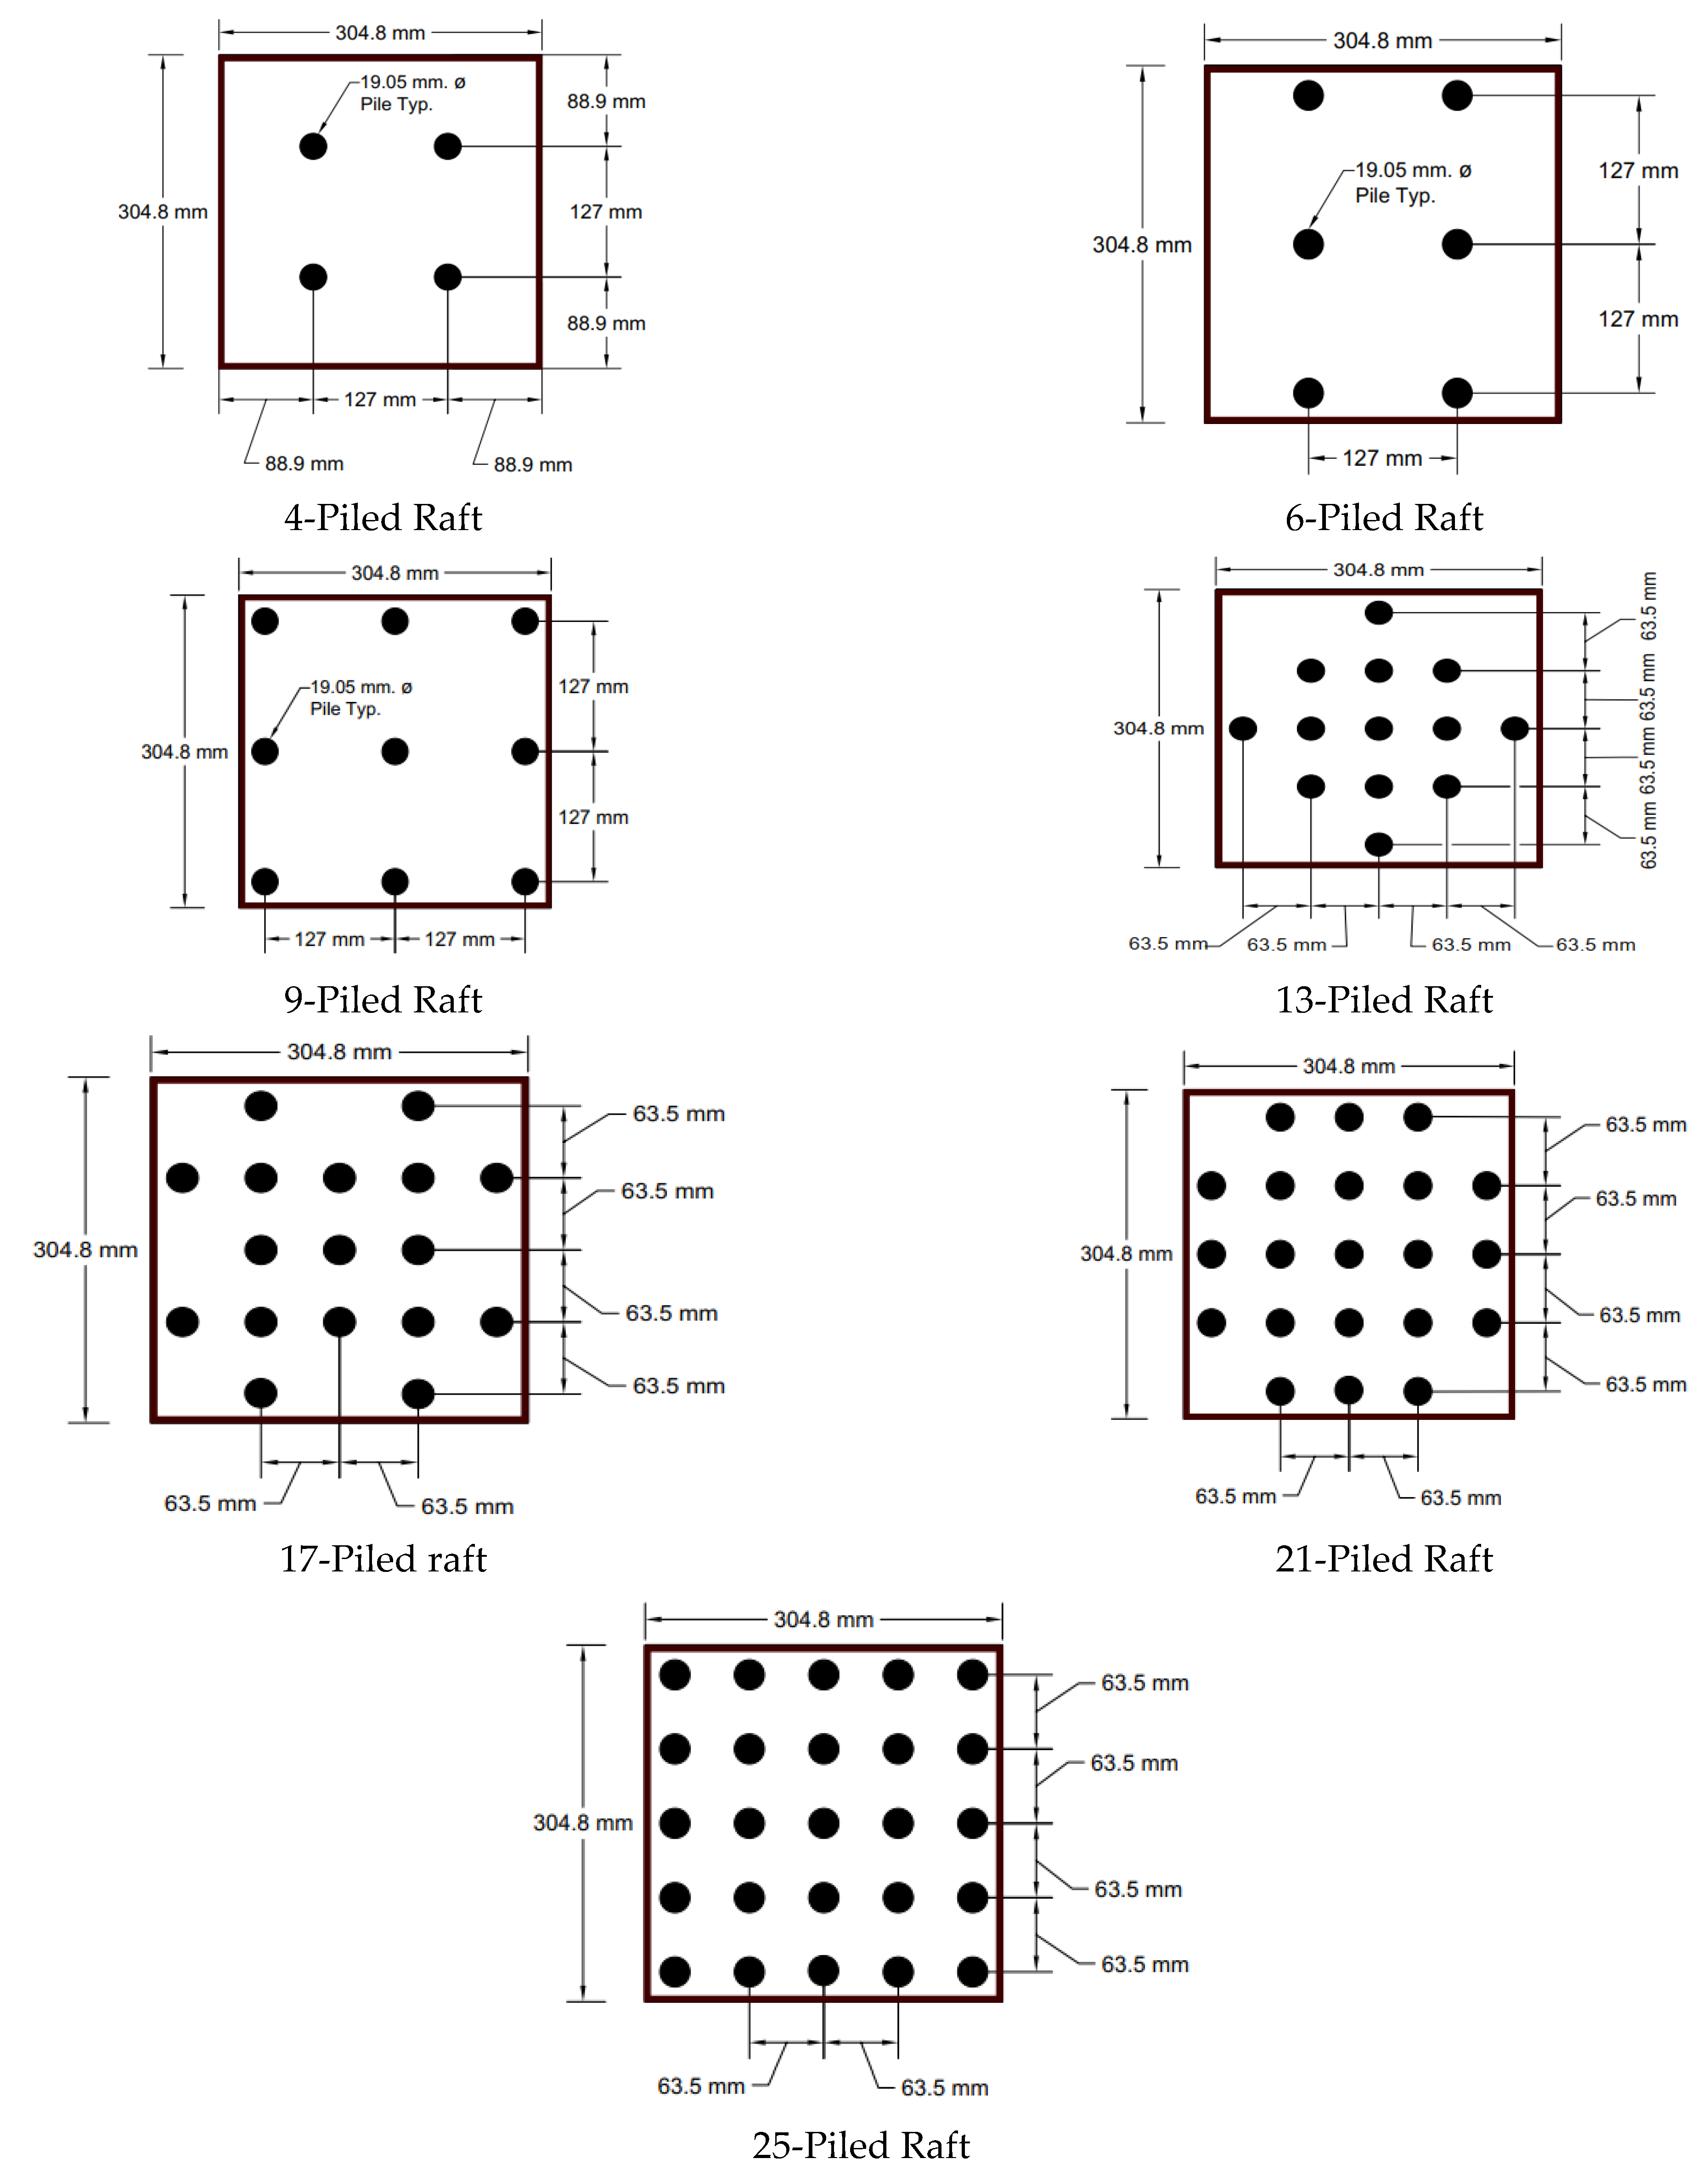
2.2. Models
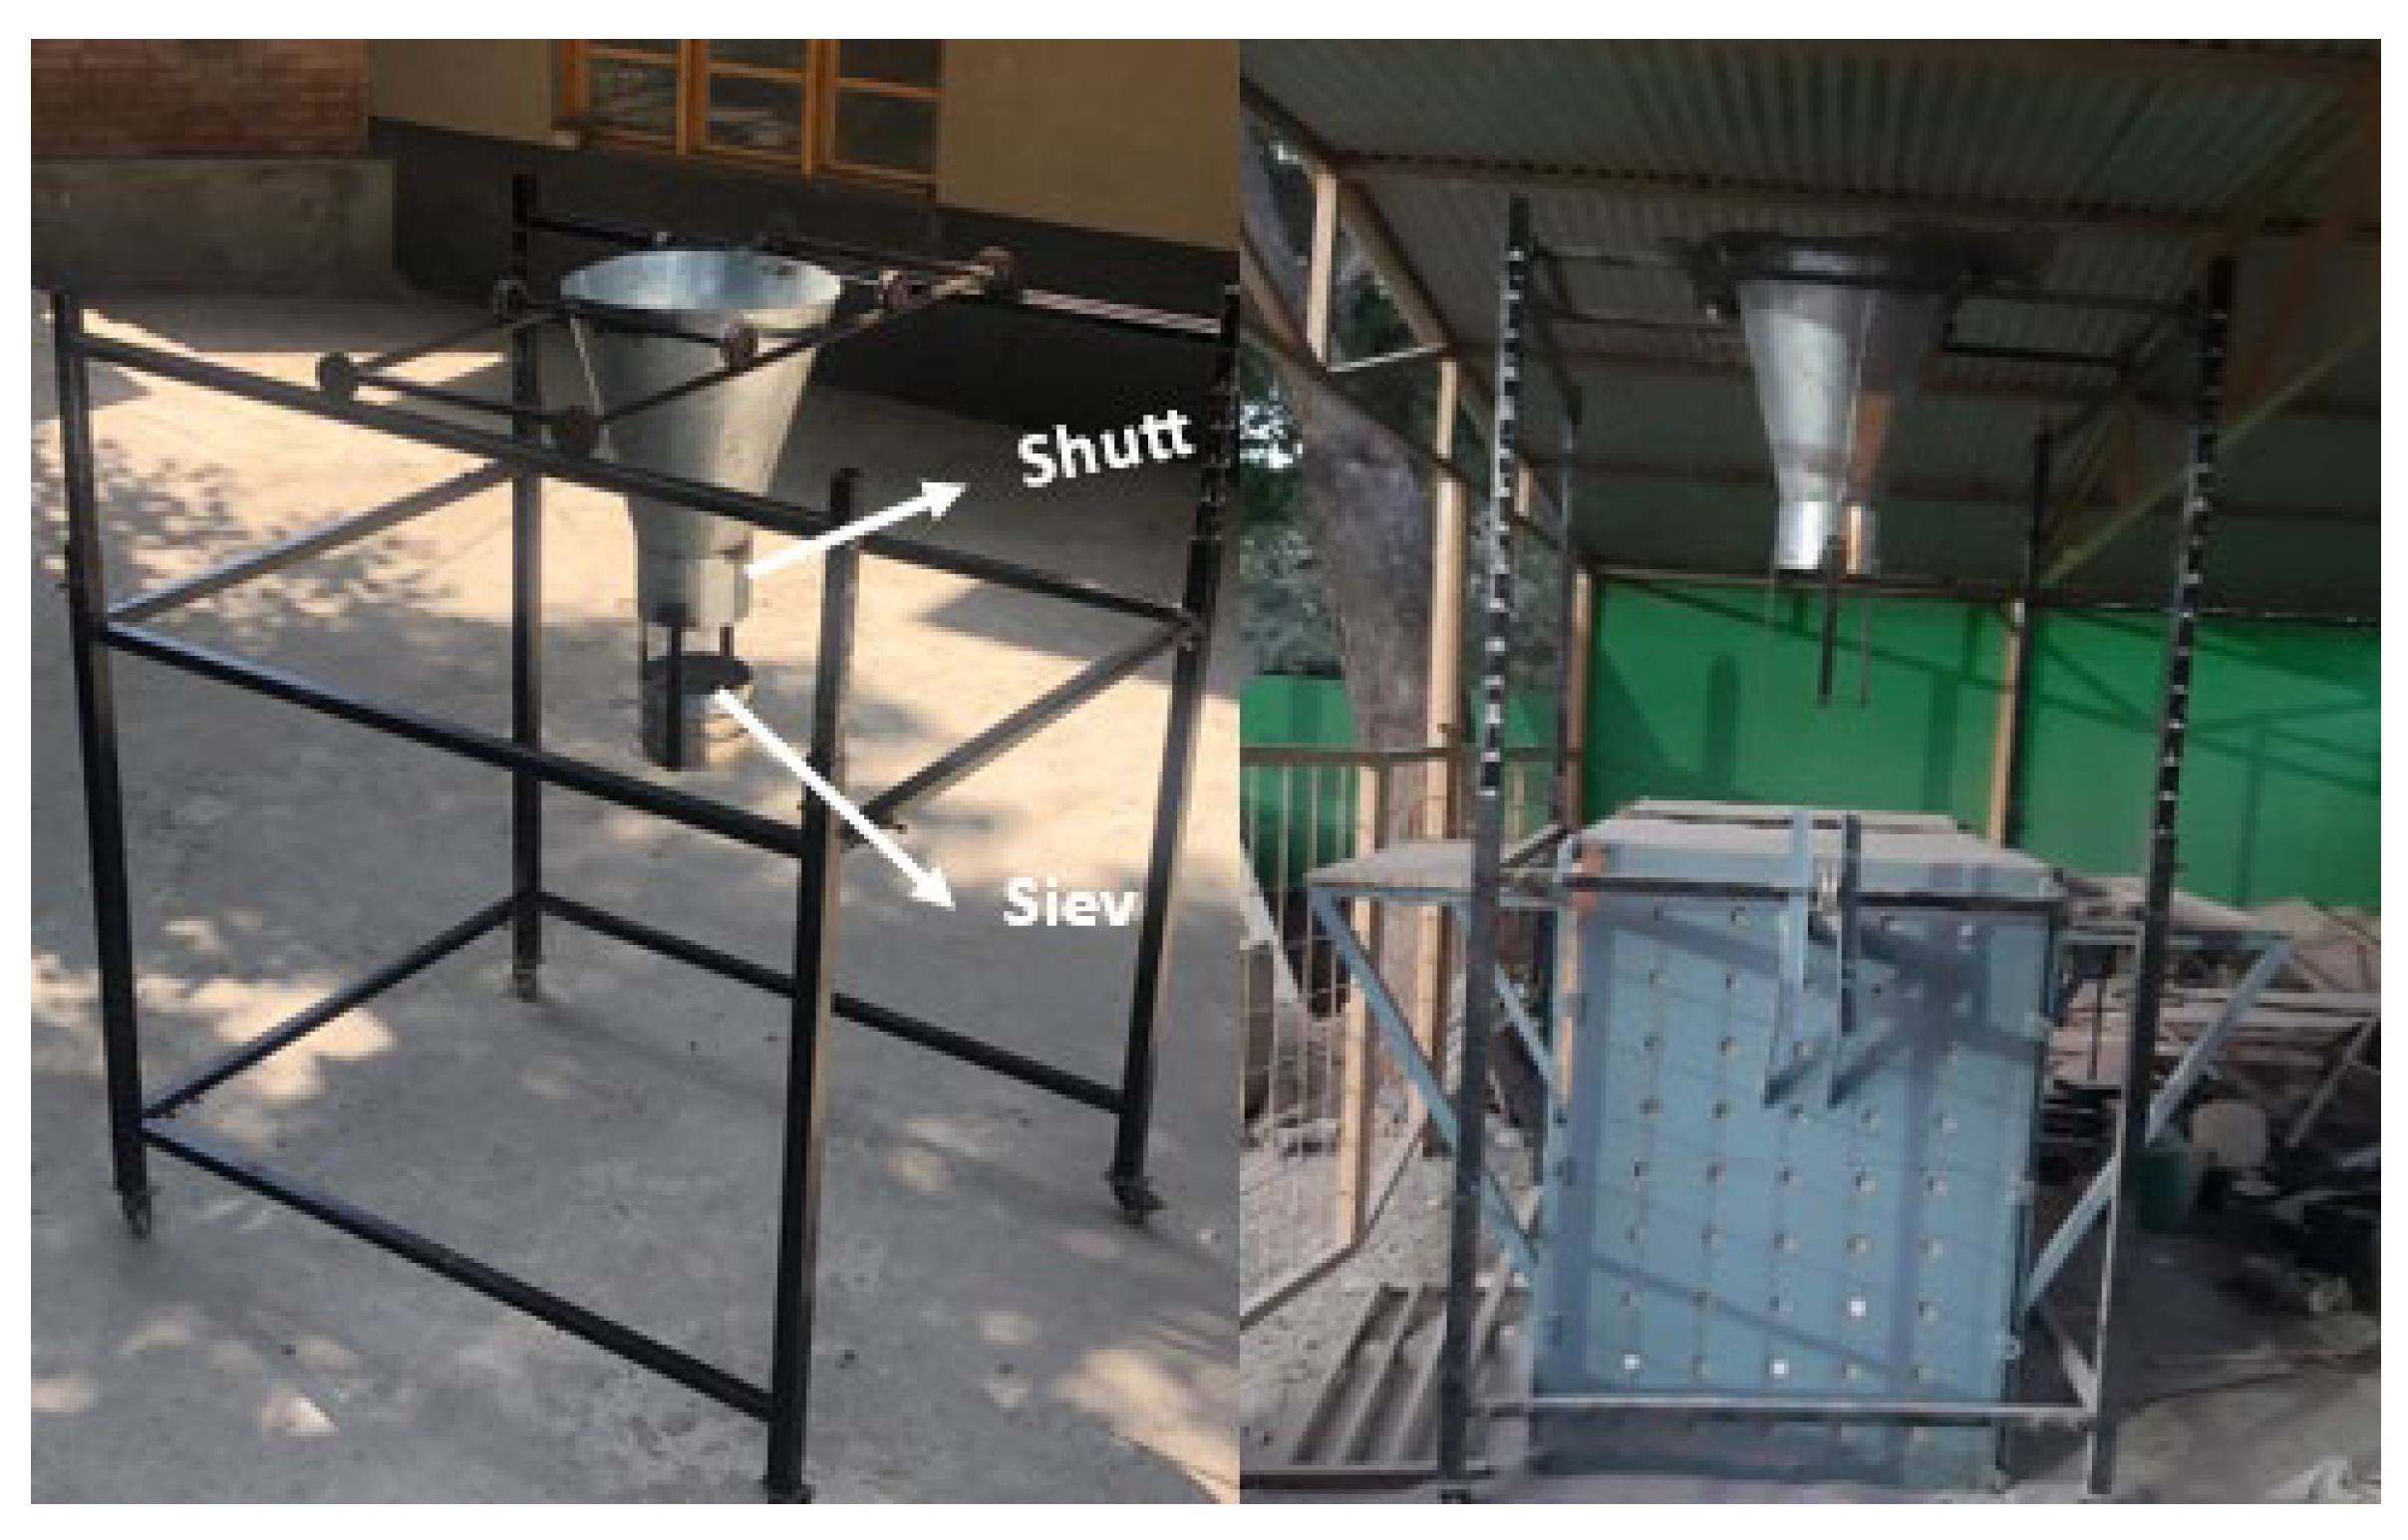
2.3. Sand Raining Technique
2.4. Test Procedure
2.5. Testing Models
3. Results and Discussions
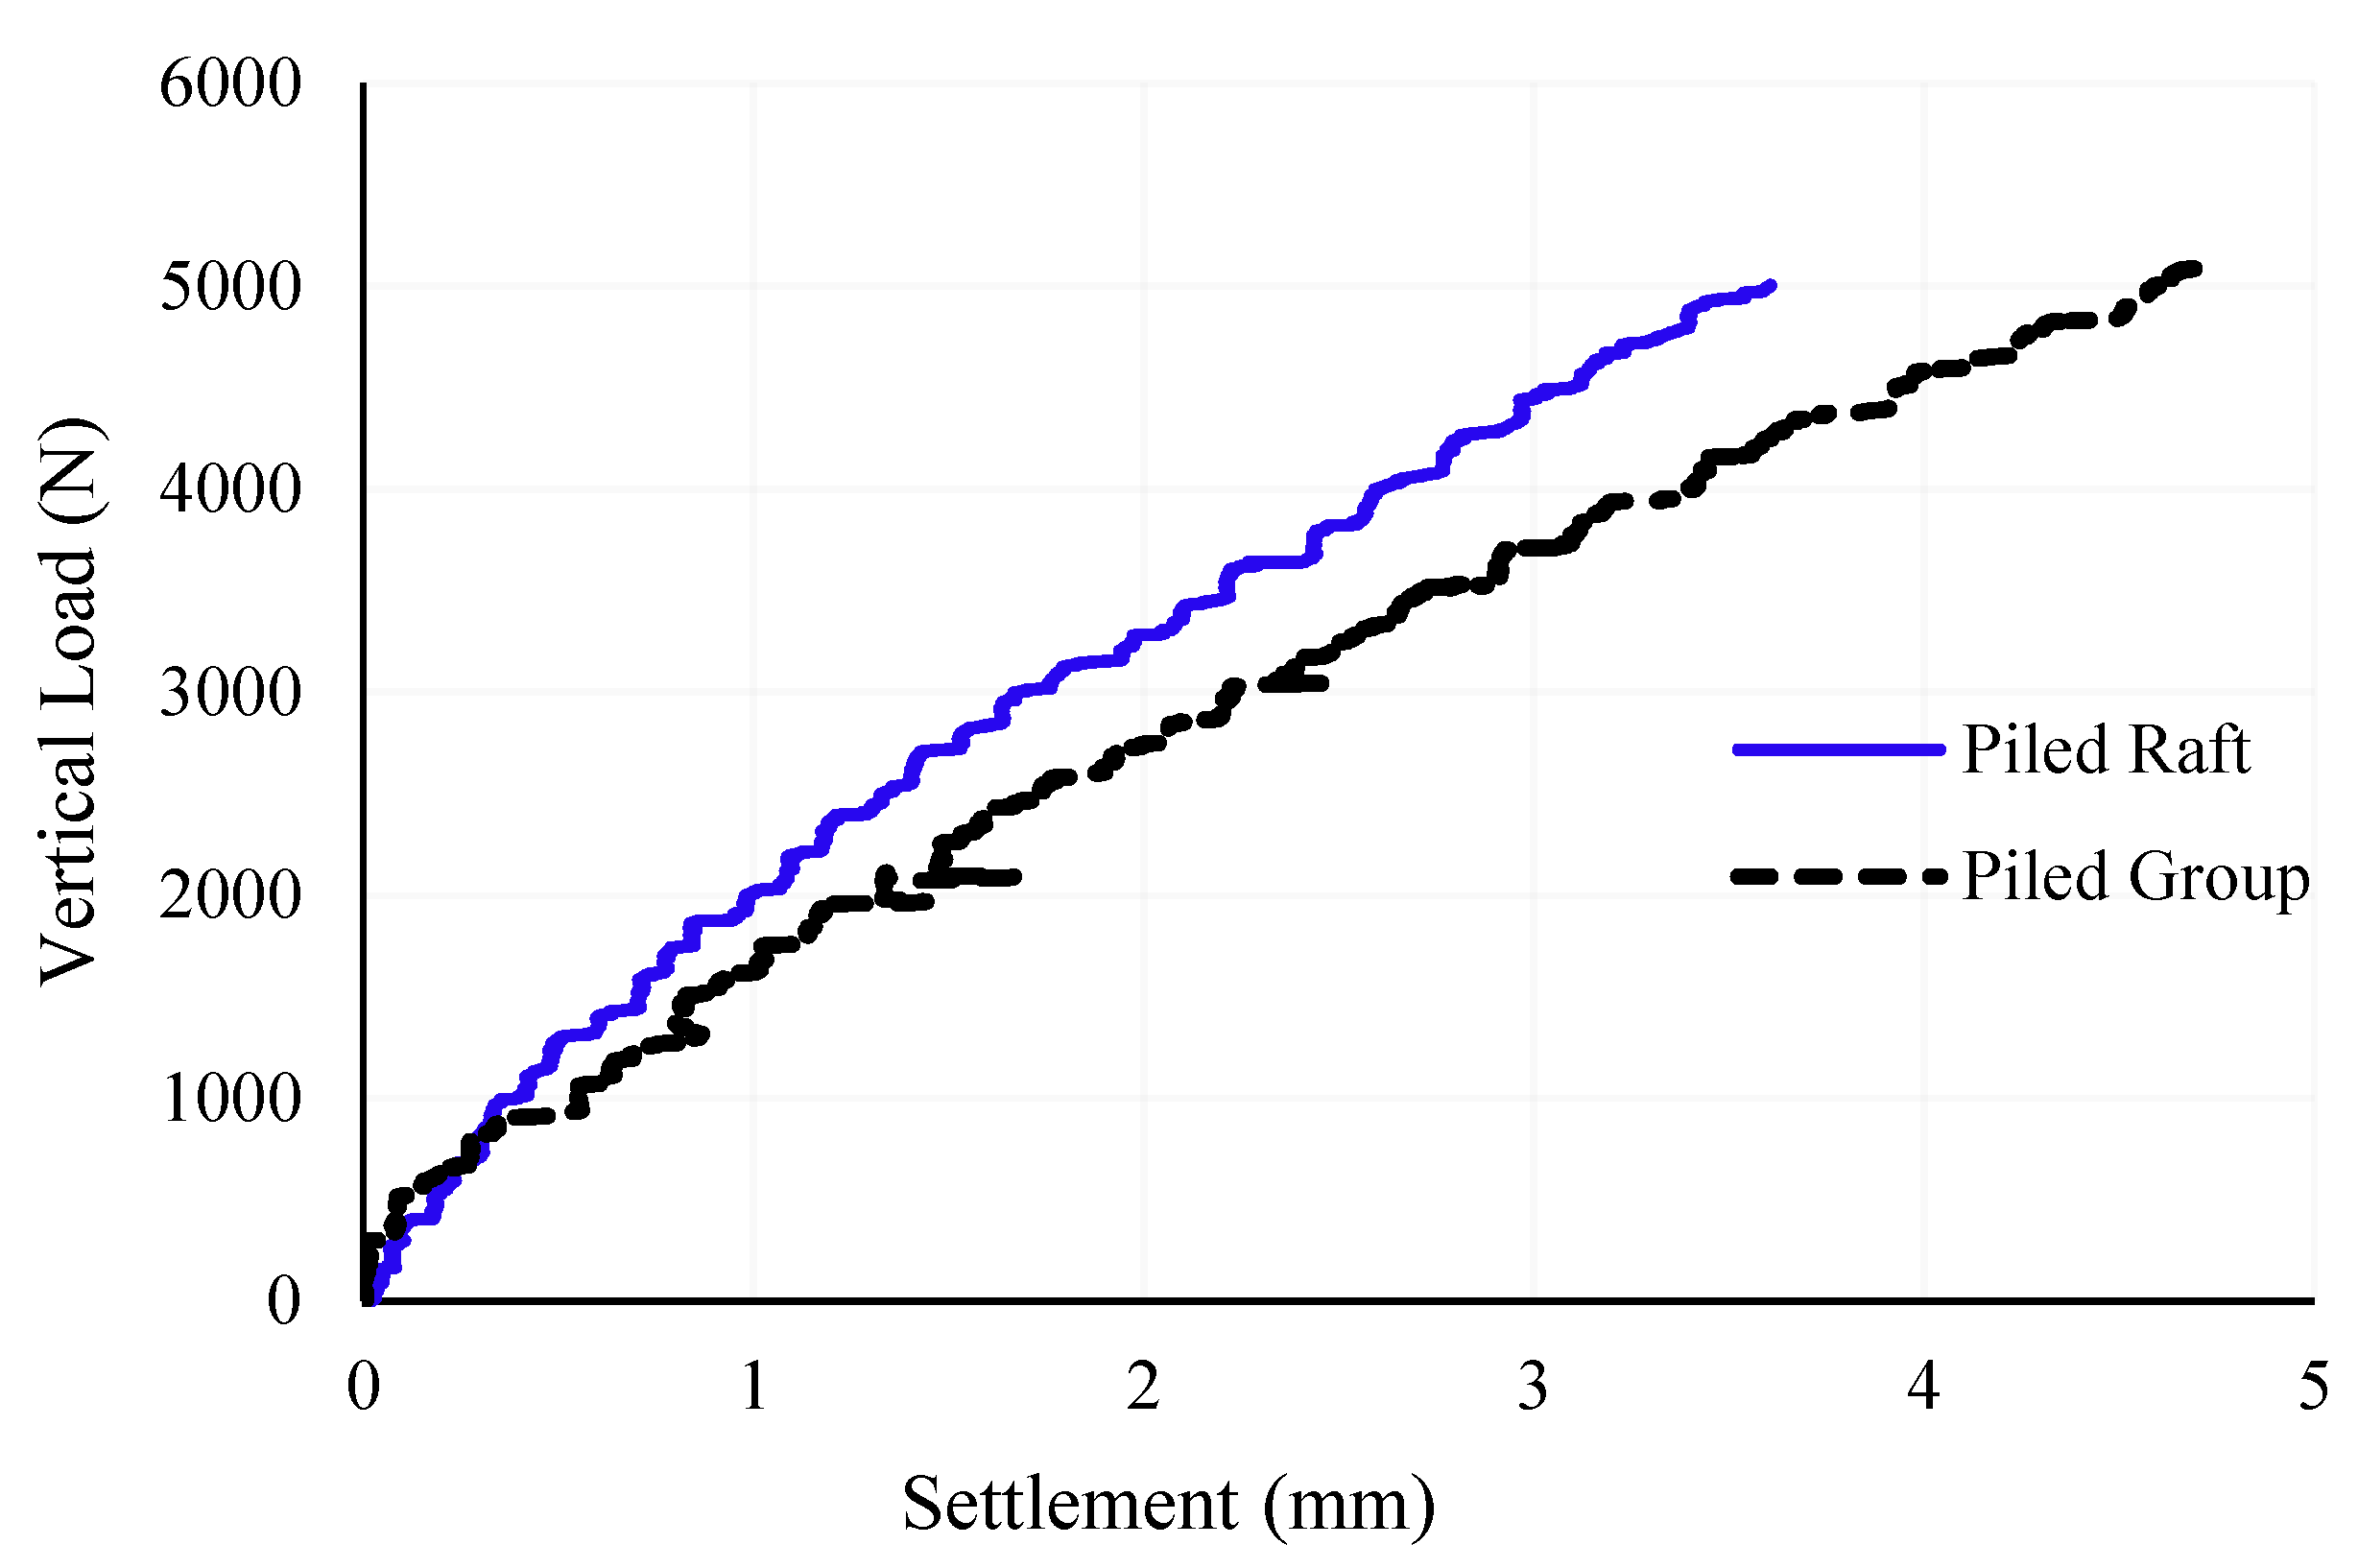
3.1. Pile Group vs. Piled Raft under Vertical Loading
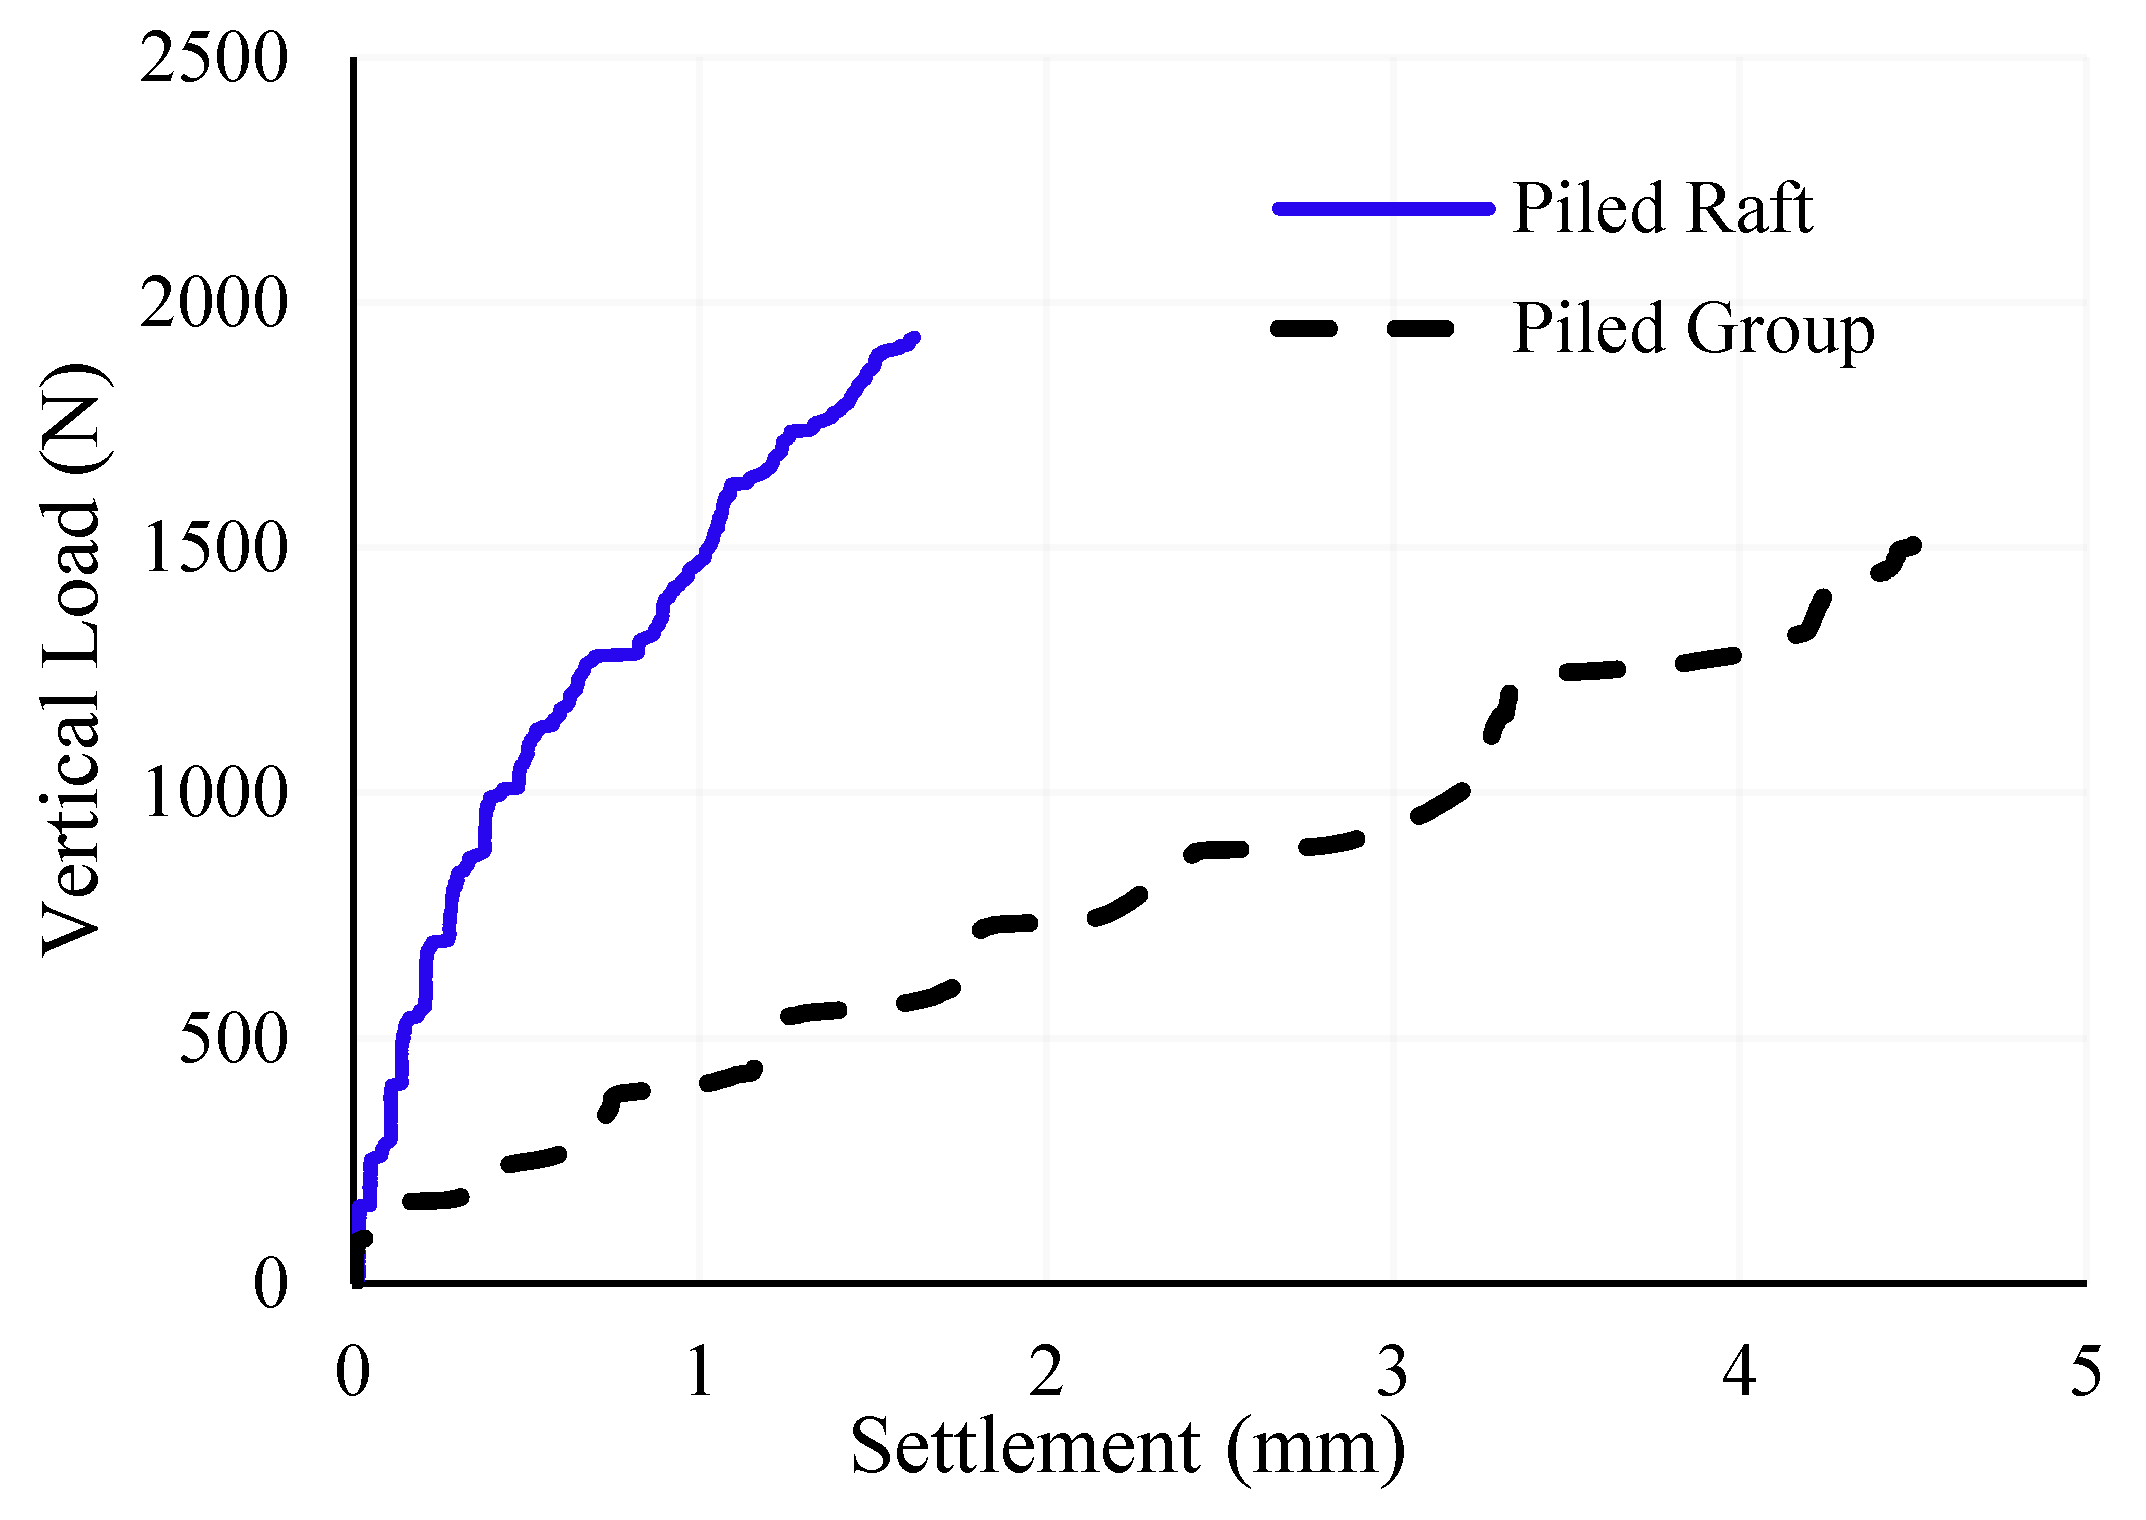
3.1.1. 4-Pile Group vs. 4-Piled Raft
3.1.2. 6-Pile Group vs. 6-Piled Raft
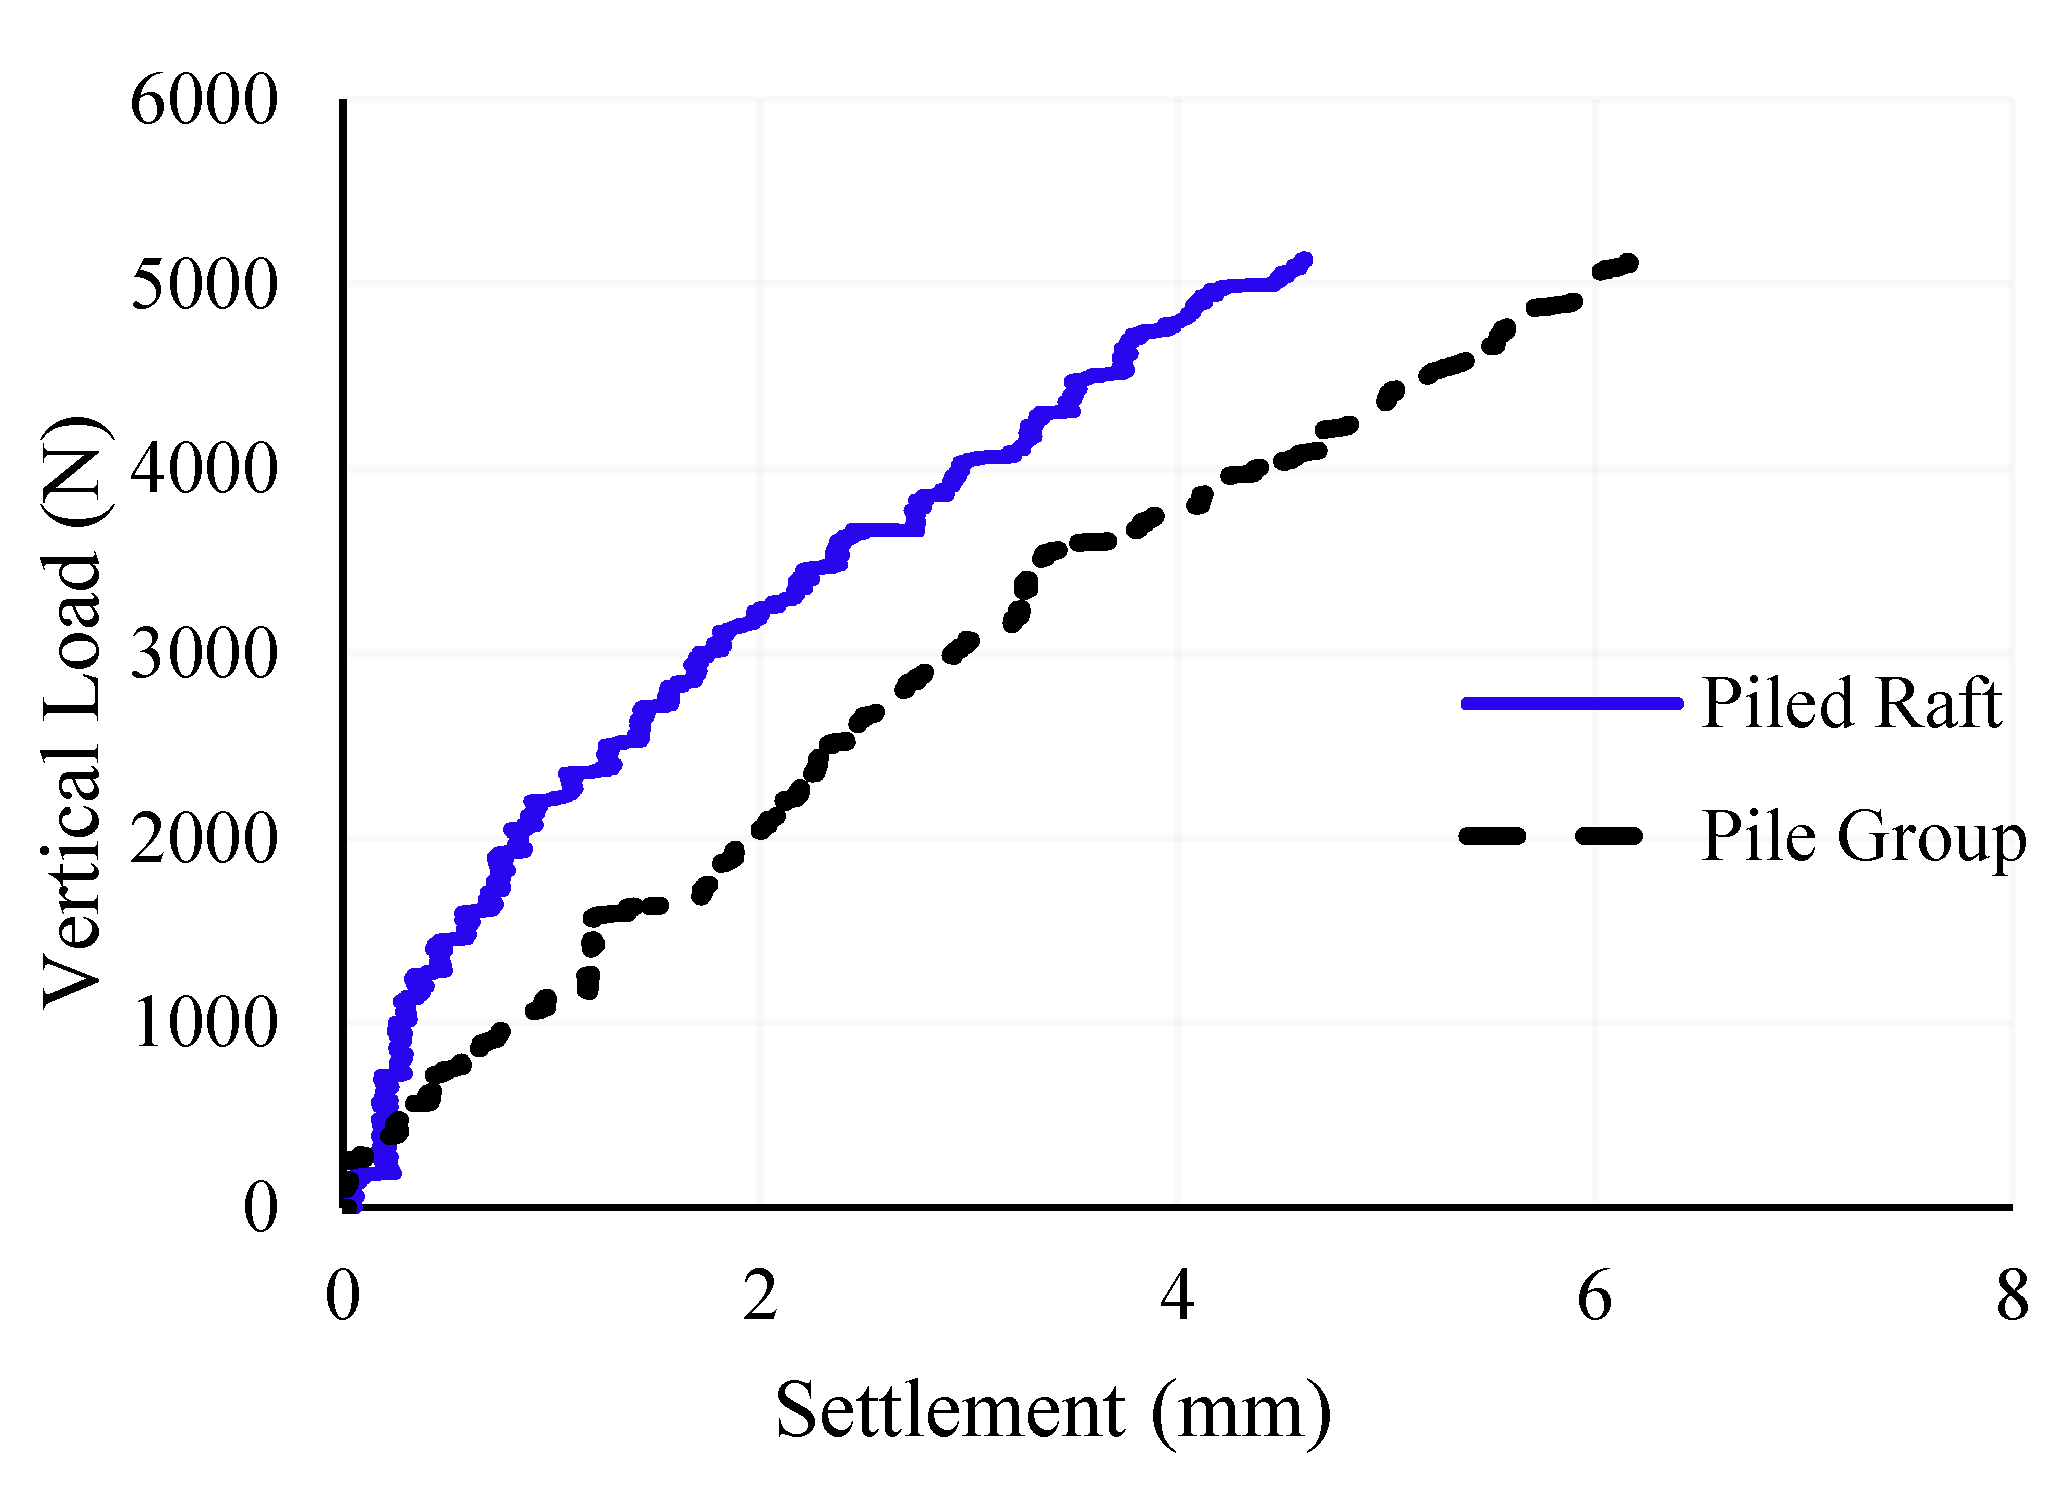
3.1.3. 9-Pile Group vs. 9-Piled Raft
3.1.4. 13-Pile Group vs. 13-Piled Raft
3.1.5. 17-Pile Group vs. 17-Piled Raft
3.1.6. 21-Pile Group vs. 21-Piled Raft
3.1.7. 25-Pile Group vs. 25-Piled Raft
3.2. Summary of Pile Group Vertical Response
3.3. Pile Raft vs. Pile Group under Lateral Load
3.3.1. 4-Pile Raft vs. 4-Pile Group
3.3.2. 6-Pile Raft vs. 6-Pile Group
3.3.3. 9-Pile Raft vs. 9-Pile Group
3.3.4. 13-Pile Raft vs. 13-Pile Group
3.3.5. 17-Pile Raft vs. 17-Pile Group
3.3.6. 21-Pile Raft vs. 21-Pile Group
3.4. Stiffness Difference in Pile Group vs. Pile Raft
3.5. Effect of Number of Piles on the Contribution of Raft to Lateral Loads in Piled Raft System
4. Conclusions
- Comparing the pile group and pile raft responses under the same vertical and lateral load with the same pile configuration, it is evident that the piled raft stiffness is more in all cases because of the raft contribution in addition to the piles.
- By comparing the responses of the piled raft and the pile group with the same number of piles under the same vertical and lateral load, it was concluded that the piled raft response to the lateral and vertical load was much stiffer than the pile group response. The lateral deflection and vertical settlement of the piled raft were less than those of the pile group with the same pile configuration. This effective response of the piled raft to the vertical and lateral loads was due to the raft contribution in resisting the vertical and lateral loads. It was found that, unlike the pile group, the piled raft provides considerably high stiffness to both types of loads, and the difference between the stiffness of both systems decreases as the number of piles increases. Moreover, with the increase in the number of piles, the vertical and lateral contribution of the raft decreases. It was observed from the results of the piled raft tests under the vertical and lateral load that an increase in the number of piles causes a decrease in the vertical and lateral contribution of the raft. The increased vertical contribution causes an increase in the stiffness of the soil beneath the raft, which leads to an increase in the lateral contribution of the raft.
Author Contributions
Funding
Institutional Review Board Statement
Informed Consent Statement
Data Availability Statement
Conflicts of Interest
References
- Poulos, H.G. Analysis of the settlement of pile groups. Geotechnique 1968, 18, 449–471. [Google Scholar] [CrossRef]
- Butterfield, R.; Banerjee, P.K. The problem of pile group–pile cap interaction. Geotechnique 1971, 21, 135–142. [Google Scholar] [CrossRef]
- Davis, E.H.; Poulos, H.G. The analysis of piled raft systems. Aust. Geotech. J. 1972, 2, 21–27. [Google Scholar]
- Zeevaert, L. Compensated Friction-Pile Foundation to Reduce the Settlement of Buildings on the Highly Compressible Volcanic Clay of Mexico City. In Proceedings of the 4th International Conference on Soil Mechanics and Foundation Engineering, London, UK, 12–24 August 1957. [Google Scholar]
- Zeevaert, L. Foundation Engineering for Difficult Subsoil Conditions; Van Nostrand Reinhold Company: New York, NY, USA, 1973. [Google Scholar]
- McVay, M.; Casper, R.; Shang, T.I. Lateral response of three-row groups in loose to dense sands at 3D and 5D pile spacing. J. Geotech. Eng. 1995, 121, 436–441. [Google Scholar] [CrossRef]
- Cox, W.R.; Dixon, D.A.; Murphy, B.S. Lateral-load tests on 25.4-mm (1-in.) diameter piles in very soft clay in side-by-side and in-line groups. In Laterally Loaded Deep Foundations: Analysis and Performance; ASTM International: West Conshohocken, PA, USA, 1984. [Google Scholar] [CrossRef]
- Khari, M.; Kassim, K.A.B.; Adnan, A.B.; Moayedi, H. Kinematic bending moment of piles under seismic motions. Asian J. Earth Sci. 2014, 7, 1. [Google Scholar] [CrossRef]
- Rollins, K.M.; Peterson, K.T.; Weaver, T.J. Lateral load behavior of full-scale pile group in clay. J. Geotech. Geoenviron. Eng. 1998, 124, 468–478. [Google Scholar] [CrossRef]
- Feagin, L.B. Lateral pile-loading tests. Trans. Am. Soc. Civ. Eng. 1937, 102, 236–254. [Google Scholar] [CrossRef]
- Holloway, D.M.; Moriwaki, Y.; Finno, R.J.; Green, R.K. Lateral load response of a pile group in sand. In Proceedings of the 2nd International Conference on Numerical Methods in Offshore Piling, London, UK, 29–30 April 1982. [Google Scholar]
- Zhang, L.; McVay, M.C.; Lai, P. Numerical analysis of laterally loaded 3× 3 to 7× 3 pile groups in sands. J. Geotech. Geoenviron. Eng. 1999, 125, 936–946. [Google Scholar] [CrossRef]
- Patil, J.D.; Vasanvala, S.A.; Solanki, C.H. An experimental study on behaviour of piled raft foundation. Indian Geotech. J. 2016, 46, 16–24. [Google Scholar] [CrossRef]
- Salahshour, Y.; Ardakani, A. Evaluation of Piled Raft Behavior based on the Taguchi Method subjected to Combination of Vertical and Horizontal Loads. J. Eng. Geol. 2017, 11, 181. [Google Scholar] [CrossRef]
- Bhartiya, P.; Chakraborty, T.; Basu, D. Load-settlement response of piled raft foundations in sand. Geomech. Geoengin. 2021, 17, 1260–1283. [Google Scholar] [CrossRef]
- Viggiani, C.; Mandolini, A.; Russo, G. Piles and Pile Foundations; CRC Press: London, UK, 2014. [Google Scholar]
- Beatty, C.I. Lateral test on pile groups. Found. Facts 1970, 6, 18–21. [Google Scholar]
- Zafir, Z.; Vanderpool, W.E. Lateral response of large diameter drilled shafts: 1-15/ US 95 load test program. In Proceedings of the Thirty-Third Engineering Geology and Geotechnical Engineering Symposium, Reno, Nevada, 25–27 March 1998; pp. 161–176. [Google Scholar]
- Horikoshi, K.; Matsumoto, T.; Hashizume, Y.; Watanabe, T.; Fukuyama, H. Performance of piled raft foundations subjected to static horizontal loads. Int. J. Phys. Model. Geotech. 2003, 3, 37–50. [Google Scholar] [CrossRef]
- Ilyas, T.; Leung, C.F.; Chow, Y.K.; Budi, S.S. Centrifuge model study of laterally loaded pile groups in clay. J. Geotech. Geoenviron. Eng. 2004, 130, 274–283. [Google Scholar] [CrossRef]
- Katzenbach, R.; Turek, J. Combined pile-raft foundation subjected to lateral loads. In Proceedings of the 16th International Conference on Soil Mechanics and Geotechnical Engineering; IOS Press: Amsterdam, The Netherlands, 2005. [Google Scholar]
- Unsever, Y.S.; Matsumoto, T.; Özkan, M.Y. Numerical analyses of load tests on model foundations in dry sand. Comput. Geotech. 2015, 63, 255–266. [Google Scholar] [CrossRef]
- Stacul, S. Analysis of Piles and Piled Raft Foundation under Horizontal Load. Ph.D. Thesis, University of Pisa, Pisa, Italy, 2018. [Google Scholar] [CrossRef]
- Deb, P.; Pal, S.K. Numerical analysis of piled raft foundation under combined vertical and lateral loading. Ocean. Eng. 2019, 190, 106431. [Google Scholar] [CrossRef]
- Al Masoodi, R.S.; Al Gharrawi, A.M.; Hussein, H.H. The behaviour of piled raft foundation in loose sandy soil. In Proceedings of the 3rd International Scientific Conference of Engineering Sciences and Advances Technologies (IICESAT), Hillah, Iraq, 5–6 June 2021. [Google Scholar]
- Zhang, Y.; El Naggar, M.H.; Wu, W.; Wang, Z.; Yang, X.; Jiang, G. Dynamic torsional impedance of large-diameter pipe pile for offshore engineering: 3D analytical solution. Appl. Math. Model. 2022, 111, 664–680. [Google Scholar] [CrossRef]
- Li, L.; Liu, X.; Liu, H.; Wu, W.; Lehane, B.M.; Jiang, G.; Xu, M. Experimental and numerical study on the static lateral performance of monopile and hybrid pile foundation. Ocean. Eng. 2022, 255, 111461. [Google Scholar] [CrossRef]
- Khurshed, R.D.; Abbas, J.M. An Experimental Investigation the Response of Pile Groups to Inclined Cyclic Loading in Sandy Soil. In Geotechnical Engineering and Sustainable Construction; Springer: Singapore, 2022; pp. 435–446. [Google Scholar] [CrossRef]
- Baca, M.; Brząkała, W.; Rybak, J. Bi-directional static load tests of pile models. Appl. Sci. 2020, 10, 5492. [Google Scholar] [CrossRef]
- ASTM D422-63; Standard Test Method for Particle-Size Analysis of Soils. ASTM International: West Conshohocken, PA, USA, 2007.
- ASTM D854-2005; Standard Test Methods for Specific Gravity of Soil Solids by Water Pycnometer. ASTM International: West Conshohocken, PA, USA, 2005.
- ASTM D4253-00; Standard Test Methods for Maximum Index Density and Unit Weight of Soils Using a Vibratory Table. ASTM International: West Conshohocken, PA, USA, 2005.
- ASTM D4254-00; Standard Test Methods for Minimum Index Density and Unit Weight of Soils and Calculation of Relative Density. ASTM International: West Conshohocken, PA, USA, 2006.
- ASTM D3080-04; Standard Test Method for Direct Shear Test of Soils Under Consolidated Drained Conditions. ASTM International: West Conshohocken, PA, USA, 2004.
- ASTM E8/E8M; Standard Test Methods for Tension Testing of Metallic Materials. ASTM International: West Conshohocken, PA, USA, 2021.
- Khari, M.; Kassim, K.A.; Adnan, A. Sand samples’ preparation using mobile pluviator. Arab. J. Sci. Eng. 2014, 39, 6825–6834. [Google Scholar] [CrossRef]


| Type | Stiffness Difference | Piled Raft Settlement (mm) | Pile Group Settlement (mm) | Maximum Vertical Load (N) |
|---|---|---|---|---|
| 4-Piled raft vs. 4-Pile group | 4.50/1.60 = 2.81 | 1.60 | 4.50 | 1920 |
| 6-Piled raft vs. 6-Pile group | 1.34 | 3.01 | 4.02 | 2786 |
| 9-Piled raft vs. 9-Pile group | 2.52 | 5.14 | 12.97 | 5250 |
| 13-Piled raft vs. 13-Pile group | 1.65 | 5.62 | 9.28 | 5250 |
| 17-Piled raft vs. 17-Pile group | 1.40 | 4.60 | 6.45 | 5250 |
| 21-Piled raft vs. 21-Pile group | 1.57 | 4.00 | 6.28 | 5250 |
| 25-Piled raft vs. 25-Pile group | 1.27 | 3.61 | 4.60 | 5250 |
| Type | Stiffness Difference | Piled Raft Displacement (mm) | Pile Group Displacement (mm) | Maximum Lateral Load (N) |
|---|---|---|---|---|
| 4-Piled raft vs. 4-Pile group | 39.16 | 0.12 | 4.70 | 462 |
| 6-Piled raft vs. 6-Pile group | 5.13 | 0.39 | 2.00 | 600 |
| 9-Piled raft vs. 9-Pile group | 5.80 | 0.25 | 1.45 | 600 |
| 13-Piled raft vs. 13-Pile group | 6.20 | 0.42 | 2.60 | 693 |
| 17-Piled raft vs. 17-Pile group | 2.29 | 2.67 | 6.11 | 1520 |
| 21-Piled raft vs. 21-Pile group | 2.51 | 2.43 | 6.09 | 1448 |
Publisher’s Note: MDPI stays neutral with regard to jurisdictional claims in published maps and institutional affiliations. |
© 2022 by the authors. Licensee MDPI, Basel, Switzerland. This article is an open access article distributed under the terms and conditions of the Creative Commons Attribution (CC BY) license (https://creativecommons.org/licenses/by/4.0/).
Share and Cite
Jamil, I.; Ahmad, I.; Ullah, W.; Ahmad, M.; Sabri, M.M.S.; Majdi, A. Experimental Study on Lateral and Vertical Capacity of Piled Raft and Pile Group System in Sandy Soil. Appl. Sci. 2022, 12, 8853. https://doi.org/10.3390/app12178853
Jamil I, Ahmad I, Ullah W, Ahmad M, Sabri MMS, Majdi A. Experimental Study on Lateral and Vertical Capacity of Piled Raft and Pile Group System in Sandy Soil. Applied Sciences. 2022; 12(17):8853. https://doi.org/10.3390/app12178853
Chicago/Turabian StyleJamil, Irfan, Irshad Ahmad, Wali Ullah, Mahmood Ahmad, Mohanad Muayad Sabri Sabri, and Ali Majdi. 2022. "Experimental Study on Lateral and Vertical Capacity of Piled Raft and Pile Group System in Sandy Soil" Applied Sciences 12, no. 17: 8853. https://doi.org/10.3390/app12178853