Article

Comparison Study on Coarseness Index and Maximum Diameter of Rock Fragments by Linear Cutting Tests

1
Department of Civil and Environmental Engineering, Hanyang University, 55 Hanyangdaehak-ro, Sangnok-gu, Ansan 15588, Korea
2
Department of Mining Engineering, Balochistan University of Information Technology Engineering and Management Sciences (BUITEMS), Quetta 87300, Pakistan
3
School of Materials and Mineral Resources Engineering, Universiti Sains Malaysia, Engineering Campus, Nibong Tebal 14300, Penang, Malaysia
4
Department of Infra Division Sinansan Line Section 2, Posco E&C, 38 Namwang-Gil, Siheung 14985, Korea
*
Authors to whom correspondence should be addressed.
Appl. Sci. 2022, 12(17), 8793; https://doi.org/10.3390/app12178793
Submission received: 27 June 2022 / Revised: 29 August 2022 / Accepted: 29 August 2022 / Published: 1 September 2022

Abstract

:
Rock fragments obtained by excavation can provide information for evaluating the excavation efficiency, for which the coarseness index (CI) and particle size parameters (d50, dMPS, and d′) are used. However, CI depends on the number and size of the sieves used, and the particle size parameters require mathematical calculations. In this study, the maximum diameter (dmax) of rock fragments was used as an indicator of the excavation efficiency. Linear cutting tests were performed and the rock fragments were sieved to obtain the CI and dmax. The relationship between dmax and CI was similar to that between other particle parameters and CI. dmax and CI increased with increasing penetration depth and spacing, but dmax followed a linear relationship, and CI demonstrated a power relationship. Both dmax and CI reached their maximum values at a specific ratio of spacing to penetration depth (s/p ratio) and were not affected by subsequent increases in s/p. The cutting force and volume had positive relationships with dmax and CI, linear with dmax and exponential with CI, whereas the specific energy (SE) had an inverse relationship, showing exponential and linear relationships with dmax and CI, respectively. When dmax was larger than a certain value, SE converged to a constant value. This study confirmed that dmax has an advantage over CI in determining excavation efficiency.

1. Introduction

Mechanical excavation equipment, such as tunnel-boring machines (TBMs) and roadheaders, are widely used for underground construction in the civil and mining engineering fields, and the demand is continuously increasing. In mechanical excavation, excavation efficiency is an important factor, and specific energy (SE) is a representative indicator for this purpose.
The SE refers to the energy consumed to excavate a unit volume, and it has an inverse relationship with excavation efficiency. The SE is affected by cutting conditions, such as the penetration depth (p) and spacing (s). Moreover, the SE decreases as the cutting depth increases, reaching a constant value at a specific depth (Figure 1a) [1,2,3]. At the same penetration depth, if the spacing is too narrow, the SE increases because of overcrushing. However, if the spacing is too wide, the SE increases because no interaction occurs between the cutting grooves (Figure 1b) [4,5]. Generally, the effect of spacing is greater than that of penetration depth [6].
The rock fragments generated by excavation are also affected by the cutting conditions. Hughes [8] reported that the rock fragment size increases with spacing and excavation efficiency. Rånman [9] found that size of the rock fragments follows a Poisson distribution, and rock chips are limited by penetration depth and spacing. Gong, et al. [10] reported that the excavation efficiency increases as the size of the rock fragment increases and that the rock chips become long and flat as the thrust increases. Yang, et al. [11] found that the size of a rock chip depends on the space between the two adjacent cutting grooves. Geng, et al. [12] reported that size of the rock fragments follows a normal distribution and increases with the penetration depth.
Therefore, a considerable number of studies have been conducted to obtain the excavation efficiency from rock fragments, primarily using the particle size distribution of rock fragments. Barker [1] conducted a rock-cutting test using a drag-type cutting tool and analyzed rock fragments using the coarseness index (CI), a nondimensional value representing the size distribution of rock fragments. The results showed that the CI increased slowly with narrow spacings and rapidly with wide spacings as the penetration depth increased. Roxborough, et al. [13] analyzed rock fragments generated by conical and chisel picks with respect to spacing. The CI value increased as the spacing increased. Tuncdemir, et al. [14] performed a linear cutting test using a disc cutter and a chisel pick. Regardless of the rock type, CI and SE had an inverse relationship, and CI reached the maximum value at the specific ratio of spacing to penetration depth (s/p ratio) where the SE was the minimum.
Recently, studies have been conducted to obtain excavation efficiency based on particle size parameters obtained by mathematical calculations. Abu Bakar and Gertsch [15] found that the size distribution of rock fragments conformed to the Rosin–Ramler distribution, and the absolute particle size (d′) of Rosin–Ramler was related to the size of the rock chip. Abu Bakar, et al. [16] analyzed the rock fragments of dry and saturated sandstone cut using a disc cutter. Their results indicated that CI and d′ had an inverse relationship with SE, and the CI and d′ of dry rock were always higher than those of saturated rock. Jeong and Jeon [17] performed a linear cutting test using a pick cutter. The d′ value had a linear relationship with the median particle size (d50) and the midpoint of the distribution size, CI had a linear inverse relationship with SE, and the cutting force increased as the size of the rock chip increased. Mohammadi, et al. [18] found that d′, d50, and mean particle size (dMPS), which is the arithmetic average of all particle sizes in a sample, had similar relationships with SE. They formed an inverse relationship with SE, similar to the CI. Wang, et al. [19] analyzed the rock fragments generated by relieved and unreleased cutting using the CI and Rosin–Ramler distribution.
Based on these studies, a high correlation between the rock fragments and efficiency is confirmed. However, among the characteristics of rock fragments, their relationship with CI is concentrated. The CI differs depending on the size and number of sieves used, even for the same specimen, and requires additional calculations. Subsequently, studies on the relationship between the particle size parameters (d′, d50, and dMPS) have been conducted, but mathematical calculations must be performed, which is disadvantageous.
Therefore, this study attempted to determine whether the maximum diameter (dmax), which is the most intuitive characteristic of rock fragments, could replace the role of CI and particle size parameters. For this purpose, dmax and CI were obtained from rock fragments generated via linear cutting tests under various cutting conditions. By comparing the relationship between dmax and CI and that between particle parameters and CI, the similarity between dmax and particle parameters was confirmed. In addition, the results suggest that dmax and CI are similarly affected by cutting conditions and results. In particular, dmax has an advantage over CI in terms of the SE.

2. Experimental Setup and Procedures

2.1. Linear Cutting Test

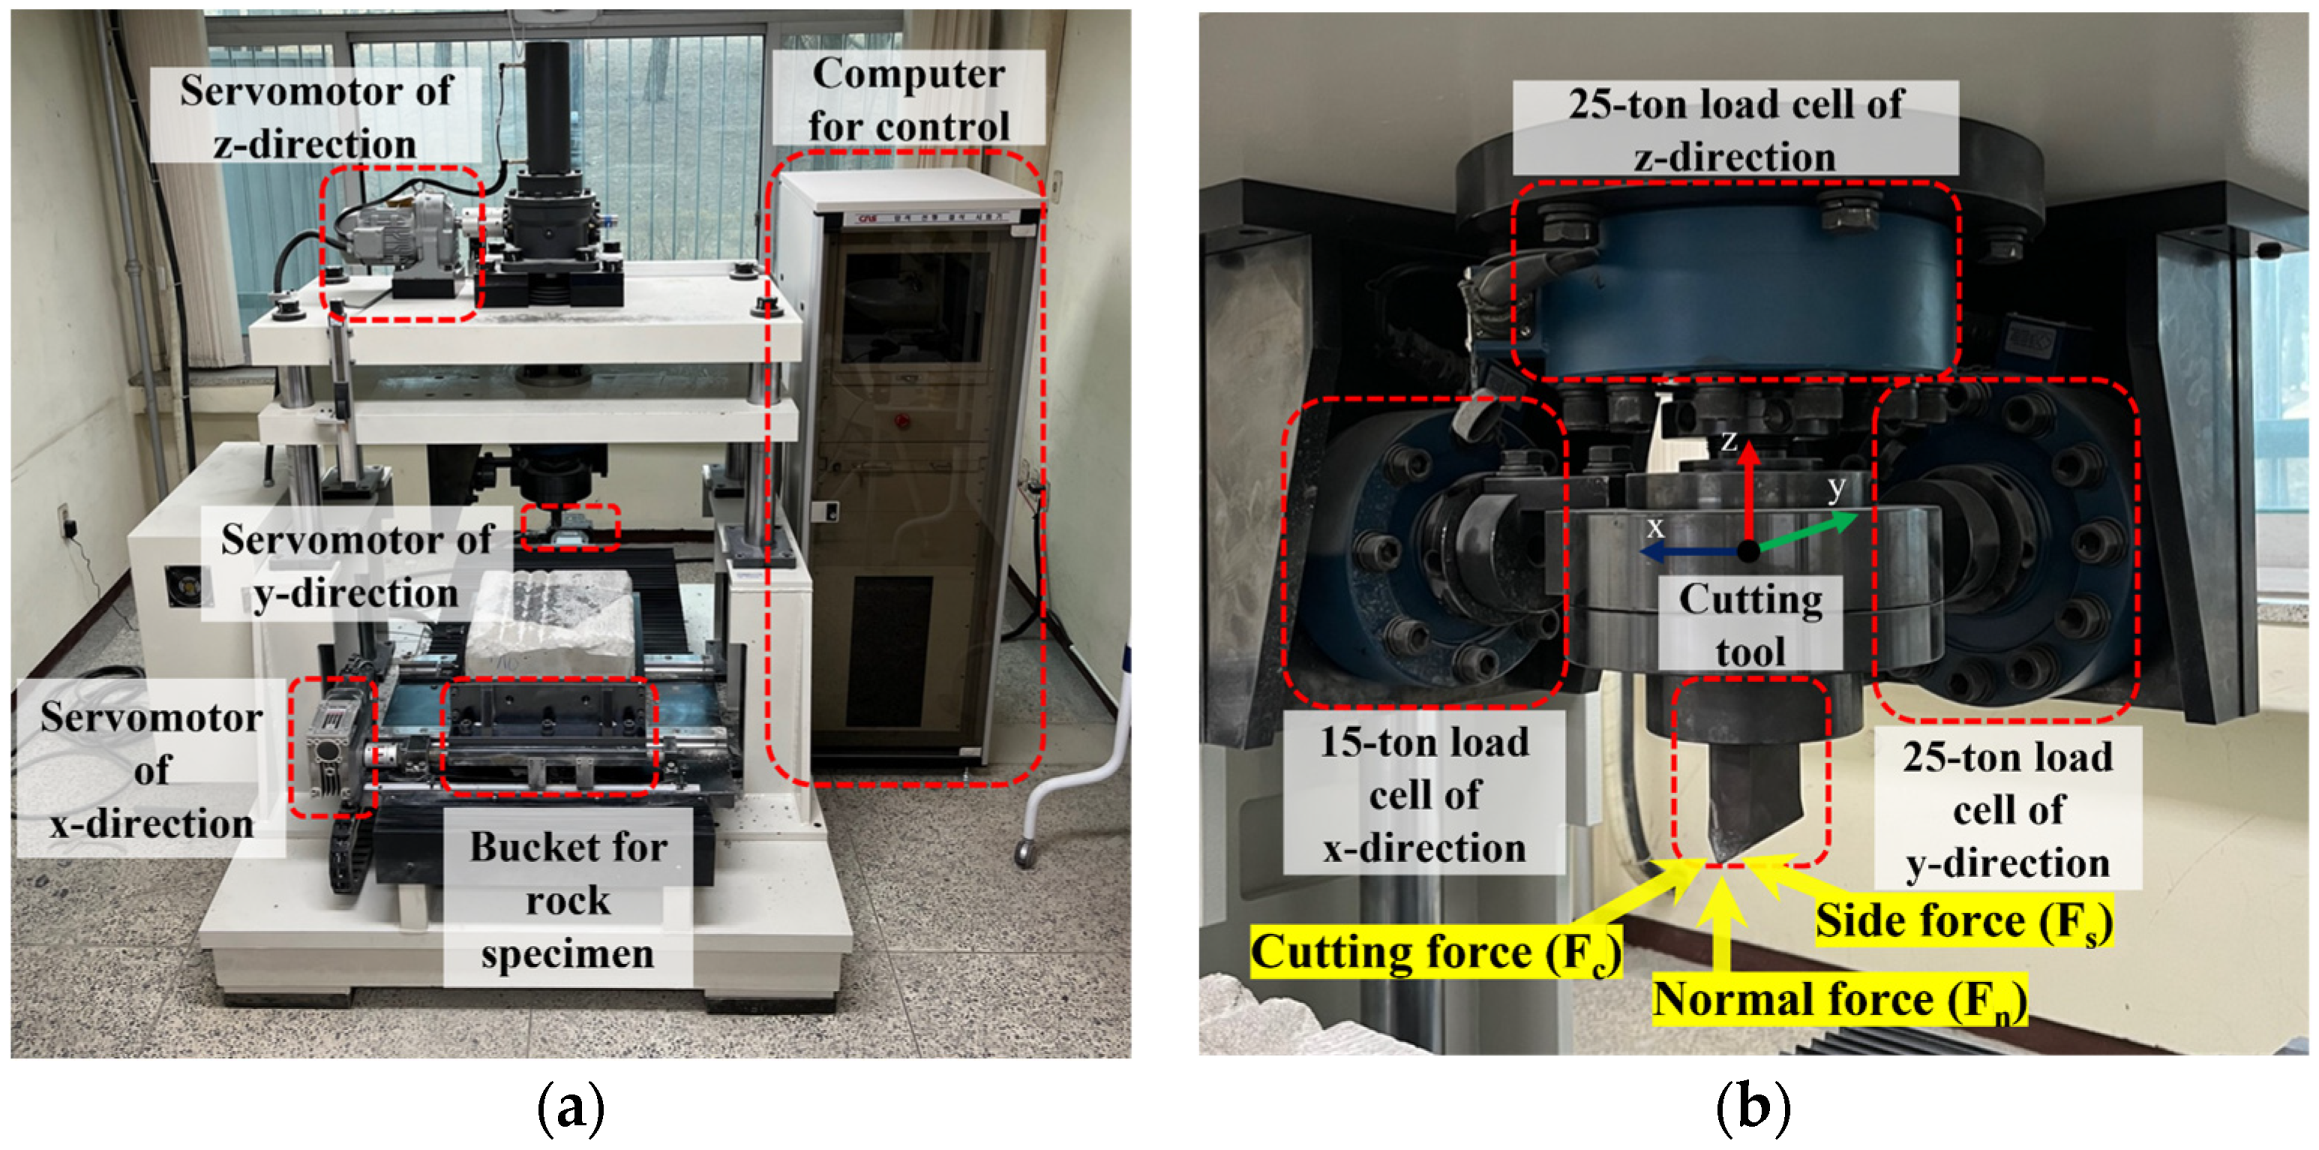
2.1.1. Linear Cutting Machine

Linear cutting tests were conducted using a linear cutting machine (LCM), shown in Figure 2, which was divided into a cutting system and a control system.
The control system is driven by servomotors in the x-, y-, and z-directions. The servomotors control the moving distance more precisely than hydraulic cylinders. The x- and y-direction servomotors adjust the cutting spacing and cutting length by moving the rock in the bucket, respectively, and have a speed limit of 100 mm/s. The z-direction servomotor moves the cutting tool to adjust the penetration depth.
The reaction forces generated during cutting were measured by the installed load cells in three axes up to 50 Hz (Figure 2b). The installed 25-ton load cell measured the cutting (Fc) and normal (Fn) forces in the y- and z-directions, respectively. Moreover, a load cell with a 15-ton capacity was installed in the z-direction to measure the side force (Fs).
The control system consisted of a computer and accessories, and was used to set the cutting conditions (spacing and penetration depth), cutting speed, and measurement period. In addition, data measured could be verified in real time using the display.

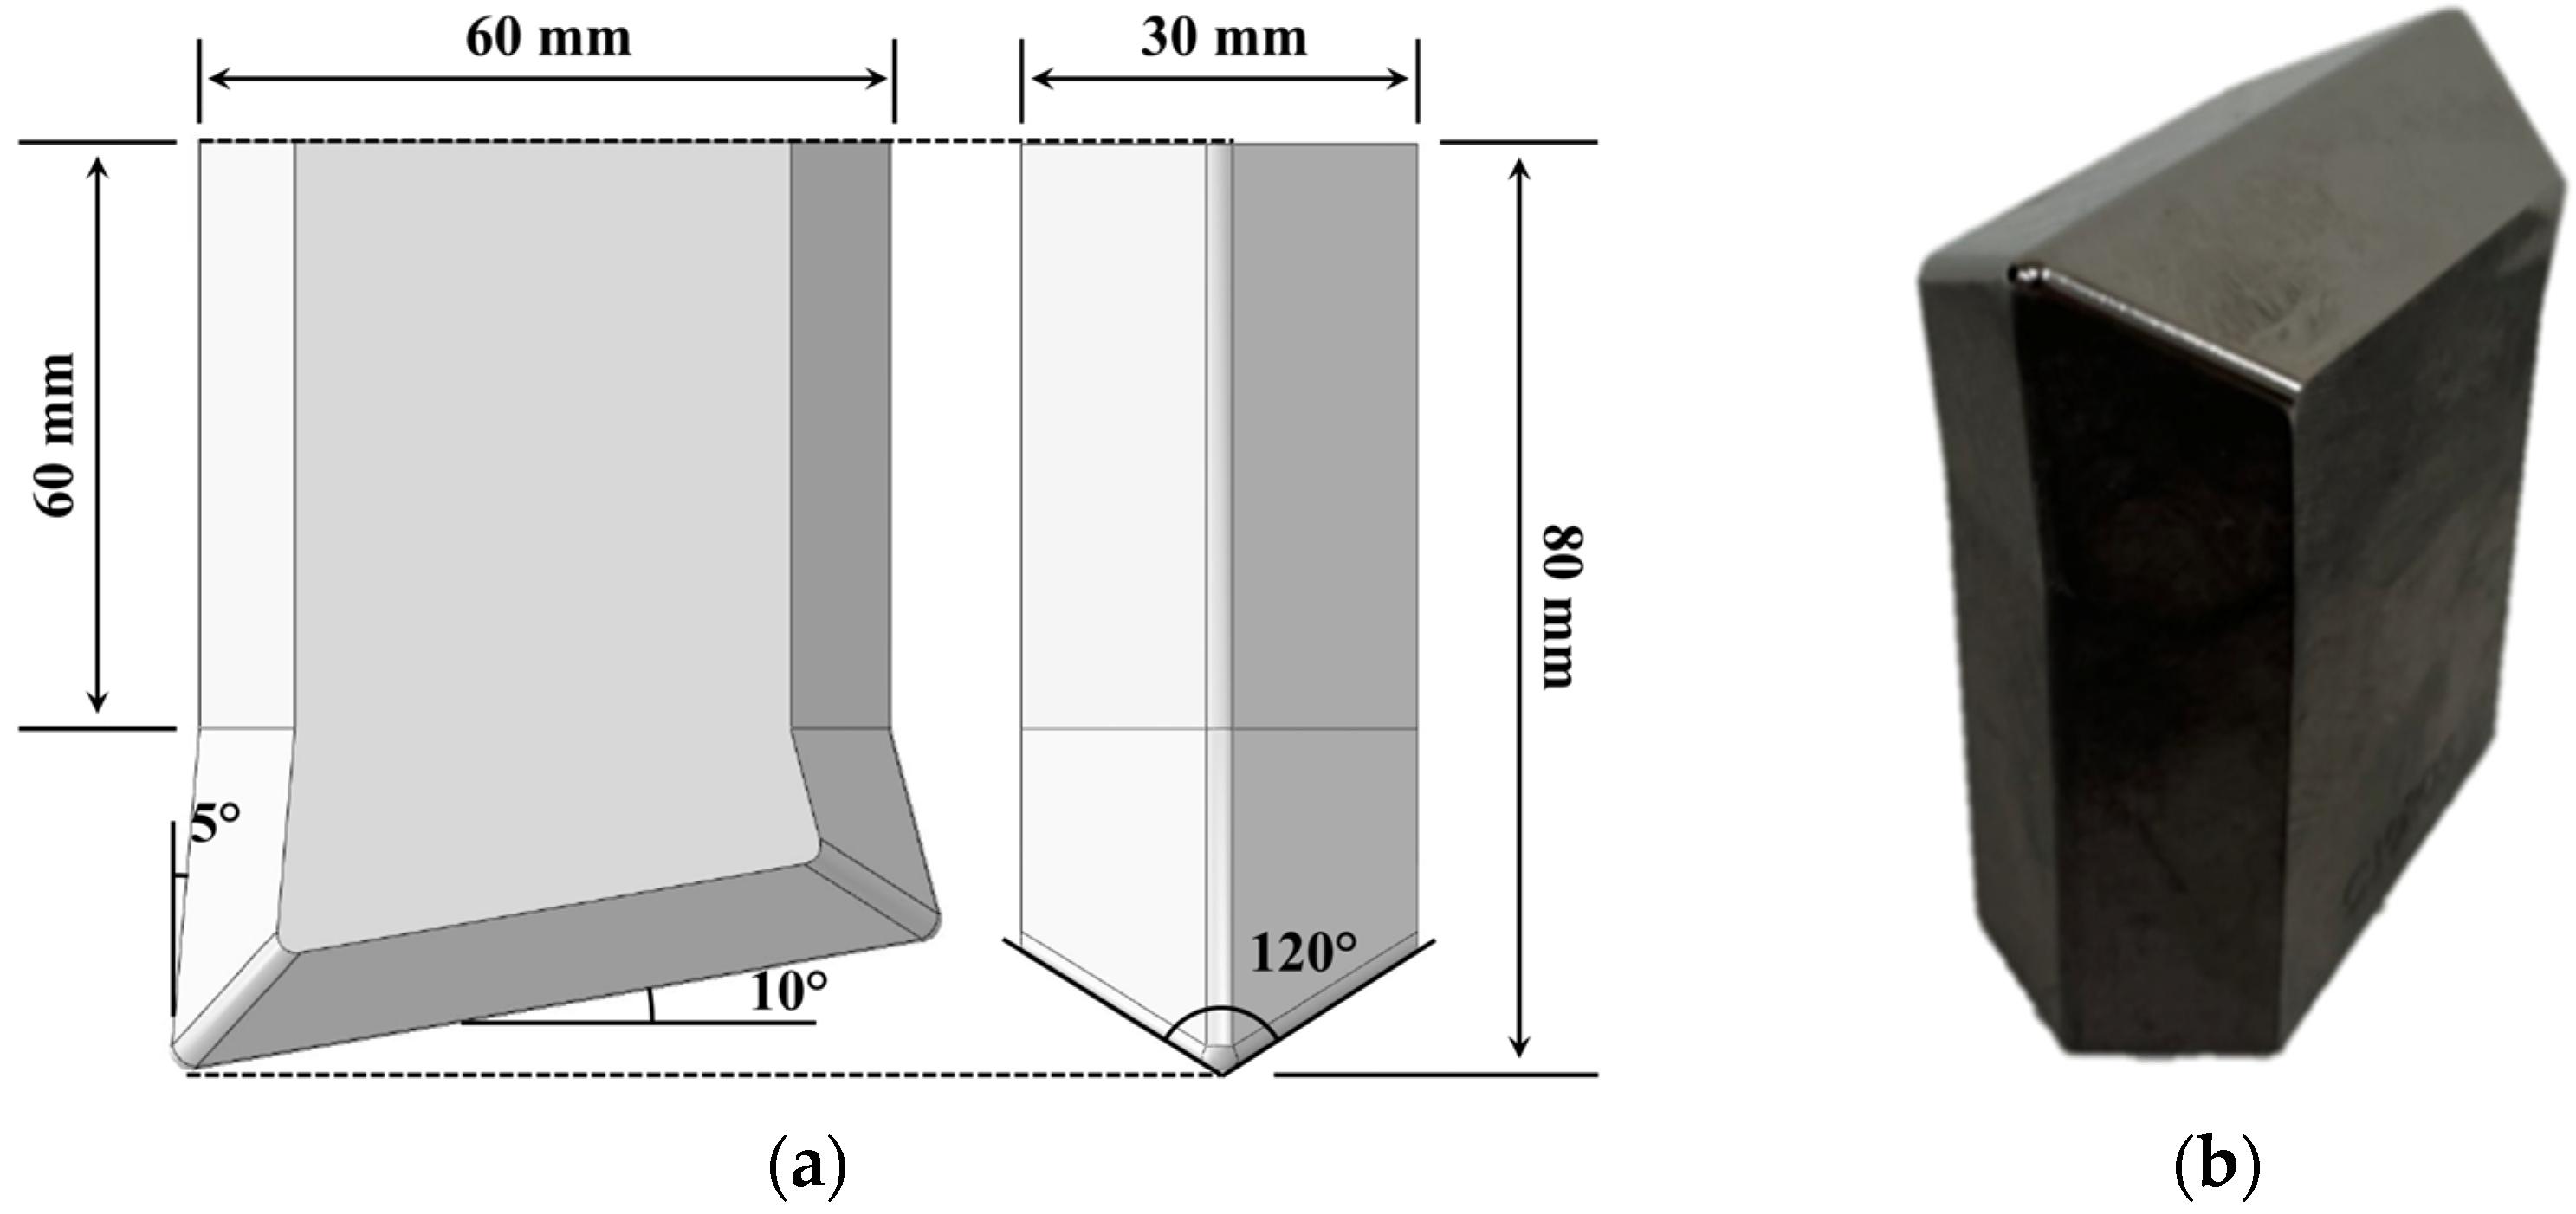
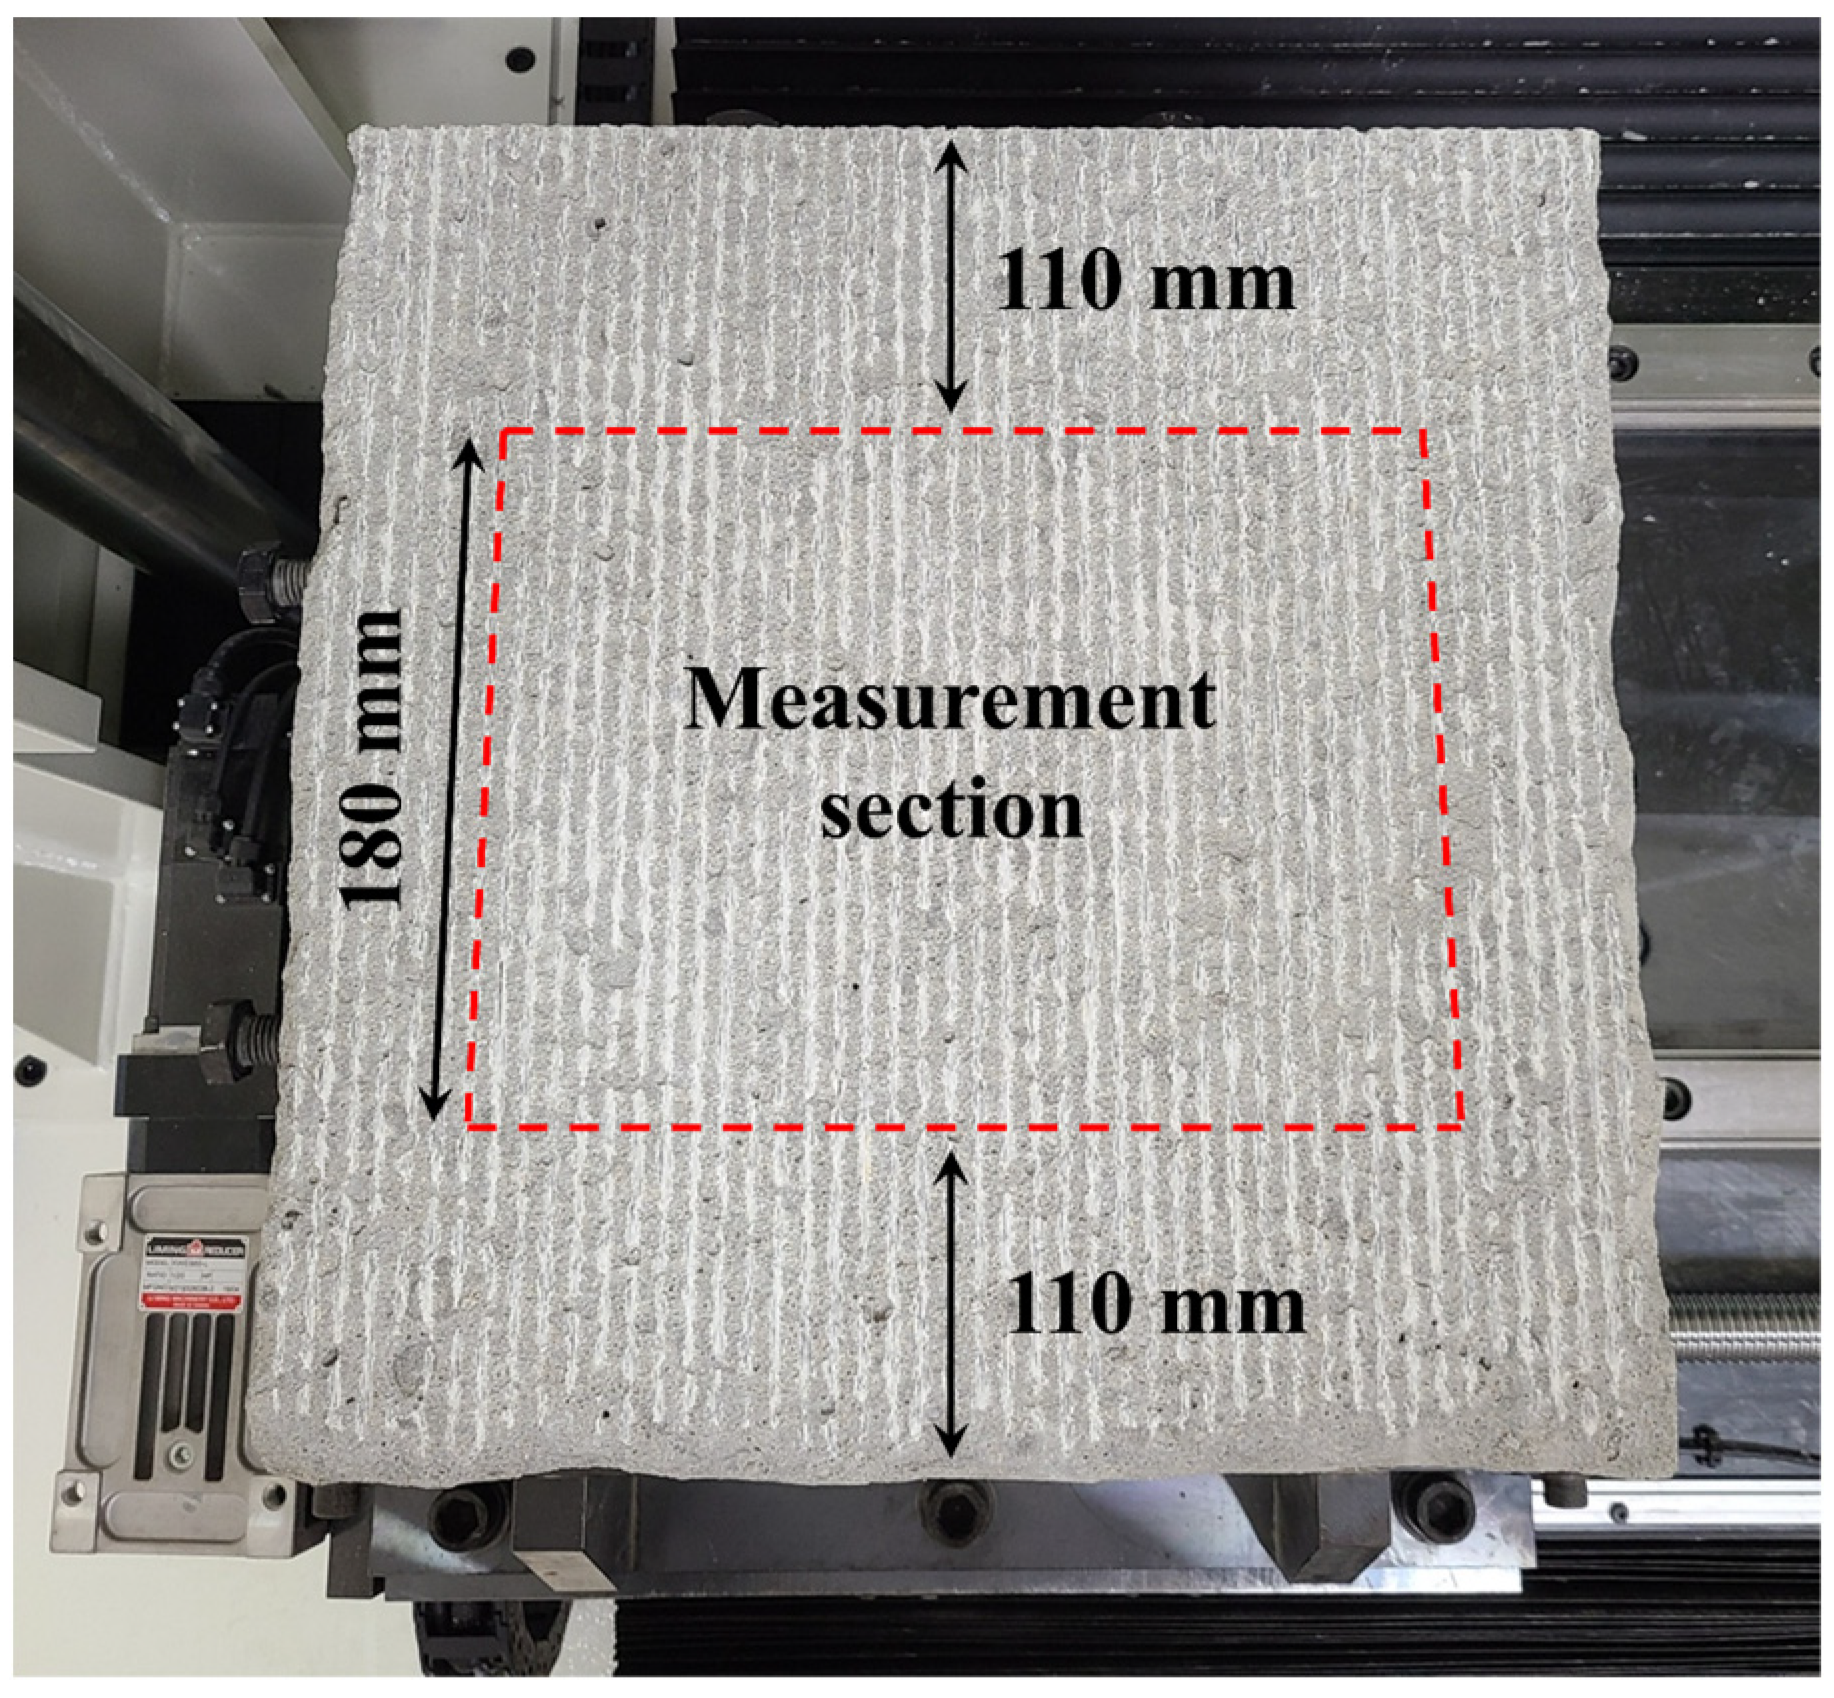
2.1.2. Cutting Tool and Rock Sample

Cutting tools can be classified into roller and drag types [4]. A representative example of the roller type is the disc cutter of a TBM, and the drag type includes the conical pick of a roadheader. In this study, a drag-type cutting tool was used, as shown in Figure 3. This cutting tool was obtained from Radical Pick and was manufactured using SKD 11 alloy steel with a hardness greater than 60 HRC. The length and thickness of the cutting tool were set to 80 and 30 mm, respectively. The rake angle was set to 5°, and the clearance angle was set to 10°. The detailed specifications of the cutting tool are shown in Figure 3a, and the cutting tool is shown in Figure 3b.
It is difficult to obtain rocks of the same strength and composition. To overcome this limitation and for simplicity, rock-like materials made of cement, sand, and coarse aggregates have been used as substitutes in rock experiments [20,21]. In this study, model rocks were produced using sand and cement to replace real rock. The model rock had dimensions of 400 mm × 400 mm × 300 mm and was fabricated with uniaxial compressive strength (UCS) values of 20 MPa, 30 MPa, and 40 MPa. After a curing period exceeding 28 d, UCS and Brazilian tensile strength (BTS) tests were performed to confirm that the model rock reached the target strength. The physical and mechanical properties of the model rocks are presented in Table 1.

2.1.3. Cutting Scheme

Before performing the main cutting, a series of cuts were performed 2–3 times, as shown in Figure 4. This series of cuts is called preconditioning. Because the tunnel excavation machine excavates a damaged surface in the field, preconditioning was used to create the same conditions [3,21]. For the main cutting test, the penetration depth (p) was set to 3, 6, and 9 mm, and it was performed at various spacings (s), as shown in Table 2. The tests were performed under 24 cutting conditions for each rock model. Because the cutting speed does not affect the cutting performance, such as the cutting force and SE, the cutting speed was arbitrarily set to 12.5 mm/s [22].
The SE is an important factor indicative of the excavation efficiency of tunnel excavation machines such as TBMs and roadheaders, and has been used in both the field and experiments [23,24,25]. The SE refers to the energy required to excavate a unit volume, and the excavation efficiency is maximized when SE is minimal. The SE can be calculated using Equation (1):
S E = F c × l V c
where SE denotes the specific energy, Fc denotes the cutting force, l denotes the length of the cut, and Vc denotes the cutting volume.
The generated cutting force (Fc) in the measurement area during the test was analyzed and stored every 25 ms. The cutting volume (Vc) was calculated using the weight and density of the rock fragments recovered in the section where the cutting force was measured.

2.2. Rock Fragment Analysis

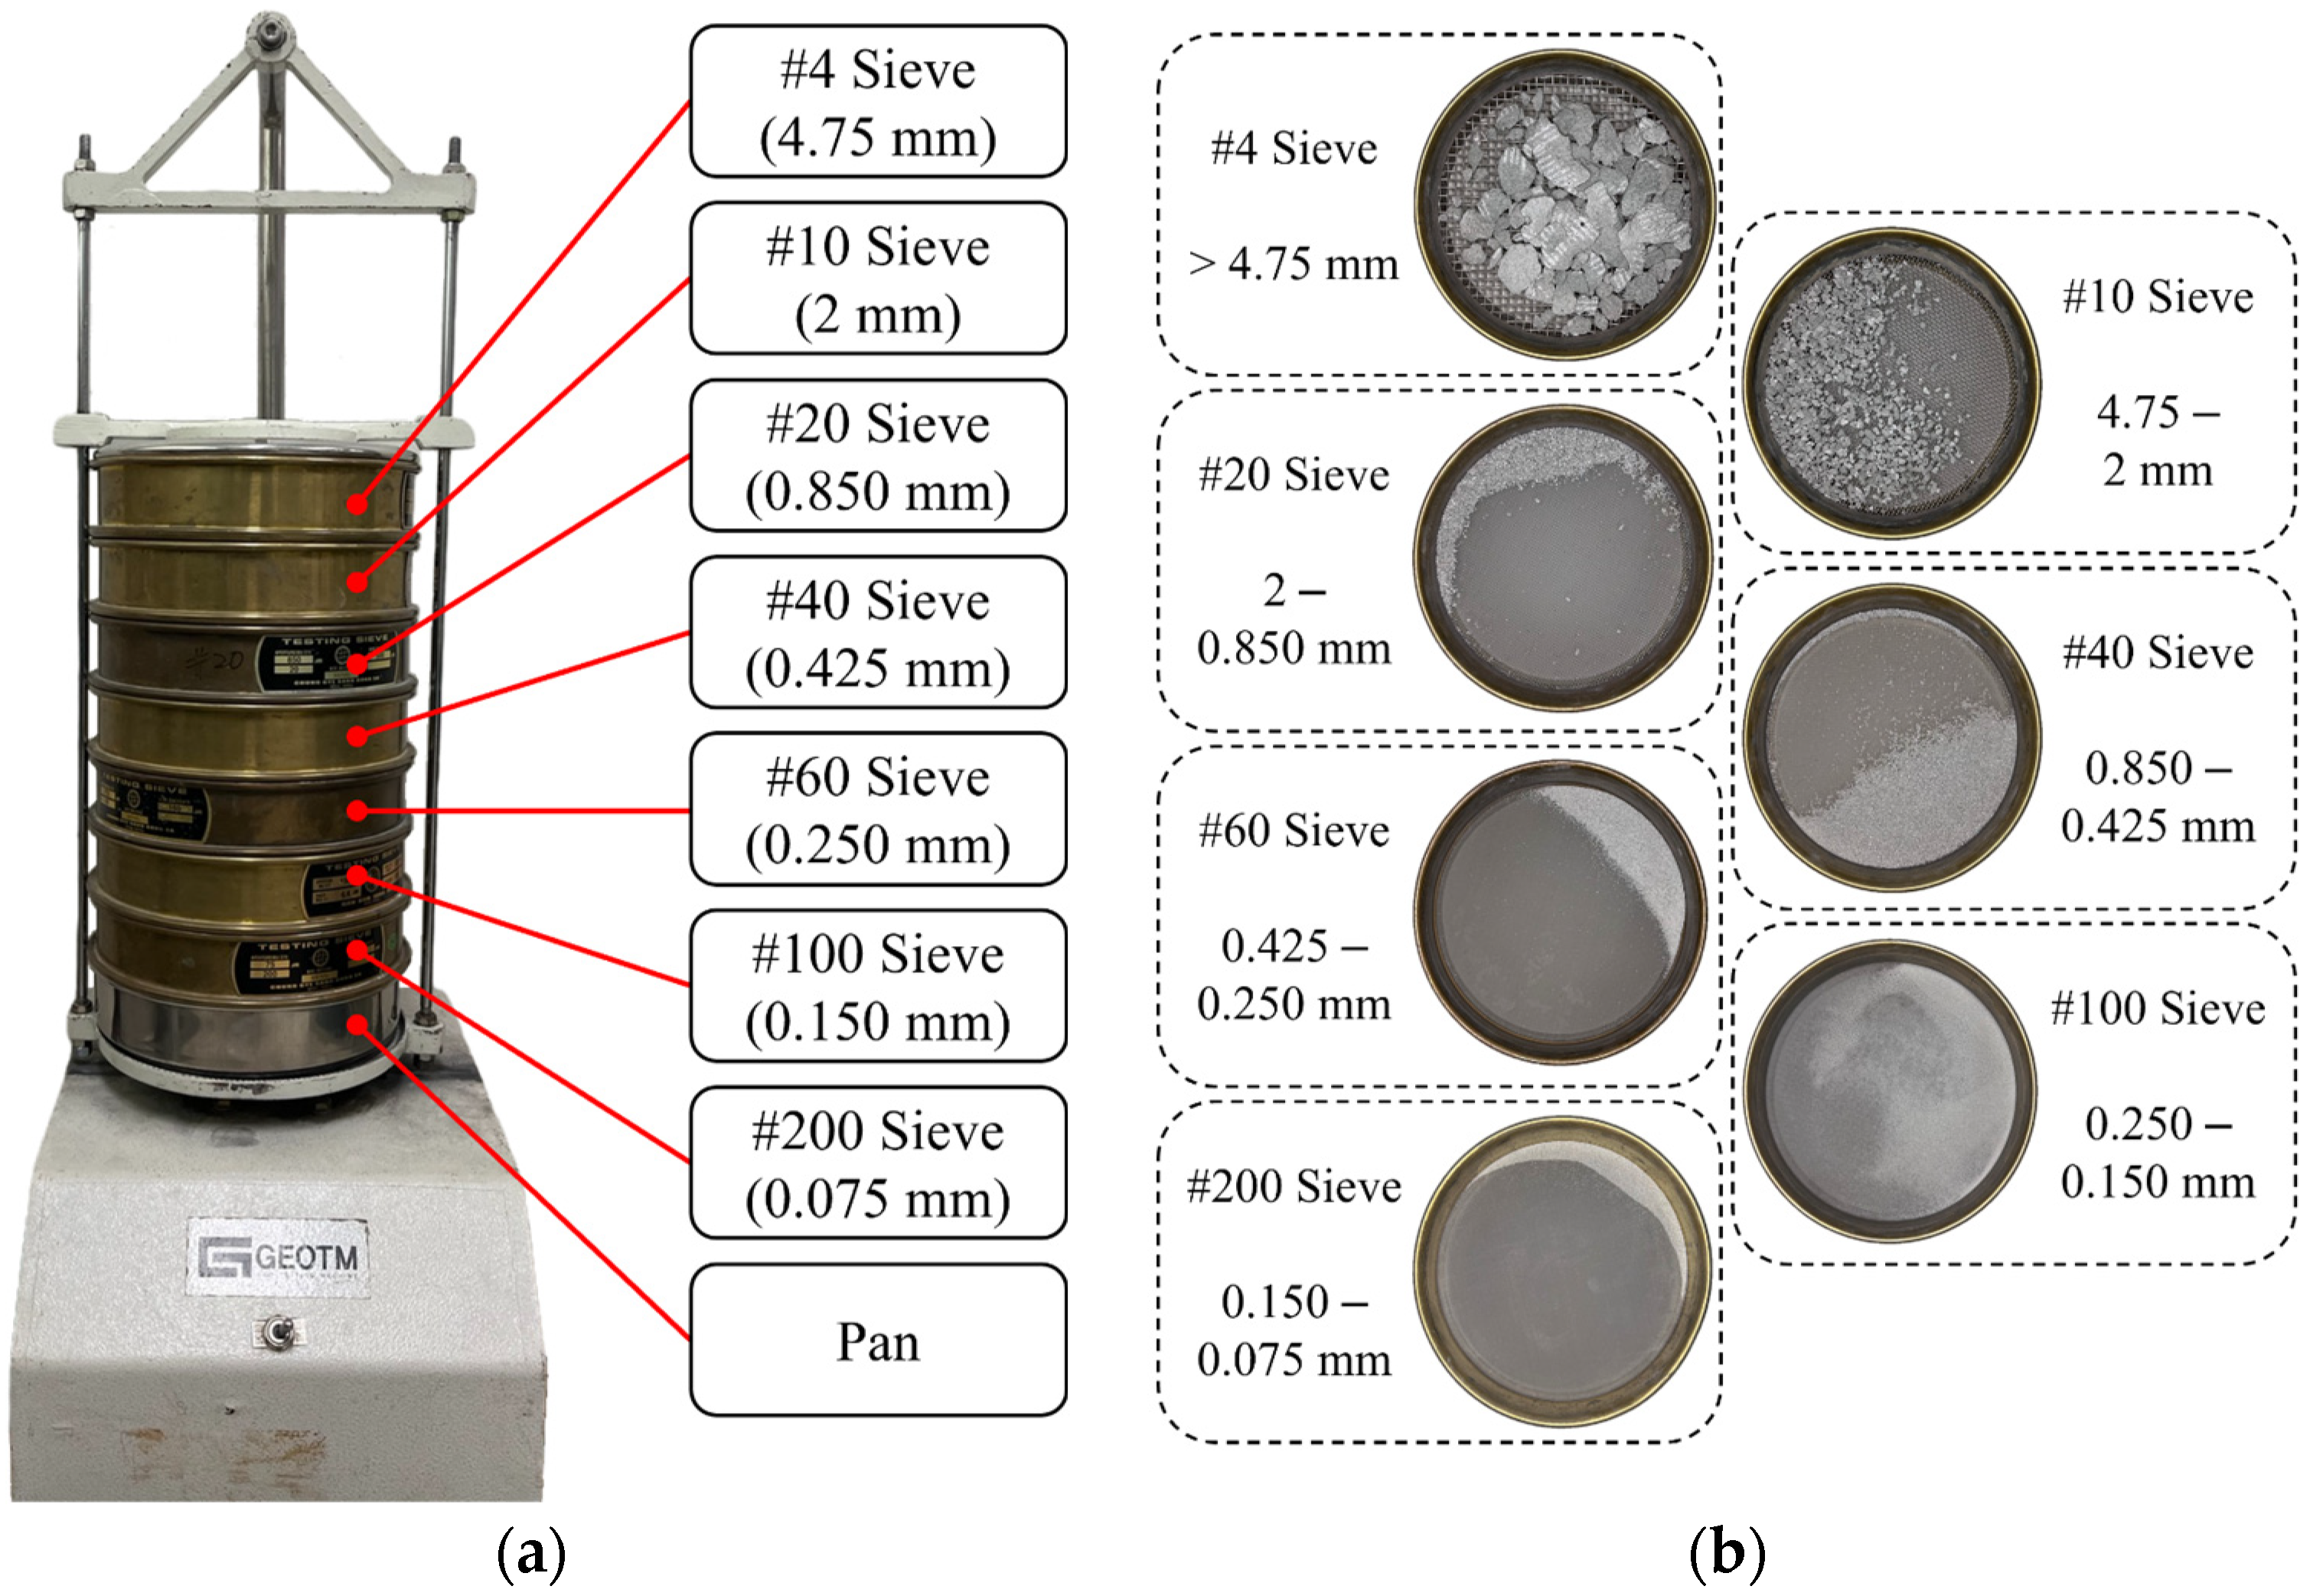
2.2.1. Sieve Analysis

After the rock-cutting tests were performed, the fragments were recovered and analyzed to determine the particle size distribution for each cutting condition using sieve analysis. Seven sieves with different opening sizes were used in this study (Figure 5a). During the sieve analysis process, the rock fragments moved vertically and horizontally through the mesh of the sieve. Consequently, rock chips with different size ranges were classified in each sieve (Figure 5b). After sieve analysis, the masses of the classified rock chips were used to calculate the CI. Furthermore, the largest rock chip in sieve #4 was collected to obtain the maximum diameter (dmax).

2.2.2. Coarseness Index

The CI is a nondimensional value that expresses the particle size distribution of rock fragments generated during cutting. CI has an important relationship with SE. Regardless of the cutting tool type, SE decreases as CI increases and is minimized with the maximum value of CI [14]. Therefore, it can be used as an indicator of the cutting efficiency of mechanical cutting operations [16].
The CI is defined as the sum of the cumulative weight percentages of the remaining particles in each sieve used. Therefore, this value depends on the opening size and the number of sieves used [17,18]. For this reason, to use CI as a rock particle characteristic, values from the same set of sieves should be used. CI was calculated using Equation (2):
C I = i = 1 n W i W t
where CI denotes the coarseness index, n denotes the number of sieves used, Wi denotes the weight of the rock chip in the ith largest sieve, and Wt denotes the total weight of the rock chips used for sieve analysis.

3. Comparison of Maximum Diameter and Particle Size Parameters

3.1. Correlation between Coarseness Index and Particle Size Parameters

In addition to the CI, the most widely used methods for measuring and analyzing particle size include the average particle size and absolute particle size. These were obtained by mathematical calculations using the particle size distribution acquired by sieve analysis.
The median particle size (d50) corresponds to the midpoint of the particle size distribution. Thus, d50 is smaller than half of the rock fragments and larger than the other half. Altindag [26] reported a strong power–function relationship between d50 and CI. Mohammadi, et al. [18] reported that d50 has an exponential relationship with CI.
The mean particle size (dMPS) is obtained from the arithmetic average of all phi sizes of the particles in the sample. The phi size is a logarithmic scale that Krumbein [27] modified from the Udden–Wentworth scale and is primarily used to determine the particle size of rocks in sedimentology; it is calculated using Equation (3):
Φ = log 2 d d 0  
where Φ denotes the phi size, d denotes the diameter of the particle in millimeters, and d0 denotes the reference diameter, which is equal to 1 mm.
Because it is difficult to determine the value of all rock fragment particles, dMPS is usually calculated using percentile values, as shown in Equation (4). Mohammadi, et al. [18] and Heydari, et al. [28] reported that dMPS has a power or exponential function with CI.
d MPS = d 0 × 2 Φ 16 + Φ 50 + Φ 84 3
where dMPS denotes the mean particle size and Φ16, Φ50, and Φ84 denote the phi sizes corresponding to 16%, 50%, and 80% in the cumulative curve, respectively.
The absolute particle size (d′) is obtained from the Rosin–Rammler distribution function, which is one of the most widely used particle size distribution curves. The Rosin–Rammler relationship is given by Equations (5) and (6):
R = 100 e x p [ ( d d ) n ]
ln [ ln ( 100 R ) ] = n   ln   d n   ln   d
where R denotes the cumulative mass (volume) as a percentage retained on the sieve of size d; d′ denotes the absolute particle size defined as the size at R = 36.79%; and n denotes the distribution parameter.
Abu Bakar and Gertsch [15] and Mohammadi, et al. [18] reported that d has a very strong exponential relationship with CI. Wang, et al. [19] and Heydari, et al. [28] found that d′ and CI have a strong power-function relationship.

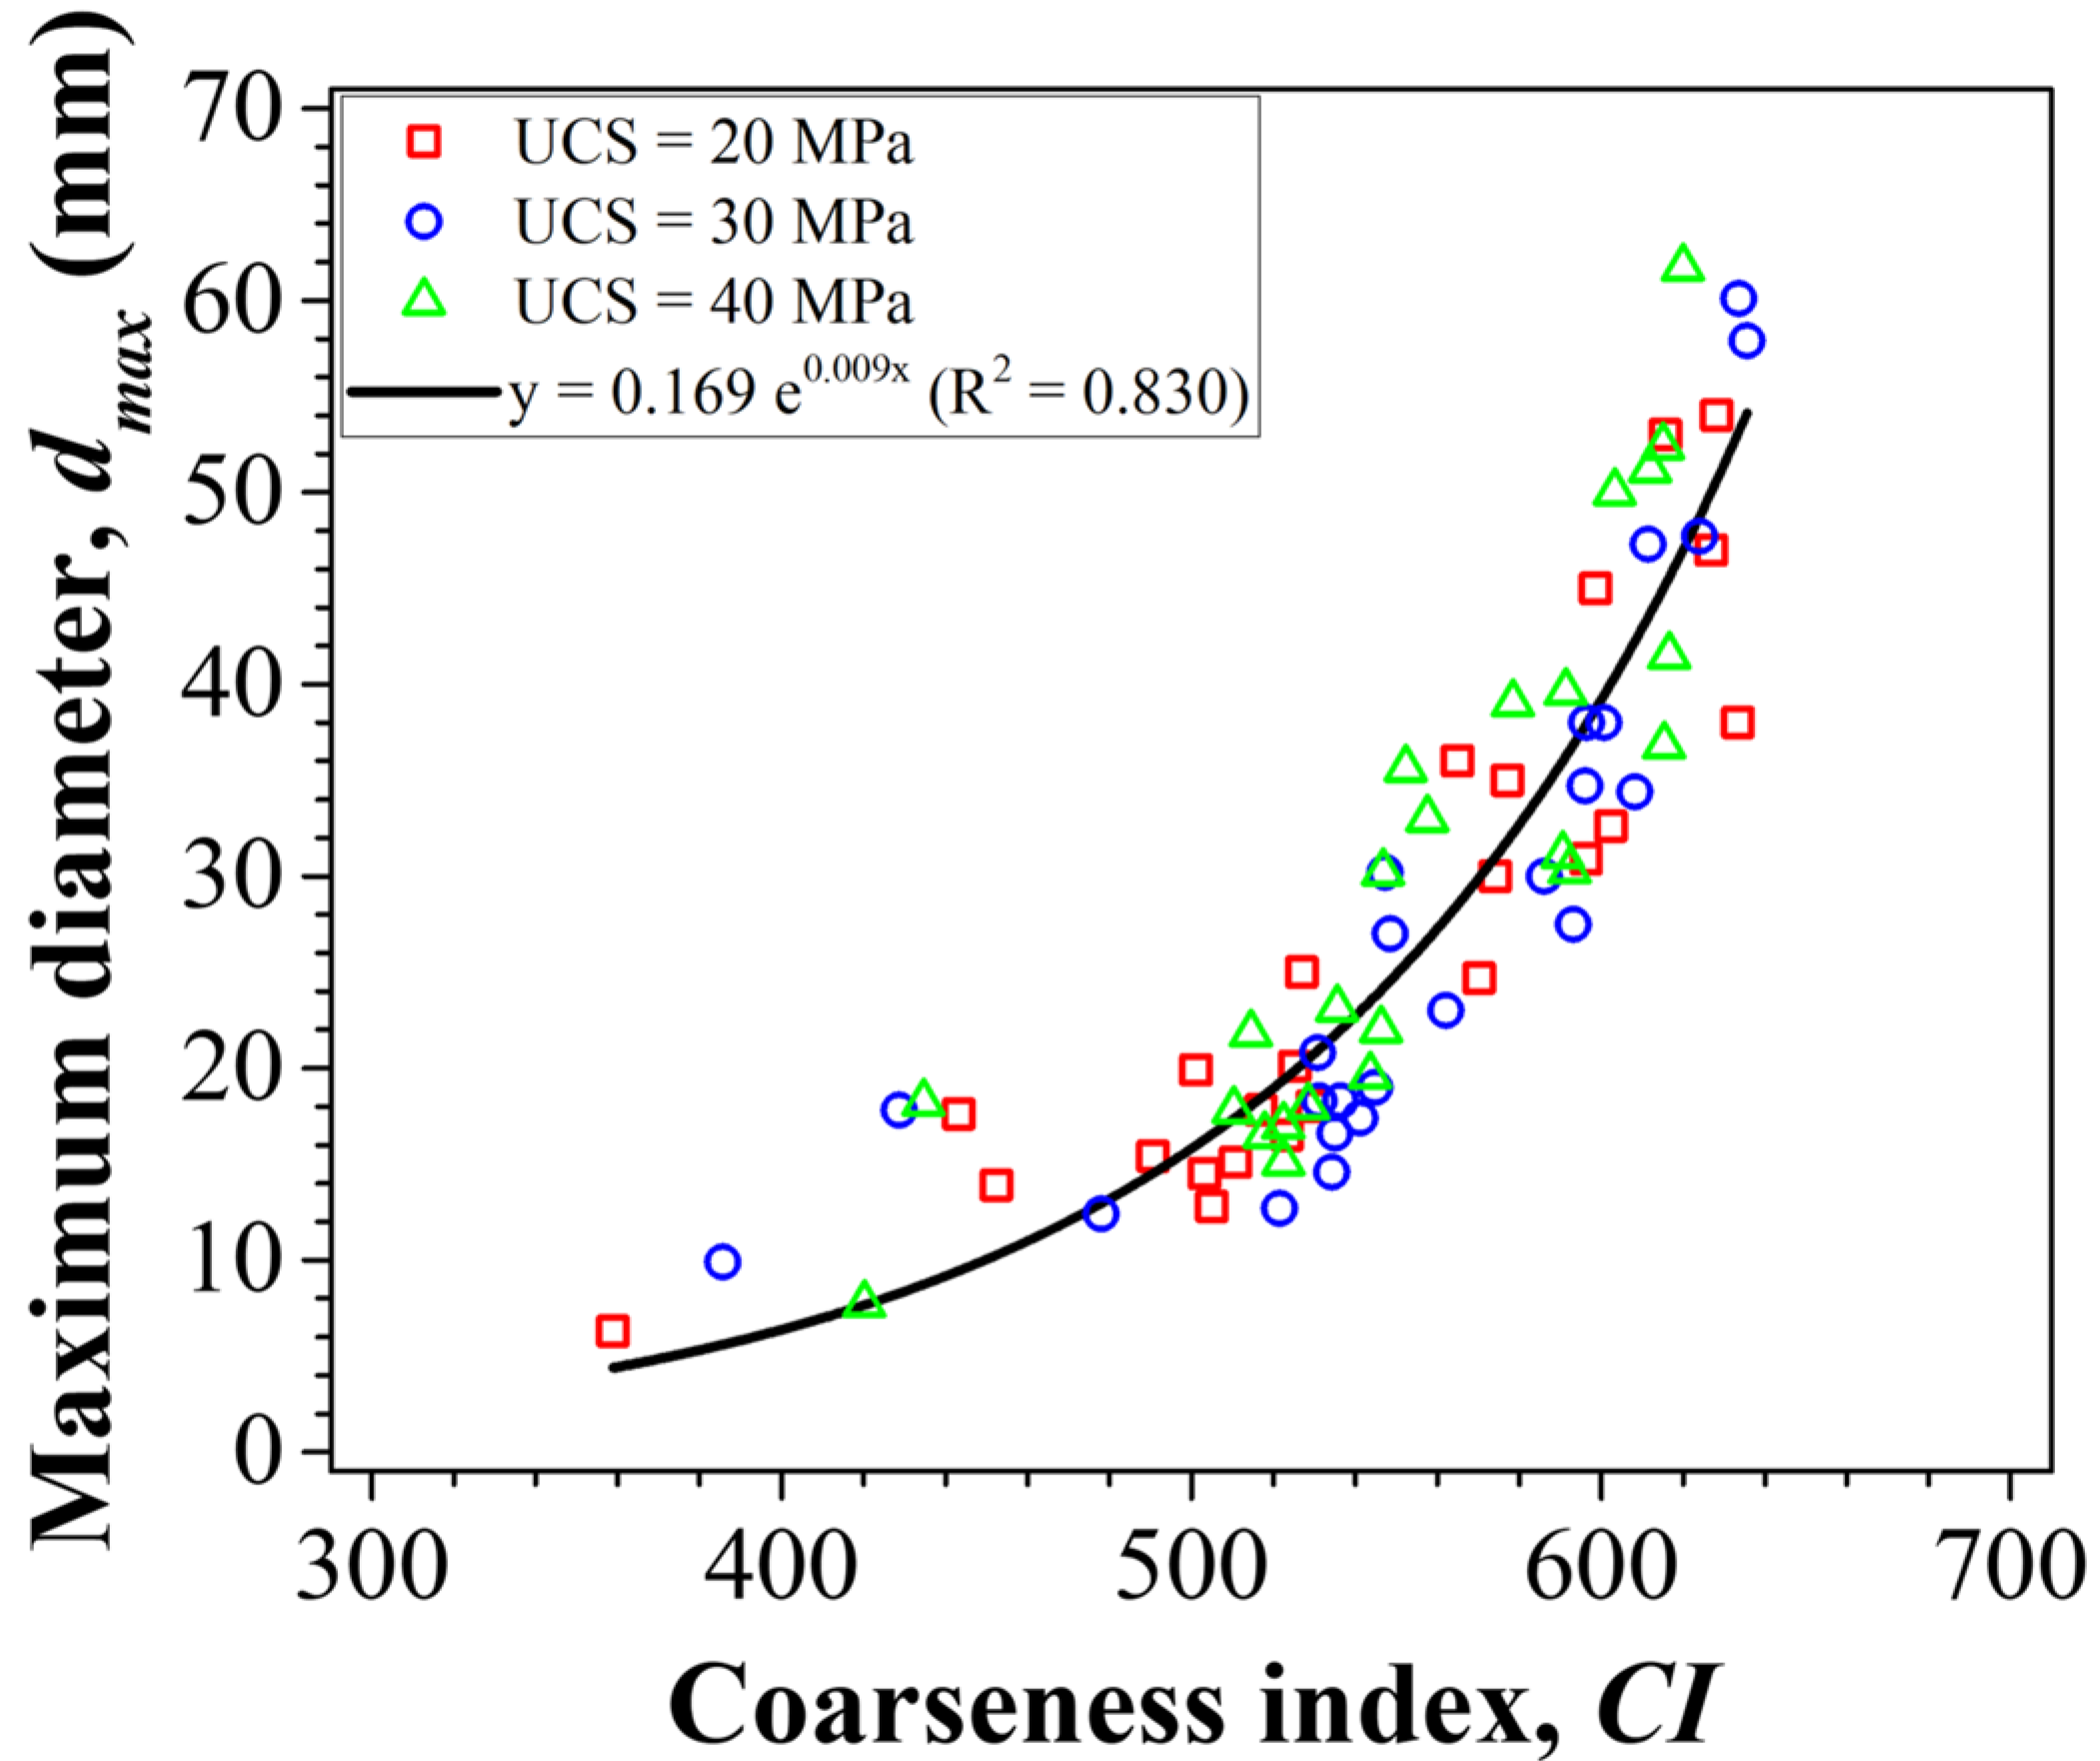
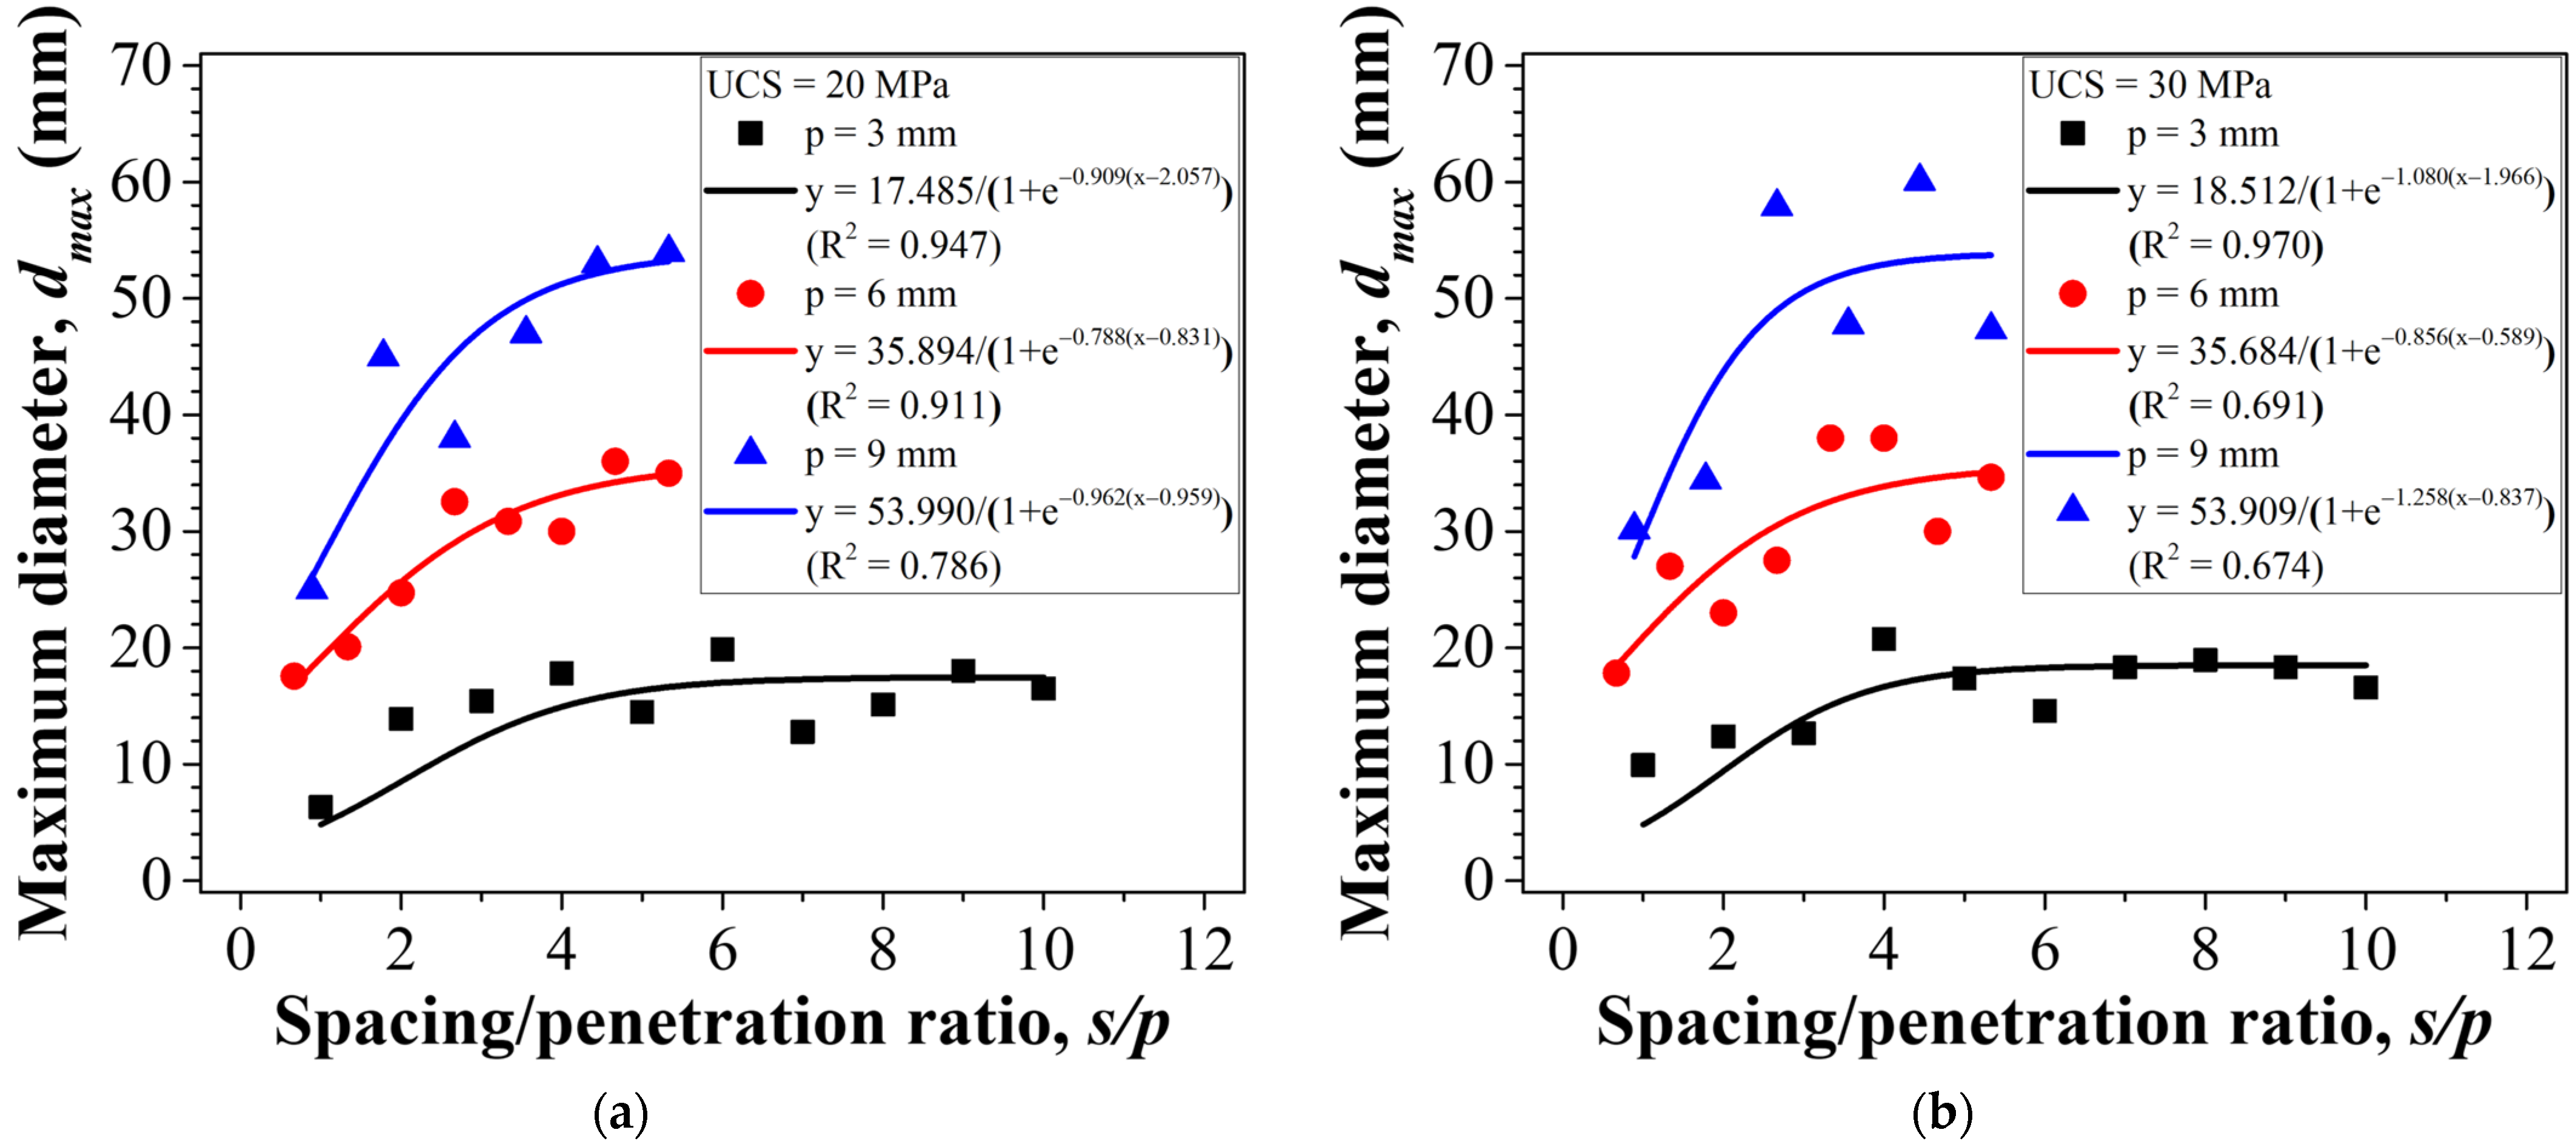
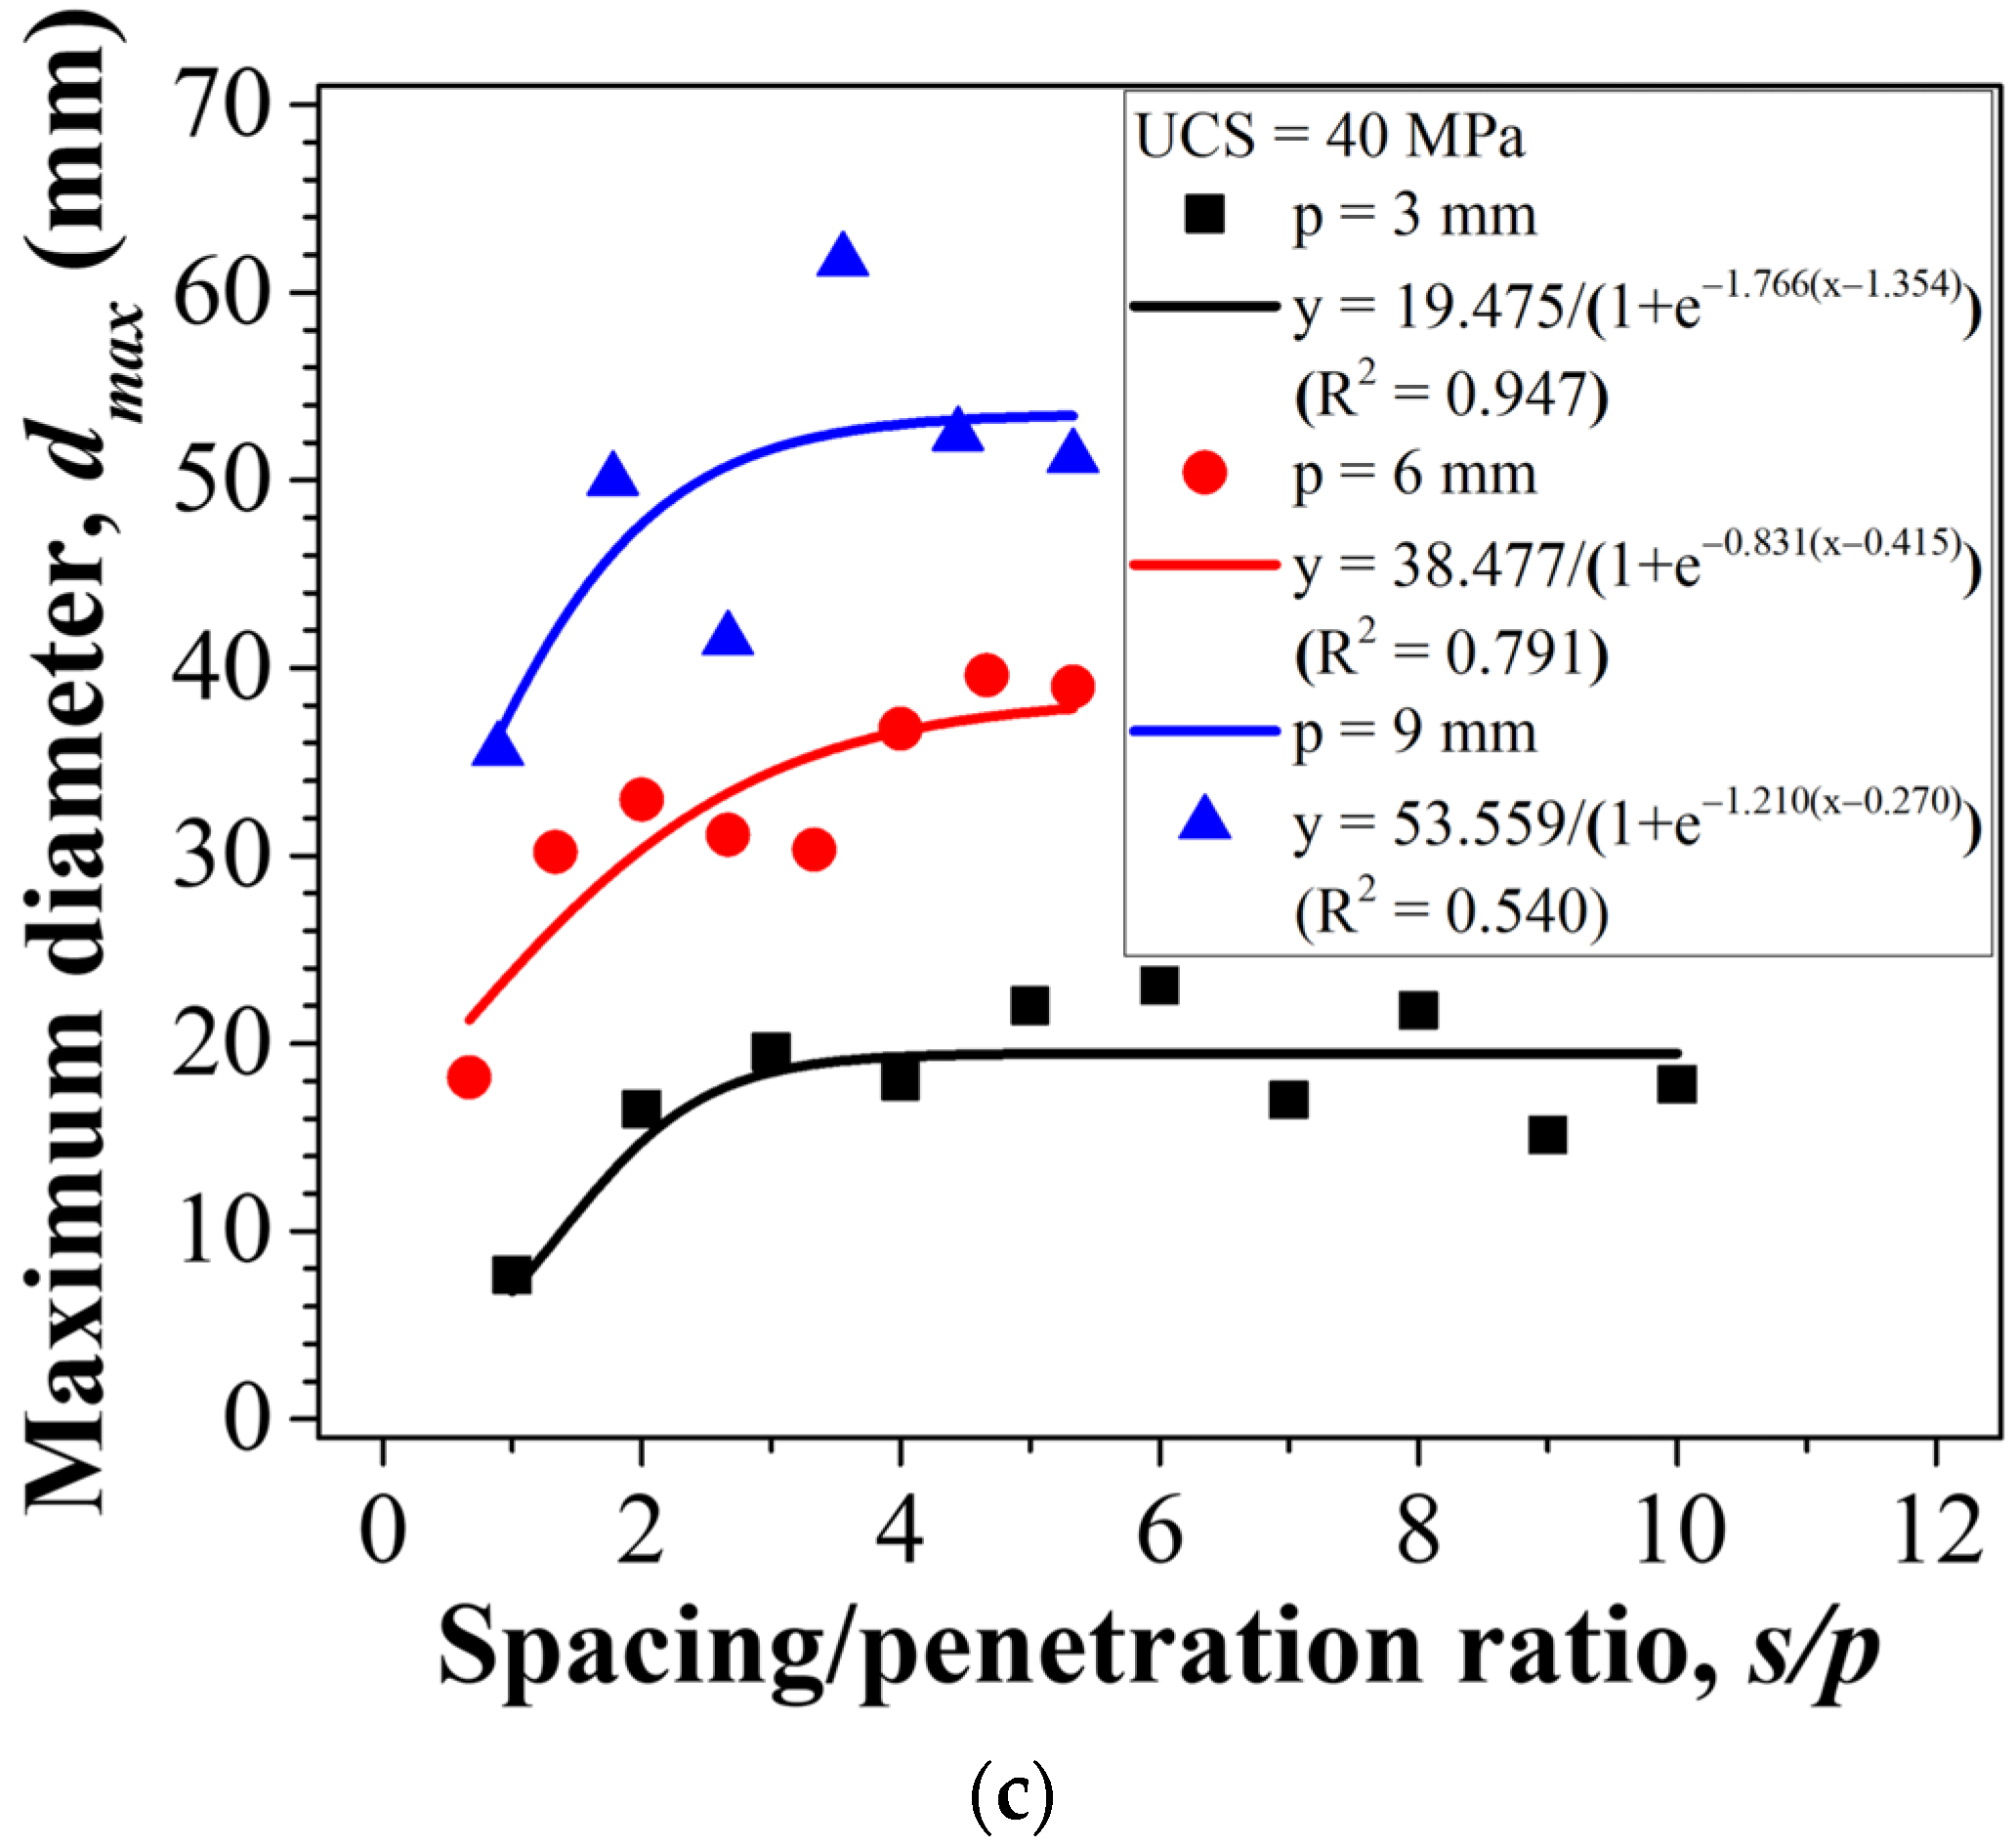
3.2. Correlation between Coarseness Index and Maximum Diameter

The maximum diameter (dmax) is a particle property that does not require a mathematical calculation. Therefore, it can be said that this is the most intuitive characteristic of rock fragments that does not require additional calculations.
Figure 6 shows the relationship between dmax and CI obtained in this study; the details are listed in Table 3, Table 4 and Table 5. Similar to d50, dMPS, and d′, dmax had an exponential relationship with the CI, with a strong correlation (R2 > 0.8). The range of change in CI was 480–620 in the rock with a UCS of 20 MPa and 530–640 in the rock with a UCS of 40 MPa. This is similar to the phenomenon in which CI is affected by rock strength in the relationship between d′ and CI [19]. Thus, dmax is sufficient to replace particle size parameters such as d50, dMPS, and d′.

4. Comparison of Coarseness Index and Maximum Diameter by Cutting Conditions

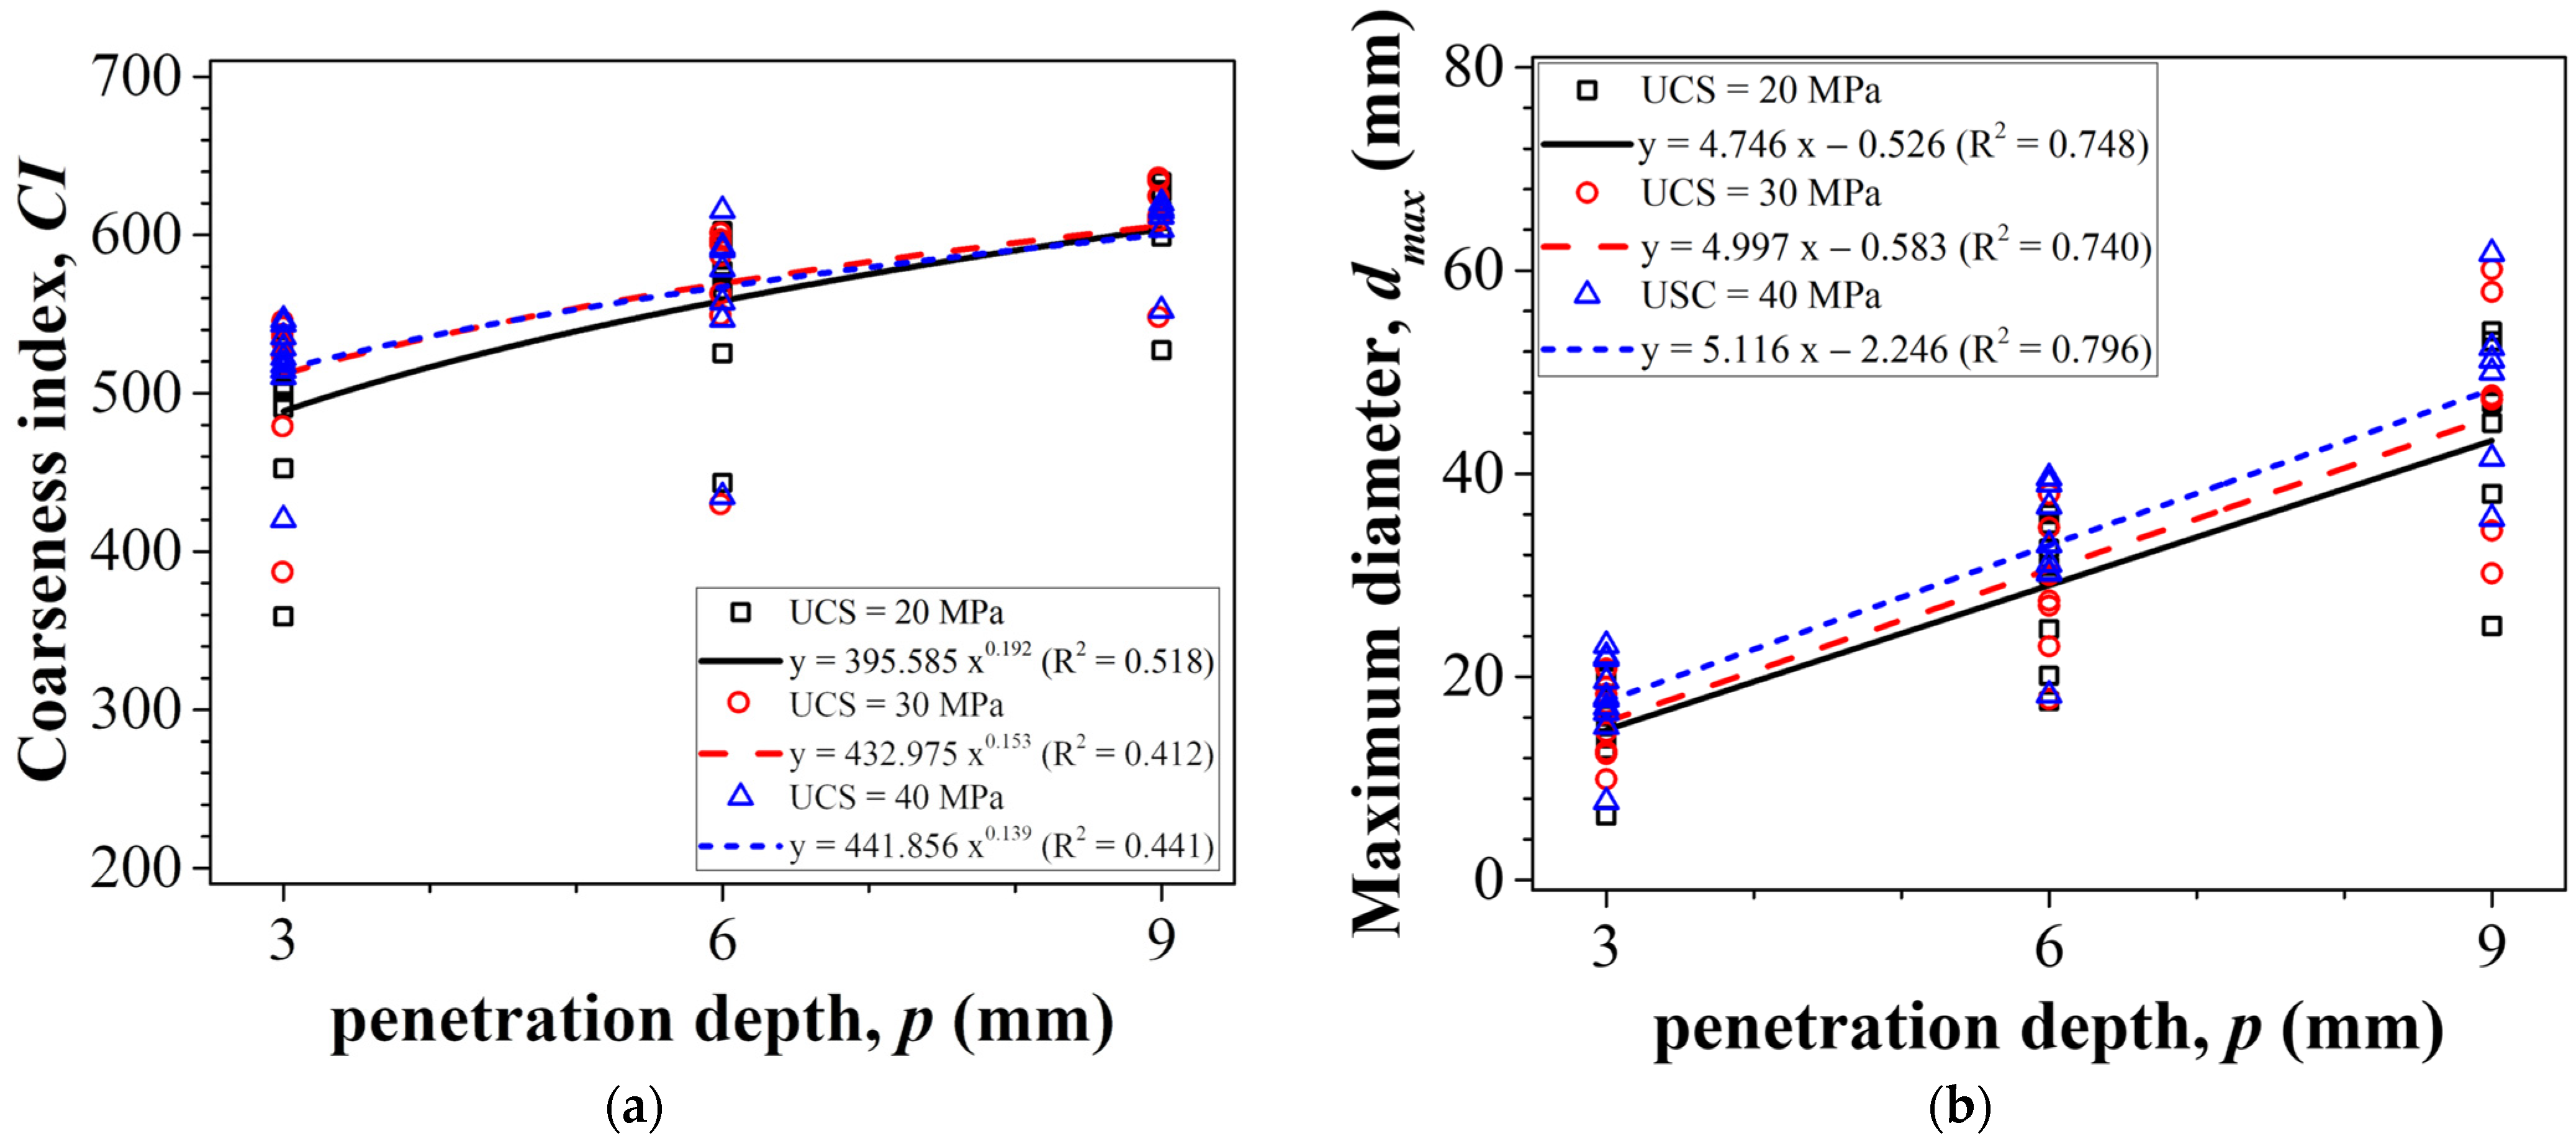
4.1. Effect of Penetration Depth

Penetration depth (p) is a major cutting parameter that affects the cutter head design of the excavation machine. In general, deeper penetration increases the size of the rock fragments, resulting in higher cutting efficiency, and vice versa. Because the excavation efficiency and particle distribution have a significant correlation, the penetration depth affects the particle size parameters as well as the CI.
Figure 7a shows the relationship between penetration depth and CI obtained in this study. As the penetration depth increased, CI increased, with a power relationship. This result is consistent with that reported by Wang, et al. [19]. The relationship between dmax and penetration depth is shown in Figure 7b. In general, particle size parameters have an exponential relationship with penetration depth [18,19]. However, dmax was found to have a linear relationship with penetration depth in this study. In addition, regardless of rock strength, the correlation of penetration depth with dmax (R2 > 0.74) was stronger than that with CI (R2 < 0.39).

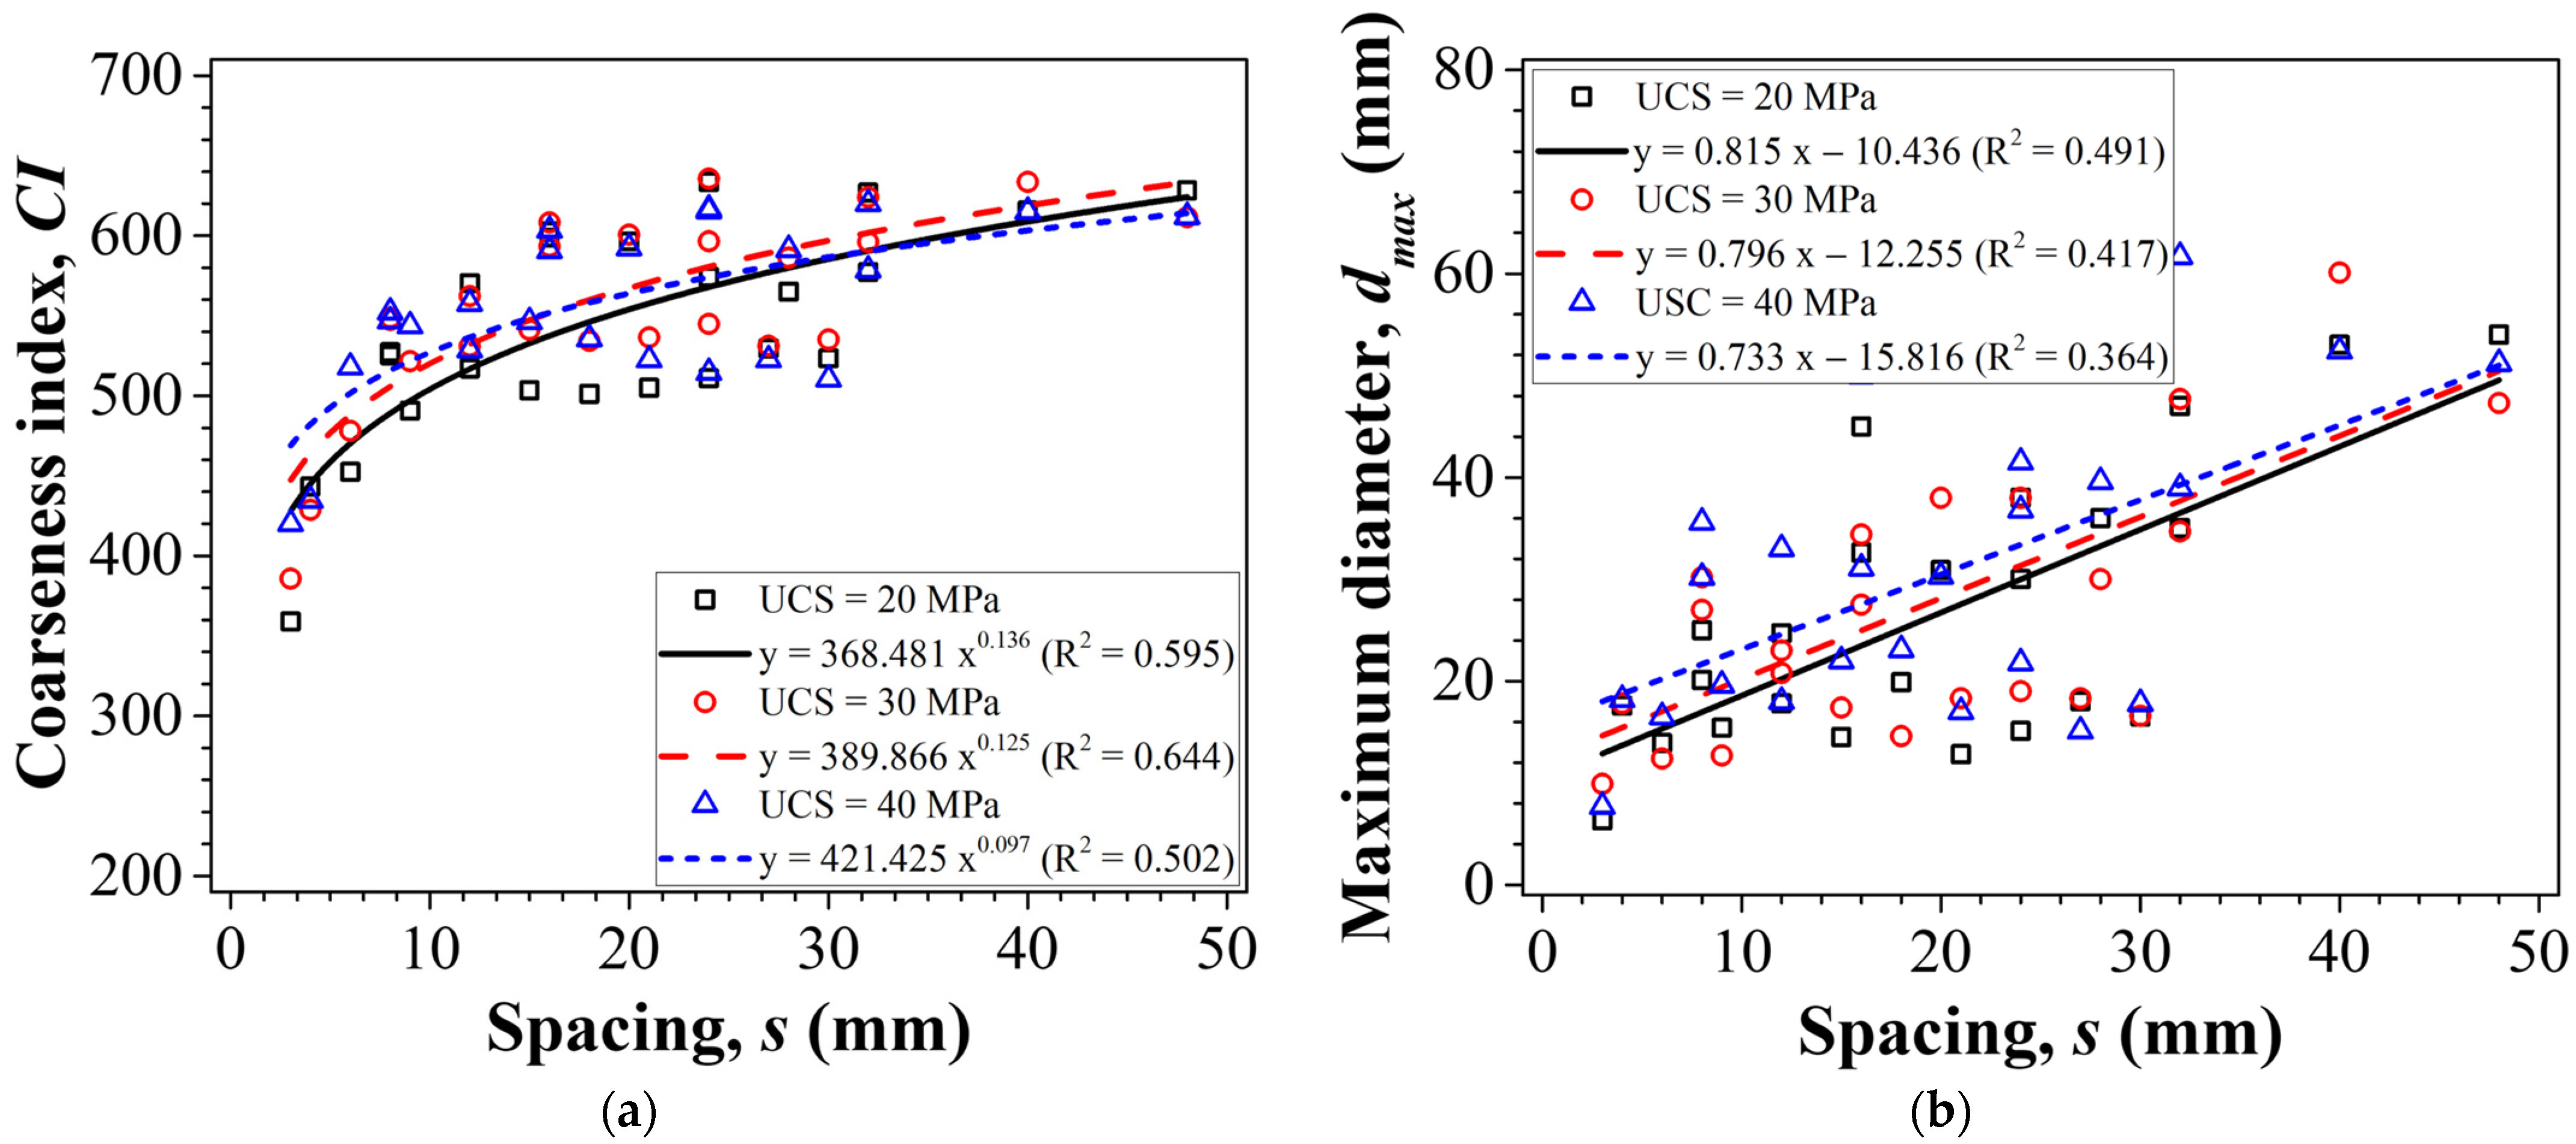
4.2. Effect of Spacing

In rock cutting, the spacing (s) between adjacent cuts significantly influences the excavation efficiency and size of rock fragments. The size of rock fragments can be increased by increasing the spacing between adjacent cutting tools. However, a spacing that is too narrow reduces the excavation efficiency. Thus, the CI and dmax were analyzed with respect to spacing.
Figure 8 shows the relationship between spacing and CI and the relationship between spacing and dmax. Abu Bakar, et al. [16] and Wang, et al. [19] reported that CI and d′ increased as the spacing increased. Similarly, CI and dmax increased with increasing spacing in this study. The CI increased with a power relationship, and dmax increased linearly. In contrast with the relationship with penetration depth, the correlation between spacing and CI (R2 > 0.50) was greater than that of dmax (R2 < 0.49).

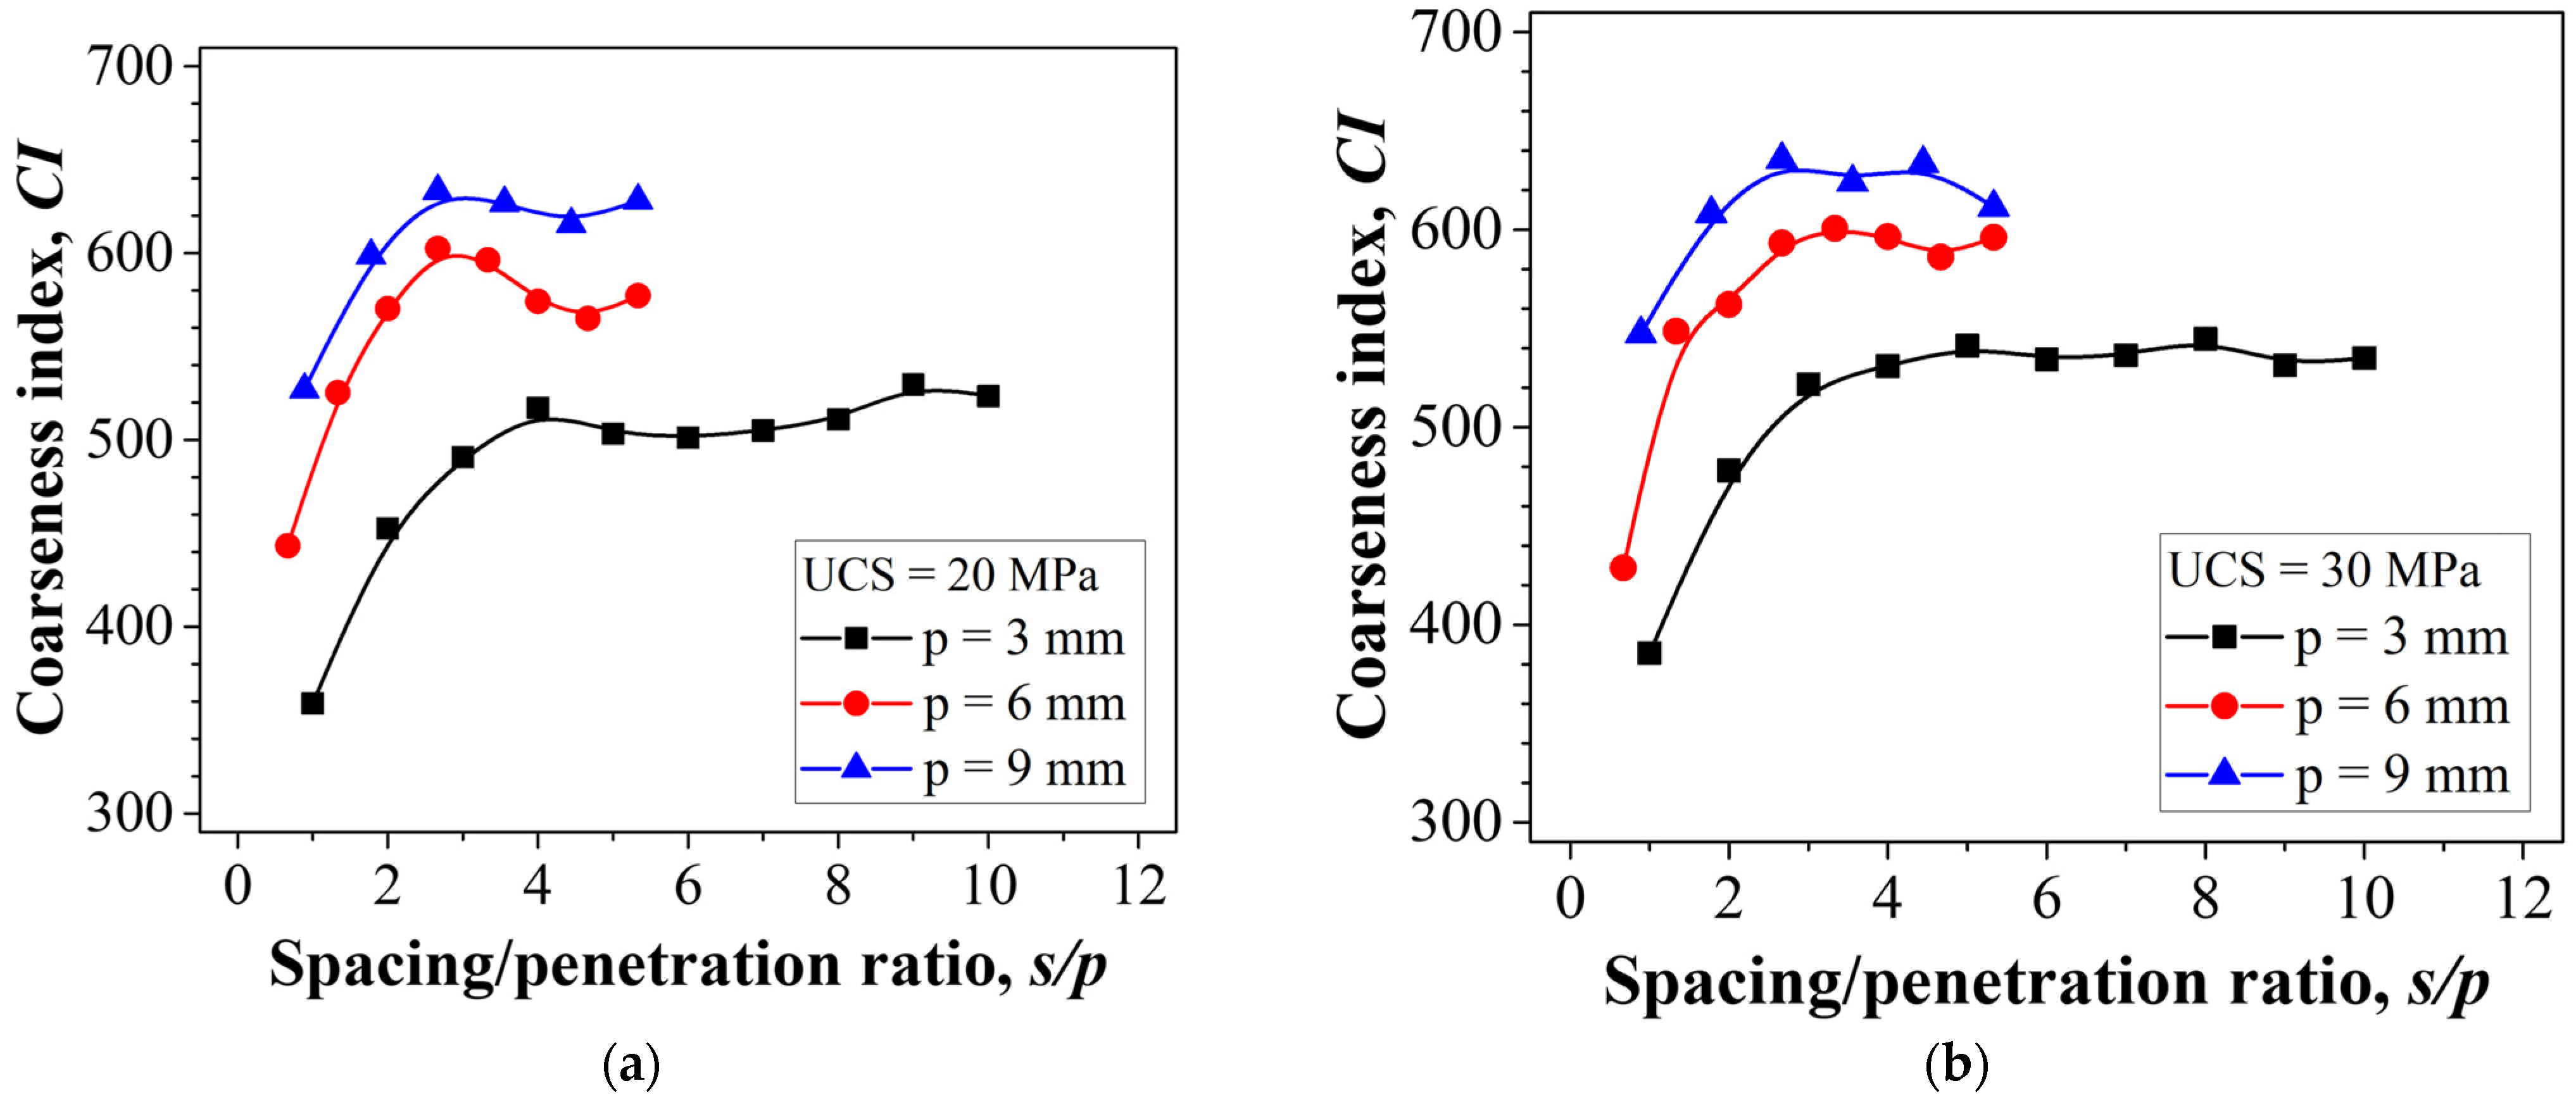
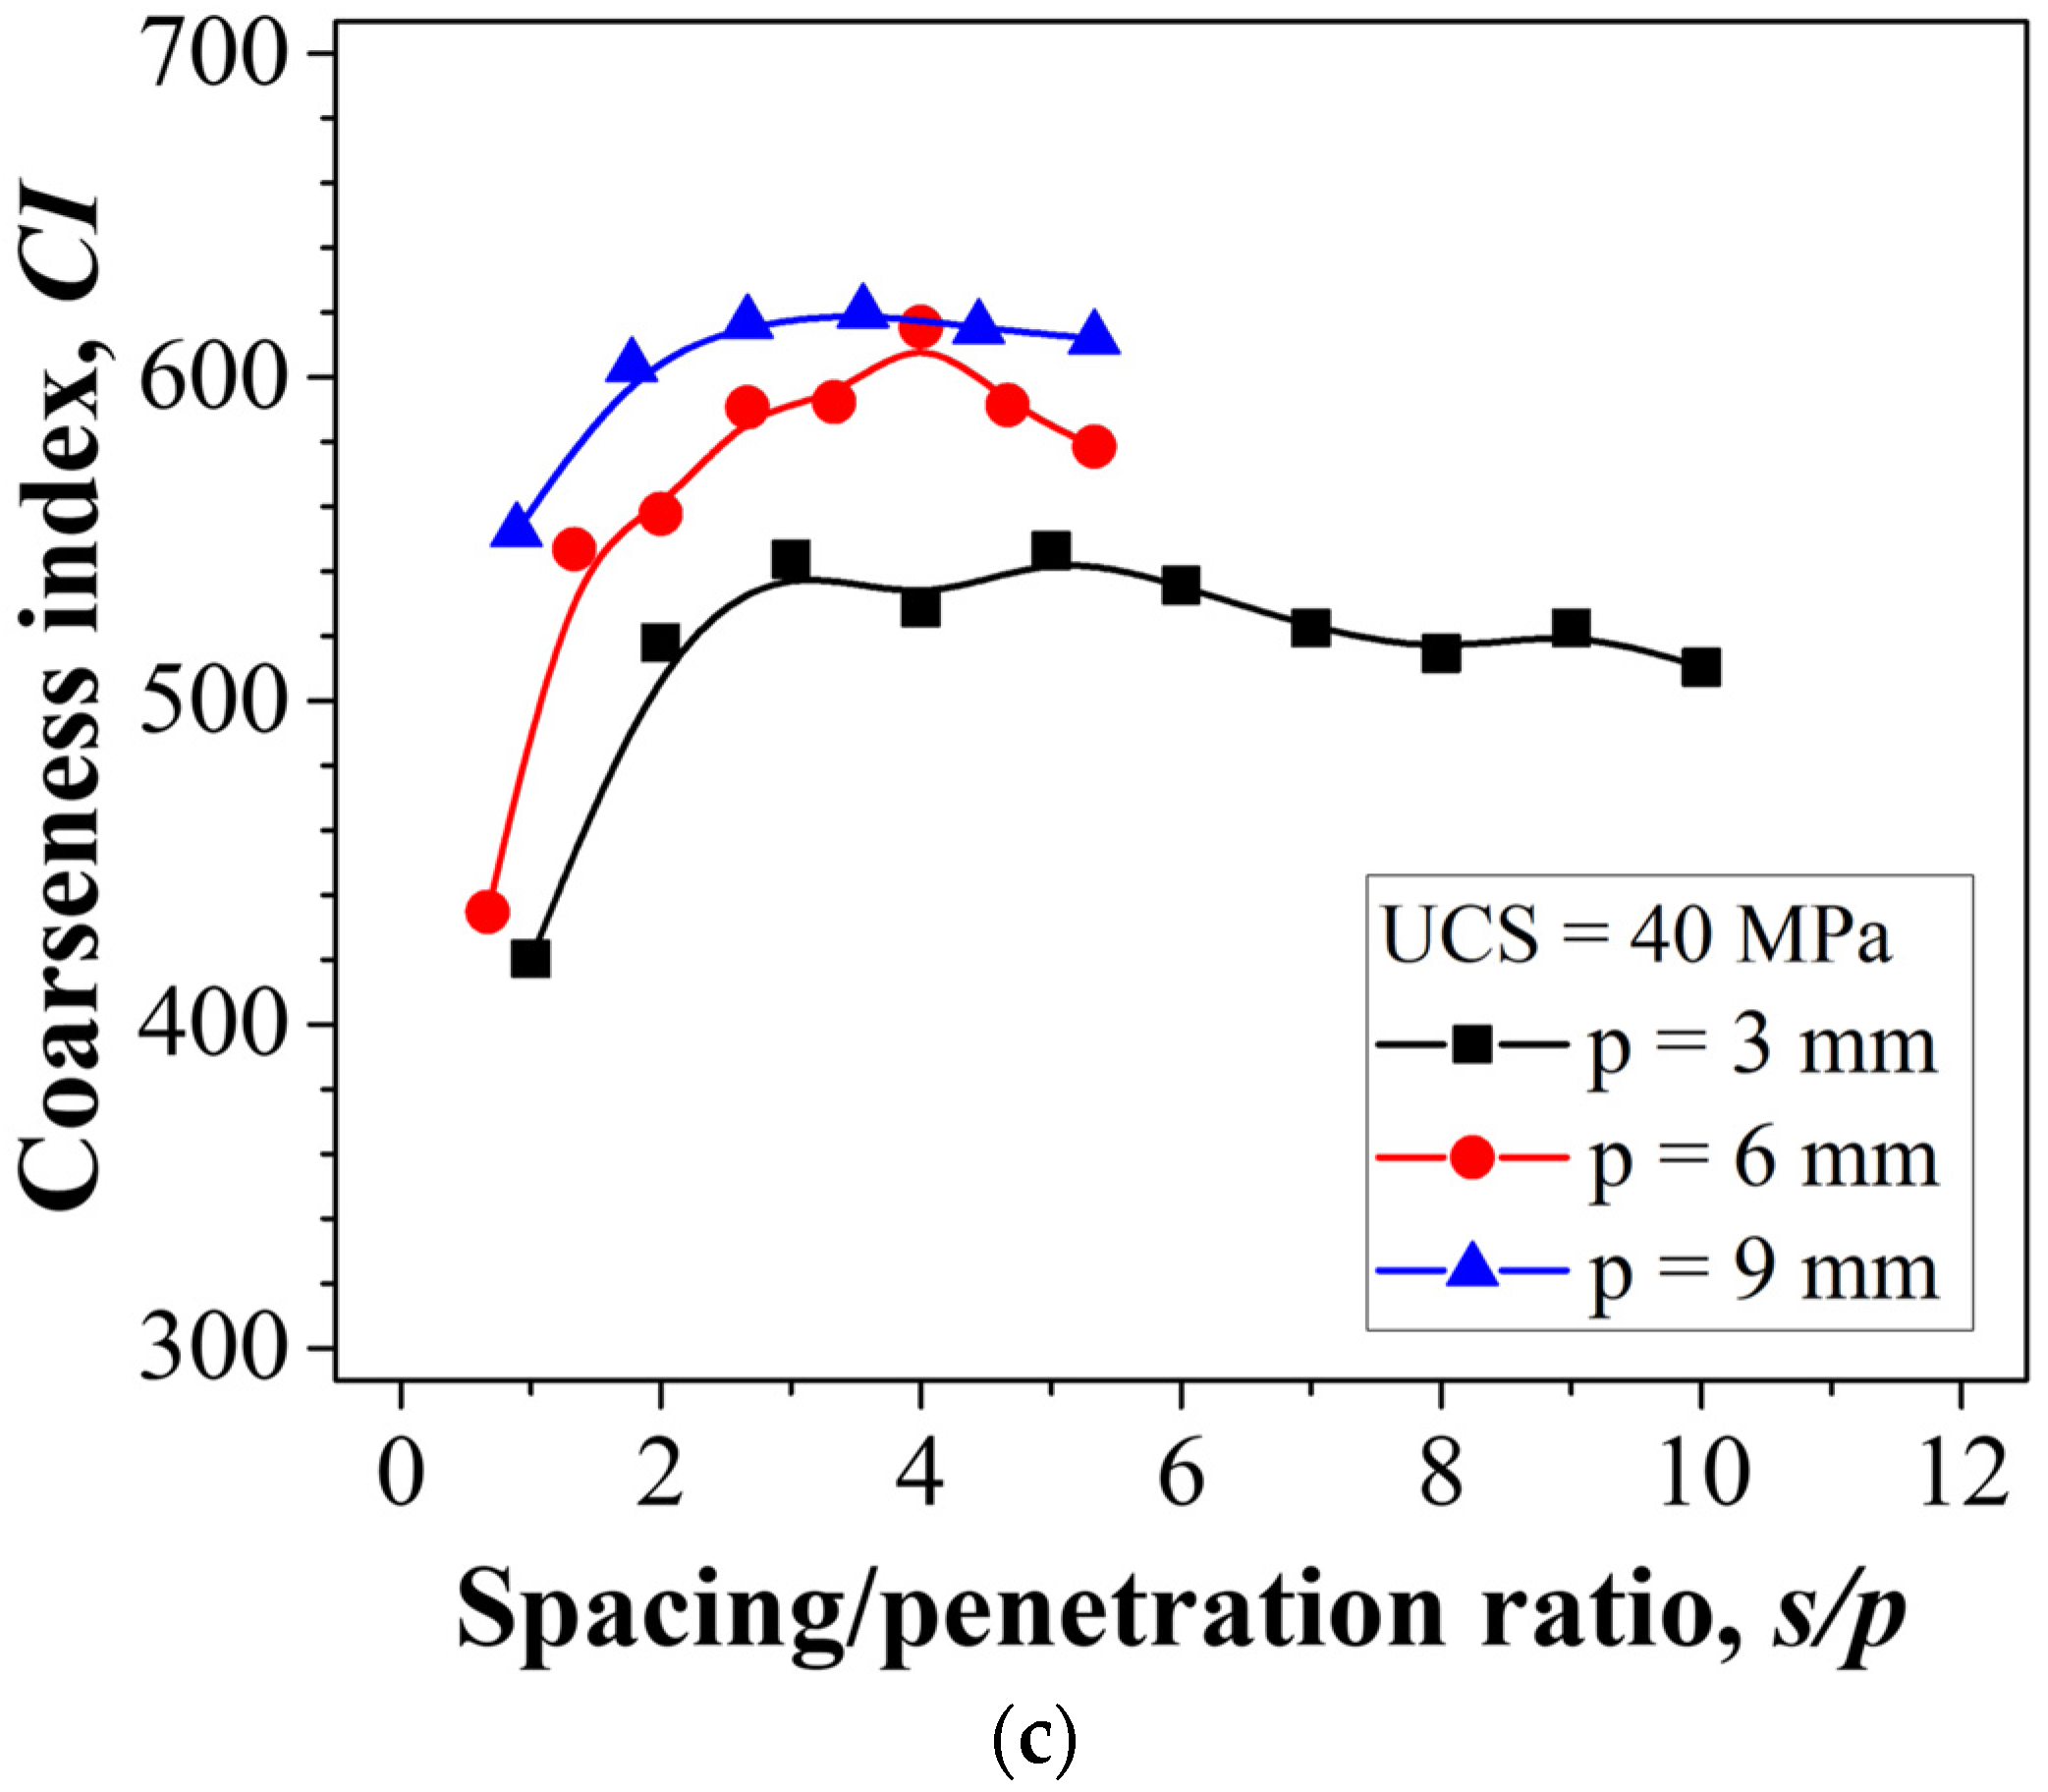
4.3. Effect of s/p Ratio

The s/p represents the ratio of the spacing to the penetration depth. In mechanical excavation, the cutting conditions are controlled by the s/p. SE is minimized and CI reaches its maximum at the optimum s/p [14]. In this context, the changes in CI and dmax with respect to the s/p were analyzed. The particle size distribution, CI, and dmax of rock fragments under various cutting conditions are summarized in Table 3, Table 4 and Table 5 for all rock strengths.
Figure 9 shows the relationship between CI and the s/p. Even for the same s/p value, as the penetration depth increased, the CI increased. When the s/p was relatively small (s/p < 3), CI increased as the s/p increased. The CI reached its maximum value near a specific s/p, regardless of the penetration depth. After reaching the maximum value, the CI value did not change significantly, even when the s/p increased. Taking a closer look at the cutting of rock of UCS 30 MPa (Figure 9b), CI reached its maximum near an s/p of 3, and the values were approximately 520, 600, and 640 at penetration depths of 3 mm, 6 mm, and 9 mm, respectively. After that, even if s/p exceeded 3, the CI did not deviate significantly from the maximum.
As shown in Figure 10, the relationship between dmax and the s/p was similar to that between CI and the s/p. At the same s/p, dmax increased as the penetration depth increased. dmax increased with an increase in s/p, and at a specific s/p, dmax reached a maximum. Subsequently, even if s/p increased, dmax did not change significantly. The regression curve of p = 3 mm in Figure 10b, which shows a high correlation (R2 = 0.970), demonstrates that dmax reached its maximum value at an s/p of approximately 4, and even at larger s/p values, dmax was approximately 16 mm.
In summary, CI and dmax show similar positive relationships with respect to both penetration depth and spacing, but different functions are formed. However, in terms of the relationship with the s/p, CI and dmax show high similarity.

5. Comparison of the Correlation with Cutting Results

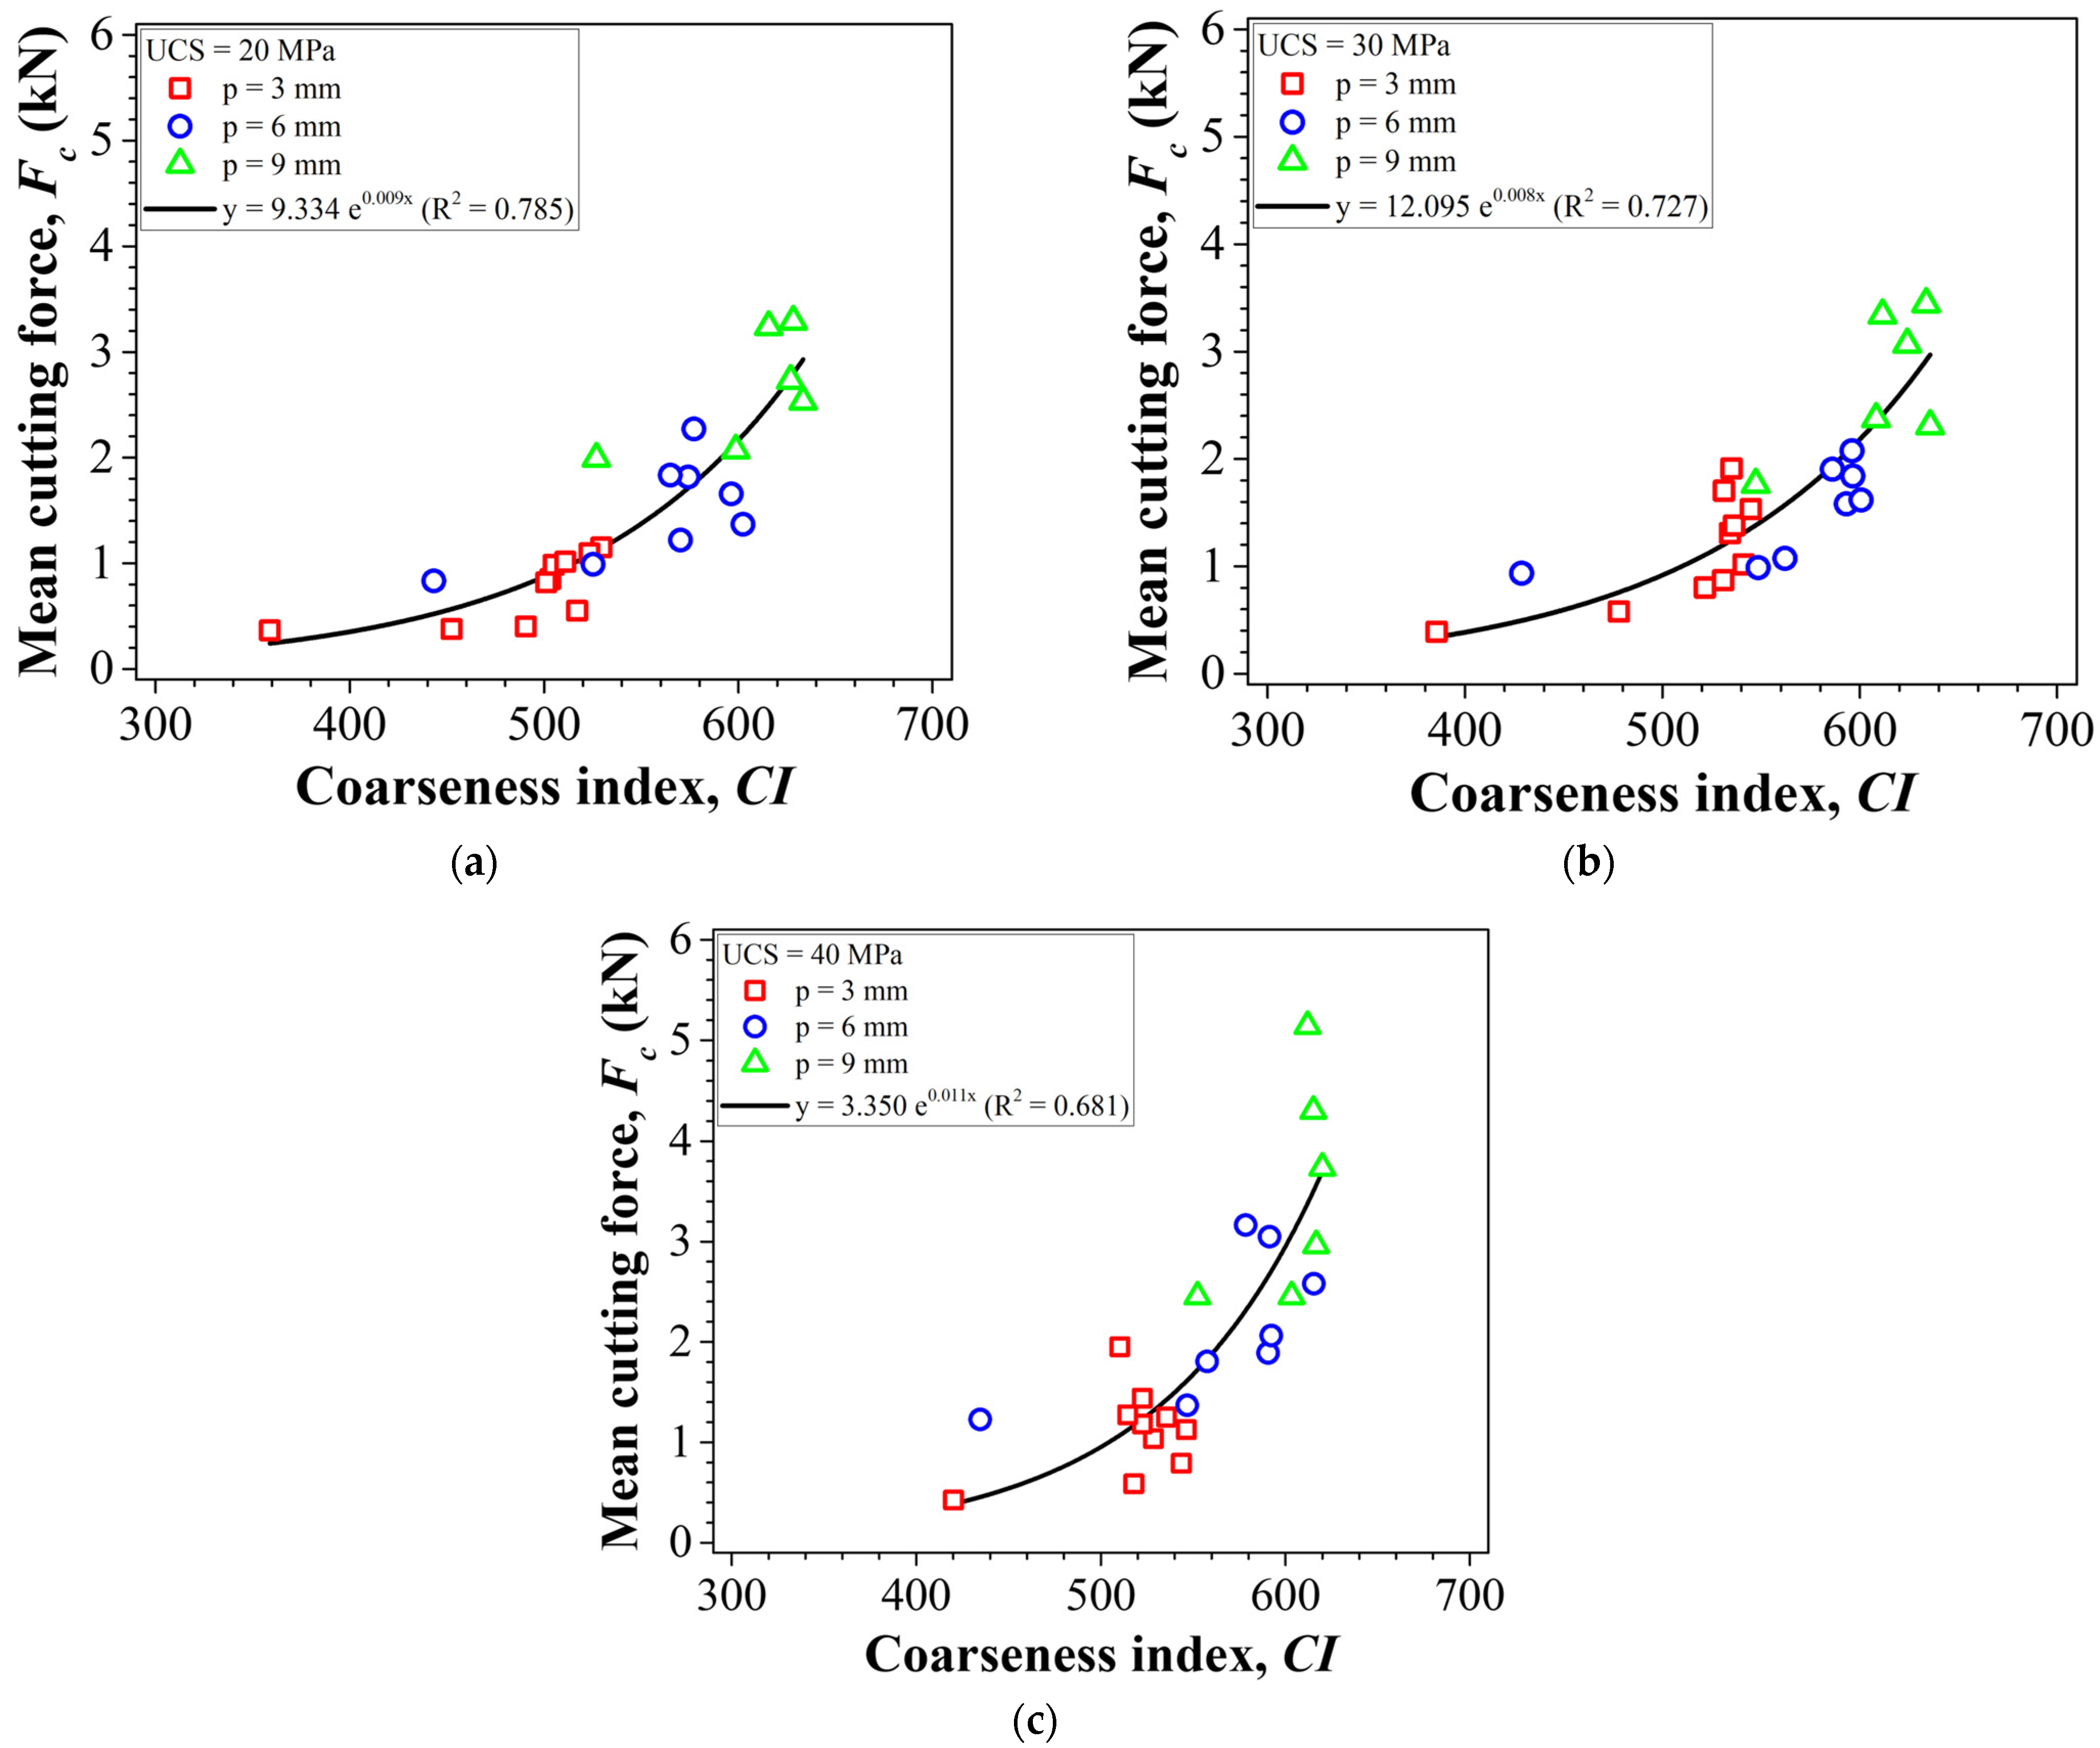
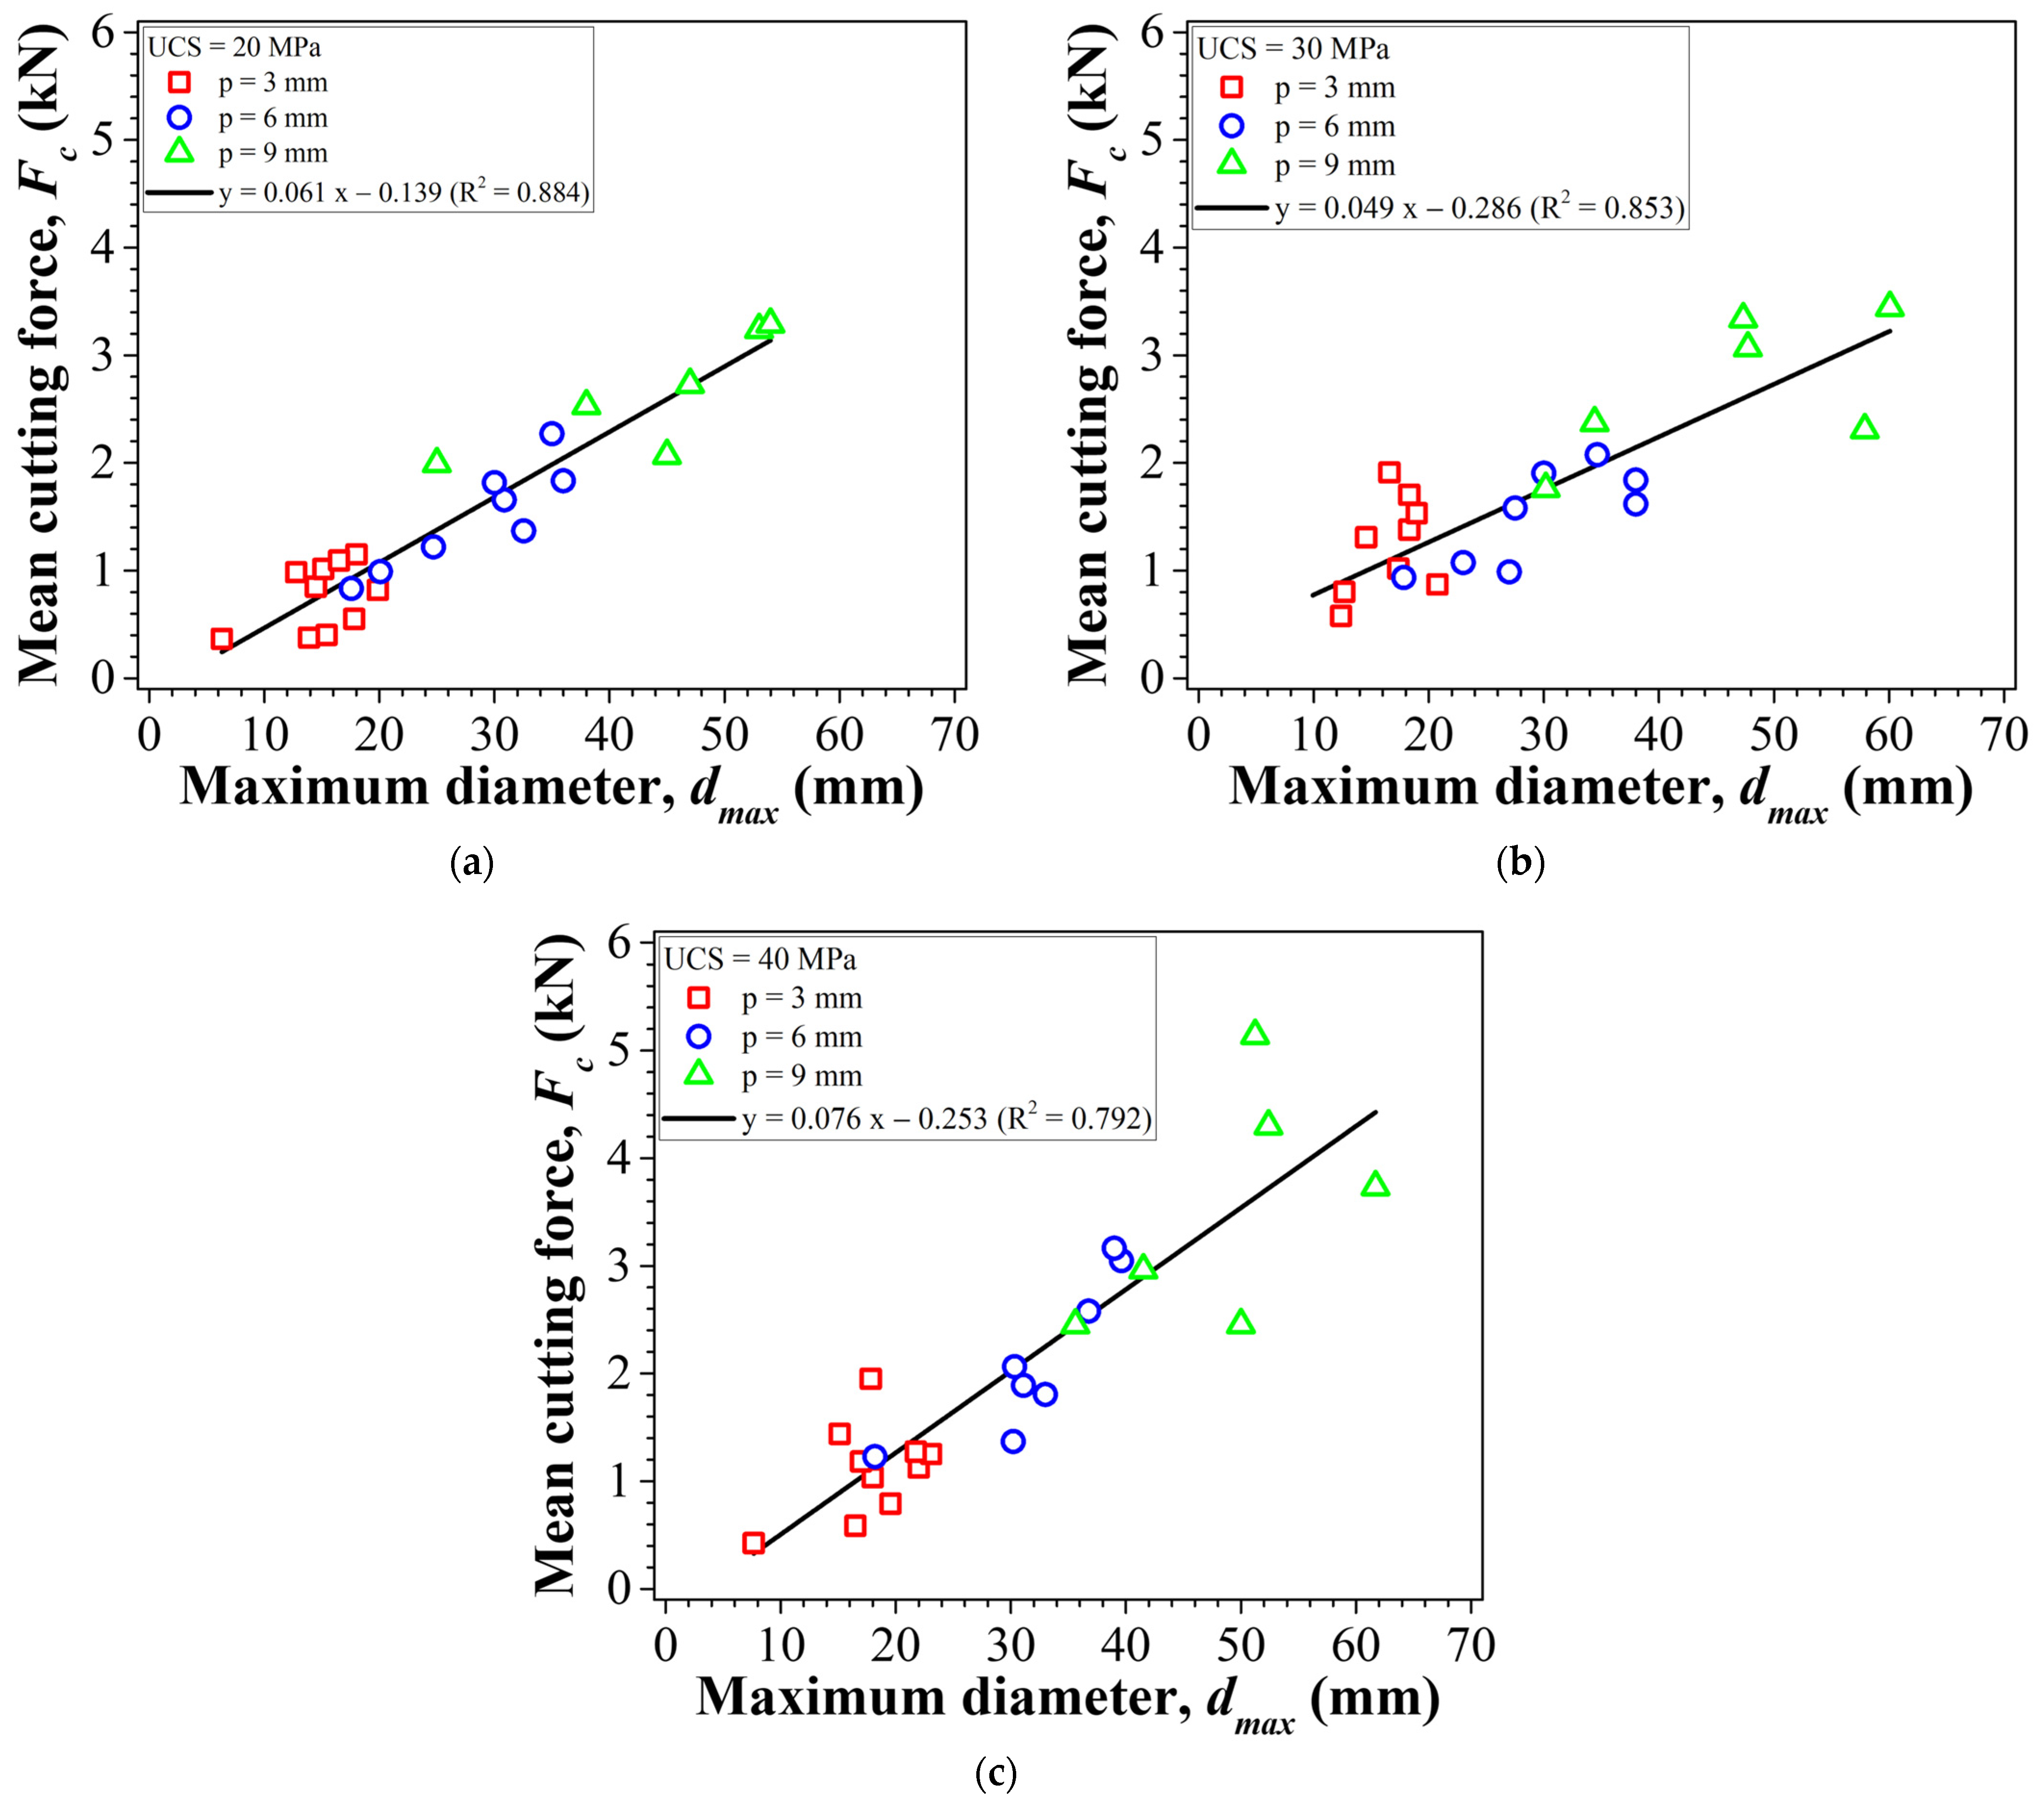
5.1. Correlation with Cutting Force

The cutting force is an important factor in determining the SE. Similar to the CI and particle size parameters, this variable increases as the penetration depth and spacing increase [2]. In this context, the relationship between CI and mean cutting force (Fc) and the relationship between dmax and mean cutting force were comparatively analyzed. The mean cutting forces for each cutting condition are listed in Table 6.
Figure 11 and Figure 12 show the relationship between the mean cutting force and CI and between the mean cutting force and dmax, respectively. Both CI and dmax increased with an increase in the mean cutting force. CI formed an exponential function relationship with the mean cutting force, whereas dmax formed a linear relationship. In addition, the correlation with dmax (R2 > 0.79) was larger than that with CI (R2 < 0.79).
This difference occurred because the penetration depth and spacing limit the size of rock chips [9]. An increase in the cutting force up to a certain level increases the size of dmax, but when the size of dmax reaches its limiting value, the increase in the cutting force increases the amount of rock chips of the dmax size.

5.2. Correlation with Cutting Volume

The cutting volume (Vc) refers to the empty space generated during the cutting. The relationships between the cutting volume and CI and dmax are shown in Figure 13 and Figure 14, respectively. The CI and dmax formed an exponential relationship and a linear relationship with the cutting volume, respectively, which was similar to the relationship with the cutting force. This was expected, as the cutting force and cutting volume have a linear relationship [29]. The details of the cutting volume for each cutting condition are presented in Table 6.

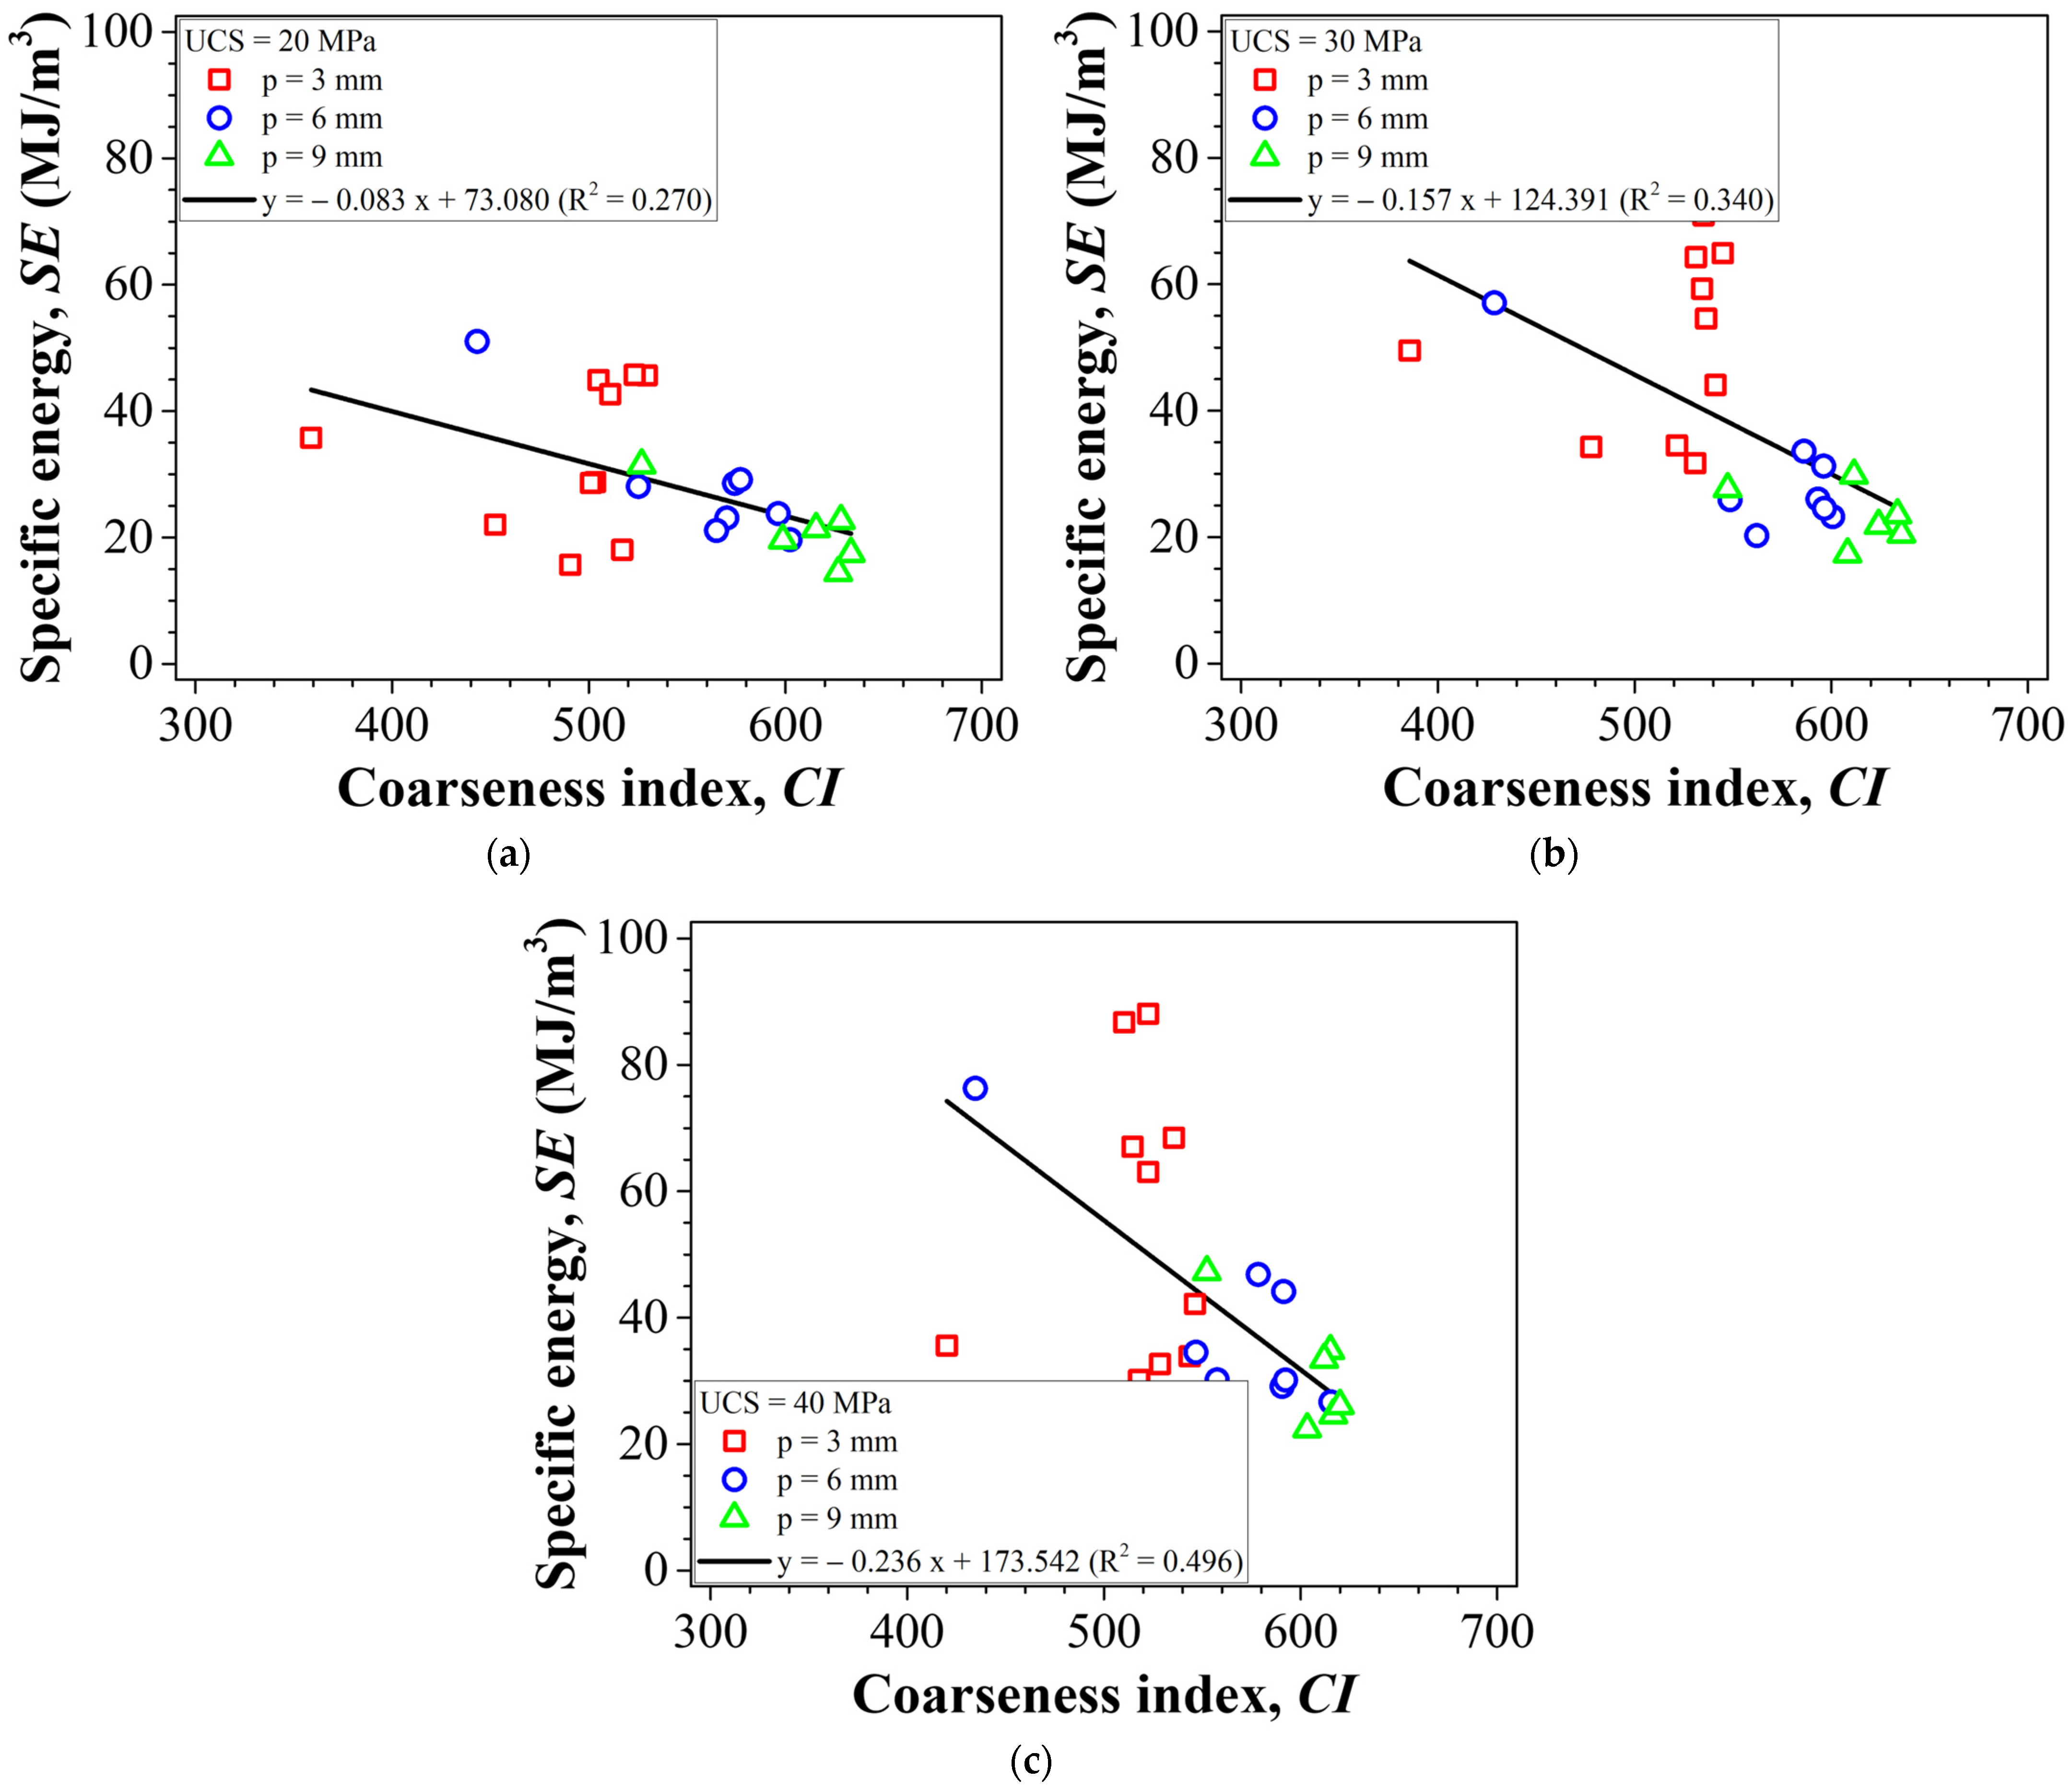
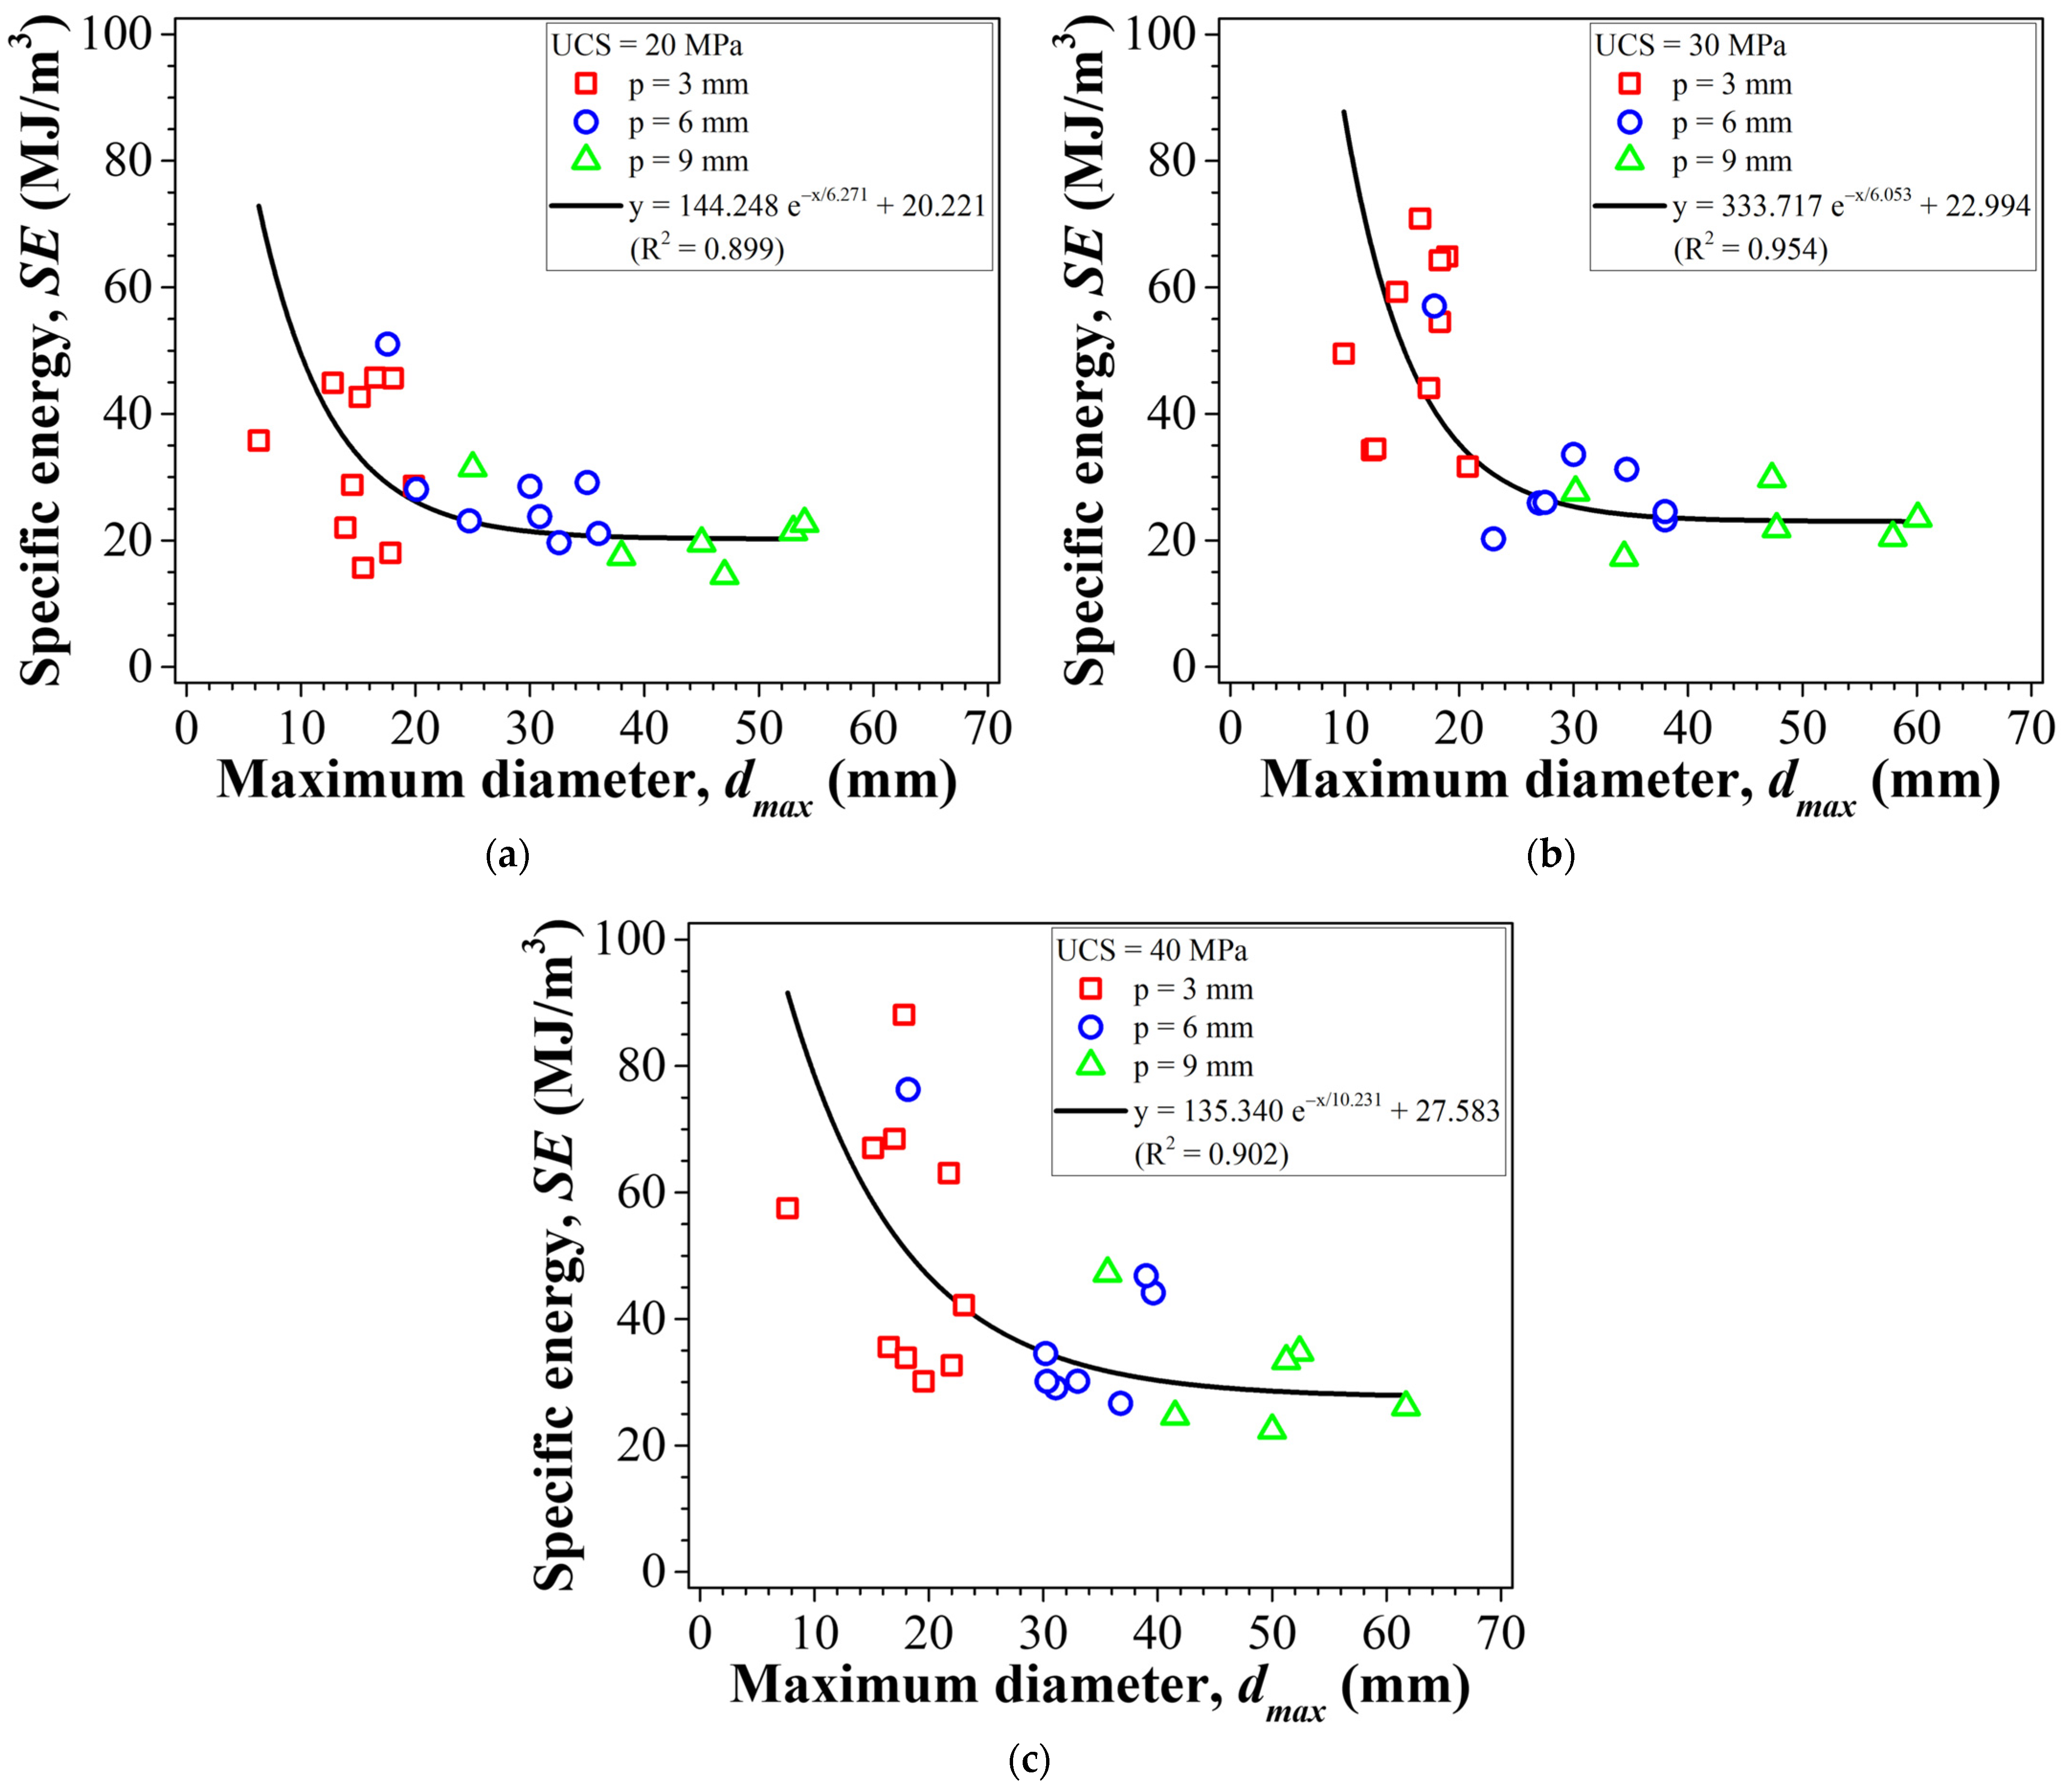
5.3. Correlation with Specific Energy

In general, SE and CI have an inverse relationship. Tuncdemir, et al. [14], Abu Bakar and Gertsch [15], and Wang, et al. [19] reported that the statistical relationship between SE and CI forms Equation (7) for all rock types and cutting tools:
S E = k · C I n
where k denotes a parameter related to rock strength and cutting tools and n denotes a parameter related to the cutting-tool type.
In Wang, et al. [19] and Abu Bakar and Gertsch [15], the relationship between SE and CI also formed Equation (7). In contrast, some studies have reported an inverse linear relationship [16,17,28,30]. Mohammadi, et al. [18] found that the relationship between SE and CI can be linear or nonlinear, depending on the type of rock. The relationship between SE and particle size parameters is similar to that between SE and CI. Regarding d′ as a representative example, Abu Bakar and Gertsch [15] and Wang, et al. [19] reported a nonlinear inverse relationship with SE, and Abu Bakar, et al. [16] and Haydari, et al. [28] reported an inverse linear relationship with SE.
Figure 15 shows the relationship between CI and SE obtained in this study. The SE decreased as the CI increased for all rock strengths. Although the correlation between them was relatively weak (R2 < 0.50), they had an inverse linear relationship. The relationship between dmax and SE is shown in Figure 16. For all rock strengths, dmax increased as SE decreased with an exponential relationship, and the correlation was strong (R2 > 0.89). Details of the SE with respect to cutting conditions are shown in Table 6.
In the relationship between dmax and SE, when dmax exceeded a specific size, SE converged to a constant value. In the rocks with a UCS of 20 MPa, when dmax was greater than approximately 25 mm, the SE was constant at approximately 20 MJ/m3 (Figure 16a). Even at rock strengths of 30 MPa and 40 MPa, when dmax was greater than 35 mm and 40 mm, the SE was constant at approximately 22 and 25 MJ/m3, respectively (Figure 16b,c).
In summary, predicting excavation efficiency using the change in CI can only result in predicting an increase or decrease in excavation efficiency, but dmax can be used to determine whether the SE is close to the minimum value.

6. Conclusions

This study attempted to confirm whether the diameter of the largest rock chip among rock fragments generated by mechanical excavation could serve as an index of excavation efficiency. The CI and maximum diameter (dmax) were obtained from rock fragments generated under various cutting conditions using a linear cutting test.
By comparing the relationship between CI and particle size parameters, such as median particle size (d50), mean particle size (dMPS), and absolute particle size (d′), and the relationship between dmax and CI, it was confirmed that dmax was sufficient to replace the other particle size parameters.
Changes in cutting conditions had similar effects on CI and dmax. An increase in penetration depth and spacing increased both CI and dmax, but CI had a power relationship and dmax had a linear relationship. Regarding the relationship between the ratio of spacing to penetration depth (s/p), CI and dmax increased until s/p reached a specific value. Subsequent increases in s/p did not significantly affect the CI and dmax.
The relationship with the cutting results was also similar for CI and dmax. The cutting force and cutting volume increased exponentially as CI increased. The dmax also increased, with a linear relationship. In the case of the SE, a linear inverse relationship was formed with CI, and an exponential inverse relationship was formed with dmax. When dmax became larger than a certain size, SE converged to a constant value. This result suggests that dmax can provide information regarding whether the SE reaches the minimum value.
Therefore, the results suggest that dmax can replace CI in determining the excavation efficiency and has an additional advantage. However, it should be noted that this study used a small-scale linear cutting machine and was an experiment using rock-like materials. Therefore, it is necessary to verify from further research on actual rocks using a full-scale linear cutting machine.

Author Contributions

H.-e.K. proposed the concept of the research and developed the study. K.-m.N. and H.R. contributed to the review of the final manuscript and made recommendations for paper revision. T.-s.K. conducted the experiments and provided suggestions. H.-k.Y. and H.R. supervised the research and provided important suggestions. All authors have read and agreed to the published version of the manuscript.

Funding

This work was supported by a National Research Foundation of Korea grant funded by the Korean Government (NRF-2019R1A2C2003636).

Institutional Review Board Statement

Not applicable.

Informed Consent Statement

Not applicable.

Data Availability Statement

Not applicable.

Conflicts of Interest

The authors declare no conflict of interest.

References

  1. Barker, J.S. A laboratory investigation of rock cutting using large picks. Int. J. Rock Mech. Min. Sci. 1964, 1, 519–534. [Google Scholar] [CrossRef]
  2. Roxborough, F.F.; Phillips, H.R. Rock excavation by disc cutter. Int. J. Rock Mech. Min. Sci. 1975, 12, 361–366. [Google Scholar] [CrossRef]
  3. Snowdon, R.A.; Ryley, M.D.; Temporal, J. A study of disc cutting in selected British rocks. Int. J. Rock Mech. Min. Sci. 1982, 19, 107–121. [Google Scholar] [CrossRef]
  4. Yasar, S.; Yilmaz, A.O. Drag pick cutting tests: A comparison between experimental and theoretical results. J. Rock Mech. Geotech. Eng. 2018, 10, 893–906. [Google Scholar] [CrossRef]
  5. Bilgin, N.; Demircin, M.A.; Copur, H.; Balci, C.; Tuncdemir, H.; Akcin, N. Dominant rock properties affecting the performance of conical picks and the comparison of some experimental and theoretical results. Int. J. Rock Mech. Min. 2006, 43, 139–156. [Google Scholar] [CrossRef]
  6. Gertsch, R.; Gertsch, L.; Rostami, J. Disc cutting tests in Colorado Red Granite: Implications for TBM performance prediction. Int. J. Rock Mech. Min. 2007, 44, 238–246. [Google Scholar] [CrossRef]
  7. Balci, C.; Bilgin, N. Correlative study of linear small and full-scale rock cutting tests to select mechanized excavation machines. Int. J. Rock Mech. Min. 2007, 44, 468–476. [Google Scholar] [CrossRef]
  8. Hughes, H.M. Some Aspects of Rock Machining. Int. J. Rock Mech. Min. 1972, 9, 205–211. [Google Scholar] [CrossRef]
  9. Rånman, K.E. A model describing rock cutting with conical picks. Rock Mech. Rock Eng. 1985, 18, 131–140. [Google Scholar] [CrossRef]
  10. Gong, Q.M.; Zhao, J.; Jiang, Y.S. In situ TBM penetration tests and rock mass boreability analysis in hard rock tunnels. Tunn. Undergr. Space Tech. 2007, 22, 303–316. [Google Scholar] [CrossRef]
  11. Yang, W.; Xue, Y.; Zhang, X. Experimental study on rock fragmentation by the 19-inch TBM cutter and statistical analysis of debris. In Proceedings of the ISRM International Symposium—8th Asian Rock Mechanics Symposium, ARMS 2014, Sapporo, Japan, 14–16 October 2014; pp. 1028–1037. [Google Scholar]
  12. Geng, Q.; Wei, Z.Y.; Meng, H. An experimental research on the rock cutting process of the gage cutters for rock tunnel boring machine (TBM). Tunn. Undergr. Space Tech. 2016, 52, 182–191. [Google Scholar] [CrossRef]
  13. Roxborough, F.F.; King, P.; Pedroncelli, E.J. Tests on the Cutting Performance of a Continuous Miner. J. S. Afr. Inst. Min. Metall. 1981, 81, 9–25. [Google Scholar]
  14. Tuncdemir, H.; Bilgin, N.; Copur, H.; Balci, C. Control of rock cutting efficiency by muck size. Int. J. Rock Mech. Min. 2008, 45, 278–288. [Google Scholar] [CrossRef]
  15. Abu Bakar, M.Z.; Gertsch, L.S. Evaluation of saturation effects on drag pick cutting of a brittle sandstone from full scale linear cutting tests. Tunn. Undergr. Space Tech. 2013, 34, 124–134. [Google Scholar] [CrossRef]
  16. Abu Bakar, M.Z.; Gertsch, L.S.; Rostami, J. Evaluation of fragments from disc cutting of dry and saturated sandstone. Rock Mech. Rock Eng. 2014, 47, 1891–1903. [Google Scholar] [CrossRef]
  17. Jeong, H.; Jeon, S. Characteristic of size distribution of rock chip produced by rock cutting with a pick cutter. Geomech. Eng. 2018, 15, 811–822. [Google Scholar] [CrossRef]
  18. Mohammadi, M.; Hamidi, J.K.; Rostami, J.; Goshtasbi, K. A Closer Look into Chip Shape/Size and Efficiency of Rock Cutting with a Simple Chisel Pick: A Laboratory Scale Investigation. Rock Mech. Rock Eng. 2020, 53, 1375–1392. [Google Scholar] [CrossRef]
  19. Wang, X.; Su, O.; Wang, Q.F. Distribution characteristics of rock chips under relieved and unrelieved cutting conditions. Int. J. Rock Mech. Min. 2022, 151, 105048. [Google Scholar] [CrossRef]
  20. Aresh, B.; Khan, F.N.; Haider, J. Experimental investigation and numerical simulation of chip formation mechanisms in cutting rock-like materials. J. Pet. Sci. Eng. 2022, 209, 109869. [Google Scholar] [CrossRef]
  21. Zhang, X.; Li, J.; Xia, Y.; Lin, L.; Li, M.; Chen, L. Cutting characteristics and layout of pre-cutting machine cutter. Period. Polytech. Civ. Eng. 2020, 64, 188–197. [Google Scholar] [CrossRef]
  22. Copur, H.; Bilgin, N.; Balci, C.; Tumac, D.; Avunduk, E. Effects of Different Cutting Patterns and Experimental Conditions on the Performance of a Conical Drag Tool. Rock Mech. Rock Eng. 2017, 50, 1585–1609. [Google Scholar] [CrossRef]
  23. Cho, J.W.; Jeon, S.; Jeong, H.Y.; Chang, S.H. Evaluation of cutting efficiency during TBM disc cutter excavation within a Korean granitic rock using linear-cutting-machine testing and photogrammetric measurement. Tunn. Undergr. Space Tech. 2013, 35, 37–54. [Google Scholar] [CrossRef]
  24. Pan, Y.; Liu, Q.; Liu, J.; Liu, Q.; Kong, X. Full-scale linear cutting tests in Chongqing Sandstone to study the influence of confining stress on rock cutting efficiency by TBM disc cutter. Tunn. Undergr. Space Tech. 2018, 80, 197–210. [Google Scholar] [CrossRef]
  25. Bilgin, N.; Copur, H.; Balci, C. Effect of replacing disc cutters with chisel tools on performance of a TBM in difficult ground conditions. Tunn. Undergr. Space Tech. 2012, 27, 41–51. [Google Scholar] [CrossRef]
  26. Altindag, R. Estimation of penetration rate in percussive drilling by means of coarseness index and mean particle size. Rock Mech. Rock Eng. 2003, 36, 323–332. [Google Scholar] [CrossRef]
  27. Krumbein, W.C. Size frequency distributions of sediments. J. Sediment. Res. 1934, 4, 65–77. [Google Scholar] [CrossRef]
  28. Heydari, S.; Khademi Hamidi, J.; Monjezi, M.; Eftekhari, A. An investigation of the relationship between muck geometry, TBM performance, and operational parameters: A case study in Golab II water transfer tunnel. Tunn. Undergr. Space Tech. 2019, 88, 73–86. [Google Scholar] [CrossRef]
  29. Kim, H.-E.; Nam, K.-M.; Kyeon, T.-S.; Rehman, H.; Yoo, H.-K. Analysis of the Effect of the Tool Shape on the Performance of Pre-Cutting Machines during Tunneling Using Linear Cutting Tests. Appl. Sci. 2022, 12, 4489. [Google Scholar] [CrossRef]
  30. Rispoli, A.; Ferrero, A.M.; Cardu, M.; Farinetti, A. Determining the Particle Size of Debris from a Tunnel Boring Machine Through Photographic Analysis and Comparison Between Excavation Performance and Rock Mass Properties. Rock Mech. Rock Eng. 2017, 50, 2805–2816. [Google Scholar] [CrossRef]
Figure 1. Variation in SE with (a) penetration depth and (b) spacing (reproduced with permission from Raf. [7]. 2007. Balci and Bilgin).
Applsci 12 08793 g001
Figure 2. (a) Overview of LCM; (b) load cells and cutting tool.
Applsci 12 08793 g002
Figure 3. Cutting tool used in the experiment: (a) specification; (b) appearance.
Applsci 12 08793 g003
Figure 4. Preconditioning of model rock and measurement section.
Applsci 12 08793 g004
Figure 5. Sieving machine and example of rock chips after sieving: (a) number and opening size of sieves; (b) example of rock chips classified by size range (p = 9 mm and s = 48 mm at UCS = 40 MPa).
Applsci 12 08793 g005
Figure 6. Relationship between CI and maximum diameter.
Applsci 12 08793 g006
Figure 7. Relationship between penetration depth and (a) CI; (b) maximum diameter.
Applsci 12 08793 g007
Figure 8. Relationship between spacing and (a) CI; (b) maximum diameter.
Applsci 12 08793 g008
Figure 9. Relationship between CI and s/p ratio: (a) rock of UCS 20 MPa; (b) rock of UCS 30 MPa; (c) rock of UCS 40 MPa.
Applsci 12 08793 g009aApplsci 12 08793 g009b
Figure 10. Relationship between maximum diameter and s/p ratio: (a) rock of UCS 20 MPa; (b) rock of UCS 30 MPa; (c) rock of UCS 40 MPa.
Applsci 12 08793 g010aApplsci 12 08793 g010b
Figure 11. Relationship between CI and mean cutting force: (a) rock of UCS 20 MPa; (b) rock of UCS 30 MPa; (c) rock of UCS 40 MPa.
Applsci 12 08793 g011
Figure 12. Relationship between maximum diameter and mean cutting force: (a) rock of UCS 20 MPa; (b) rock of UCS 30 MPa; (c) rock of UCS 40 MPa.
Applsci 12 08793 g012
Figure 13. Relationship between CI and cutting volume: (a) rock of UCS 20 MPa; (b) rock of UCS 30 MPa; (c) rock of UCS 40 MPa.
Applsci 12 08793 g013
Figure 14. Relationship between maximum diameter and cutting volume: (a) rock of UCS 20 MPa; (b) rock of UCS 30 MPa; (c) rock of UCS 40 MPa.
Applsci 12 08793 g014
Figure 15. Relationship between CI and SE: (a) rock of UCS 20 MPa; (b) rock of UCS 30 MPa; (c) rock of UCS 40 MPa.
Applsci 12 08793 g015
Figure 16. Relationship between maximum diameter and SE: (a) rock of UCS 20 MPa; (b) rock of UCS 30 MPa; (c) rock of UCS 40 MPa.
Applsci 12 08793 g016
Table 1. Physical and mechanical properties of model rocks.
Target Strength (MPa)Elastic Modulus (GPa)Density (kg/m3)Poisson’s RatioUCS (MPa)BTS (MPa)
2016.9222140.3182.06
3033.3523630.329.32.18
4038.9223820.3422.51
Table 2. Penetration depth and spacing used in cutting tests.
Penetration   Depth ,   p   ( mm ) Spacing ,   s   ( mm )
336912151821242730
648121620242832
981624324048
Table 3. Chip size distribution and maximum diameter for model rock of UCS 20 MPa.
p (mm)s (mm)s/pCumulative Probability (%)CIdmax (mm)
#4#10#20#40#60#100#200
3310.413.528.262.077.985.391.6358.96.3
6210.735.051.079.688.592.495.4452.513.9
9322.745.159.881.990.694.196.6490.715.4
12432.452.464.984.291.694.697.0517.117.8
15529.349.962.581.990.193.496.2503.314.5
18627.948.461.582.490.593.996.5501.219.9
21725.950.263.983.091.094.396.8505.012.8
24826.852.264.883.891.494.797.1510.915.1
27933.456.368.186.692.495.397.4529.518.0
301029.154.567.286.792.795.697.5523.416.5
640.6714.135.149.873.585.590.594.7443.317.6
81.3334.557.068.383.990.194.596.9525.320.1
12250.267.175.989.693.996.097.7570.324.7
162.6761.275.382.292.595.697.398.4602.432.6
203.3357.874.281.991.795.497.198.3596.430.9
24455.069.877.187.490.496.598.1574.230.0
284.6749.267.075.487.591.396.698.0565.036.0
325.3353.868.677.289.694.096.297.7577.235.0
980.8941.557.767.082.187.594.496.7527.025.0
161.7863.875.481.389.993.197.098.2598.745.0
242.6773.984.089.093.896.497.798.7633.438.0
323.5672.482.787.293.095.097.998.8626.947.0
404.4467.280.185.392.194.697.798.6615.753.0
485.3371.482.487.394.296.697.898.7628.354.0
p: Penetration depth, s: Spacing, CI: Coarseness index, dmax: Maximum diameter.
Table 4. Chip size distribution and maximum diameter for model rock of UCS 30 MPa.
p (mm)s (mm)s/pCumulative Probability (%)CIdmax (mm)
#4#10#20#40#60#100#200
3315.018.532.666.981.488.193.2385.79.9
6211.94257.383.391.594.997.1478.012.4
9328.354.467.485.692.995.497.6521.612.7
12434.555.267.786.293.595.997.9530.920.8
15532.759.372.188.294.396.498.2541.217.4
18630.156.869.788.894.496.598.0534.314.6
21732.158.571.187.393.795.997.8536.418.3
24832.460.573.889.094.496.598.2544.819.0
27929.157.269.487.993.796.197.8531.218.3
301032.656.869.388.294.096.497.8535.116.6
640.6710.232.048.472.683.388.793.6428.817.8
81.3343.161.972.786.992.394.996.8548.627.0
12249.665.874.888.192.194.697.2562.223.0
162.6759.273.381.490.794.696.397.8593.327.5
203.3361.674.282.291.795.597.298.3600.738.0
24458.274.282.591.595.296.898.1596.538.0
284.6752.871.780.791.594.796.898.0586.230.0
325.3360.574.380.890.595.096.898.2596.134.7
980.8942.460.370.587.793.395.797.4547.330.2
161.7862.776.383.193.396.497.898.7608.334.4
242.6772.883.688.695.297.798.599.2635.657.9
323.5668.980.986.493.997.098.198.9624.147.7
404.4471.383.488.395.497.698.599.1633.660.1
485.3363.977.583.593.496.597.998.8611.547.3
p: Penetration depth, s: Spacing, CI: Coarseness index, dmax: Maximum diameter.
Table 5. Chip size distribution and maximum diameter for model rock of UCS 40 MPa.
p (mm)s (mm)s/pCumulative Probability (%)CIdmax (mm)
#4#10#20#40#60#100#200
3316.928.442.873.284.690.493.9420.27.7
6224.953.367.086.893.095.697.3517.916.5
9336.760.572.287.993.195.897.5543.719.6
12432.955.667.486.192.596.198.0528.618.0
15537.861.971.286.893.996.598.3546.422.0
18639.257.968.385.791.695.397.6535.623.1
21733.653.465.485.491.795.397.8522.517.0
24834.652.464.381.890.394.297.2514.621.8
27934.554.566.583.591.394.897.4522.515.1
301031.551.863.283.090.094.296.7510.417.8
640.6713.033.548.772.083.689.694.3434.718.2
81.3348.064.172.784.890.092.594.7546.830.2
12249.464.674.487.791.693.296.8557.733.0
162.6758.772.479.590.594.596.898.3590.731.1
203.3358.073.180.191.094.897.098.4592.430.3
24468.578.984.492.195.797.398.6615.536.8
284.6761.172.379.389.594.396.698.3591.439.6
325.3356.569.476.888.893.495.997.7578.539.0
980.8945.662.872.486.992.295.297.3552.435.6
161.7862.676.582.591.595.097.098.3603.450.0
242.6766.380.185.493.095.897.598.6616.741.5
323.5669.680.785.693.095.797.298.2620.061.7
404.4467.179.384.492.695.797.598.6615.252.4
485.3365.878.784.291.795.797.498.5612.051.2
p: Penetration depth, s: Spacing, CI: Coarseness index, dmax: Maximum diameter.
Table 6. Mean cutting force, cutting volume, and SE for various cutting conditions.
p (mm)s (mm)s/pUCS (MPa)
203040
Fc
(kN)
Vc
(mm3)
SE
(MJ/m3)
Fc
(kN)
Vc
(mm3)
SE
(MJ/m3)
Fc
(kN)
Vc
(mm3)
SE
(MJ/m3)
3310.36183435.80.39142349.50.42133057.5
620.38309022.00.58304734.30.59296935.6
930.40460715.70.80418134.50.79472430.1
1240.55549418.00.87494931.71.04550833.9
1550.85531628.81.02415444.11.13621332.7
1860.82515828.61.31397659.31.25534142.2
2170.98394644.91.38454954.61.18310868.5
2481.01428142.71.53425264.91.27363463.1
2791.15453745.61.70477364.31.44386167.1
30101.09430445.71.91485170.91.95398788.1
640.670.83294251.00.94295257.11.23289876.3
81.330.99634828.10.99686125.91.37713434.5
1221.22950823.11.07954220.21.8110,78030.2
162.671.3712,54019.71.5810,94326.01.8911,68629.1
203.331.6612,54623.81.6212,53123.22.0612,33630.1
2441.8211,45628.51.8413,50124.62.5817,42926.6
284.671.8315,65421.11.9010,20033.63.0512,42944.1
325.332.2714,01229.22.0810,15331.23.1612,16146.8
980.891.991139431.51.7615,44127.62.45934047.2
161.782.0719,00219.62.3723,95817.32.4519,71822.4
242.672.5326,06317.52.3126,97120.52.9621,66824.6
323.562.7333,98414.53.0728,38721.83.7325,76726.1
404.443.2427,23521.43.4425,56523.54.3022,26134.8
485.333.2926,09822.73.3420,18229.85.1427,70533.4
p: Penetration depth, s: Spacing, UCS: Uniaxial compressive strength, Fc: Mean cutting force, Vc: Cutting volume, SE: Specific energy.
Publisher’s Note: MDPI stays neutral with regard to jurisdictional claims in published maps and institutional affiliations.

