Article

Bounding the Likelihood of Exceeding Ward Capacity in Stochastic Surgery Scheduling

by
Asgeir Orn Sigurpalsson
*,
Thomas Philip Runarsson
and
Rognvaldur Johann Saemundsson
Department of Industrial Engineering, University of Iceland, Saemundargata 2, 102 Reykjavik, Iceland
*
Author to whom correspondence should be addressed.
Appl. Sci. 2022, 12(17), 8577; https://doi.org/10.3390/app12178577
Submission received: 5 July 2022 / Revised: 20 August 2022 / Accepted: 22 August 2022 / Published: 27 August 2022
(This article belongs to the Section Computing and Artificial Intelligence)

Abstract

:
The stochastic high-patient-throughput surgery scheduling problem under a limited number of staffed ward beds is addressed in this paper. This work proposes a novel way to minimize the risk of last-minute cancellations by bounding the likelihood of exceeding the staffed ward beds. Given historical data, it is possible to determine an empirical distribution for the length of stay in the ward. Then, for any given combinations of patients, one can estimate the likelihood of exceeding the number of staffed ward beds using Monte Carlo sampling. As these ward patient combinations grow exponentially, an alternative, more efficient, worst-case robust ward optimization model is compared. An extensive data set was collected from the National University Hospital of Iceland for computational experiments, and the models were compared with actual scheduling data. The models proposed achieve high quality solutions in terms of overtime and risk of overflow in the ward.

1. Introduction

Today, hospital managers seek ways to maximize the use of existing resources in response to aging populations and increasing cost of care. In this respect, operating rooms (ORs) have received considerable attention. They are both an expensive resource and a significant source of income [1,2]. However, patient flow from ORs is constrained by downstream resources, such as intensive care units (ICU) [3], the post-anesthesia care unit (PACU) [4] and wards [5,6]. To achieve increased OR utilization, surgeries need to be scheduled in such a way as to maximize throughput and to avoid last-minute cancellations due to overtime or downstream bottlenecks. This is a challenging task due to the stochastic nature of patient arrivals [7], surgery times [8,9], length of stay [3,10], and the competing objectives of different stakeholders in the surgery process [11,12] that create artificial variability for elective surgeries [13].
In practice, surgery scheduling is commonly divided into three distinct decision levels: strategic, tactical, and operational [14,15]. The first decision level is the strategic level. At this level, decisions are made about the overall surgical capacity, including ORs and equipment. These decisions are long-term, i.e., they affect the scheduling for at least a year [14]. The second decision level is the tactical level, where a cyclic master surgical schedule (MSS) is decided. The MSS specifies the allocation of available OR time to surgical specialties and/or operators for each day and room [15]. This strategy is referred to as block scheduling. An open operating room is here referred to as a block, and the opening hours are referred to as block length. Moreover, these schedules may also refer to finding an ideal mix of surgical procedures [16,17,18,19,20]. Tactical decisions are medium-term, i.e., they are usually made months in advance. Finally, at the operational level, patients waiting for elective surgeries are scheduled to blocks and times based on the MSS [21]. These decisions are short-term, i.e., they are usually made at least one week in advance. Commonly, a distinction is made between assigning patients to a block and sequencing patients within a block [22,23], even if both may be done at the same time [24]. Addressing the stochastic and integrative nature of the surgery process is important for implementing surgery scheduling systems in practice. In this paper, we focus on the assignment of elective surgeries at the operational level, taking into account uncertainties in both surgery times and length of stay (LOS) in the ward. Sequencing within blocks is not considered. Recent literature reviews [15,21,25,26,27] give a general overview of the vast literature on surgery scheduling.
Studies addressing uncertainties in both surgery times and LOS either use stochastic programming [3,10,28] or robust optimization [2,29]. In stochastic programming (SP), scenarios are used to represent uncertainty for surgery times and LOS in the downstream resources [3]. In this case, expected values such as overtime and ward numbers are minimized, guaranteeing good performance on average. The constraints are soft in this case. In robust optimization (RO), constraints are dealt with in a hard manner, leading to conservative solutions. Robust optimization (RO) uses uncertainty sets to guarantee feasibility towards the worst-case outcome based on the selected level of robustness [2,29]. For example, uncertainty sets are created to represent the uncertainty for surgery times and LOS. RO is also an alternative to SP when distributions of stochastic factors are hard to identify [2]. Alternatively, distributional RO is an intermediate approach between SP and the RO, where the worst-case distribution is chosen [30].
The focus of this work is to minimize the likelihood of exceeding the limited number of staffed ward beds for a high-patient-throughput surgery schedule while minimizing the number of ORs resulting in overtime in the planning horizon. Using historical data for specific surgery types, empirical distributions for the LOS can be determined. Then, for any given ward combination of patients, with their different probabilities of stay, the likelihood of exceeding the number of staffed ward beds may be estimated using Monte Carlo sampling. Unlike previous studies [2,29], our approach uses Monte Carlo sampling to verify ward feasibility. The approach proposed is different from both SP and RO, as our model will be explicitly based on looking at all possible patient ward combinations and avoiding those exceeding the staffed ward beds within a specified probability. To the best of our knowledge, resolving uncertainty in LOS with ward combinations has not been attempted before. This enables us to bound the risk of exceeding the number of staffed ward beds using an MIP model while also bounding the risk of overtime. Our approach is not unlike the hard approach taken by RO; however, we do not hedge against the worst case. As a result, we expect to achieve, for the same patient throughput, less overtime for the surgeries. We compare this model with actual scheduling data. Furthermore, we compare the formulation with robust formulation, which hedges against the worst case outcome and requires less computational time.
The paper is organized as follows. In the next section, the general problem is stated, followed by the development of the model to solve the problem in two steps. In the experimental section, results from the different models are compared with actual scheduling data. Furthermore, different parameter settings for the proposed models are also studied. The paper concludes with a discussion of the main results.

2. Model Development

The general problem is scheduling a high throughput of in- and out-patient surgeries over a certain time period to minimize the OR overtime while bounding the likelihood of exceeding the limited downstream ward bed capacity. Patient priorities are included in the model as hard constraints, i.e., if a patient requires scheduling within one week, it will be done. We do not consider optimizing the flow of the emergency arrivals as they are treated in a separate flow, in downtime and after hours. Further, we do not consider optimizing the total number of patients scheduled since this requires discriminating between patients and should be the responsibility of the hospital. If the ward beds and ORs are underutilized, the hospital can add more patients to the list of patients to be scheduled.
In order to solve the problem, we propose a novel two step approach as follows:
  • Operating Room Day Schedule Generation: An operating room day schedule (ORDS) is a list of patients to be operated on in a particular day by a given operator. We start by extracting all patients belonging to a specific operator. Next, we consider all combinations of these patients subject to practical considerations (e.g., only one ICU patient) and different block lengths. Using Monte Carlo sampling, with historical data for surgery times needed for a given surgery type, we eliminate ORDS that exceed the block length limit with probability δ .
  • Ward Combinations Optimization: Given a fixed number of staffed ward beds, we consider all combinations of patient numbers n k with the discretized probability of stay p k for k | K | , where the probability of stay is discretized into | K | groups and dependent on the type of surgery performed on the patient. Each such combination is then eliminated if the total patient number exceeds the number of staffed ward beds by a probability Ω . This is computed using Monte Carlo sampling. Given the set of feasible ORDS and ward combinations, a deterministic mixed-integer programming (MIP) model is solved using a commercial solver. This is followed by a verification of the solution by Monte Carlo sampling using the complete, undiscretized, empirical distribution for the LOS in the ward.
Both steps will now be described in more detail in Section 2.1 and Section 2.2. The second step is then reformulated using a robust formulation described in Section 2.3. The notations used by our models are defined in Appendix A.

2.1. Operating Room Day Schedule Generation

For a given MSS, we assume that each surgical specialty is assigned one or more ORs r R on each day d D for the planning horizon D, where the available surgery time for each block is given the capacity parameter C d , r . Note that C d , r can be of any size, and different values can be specified for each block. These values are determined by the hospital. Further, we assume that the surgical specialties allocate their blocks to its operators where each operator has at least one assignment in D per week. A patient i I then belongs to an operator’s list of patients ( I o ) and can be assigned to one of the operator’s blocks.
For each operator’s block, we generate a set of feasible ORDS of patients to be scheduled. The feasibility of the ORDS is determined, on the one hand, by practical rules set by the hospital and, on the other hand, by limits on overtime. The ORDS are all feasible combinations of patients within the operator’s waiting list. The number of combinations will grow exponentially. However, in real life, hospitals have a diverse set of practical rules [29,31,32] that determine which ORDS are permitted. The application of these rules significantly reduces the number of feasible combinations. Here, we make use of two rules. First, we pose an upper bound on the number of patients assigned to an ORDS. Second, we pose an upper bound on the number of ICU patients assigned to an ORDS. However, these ORDS may not be feasible towards restrictions on overtime and are eliminated using Monte Carlo sampling.
Let M P be the maximum number of surgeries assigned to an ORDS and z i , p be a binary decision variable taking the value 1 if patient i is assigned to ORDS p; otherwise, it is 0. Then, one may pose an upper limit on the number of patients assigned to an ORDS using the following constraint:
i I o z i , p M P ,   p P ,   o O
Second, one may pose an upper bound on the number of ICU patients ( M I C U ) for each ORDS by
i I o g i z i , p M I C U ,   p P ,   o O
where g i is a binary parameter taking the value 1 if patient i requires ICU admission; otherwise, it is 0. It is assumed that a patient’s need for ICU admission is known in advance.
As the block length of each block ( C d , r ) is finite and surgery duration differs significantly across surgical types, only a subset of ORDS is feasible. That is to say, a set of patients is considered a feasible ORDS p when the probability of exceeding C d , r is no more than δ ; that is,
Pr [ i I o S ( i ) z i , p C d , r ] δ ,   p P ,   o O ,   r R ,   d D
where S ( i ) is a random variable denoting the surgery duration of patient i, including overhead such as preparation and cleaning. Note that only unique values for C d , r need to be considered. To make sure that all patients can be assigned to at least one ORDS, an exception to this rule must be given to single surgeries. This is important since some surgeries may span the entire block and exceed the limit of δ .
When generating the ORDS, a limit ( δ ) is set on the probability that the sum of surgery duration in an ORDS surpasses the available surgery time C d , r as posed by constraint (3). For each ORDS, the expected value of this probability is calculated for regular overtime δ p and extended overtime δ p Δ , as
δ p = Pr [ i I o S ( i ) z i , p C d , r ] , δ p Δ = Pr [ i I o S ( i ) z i , p C d , r + Δ d , r ] , p P ,   o O ,   r R ,   d D
where Δ d , r is the time added to extend the block length. Our MIP model uses these values to estimate the number of days resulting in regular and extended overtime along with the set of feasible ORDS P.

2.2. Ward Combination Optimization

From historical data, for the different surgery types, it is possible to estimate the probability that a specific patient is in the ward on any given day. If one discretizes these probabilities ( ρ k ) and counts ( n k ) how many within each bin or class interval k, then it is possible to approximate the number of patients in the ward by the sum of binomial distributions, or
W ( l ) k K B n k ( l ) , ρ k , l L
where l is an index to a particular combination of patient numbers in each interval class, defined by
l = k K n k | A | | K | k + 1
which is a base- | A | encoding where A = { 0 , , M A 1 } is a set of available staffed ward beds and K { 2 , , | K | 1 } .
Indeed, the number of such combinations will grow exponentially in terms of the number of staffed ward beds and the number of class intervals. However, not all are feasible since those that exceed the number of available staffed ward beds with probability Ω can be disregarded. That is, the feasibility of patients in ward combination l for a given number of available staffed ward beds a must satisfy
Pr [ W ( l ) a ] Ω , l L , a A
Monte Carlo sampling can be used to verify each combination resulting in a binary parameter F l , a , denoting its feasibility. This parameter is utilized by a constraint in our model to bound the likelihood of exceeding the staffed ward beds.
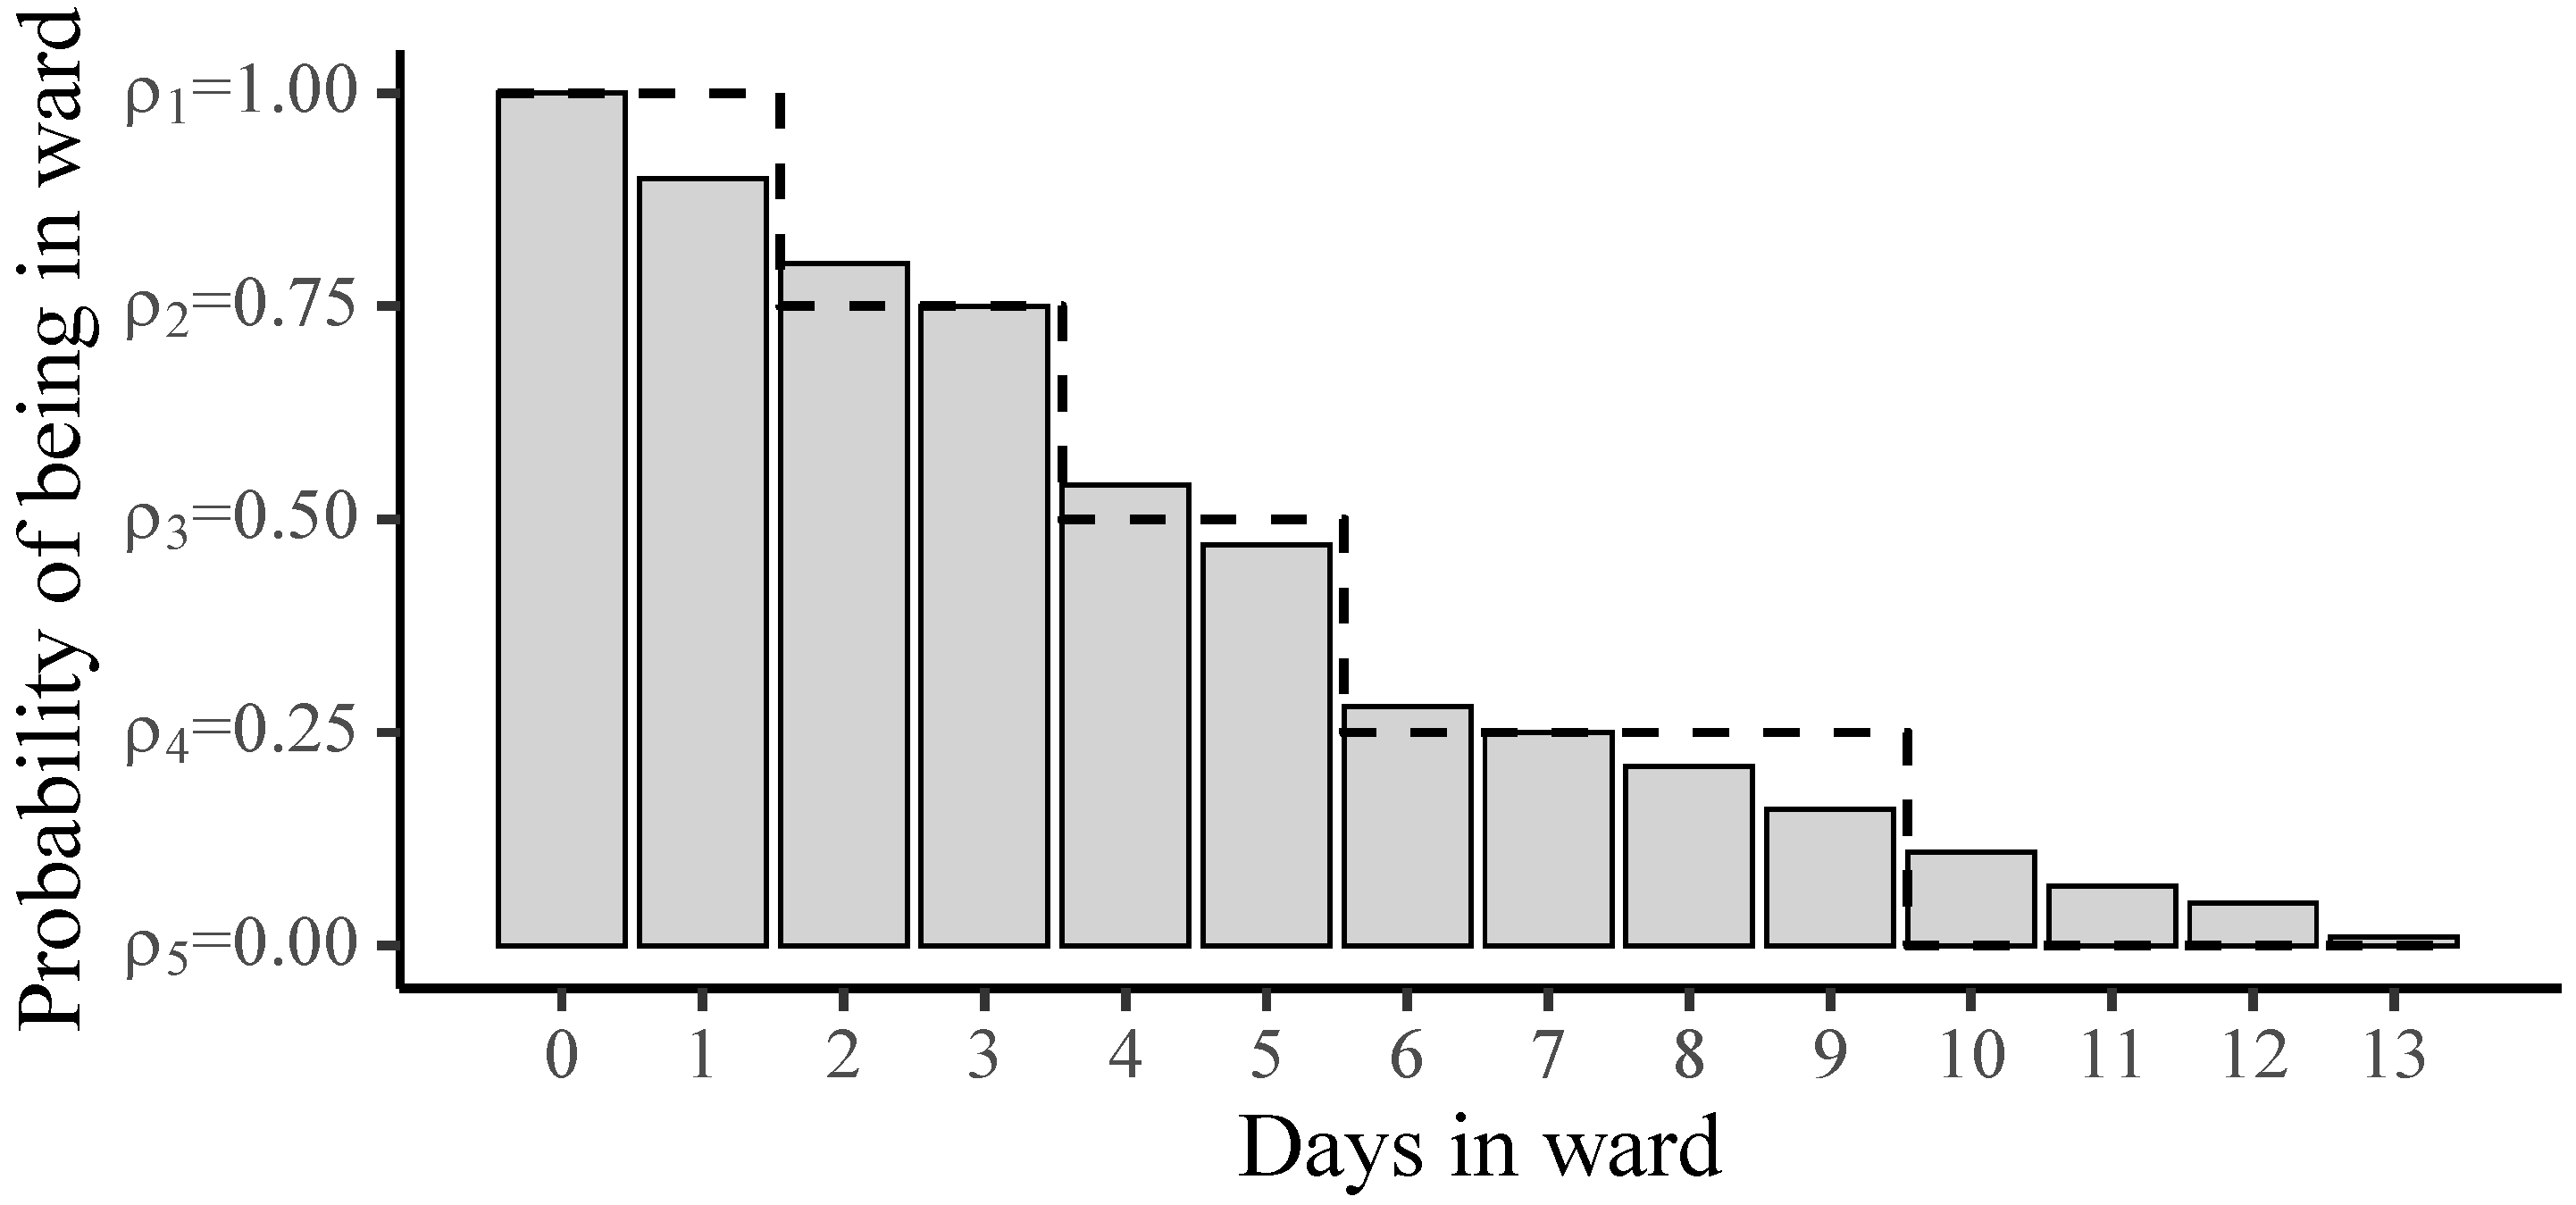
In Figure 1, one can see how a distribution for an arbitrary surgery type has been discretized to 5 levels, as illustrated by the dashed line. In this example, the discretization assumes that for the day of the surgery and the day after (0 and 1), the patient will be in the ward with probability ρ 1 = 1 . After the ninth day, the patient has left the ward and the probability is ρ 5 = 0 . We are only interested in the levels between the first and the last, which is, in this example, k K = { 2 , , 5 1 } . The number of patients in the first level ( n 1 ) are used to calculate the number of available staffed ward beds a = M A n 1 , where M A is the total number of staffed ward beds.
Once all feasible ORDS and ward combinations have been generated, the scheduling problem is reduced to allocating ORDS to days and rooms subject to the feasibility of the resulting ward combination. Let us introduce a binary decision variable x d , p , r taking the value 1 if an ORDS p is assigned on day d D and room r R . There are, however, a number of restrictions on which ORDS can be assigned to any given day. These usually center around the availability of the operators and the patients. Additionally, the ORDS’s feasibility depends on the OR’s capacity for that day, C d , r . As a result, the reduced set ( d , p , r ) D P R D × P × R is generated taking the following restrictions into account:
  • The availability of the operators for a given day,
  • The patients’ availability and priority,
  • ORDS feasibility for a given day and room, dependent on C d , r and Δ d , r .
Patient priorities are implemented in practice as a strict number of days that patients can be on the waiting list.
As each ORDS spans the whole day, only one ORDS can be assigned to a room and a day,
p P , r R : ( d , p , r ) D P R x d , p , r 1 , d D
Similarly, any patient i can only be scheduled once,
( d , p , r ) D P R : i I p x d , p , r = 1 , i I
where I p is the set of patients included in ORDS p. It is assumed that all patients must be scheduled, so the throughput is fixed. Additionally, each operator is only permitted to work according to a single ORDS per day,
p P o , r R : ( d , p , r ) D P R x d , p , r 1 , d D , o O
where P o P are the ORDS containing the patients of operator o. Finally, we assume a quota system for ICU admission as proposed by [31]; that is to say, for each day, no more than M ¯ I C U patients can be admitted to the ICU,
p P , r R : ( d , p , r ) D P R n p I C U x d , p , r M ¯ I C U d D
where n p I C U denotes the number of ICU patients in ORDS p.
Given a schedule defined by the decision variables x d , p , r , a constraint is posed to bound the likelihood of exceeding the staffed ward beds by a given probability. This is important as exceeding the staffed ward beds may result in cancellations. To start with, one must establish the daily availability of the staffed ward beds for any given surgery schedule. For each schedule, the number of patients that will occupy a ward bed with 100% certainty ( ρ 1 = 1.00 ) is assumed to be known for any given day. The number of staffed wards beds that are available each day ( a d ) can be calculated as follows:
a d = M A ( n ¯ d , 1 + r R , p P , j { 0 , 1 , , M W 1 } : ( d j , p , r ) D P R Q j , 1 , p x d j , p , r ) , d D
where M W is the upper bound on LOS in the ward. The parameter n ¯ d , 1 denotes the number of patients still in the ward from previous weeks (prior to the start of our planning horizon) with 100% ( ρ 1 = 1.00 ) certainty of occupying a staffed ward bed on the day j. This evaluation may be carried out with a Monte Carlo sampling using the previous week’s known schedule. The parameter Q j , 1 , p denotes the number of ward patients on the day j after a surgery, belonging to ORDS p, with ρ 1 = 1.00 , or a 100% chance of being in the ward that day. By multiplying the decision variable x d j , p , r by this parameter for each day, we can calculate the total number of patients within each scheduled ORDS that are in the ward on the day d after their surgery, conducted on the day d j . The daily availability of staffed ward beds is bounded by the maximum number of staffed ward beds ( M A ), so
a d M A d D
The number of patients ( n d , k ) with the probability ρ k , where k K , of being in the ward at given day d may be calculated as follows:
n d , k = n ¯ d , k + r R , p P , j { 0 , 1 , , M W 1 } : ( d j , p , r ) D P R Q j , k , p x d j , p , r , d D , k K
where Q j , k , p denotes the number of patients in ward with probability ρ k on the day j after the surgery belonging to ORDS p. n ¯ d , k is number of patients from the previous planning period with the probability of ρ k of occupying the staffed ward beds on day d.
As a final step in bounding the likelihood of exceeding the staffed ward beds that are available, one must make sure that the combination of ward admission probabilities, associated with the schedule defined by the decision variables x d , p , r , is feasible. That means connecting the available staffed ward beds each day a d , the number of patients n d , k , with the probability ρ k of being in the ward at a given day and the set of feasible ward combinations specified by F l , a . We may now introduce the binary decision variable y d , l that takes the value 1 if ward combination l is realized on day d; otherwise, it is 0. There can be only one ward combination realized each day
l L y d , l = 1 , d D
In order to discover which ward combination resulted from the scheduled ORDS, a base- | A | decoder is constructed in the form of the following constraint:
l L l y d , l = k K n d , k | A | | K | k + 1 , d D
This constraint may be thought of as searching for a specific row in a table. The right-hand side decodes the combinations of n d , k into a specific row number, which corresponds to the settings of ward combination l.
To make the connection from a certain ward combination to the available staffed ward beds each day, a binary variable z d , a is introduced, taking the value 1 if on the day d D there are a A staffed ward beds available; otherwise, it is 0. This variable is linked to the actual number of available staffed ward beds using the following constraint:
a A a z d , a = a d , d D
where z d , a can only take one value each day
a A z d , a = 1 , d D
Now, one can force the selection of a feasible ward combinations as follows:
y d , l a A F l , a z d , a , d D , l L
where F l , a is a binary parameter value taking the value 1 if a ward combination l is feasible with respect to the risk of ward overflow specified by Ω ; otherwise, it is 0 for a given number of available staffed ward beds a A . As explained at the start of this section, the parameter F l , a is calculated by Monte Carlo sampling prior to the start of the optimization. The purpose of constraints (14) to (19) is to guide the ORDS assignments so that each day’s resulting ward combination is feasible.
Having specified the constraints that hedge against the risk of ward overflow, we now turn to the objective function. The problem considered in this paper is to schedule a given set of patients (fixed throughput) over the period D so that both overtime and the likelihood of exceeding the limited number of staffed ward beds are minimized. As we have already set bounds to the likelihood of exceeding the limited number of staffed ward beds with the parameter Ω , the focus in the objective function is on minimizing the OR overtime and the amount of overtime.
Let us introduce the binary variable u d , r , taking the value 1 if δ p > δ and otherwise taking the value of 0, as forced by the following constraint:
( d , p , r ) D P R : δ p > δ x d , p , r u d , r
and similarly, the binary variable v d , r taking the value 1 if δ p Δ > δ Δ and otherwise taking the value of 0, as posed by the following constraint:
( d , p , r ) D P R : δ p Δ > δ Δ x d , p , r v d , r
The former binary variable ( u d , r ) determines the number of times that the probabilities of the selected ORDSs surpass the accepted risk ( δ ) of entering regular overtime, while the latter ( v d , r ) determines the number of times that the probabilities of the ORDSs surpass the accepted risk ( δ Δ ) of entering extended overtime. The objective function minimizes the total number of times a selected ORDS results in overtime, but with more weight w 1 on the extended overtime. A further penalty is added for the degree of surpassing the accepted risk limits by minimizing the squared probabilities δ p and δ p Δ , again with more weight on extended overtime, resulting in the following objective function:
min d D , r R ( u d , r + w v d , r )
+ ( d , p , r ) D P R [ δ p ] 2 + w [ δ p Δ ] 2 x d , p , r

2.3. Robust Ward Optimization

In robust optimization, distributional information about the LOS is ignored [2]. Instead, constraints that reflect the worst-case realization of uncertainty are added. The difficulty of describing the worst-case realization, the so-called uncertainty set, is the challenge remaining. The subject matter experts, knowing the patients’ conditions, may be able to estimate the worst-case scenario. Depending on the risk-attitude of the hospital, a probabilistic guarantee for the feasibility can be made.
Let us assume that the decision-maker is very conservative and requires an ω level of certainty that the number of staffed ward beds occupied in the ward are kept below their capacity M A . Let the probability of patient i being in the ward on day d be denoted by ρ i , d . Then, the worst-case realization should satisfy the following condition:
n ¯ d + p P , j { 0 , , M W 1 } , r R : ( ( d j ) , p , r ) D P R x d j , p , r i I p 𝟙 ω ρ i , j M A , d D
where n ¯ d are the patients with certainty ω in the ward from the previous plan and 𝟙 ω ρ i , j takes the value 1 when ω ρ i , j ; otherwise, it is 0. Constraint (24) replaces constraints (12)–(19) described in the previous section; all other details of the MIP model remain the same.
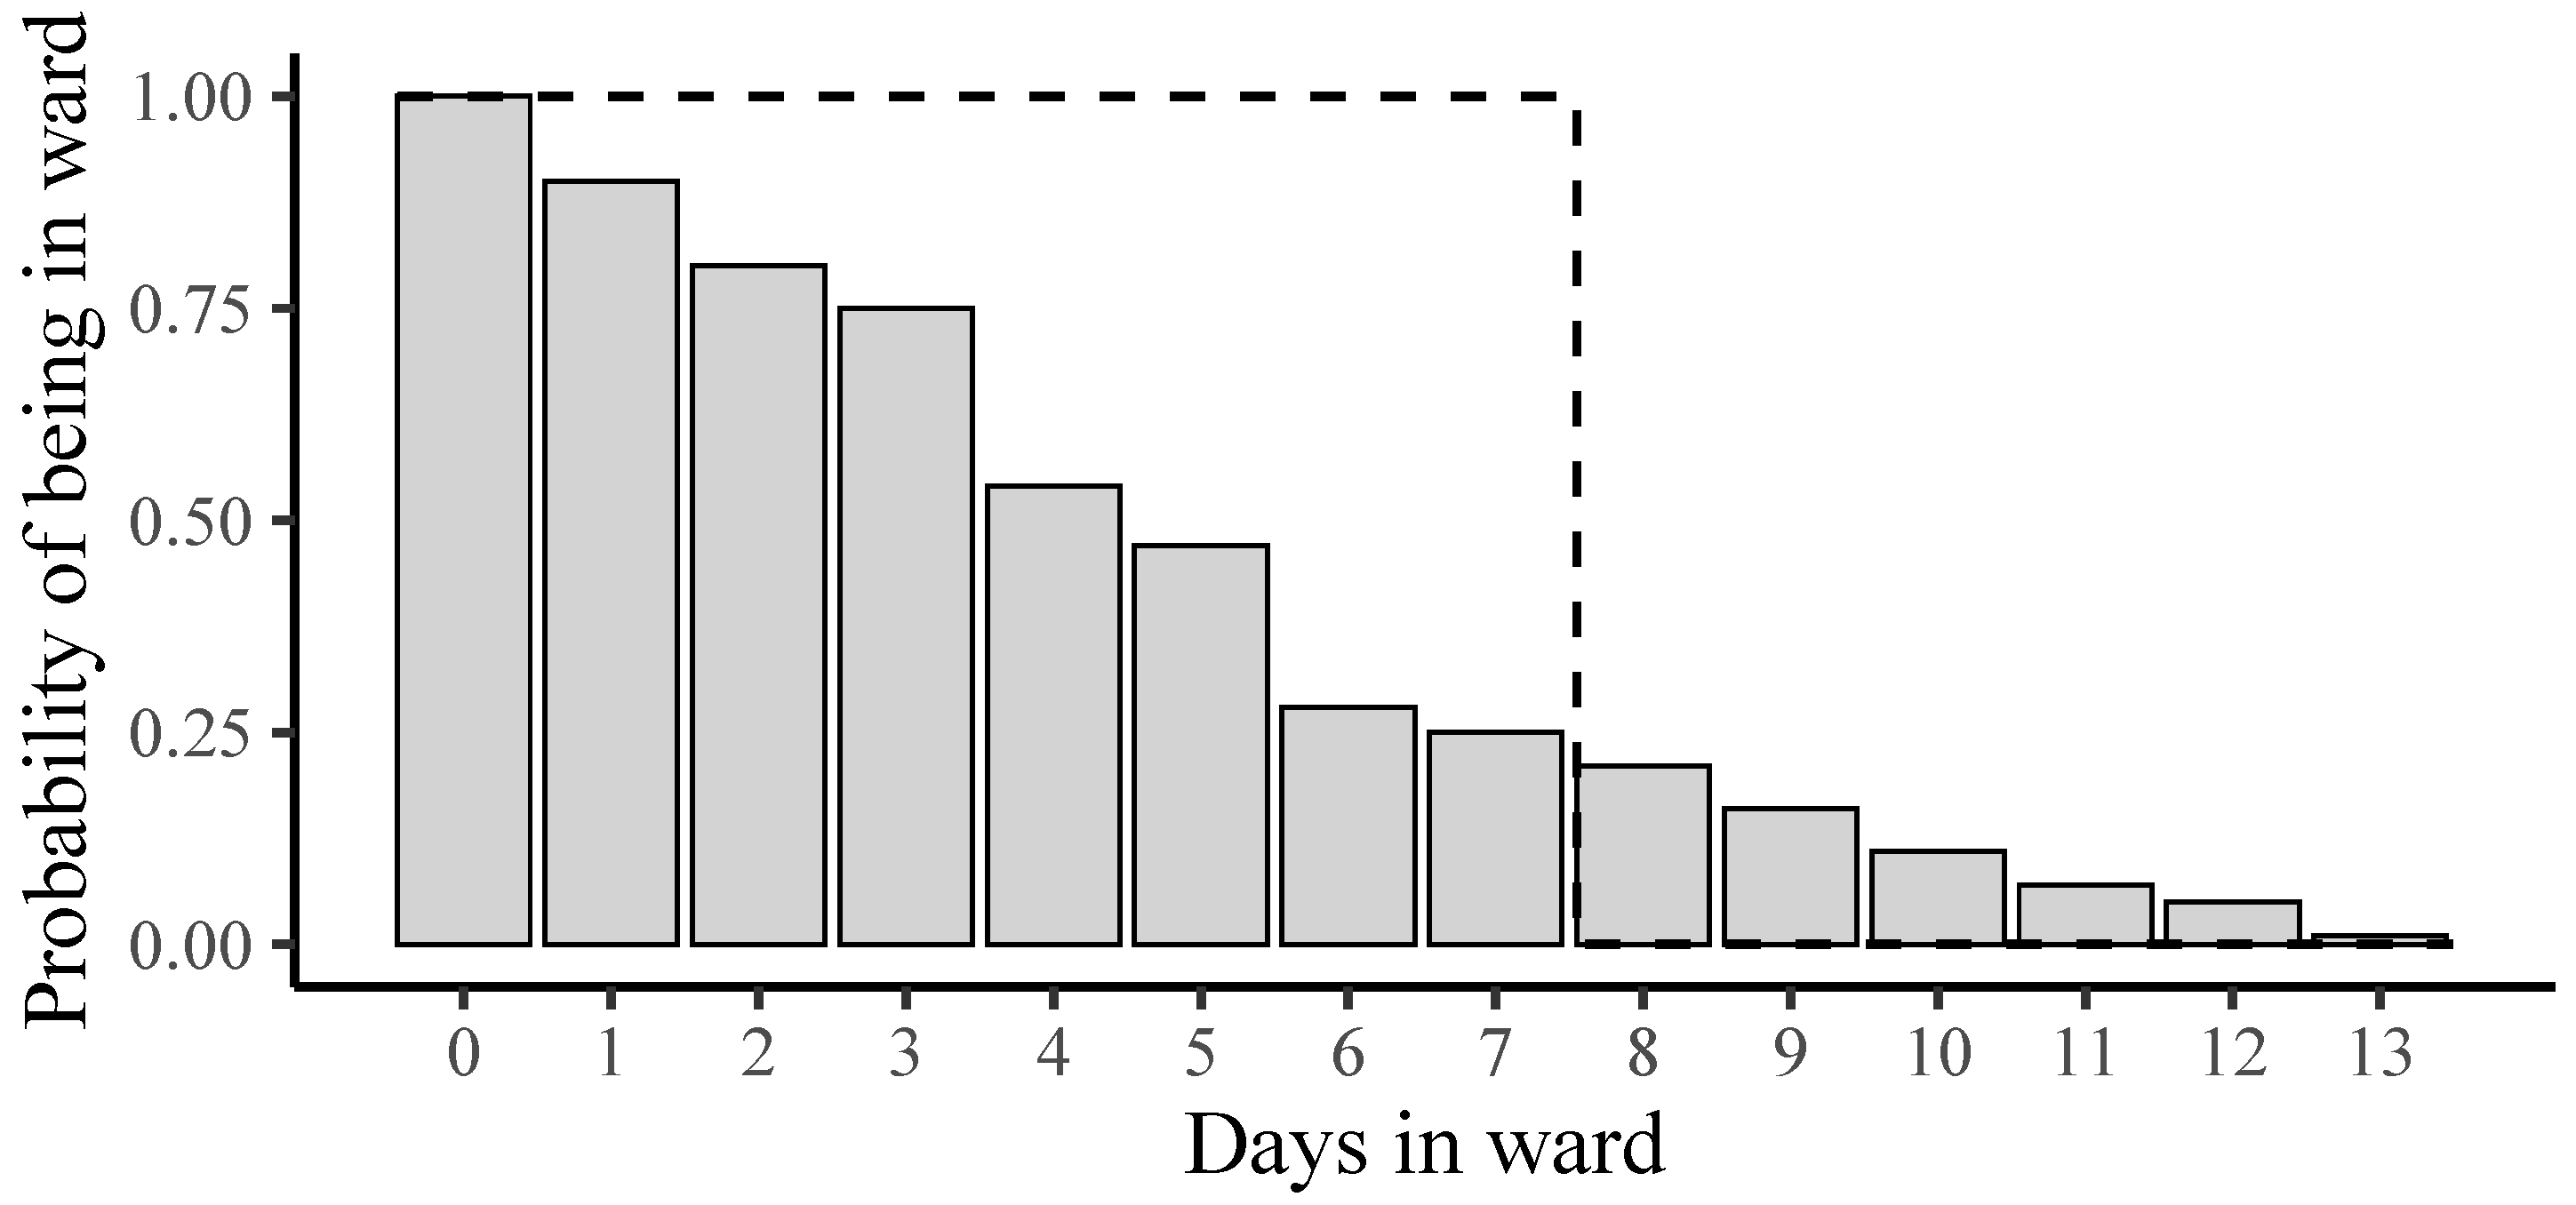
In Figure 2, one can see the distribution for the same surgery type as presented in Figure 1, but now, for the worst-case LOS using ω = 0.25 , as illustrated by the dashed-line. In this example, the patient is in ward from days 0 to 7 ( 𝟙 ω ρ i , j = 1 ) but has left the ward on day 8 ( 𝟙 ω ρ i , j = 0 ). The figure shows that the approach is conservative and may reduce the number of scheduling possibilities.
Although the worst case for the LOS for a single patient is used, there is still the chance that we will exceed the staffed ward beds with a high probability when there are many patients in the ward. In the implementation of this constraint in [2], a slack is introduced to allow for additional ward beds and thus guarantee feasibility. We do not consider this an option and suggest that the strategy in practice would be to increase the value of ω until feasibility is met.

3. Experimental Study

The purpose of the experimental study is to compare ward combination optimization (WCO) and robust ward optimization (RWO) with respect to computational time and solution quality. In addition, we compare our optimized solutions to actual scheduling data. Various parameter settings for the proposed models are also studied. For our analysis, we have selected data from one typical month for a single surgical specialty, General Surgery at Landspitali Hospital. The given month consists of | D | = 28 days, which corresponds to the length of the planning horizon. During that month, 103 patients were operated on, with around 30 % requiring ward admission for one or more days. A total of 10 of these patients required ICU admission. Moreover, 10 patients had a priority of one week. For the experiments, we assume that the patients with a priority of one week must be scheduled within 14 days (based on historical data) and that other patients have equal priority. Semi-acute patients (32 of 103) arriving during the month are scheduled after their arrival. To be comparable with actual scheduling data, the actual operators’ roster days are used.
The experiments were performed on a Windows desktop machine with 32 GB Intel Core i7-7700 3.60 GHz with four cores. The ORDS and the ward combination generators were coded in C, whereas the MIP model was programmed using the AMPL mathematical programming language and solved using Gurobi 8.1.

3.1. General Surgery at Landspitali Hospital

Landspitali Hospital is a national university hospital located in Reykjavik, Iceland. The hospital has approximately 650 ward beds and 15,000 surgeries performed annually by 11 surgical specialties. Only one of these specialties, General Surgery (GS), will be the focus of this study. The GS specialty performs upper and lower abdomen surgeries and consists of nine surgical operators. The specialty performs around 1200 elective surgeries annually, with up to 40 % of the surgeries requiring ward admission.
Landspitali Hospital uses block scheduling, where the MSS has been predetermined for the specialties and is repeated every five working days. The GS specialty is allocated to 13 blocks each week. The specialty then allocates these blocks to the operators in advance, each receiving at least one day of the week. The Friday blocks are shared between operators needing additional OR capacity. Each patient is assigned to an operator’s waiting list and can be scheduled to one of the operator’s blocks. There are two types of patients considered for the elective schedule: in- and out-patients. In-patients require a ward bed after their surgery to recover for one or more days, while out-patients leave the hospital the same day.
In practice, patients are assigned to blocks by a human scheduler. Their selection is mainly dependent on their medical priority determined by the operator, their availability and readiness. At the hospital, two block lengths are available. On Mondays–Thursdays, the OR’a block length is 450 min, but it is 330 min on Friday. Due to the time limitation, patients must also be scheduled in such a way that the accumulated sum of their expected surgery times fits within the given block. However, going beyond the block capacity is possible, since two ORs are kept open longer for acute patients. As a result, the GS speciality utilises extended overtime. That is to say, it is preferable to have a small number of ORs that go into extended overtime rather than having a large number of ORs that go into regular overtime over the entire planning horizon. However, the time added to the extended block length is limited to 60 min.
The GS specialty has limited access to downstream resources shared with other specialties. The scheduler takes these limitations into account by applying the following heuristic: each day, only one ICU patient can be admitted to the ICU, and in total, there are six staffed ward beds. Due to the limitations on the number of staffed ward beds, the scheduler uses the expected LOS (maximum of 7 days) for each surgery to determine the ward occupancy of each day. Using the expected values, however, has often resulted in cancellations. The ORs are utilized close to full capacity, but uncertainties in surgery duration and LOS in wards lead to last-minute cancellations, either due to overtime or ward overflow. The GS specialty wants to maintain a high level of throughput and reduce the number of last-minute cancellations. Today, it is common to plan patients up to two weeks in advance. However, the specialty would like to plan further ahead.

3.2. Parameter Settings

In this section, we present the parameters used for the ORDS generation with the WCO and RWO models. In addition, we describe the solution verification process necessary to verify the solutions due to the nature of our approaches. The ORDS and the ward combinations are created offline prior to the start of the optimization. These simulations require a few minutes of computation time.

3.2.1. ORDS Generation

The following parameters were selected to create the ORDS based on general practise at the General Surgery speciality. When ORDS are created, an upper limit on the number of patients assigned to an ORDS is set to M p = 6 and M I C U = 1 on ICU patients.
There are two distinct block lengths available at Landspitali Hospital, so we set C d , r = { 330 , 450 } min and the time added to the extended block length to Δ d , r = 60 min. We posed a limit on the probability that an ORDS surpasses C d , r to δ = 0.75 . For each patient, 1000 scenarios of surgery times were generated, dependent on the patient’s surgery type, using Monte Carlo sampling from historical data. Note that pre- and post activity times are included in the surgery times.
Lastly, a LOS distribution based on the patient’s probability of stay in the ward each day was calculated for each patient requiring ward admission. The distribution is based on the patient’s surgery type using a maximum of M W = 14 ward days.

3.2.2. Ward Combination Optimization

To create the ward combinations, the number of probability groups was varied with | K | = 4 , , 7 and corresponding equal discretized probabilities
p k = ( | K | k ) / ( | K | 1 ) , k { 1 , , | K | } .
Each ward combination was simulated with Monte Carlo sampling 1000 times using Ω = 0.15 and M A = 6 .
Several parameters must be set for the WCO model. As for the ward combinations, we used M A = 6 and set the number of ICU patients admitted to the ICU to M ¯ I C U = 1 . To estimate the parameter n ¯ d , k , we performed a Monte Carlo sampling using historical data three weeks prior to the start of the planning horizon.
For the threshold of accepted risk of entering overtime, used by the objective function, we selected δ = 0.25 . This value is close to the values used by [17,20,32]. We selected the same value for the threshold of the risk of entering extended overtime δ Δ = 0.25 . The weight between regular and extended overtime in the objective was set to w = 10 based on importance.

3.2.3. Robust Ward Optimization

We employed the same parameter settings for RWO as were used for the WCO. In order to be able to compare RWO to WCO, we set the RWO parameter ω = Ω .

3.2.4. Solution Verification

Due to the nature of our approach, exceeding the number of staffed ward beds is still a possibility. As a result, each solution was verified by Monte Carlo sampling using the complete, undiscretized, empirical distribution for the LOS in the ward and surgery times. We simulated each schedule 1000 times. For each simulation result, we measured the discretization error, namely the degree of exceeding the values Ω and ω for a given number of staffed beds (referred to as the risk of overflow). Median, mean and maximum values are provided. In addition, we measured how many beds exceed the given number of staffed ward beds for the entire planning period. Minimum, median, mean and maximum values are provided.

3.3. Comparison

In Table 1, one can see the difference between optimal solutions from the WCO, RWO and actual scheduling data. First, compared to actual data, ORDS are less likely to surpass the accepted risk of regular overtime and the accepted risk of extended overtime for our models. For the regular overtime, the difference is the lowest (up to 25% lower) but the highest for the extended overtime (up to 71% lower). Comparing the ward results, one can see that the values are also lower for the models. This is apparent for both the number of beds over the given number of staffed ward beds of 6 (min, median, mean and max) and also for the maximum risk of overflow. Comparing WCO and RWO, one can see that WCO is of higher quality than RWO both in terms of overtime and ward overflow. To better understand the sources of the difference between the models, a visual representation of the actual, WCO and RWO scheduling are provided in Figure 3, Figure 4 and Figure 5, respectively. The figures illustrate the surgeries for each day and room (indicated with 1, 3 and 6) and boxplots for the simulated ward occupancy. For the ward occupancy, the color is yellow if there is a risk of overflow, but grey if not. In practice, the scheduler will use the accumulated average surgery duration (AASD) to create ORDS by hand. Thus, the figures reflect what the scheduler can see in their planning software. Different colors reflect the operators and the text is the code of the surgical procedure. If the surgical procedure code is in upper case, ward admission is required. The symbol + denotes if a patient arrived during the execution of the schedule, * denotes one-week priority and ICU denotes if ICU is required. The tags u and v denote if the threshold for the risk of regular or extended overtime is surpassed, respectively. In the figures, three dashed lines are shown. For the ORs, two lines are shown to represent the opening hours of the ORs (the capacity parameter C d , r ). For the ward, a single dashed line is shown for the maximum number of staffed ward beds ( M A ) at the specialty.
Inspecting Figure 3, one may note the imbalance in the utilization of the ORs. Observing the AASD for each day and room, the ORs are, in many instances, utilized close to full capacity, while in others, they are under-utilized. For example, on days 3, 9, 15, 17, 18, 22, and 24, the AASD of at least one room is more than 7 ,   5 h. However, on days 4, 5, 8, 10, 11, 16, 19, 23 and 25, at least one room has a low OR utilization (low OR hours). As the AASD is closer to full capacity, there is an increased risk of overtime, as can be seen from the tags denoting the surpassing of the accepted risk of regular (u) and extended (v) overtime above each OR in the figure. On some days, operating close to, or over, full capacity cannot be avoided. One can see this occurs on days 1, 17, 18, 22, and 23, when the average duration of a single surgery is close to the available opening time.
The imbalances detected in the utilization of the ORs are also apparent in our simulation of ward occupancy (see Figure 3). The utilization of the ward is lowest during the weekends but increases at the beginning of each week and commonly reaches a maximum on Thursdays before decreasing again. In the first week, there is a high risk of overflow already on Wednesday (day 3) to Saturday (day 6) and again on day 18. The risk of overflow is relatively low and the ward occupancy is balanced in the second week (days 8–14). However, imbalances and a higher risk of overflow reappears in the last two weeks (days 15–28), even if they are not as severe as in the first week.
In Figure 4 and Figure 5, the optimal solutions are visualized for the WCO and RWO schedules in the same way as was done in Figure 3 for the actual schedule. Of the 103 surgeries included in both schedules, 28 are scheduled by the model on the same day as they were actually performed on for the WCO; this number is 23 for the RWO. This suggests that the optimized schedules and the actual one are different. Analyzing the figures, one can identify that, for the optimized schedules, the utilization of both the wards and the ORs is more evened out for the entire planning horizon. For example, the daily ward admissions are relatively balanced, with most days in the range of 1–2 admissions per day. Additionally, the risk of overflow is lower. For the ORs, one can observe that overtime has been concentrated to fewer days, leading to improved and more evened out utilization. Moreover, single surgeries that have, on their own, a high risk of entering overtime (those spanning the whole day) are never combined with other surgeries in the optimal solution (see e.g., Figure 4 on day 10 in room 1), whereas this occurs in the actual data (see e.g., Figure 3 on day 18 in room 1).
Comparing the schedules of the WCO to the RWO, one can see that they differ in terms of overtime and ward utilization. More overtime is apparent in the RWO in the second week, but less is apparent in the third week. In terms of the wards, both solutions contain three days with a risk of overflow but on different days. Since RWO is more conservative as it depends on the worst-case outcome for the ward LOS, there is generally lower ward utilization.

3.4. Parameter Analysis

Parameter analyses are performed to explore the trade-offs between computational requirements and quality of solutions of the WCO and RWO for a given range of model parameters. The results are presented in Table 2 and Table 3.
In Table 2, one can see that changing the parameters ( M A , Ω , | K | ) has little effect on the number of times the optimal solution surpasses the accepted risk of overtime, both regular and extended. As we have already noted in Figure 4, most of the ORDSs that surpass the threshold on the accepted risk of entering overtime are composed of few surgeries and are unavoidable for any solutions that require all surgeries to be scheduled.
Changing the parameters affects the median and the maximum number of beds going over the given bed limit and the maximum risk of overflow. Decreasing the bounds of the risk of overflow (values of Ω ), for the same resolution in the discretization of the LOS distribution | K | and the number of staffed beds ( M A ), lowers the median and the maximum number of beds over the given limits for each solution. For example, with M A = 6 , | K | = 5 , and Ω = 1.00 (no bounds on the risk of ward overflow), the median number of beds over the given bed limit has a maximum of 22. A similar effect can be seen for the mean, median, and maximum risk of ward overflow, with the largest drop being in the value of the maximum risk. Decreasing the discretization error for the same values of Ω and M A lowers the maximum risk of overflow and also median/maximum number of beds over. For M A = 6 and Ω = 0.15 , the maximum risk of ward overflow decreases by 35% when | K | increases from 4 to 6. Similarly, the maximum number of beds over decreases. It was impossible for some settings to find a feasible solution. This was evident when a low value for Ω was imposed.
Altering the values of the different parameters impacts the time it takes to solve the WCO. First, the maximum staff ward beds ( M A ) and the bounds on the risk of overflow ( Ω ) influences the computational time. For M A = 6 , feasible solutions are found for all values of Ω for | K | = 5 , but computation time increases from 121 s to 3365 s. A similar effect can be identified for other settings. Second, computational time will also be dependent on the discretization accuracy of the LOS distributions. As | K | is increased from four to six for M A = 6 and Ω = 0.15 , the computation time increases from 362 s. to 6505 s (17 times). For some cases, when increasing the values of Ω , it was impossible to find feasible solutions within the limit on computational time.
In Table 3, one can identify similar effects by changing the values of ω when using the RWO. When ω decreases, one can see that the number of beds over decreases (both median and max). The same applies to the risk of ward overflow. For most settings, the regular and extended overtime remains the same. However, for the configuration of ( 6 , 0.15 ) , regular and extended overtime values increase. The results are similar for the WCO and the RWO for the number of beds over (median and max), but they are generally slightly lower for the WCO. This suggests that higher quality solutions are achieved for the WCO regarding overflow and overtime. Comparing the computational time, one can notice that they are significantly lower for the RWO. For example, the setting of ( 6 , 0.15 ) for the RWO results in 16 s of computational time, whereas WCO with the setting of ( 6 , 0.15 , 6 ) results in 6505 s.

4. Conclusions

Compared to actual scheduling data, the results suggest that utilization of both the wards and the operating rooms (ORs) is more evened out using the ward combination optimization (WCO) for the same level of throughput. Since ORs and wards are operating close to full capacity, overtime cannot be avoided. However, using the WCO, the risk of overtime is concentrated to fewer days, leading to fewer disruptions of the schedule and improved utilization over the entire planning horizon. The robust ward optimization (RWO) is more conservative, as it depends on the worst-case outcome for the ward LOS. As a result, lower quality solutions in terms of OR overtime and ward utilization are produced.
Similar to [28], we observe a trade-off between the robustness of the solution and computational tractability. The likelihood of exceeding the available staffed ward beds is affected by the approximation of the empirical distribution of LOS in the ward and the threshold set for accepted risk of overflow. Reducing the discretization error will increase robustness, but at the cost of increased computational time. Similarly, increasing the threshold for accepted risk also increases computational time, but this time due to the reduced number of feasible ward combinations.
Higher quality solutions are achieved using the WCO and RWO compared to actual scheduling data. First, the risk of overtime is lower compared to actual data. Second, the overall ward numbers are substantially lower, suggesting that using WCO or RWO can hedge against the risk of exceeding the number of staffed ward beds and thus reduce the risk of last-minute cancellations. Nevertheless, as we noticed from the scheduler’s notes, unforeseen last-minute cancellations disrupt the schedule and cause imbalances in the utilization of ORs and the ward. Thus, a direction for future research is to anticipate the uncertainty of arrivals of elective patients during long-term operational planning horizons. Another possible future research is extending the RWO further by discritizing the worst-case LOS for a single patient into at least three intervals. This would reduce the possibility of exceeding the staffed ward beds when there is a large number of patients in ward.

Author Contributions

Conceptualization, A.O.S., T.P.R. and R.J.S.; Data curation, A.O.S. and T.P.R.; Formal analysis, A.O.S., T.P.R. and R.J.S.; Funding acquisition, T.P.R. and R.J.S.; Investigation, A.O.S.; Methodology, A.O.S., T.P.R. and R.J.S.; Project administration, R.J.S.; Resources, A.O.S. and T.P.R.; Software, A.O.S. and T.P.R.; Supervision, T.P.R. and R.J.S.; Validation, A.O.S. and T.P.R.; Visualization, A.O.S.; Writing—original draft, A.O.S.; Writing—review & editing, T.P.R. and R.J.S. All authors have read and agreed to the published version of the manuscript.

Funding

This project was supported by the Icelandic Technology Development Fund grant number 175373-0611.

Institutional Review Board Statement

Not applicable.

Informed Consent Statement

Not applicable.

Data Availability Statement

Not applicable.

Acknowledgments

The authors would like to acknowledge the staff and the managers at Landspitali for giving insights and support to this project. We also want acknowledge the reviewers for their comments which helped improving the paper.

Conflicts of Interest

The authors declare no conflict of interest.

Abbreviations

The following abbreviations are used in this manuscript:
AASDAccumulated Average Surgery Duration
LOSLength-Of-Stay
MIPMixed-Integer-Programming
MSSMaster Surgical Schedule
ORDSOperating Room Day Schedule
ORsOperating Rooms
RORobust Optimization
RWORobust Ward Optimization
SPStochastic Programming
WCOWard Combinations Optimization

Appendix A. Notations

Sets and Indices
o O Operators within a surgical speciality.
d D Days in the planning horizon.
r R Available operating rooms.
a A Available beds in the ward.
i I All patients.
i I o Patients of operator o.
p P Operating room day schedule (ORDS).
p P i ORDS including patient i.
p P o ORDS including operator o.
( d , p , r ) D P R ORDS p for days d and rooms r for which patients and operators are available.
l L Combinations of ward admission probabilities (ward combinations).
k K Groups of length of stay probabilities.
k K Groups of length of stay probabilities, excluding extremes (first and last).
j J Days of stay in the ward after surgery.
Parameters
M P Upper bound on the number of patients assigned to an ORDS.
M I C U Upper bound on the number of surgical procedures assigned to an ORDS and requiring ICU admission.
M ¯ I C U Upper bound on the number of surgical procedures per day requiring ICU admission.
M W Upper bound on the number of days a patient stays in the ward.
M A Upper bound on the number of available beds in the ward.
C d , r Available surgery time on day d in room r.
F l , a Feasibility of ward combination l when there are a beds available in the ward.
g i 1 if patient i requires ICU admission following surgery, otherwise 0.
n p I C U Number of patients in ORDS p that require ICU admission following surgery.
ρ k Probability of ward admission for probability group k.
n k Number of patients that belong to probability ward group k.
ρ i , d Probability of a patient i being in ward on the day d.
Q j , k , p Number of patients on day j after surgery belonging to probability group k and ORDS p.
n ¯ d , k Number of patients operated in the previous planning period that occupy the ward on day d and belong to probability group k.
δ Limit on the probability that an ORDS exceeds C d , r .
Ω Limit on the likelihood that a ward combination exceeds the number of available beds in the ward.
Parameters
ω level of certainty that the number of beds occupied in the ward are kept below M A .
n ¯ d The number of patients with certainty ω in the ward from previous plan.
𝟙 ω ρ i , j Robust parameter taking the value 1 if ω ρ i , j .
δ p Probability of the sum of surgery duration for ORDS p surpassing C d , r .
δ Accepted risk of entering overtime.
Δ d , r Threshold for extended overtime.
δ p Δ Probability of the sum of surgery duration for ORDS p surpassing C d , r + Δ d , r .
δ Δ Accepted risk of entering extended overtime.
wFactor weighing the relative contribution of regular and extended overtime in the objective function.
Variables
u d , r 1 if δ p > δ , 0 otherwise.
v d , r 1 if δ p Δ > δ Δ , 0 otherwise.
n d , k Number of patients that belong to probability group k and occupy the ward on day d.
Decision variables
x d , p , r 1 if ORDS p is scheduled to day d and room r, 0 otherwise.
a d Number of available ward beds on day d.
z i , p 1 if patient i is assigned to ORDS p, otherwise 0.
z d , a 1 if a beds are available in the ward on day d, otherwise 0.
y d , l 1 if ward combination l is assigned to day d, otherwise 0.
Random variables
S ( i ) Surgery duration for patient i.
W ( l ) Total number of patients belonging to probability groups k K for ward combination l.
B n k ( l ) , ρ k Binomial distributed random variable for the n k ( l ) number of patients in ward combination l belonging to probability group k with probability ρ k .

References

  1. Denton, B.T.; Miller, A.J.; Balasubramanian, H.J.; Huschka, T.R. Optimal Allocation of Surgery Blocks to Operating Rooms under Uncertainty. Oper. Res. 2010, 58, 802–816. [Google Scholar] [CrossRef]
  2. Neyshabouri, S.; Berg, B.P. Two-stage robust optimization approach to elective surgery and downstream capacity planning. Eur. J. Oper. Res. 2017, 260, 21–40. [Google Scholar] [CrossRef]
  3. Min, D.; Yih, Y. Scheduling elective surgery under uncertainty and downstream capacity constraints. Eur. J. Oper. Res. 2010, 206, 642–652. [Google Scholar] [CrossRef]
  4. Augusto, V.; Xie, X.; Perdomo, V. Operating theatre scheduling with patient recovery in both operating rooms and recovery beds. Comput. Ind. Eng. 2010, 58, 231–238. [Google Scholar] [CrossRef]
  5. Beliën, J.; Demeulemeester, E. Building cyclic master surgery schedules with leveled resulting bed occupancy. Eur. J. Oper. Res. 2007, 176, 1185–1204. [Google Scholar] [CrossRef]
  6. van den Broek d’Obrenan, A.; Ridder, A.; Roubos, D.; Stougie, L. Minimizing bed occupancy variance by scheduling patients under uncertainty. Eur. J. Oper. Res. 2020, 286, 336–349. [Google Scholar] [CrossRef]
  7. Addis, B.; Carello, G.; Grosso, A.; Tànfani, E. Operating room scheduling and rescheduling: A rolling horizon approach. Flex. Serv. Manuf. J. 2016, 28, 206–232. [Google Scholar] [CrossRef]
  8. Hans, E.; Wullink, G.; van Houdenhoven, M.; Kazemier, G. Robust surgery loading. Eur. J. Oper. Res. 2008, 185, 1038–1050. [Google Scholar] [CrossRef]
  9. Molina-Pariente, J.M.; Hans, E.W.; Framinan, J.M. A stochastic approach for solving the operating room scheduling problem. Flex. Serv. Manuf. J. 2018, 30, 224–251. [Google Scholar] [CrossRef]
  10. Jebali, A.; Diabat, A. A stochastic model for operating room planning under capacity constraints. Int. J. Prod. Res. 2015, 53, 7252–7270. [Google Scholar] [CrossRef]
  11. Marques, I.; Captivo, M.E. Different stakeholders’ perspectives for a surgical case assignment problem: Deterministic and robust approaches. Eur. J. Oper. Res. 2017, 261, 260–278. [Google Scholar] [CrossRef]
  12. Cappanera, P.; Visintin, F.; Banditori, C. Addressing conflicting stakeholders’ priorities in surgical scheduling by goal programming. Flex. Serv. Manuf. J. 2018, 30, 252–271. [Google Scholar] [CrossRef]
  13. McManus, M.L.; Long, M.C.; Cooper, A.; Mandell, J.; Berwick, D.M.; Pagano, M.; Litvak, E. Variability in surgical caseload and access to intensive care services. Anesthesiology 2003, 98, 1491–1496. [Google Scholar] [CrossRef] [PubMed]
  14. Wachtel, R.E.; Dexter, F. Tactical increases in operating room block time for capacity planning should not be based on utilization. Anesth. Analg. 2008, 106, 215–226. [Google Scholar] [CrossRef] [PubMed]
  15. Zhu, S.; Fan, W.; Yang, S.; Pei, J.; Pardalos, P.M. Operating room planning and surgical case scheduling: A review of literature. J. Comb. Optim. 2019, 37, 757–805. [Google Scholar] [CrossRef]
  16. Adan, I.; Bekkers, J.; Dellaert, N.; Vissers, J.; Yu, X. Patient mix optimisation and stochastic resource requirements: A case study in cardiothoracic surgery planning. Health Care Manag. Sci. 2009, 12, 129–141. [Google Scholar] [CrossRef]
  17. van Oostrum, J.M.; Van Houdenhoven, M.; Hurink, J.L.; Hans, E.W.; Wullink, G.; Kazemier, G. A master surgical scheduling approach for cyclic scheduling in operating room departments. OR Spectr. 2008, 30, 355–374. [Google Scholar] [CrossRef]
  18. Banditori, C.; Cappanera, P.; Visintin, F. A combined optimization–simulation approach to the master surgical scheduling problem. IMA J. Manag. Math. 2013, 24, 155–187. [Google Scholar] [CrossRef]
  19. M’Hallah, R.; Visintin, F. A stochastic model for scheduling elective surgeries in a cyclic Master Surgical Schedule. Comput. Ind. Eng. 2019, 129, 156–168. [Google Scholar] [CrossRef]
  20. Schneider, A.J.T.; Theresia van Essen, J.; Carlier, M.; Hans, E.W. Scheduling surgery groups considering multiple downstream resources. Eur. J. Oper. Res. 2020, 282, 741–752. [Google Scholar] [CrossRef]
  21. Guerriero, F.; Guido, R. Operational research in the management of the operating theatre: A survey. Health Care Manag. Sci. 2011, 14, 89–114. [Google Scholar] [CrossRef]
  22. Otten, M.; Braaksma, A.; Boucherie, R.J. Minimizing Earliness/Tardiness costs on multiple machines with an application to surgery scheduling. Oper. Res. Health Care 2019, 22, 100194. [Google Scholar] [CrossRef]
  23. Denton, B.; Viapiano, J.; Vogl, A. Optimization of surgery sequencing and scheduling decisions under uncertainty. Health Care Manag. Sci. 2007, 10, 13–24. [Google Scholar] [CrossRef] [PubMed]
  24. Kroer, L.R.; Foverskov, K.; Vilhelmsen, C.; Hansen, A.S.; Larsen, J. Planning and scheduling operating rooms for elective and emergency surgeries with uncertain duration. Oper. Res. Health Care 2018, 19, 107–119. [Google Scholar] [CrossRef]
  25. Cardoen, B.; Demeulemeester, E.; Beliën, J. Operating room planning and scheduling: A literature review. Eur. J. Oper. Res. 2010, 201, 921–932. [Google Scholar] [CrossRef]
  26. Samudra, M.; Van Riet, C.; Demeulemeester, E.; Cardoen, B.; Vansteenkiste, N.; Rademakers, F.E. Scheduling operating rooms: Achievements, challenges and pitfalls. J. Sched. 2016, 19, 493–525. [Google Scholar] [CrossRef]
  27. Van Riet, C.; Demeulemeester, E. Trade-offs in operating room planning for electives and emergencies: A review. Oper. Res. Health Care 2015, 7, 52–69. [Google Scholar] [CrossRef]
  28. Jebali, A.; Diabat, A. A Chance-constrained operating room planning with elective and emergency cases under downstream capacity constraints. Comput. Ind. Eng. 2017, 114, 329–344. [Google Scholar] [CrossRef]
  29. Makboul, S.; Kharraja, S.; Abbassi, A.; Alaoui, A.E.H. A two-stage robust optimization approach for the master surgical schedule problem under uncertainty considering downstream resources. Health Care Manag. Sci. 2021, 25, 63–88. [Google Scholar] [CrossRef]
  30. Shehadeh, K.S.; Padman, R. A distributionally robust optimization approach for stochastic elective surgery scheduling with limited intensive care unit capacity. Eur. J. Oper. Res. 2021, 290, 901–913. [Google Scholar] [CrossRef]
  31. Kim, S.C.; Horowitz, I. Scheduling hospital services: The efficacy of elective-surgery quotas. Omega 2002, 30, 335–346. [Google Scholar] [CrossRef]
  32. Sigurpalsson, A.O.; Runarsson, T.P.; Saemundsson, R.J. Stochastic Master Surgical Scheduling Under Ward Uncertainty. In Health Care Systems Engineering; Bélanger, V., Lahrichi, N., Lanzarone, E., Yalçındağ, S., Eds.; Springer International Publishing: Cham, Switzerland, 2020; pp. 163–176. [Google Scholar]
Figure 1. Approximating the expected length of stay (LOS) in ward with equal probability intervals of length | K | . Here, | K | = 5 .
Applsci 12 08577 g001
Figure 2. Approximating the expected length of stay (LOS) with the worst-case scenario as illustrated by a dashed-line using certainty ω = 0.25 .
Applsci 12 08577 g002
Figure 3. Visualisation of the actual surgeries for each day and OR (1, 3 and 6) and the corresponding ward occupancy (for the ward occupancy, the color is yellow if there is risk of overflow and grey if not. The dashed line represents the maximum number of staffed ward beds ( M A )). Colors reflect the operators, and the text is the code of the surgical procedure (if the surgical procedure code is in upper case, ward admission is required. The symbol + denotes if a patient arrived during the execution of the schedule, * denotes one-week priority and ICU denotes if ICU is required. The dashed lines represent the distinct opening hours of the ORs ( C d , r )). The tags u and v denote if the threshold for the risk of regular or extended overtime is surpassed, respectively.
Applsci 12 08577 g003
Figure 4. Visualisation of the optimal solution for each day and OR (1, 3 and 6) for the WCO and the corresponding ward occupancy (for the ward occupancy, the color is yellow if there is risk of overflow, but is grey if not. The dashed line represent the maximum number of staffed ward beds ( M A )). Colors reflect the operators and the text is the code of the surgical procedure (if the surgical procedure code is in upper case, ward admission is required. The symbol + denotes if a patient arrived during the execution of the schedule, * denotes one-week priority and ICU denotes if ICU is required. The dashed lines represents the opening hours of the ORs ( C d , r )). The tags u and v denote if the threshold for the risk of regular or extended overtime is surpassed, respectively.
Applsci 12 08577 g004
Figure 5. Visualisation of the optimal solution from the robust ward optimization (RWO) for each day and OR (1, 3 and 6) and the corresponding ward occupancy (for the ward occupancy, the color is yellow if there is risk of overflow and is grey if not. The dashed line represent the maximum number of staffed ward beds ( M A )). Colors reflect the operators, and the text is the code of the surgical procedure (if the surgical procedure code is in upper case, ward admission is required. The symbol + denotes if a patient arrived during the execution of the schedule, * denotes one-week priority and ICU denotes if ICU is required. The dashed lines represent the opening hours of the ORs ( C d , r )). The tags u and v denote if the threshold for the risk of regular or extended overtime is surpassed, respectively.
Applsci 12 08577 g005
Table 1. Comparison between optimal solutions of the ward combinations optimization (WCO), the robust ward optimization (RWO) and actual schedule for the planning horizon. Regular and extended overtime show how often selected ORDS surpass the accepted risk for each group. Risk of overtime is the probability that the selected ORDS will surpass the block capacity. No. of beds over measures how many beds exceed the given number of staffed ward beds while risk of overflow is the likelihood of exceeding the number of staffed ward beds.
ORWard
OvertimeRisk of OvertimeNo. Beds overRisk of Overflow
CaseRegularExtendedMeanMedianMaxMinMedianMeanMaxMedianMeanMax
Actual 8140.200.321.00099.66270.020.151.00
WCO *640.100.170.68011.79140.010.060.25
RWO 750.080.170.69011.47180.010.040.26
Configurations: MA = 6; * (MA, Ω, | K | ) = (6, 0.15, 5); (MA, w) = (6, 0.15).
Table 2. Quality of solutions and computational requirements for different configurations of ( M A , Ω , | K | ) for the ward combination optimization (WCO). Here, M A denotes the maximum number of staffed ward beds, Ω denotes the limit on the likelihood that a ward combination exceeds the number of staffed ward beds and | K | denotes the number of probability groups.
ORWardMIP
ConfigurationOvertime 1No. Beds over 2Risk of Overflow 3CPU
( M A , Ω , | K | )RegularExtendedMinMedianMeanMaxMedianMeanMax(s)
(5, 1.00, 5)6431616.18440.160.320.9895
(5, 0.75, 5)6411011.13460.150.280.89133
(5, 0.50, 5)----------
(5, 0.25, 5)----------
(5, 0.15, 5)----------
(5, 0.10, 5)----------
(6, 0.15, 4)64012.02200.020.060.31362
(6, 1.00, 5)64066.00220.030.160.73121
(6, 0.75, 5)64056.07250.030.150.68109
(6, 0.50, 5)64033.90190.050.110.56470
(6, 0.25, 5)64022.45170.030.080.34790
(6, 0.15, 5)64011.79140.010.060.251080
(6, 0.10, 5)64011.58120.020.050.213365
(6, 0.15, 6)64011.61130.020.050.226505
(6, 0.10, 6)----------
(6, 0.15, 7)----------
(7, 1.00, 5)64044.56220.000.090.88135
(7, 0.75, 5)64022.13200.010.060.47170
(7, 0.50, 5)64011.88130.000.060.41185
(7, 0.25, 5)64011.42120.010.040.28175
(7, 0.10, 5)64000.75110.000.020.14325
(7, 0.10, 6)64000.2150.000.010.031500
1 Regular and extended overtime show how often selected ORDS surpass the accepted risk for each group; 2 Measures how many beds exceed the given number of staffed ward beds (MA); 3 The likelihood of exceeding the number of staffed bed.
Table 3. Quality of solutions and computational requirements for different configurations of ( M A , ω ) for the robust ward optimization (RWO). Here, M A denotes the maximum number of staffed ward beds and ω denotes the limit on the likelihood that a ward combination exceeds the number of staffed ward beds.
ORWardMIP
ConfigurationOvertime 1No. Beds over 2Risk of Overflow 3CPU
( M A , ω )RegularExtendedMinMedianMeanMaxMedianMeanMax(s)
(5, 1.00)6421919.65470.170.281.0018
(5, 0.75)6401010.76310.200.270.8627
(5, 0.50)64077.44300.110.200.7757
(5, 0.25)----------
(5, 0.15)----------
(5, 0.10)----------
(5, 0.05)----------
(6, 1.00)64099.37350.030.170.9613
(6, 0.75)64044.83220.030.120.7217
(6, 0.50)64023.01170.030.090.3721
(6, 0.25)64022.12120.010.060.4134
(6, 0.15)75011.47180.010.040.2616
(6, 0.10)----------
(6, 0.05)----------
(7, 1.00)64055.69220.000.100.9027
(7, 0.75)64011.11120.000.030.3634
(7, 0.50)64000.79110.000.020.1218
(7, 0.25)64000.72210.000.020.1618
(7, 0.15)64000.6480.000.020.1526
(7, 0.10)64000.5980.000.020.29136
(7, 0.05)----------
1 Regular and extended overtime show how often selected ORDS surpass the accepted risk for each group; 2 Measures how many beds exceed the given number of staffed ward beds (MA); 3 The likelihood of exceeding the number of staffed bed.
Publisher’s Note: MDPI stays neutral with regard to jurisdictional claims in published maps and institutional affiliations.

