
An Optimized Neuro_Fuzzy Based Regression Trees for Disease Prediction Framework


Abstract
:1. Introduction
2. Related Work
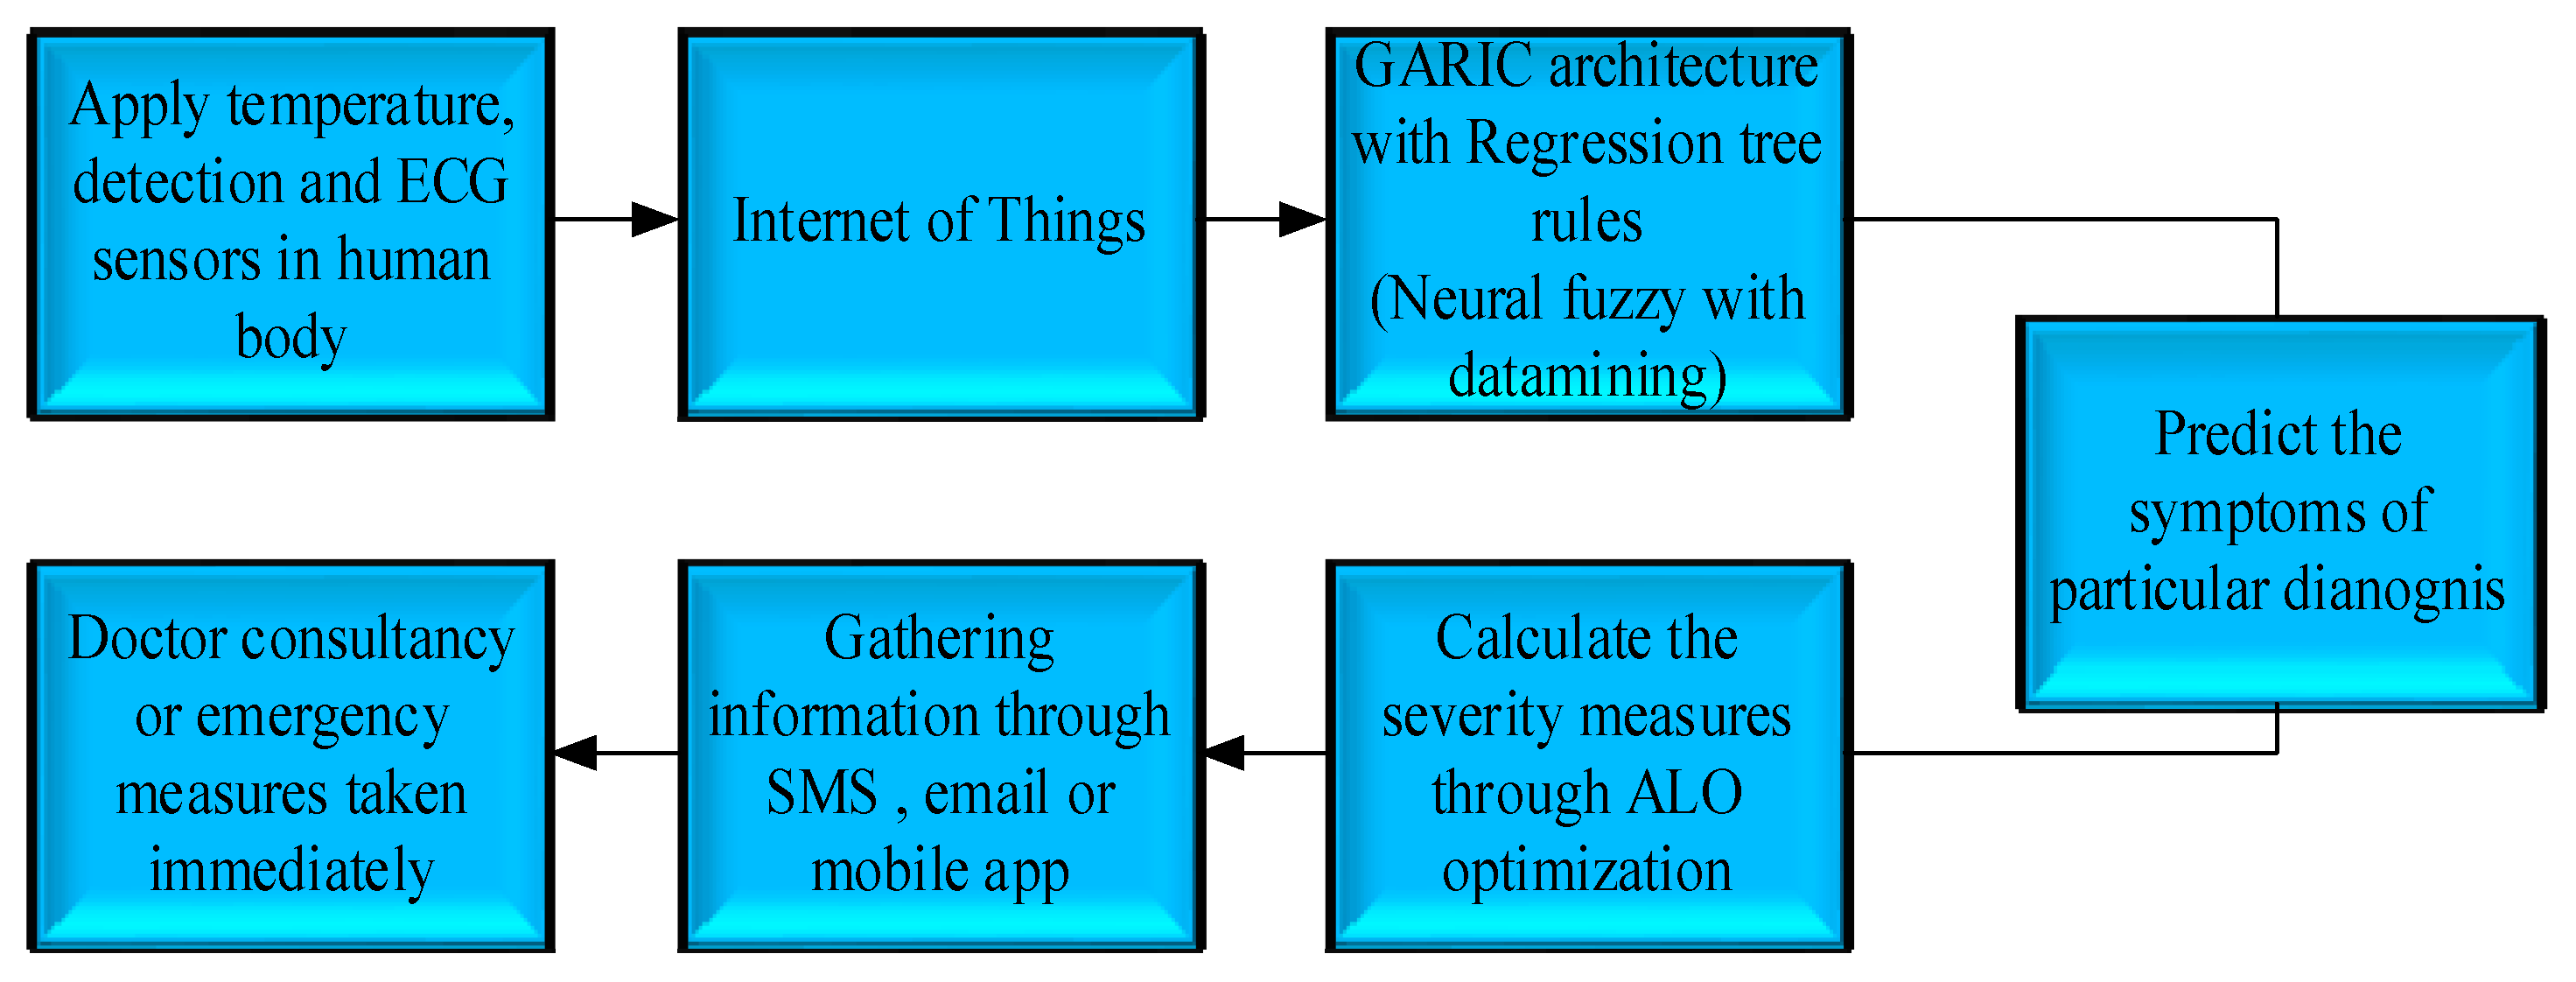
- Incorporate a sensor into the human body.
- Using the Internet of Things, collect real-time medical information about a patient.
- Using GARIC architecture, process and classify information gathered about the patient.
- To use data mining techniques such as regression trees and optimize utilizing ALO to evaluate and forecast any disease or disorder in its early stages.
- Receive notifications through SMS, email, etc.
- To give healthcare solutions based on the Internet of Things at any time and location.
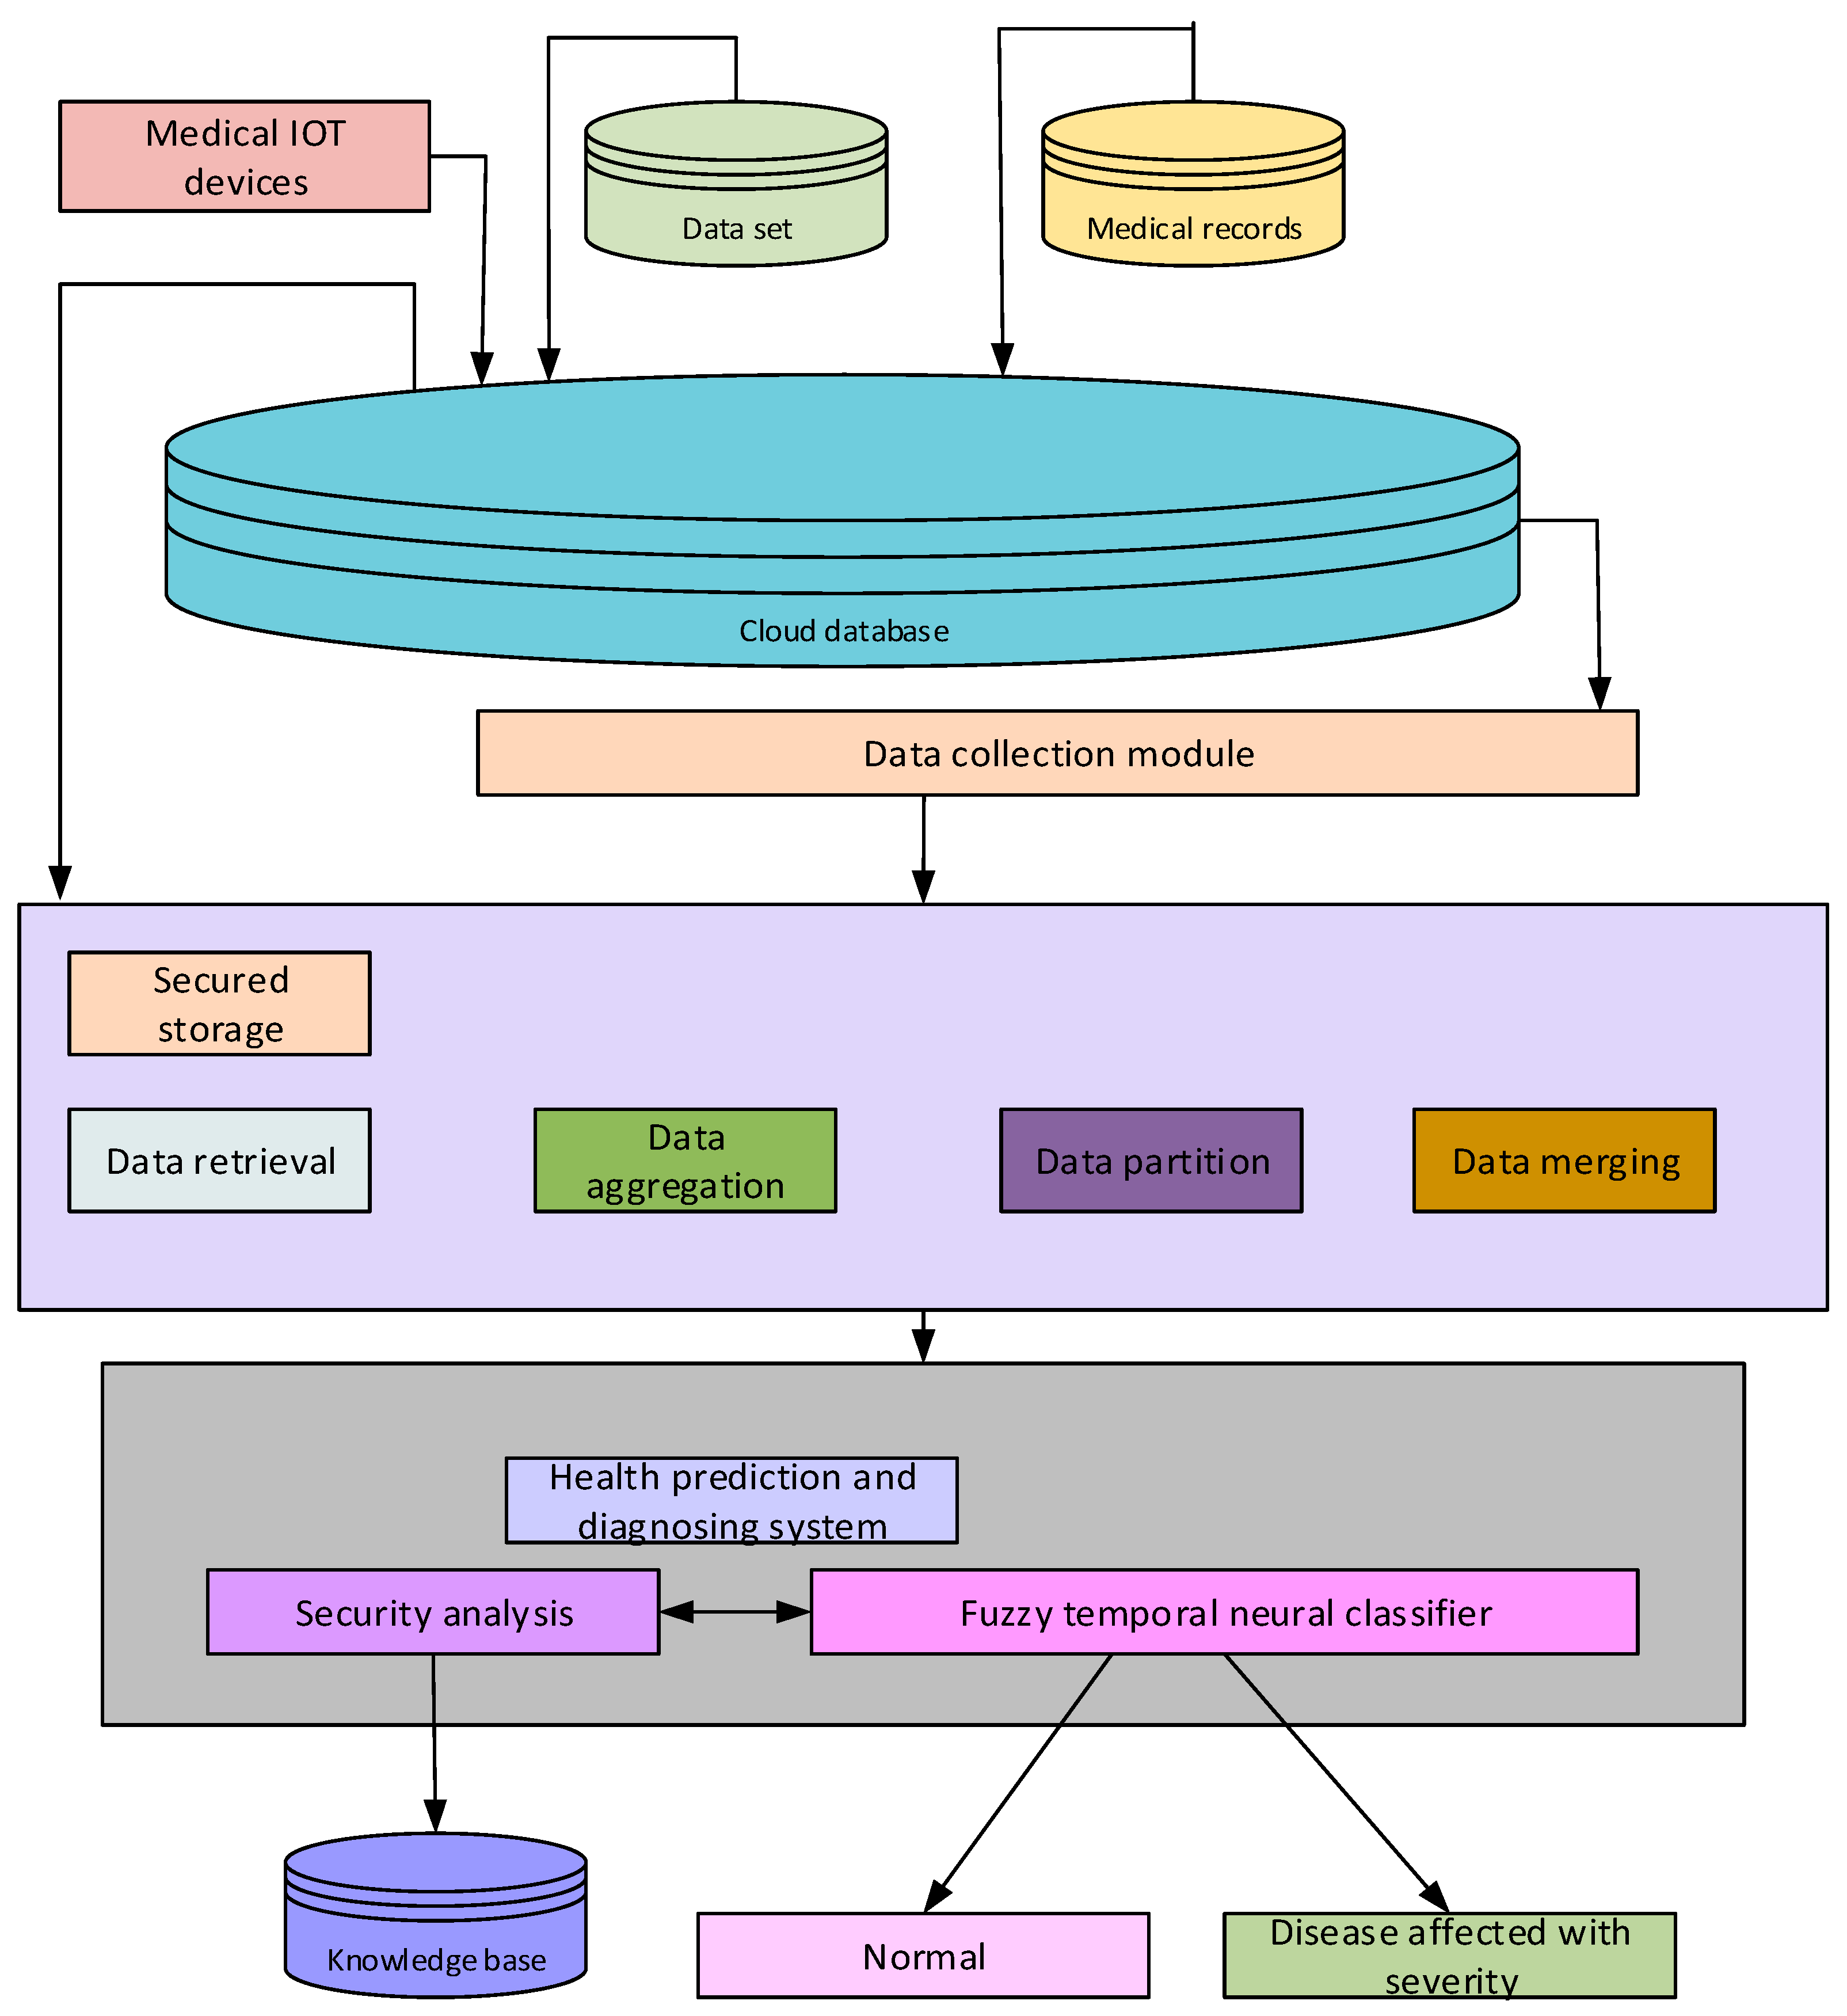
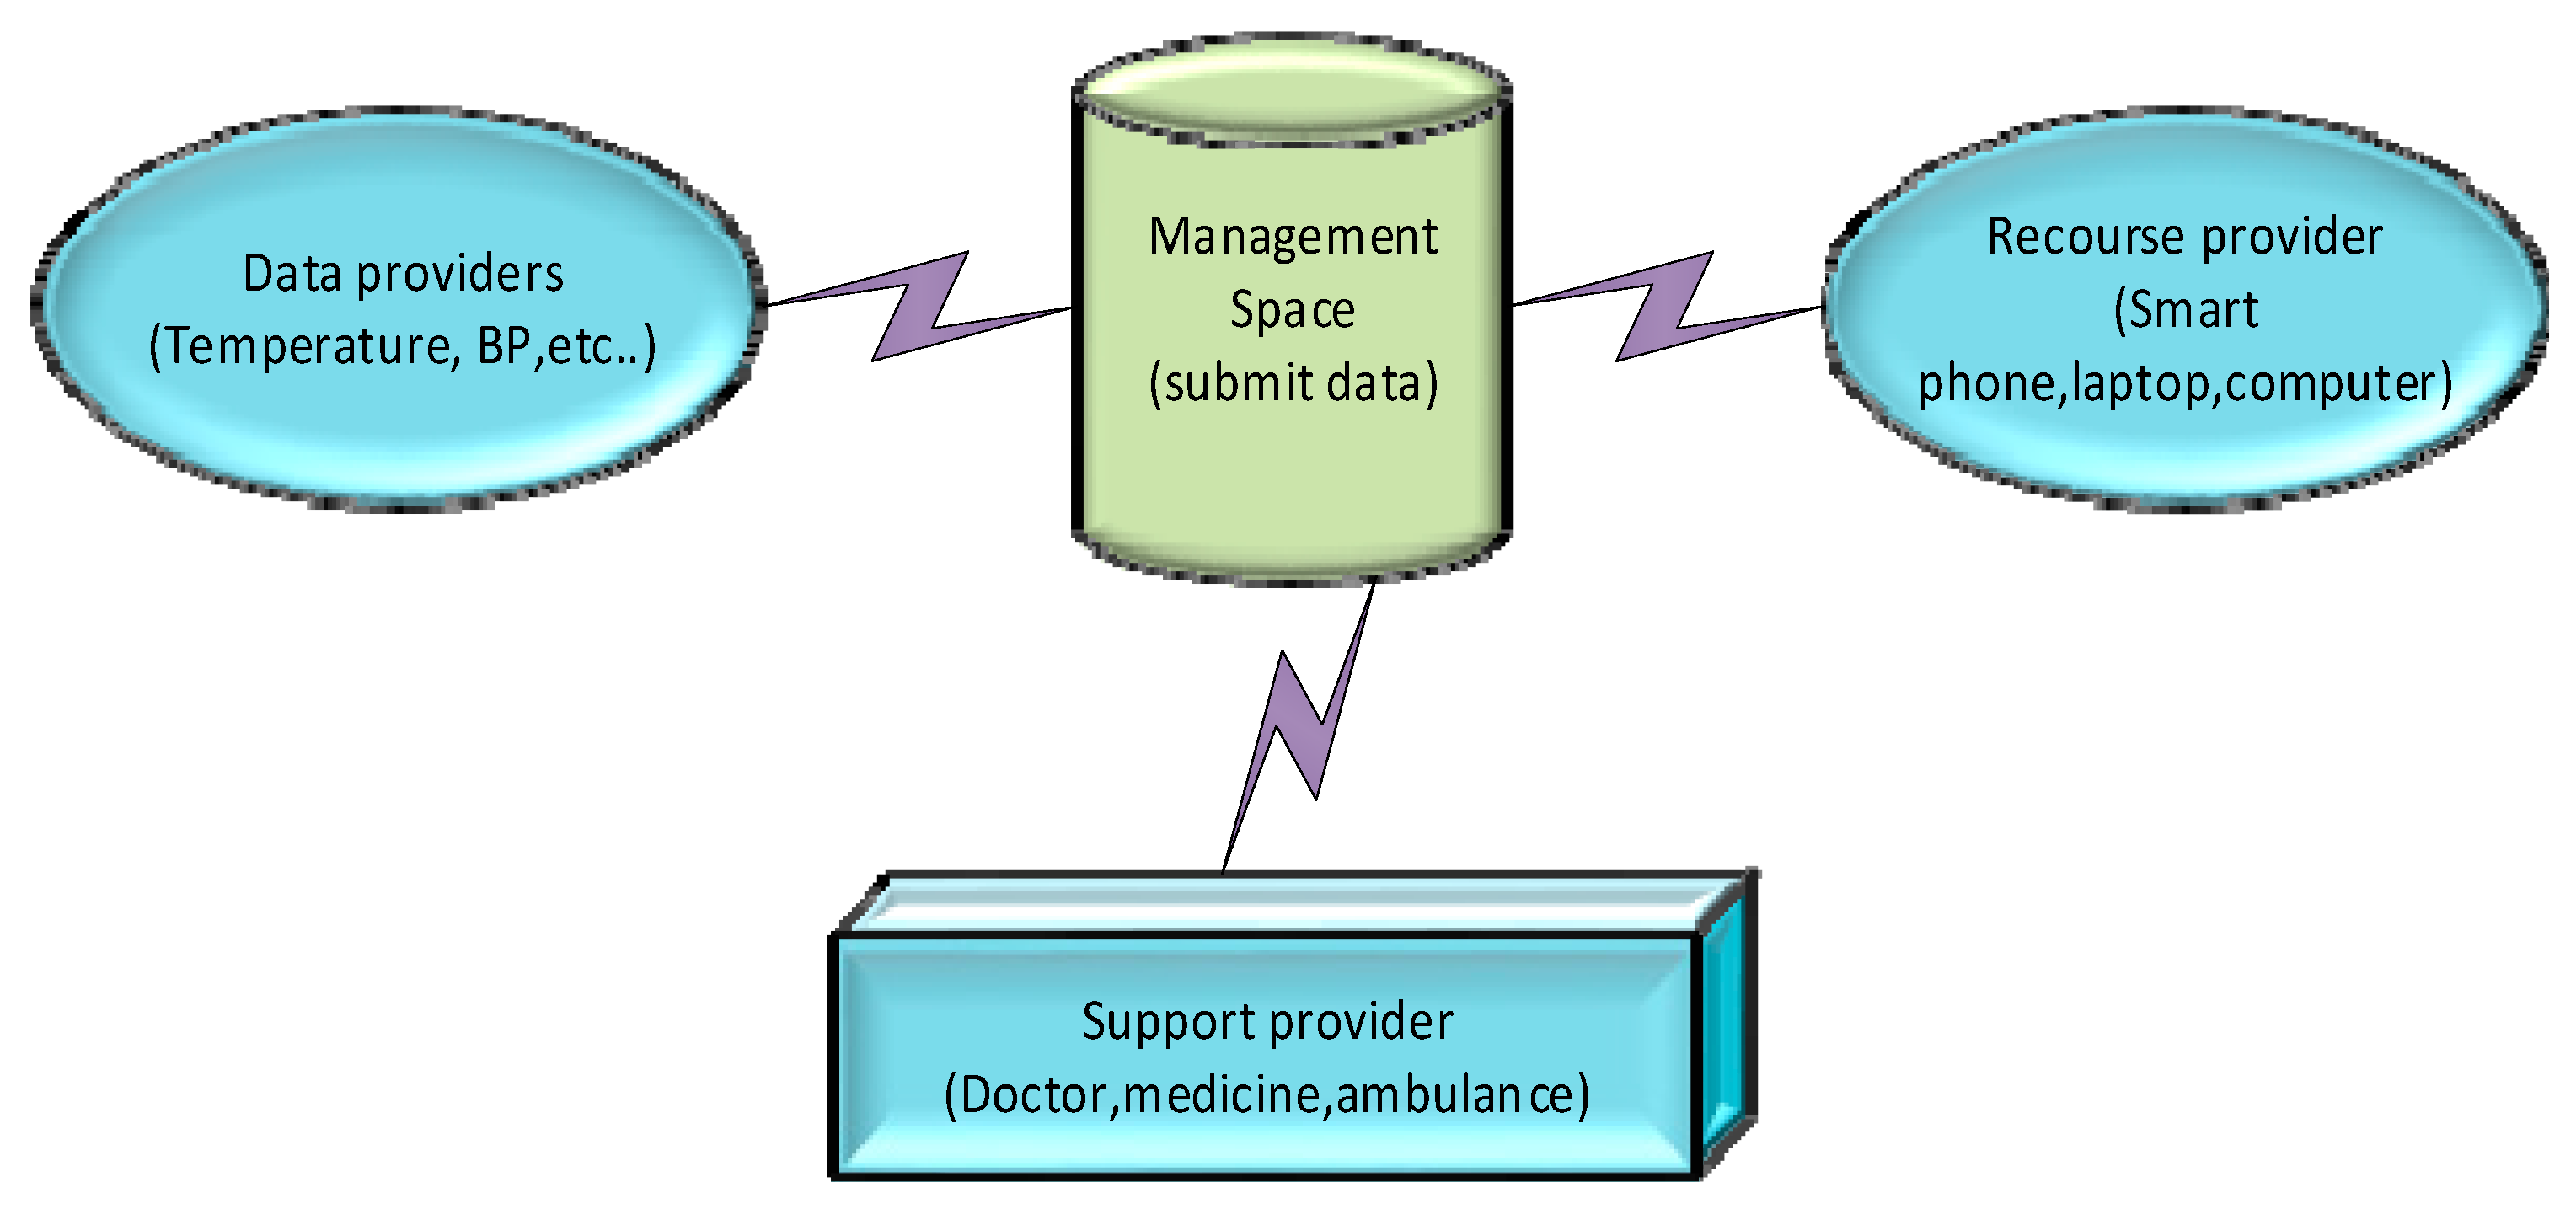
3. System Model and Problem Statement
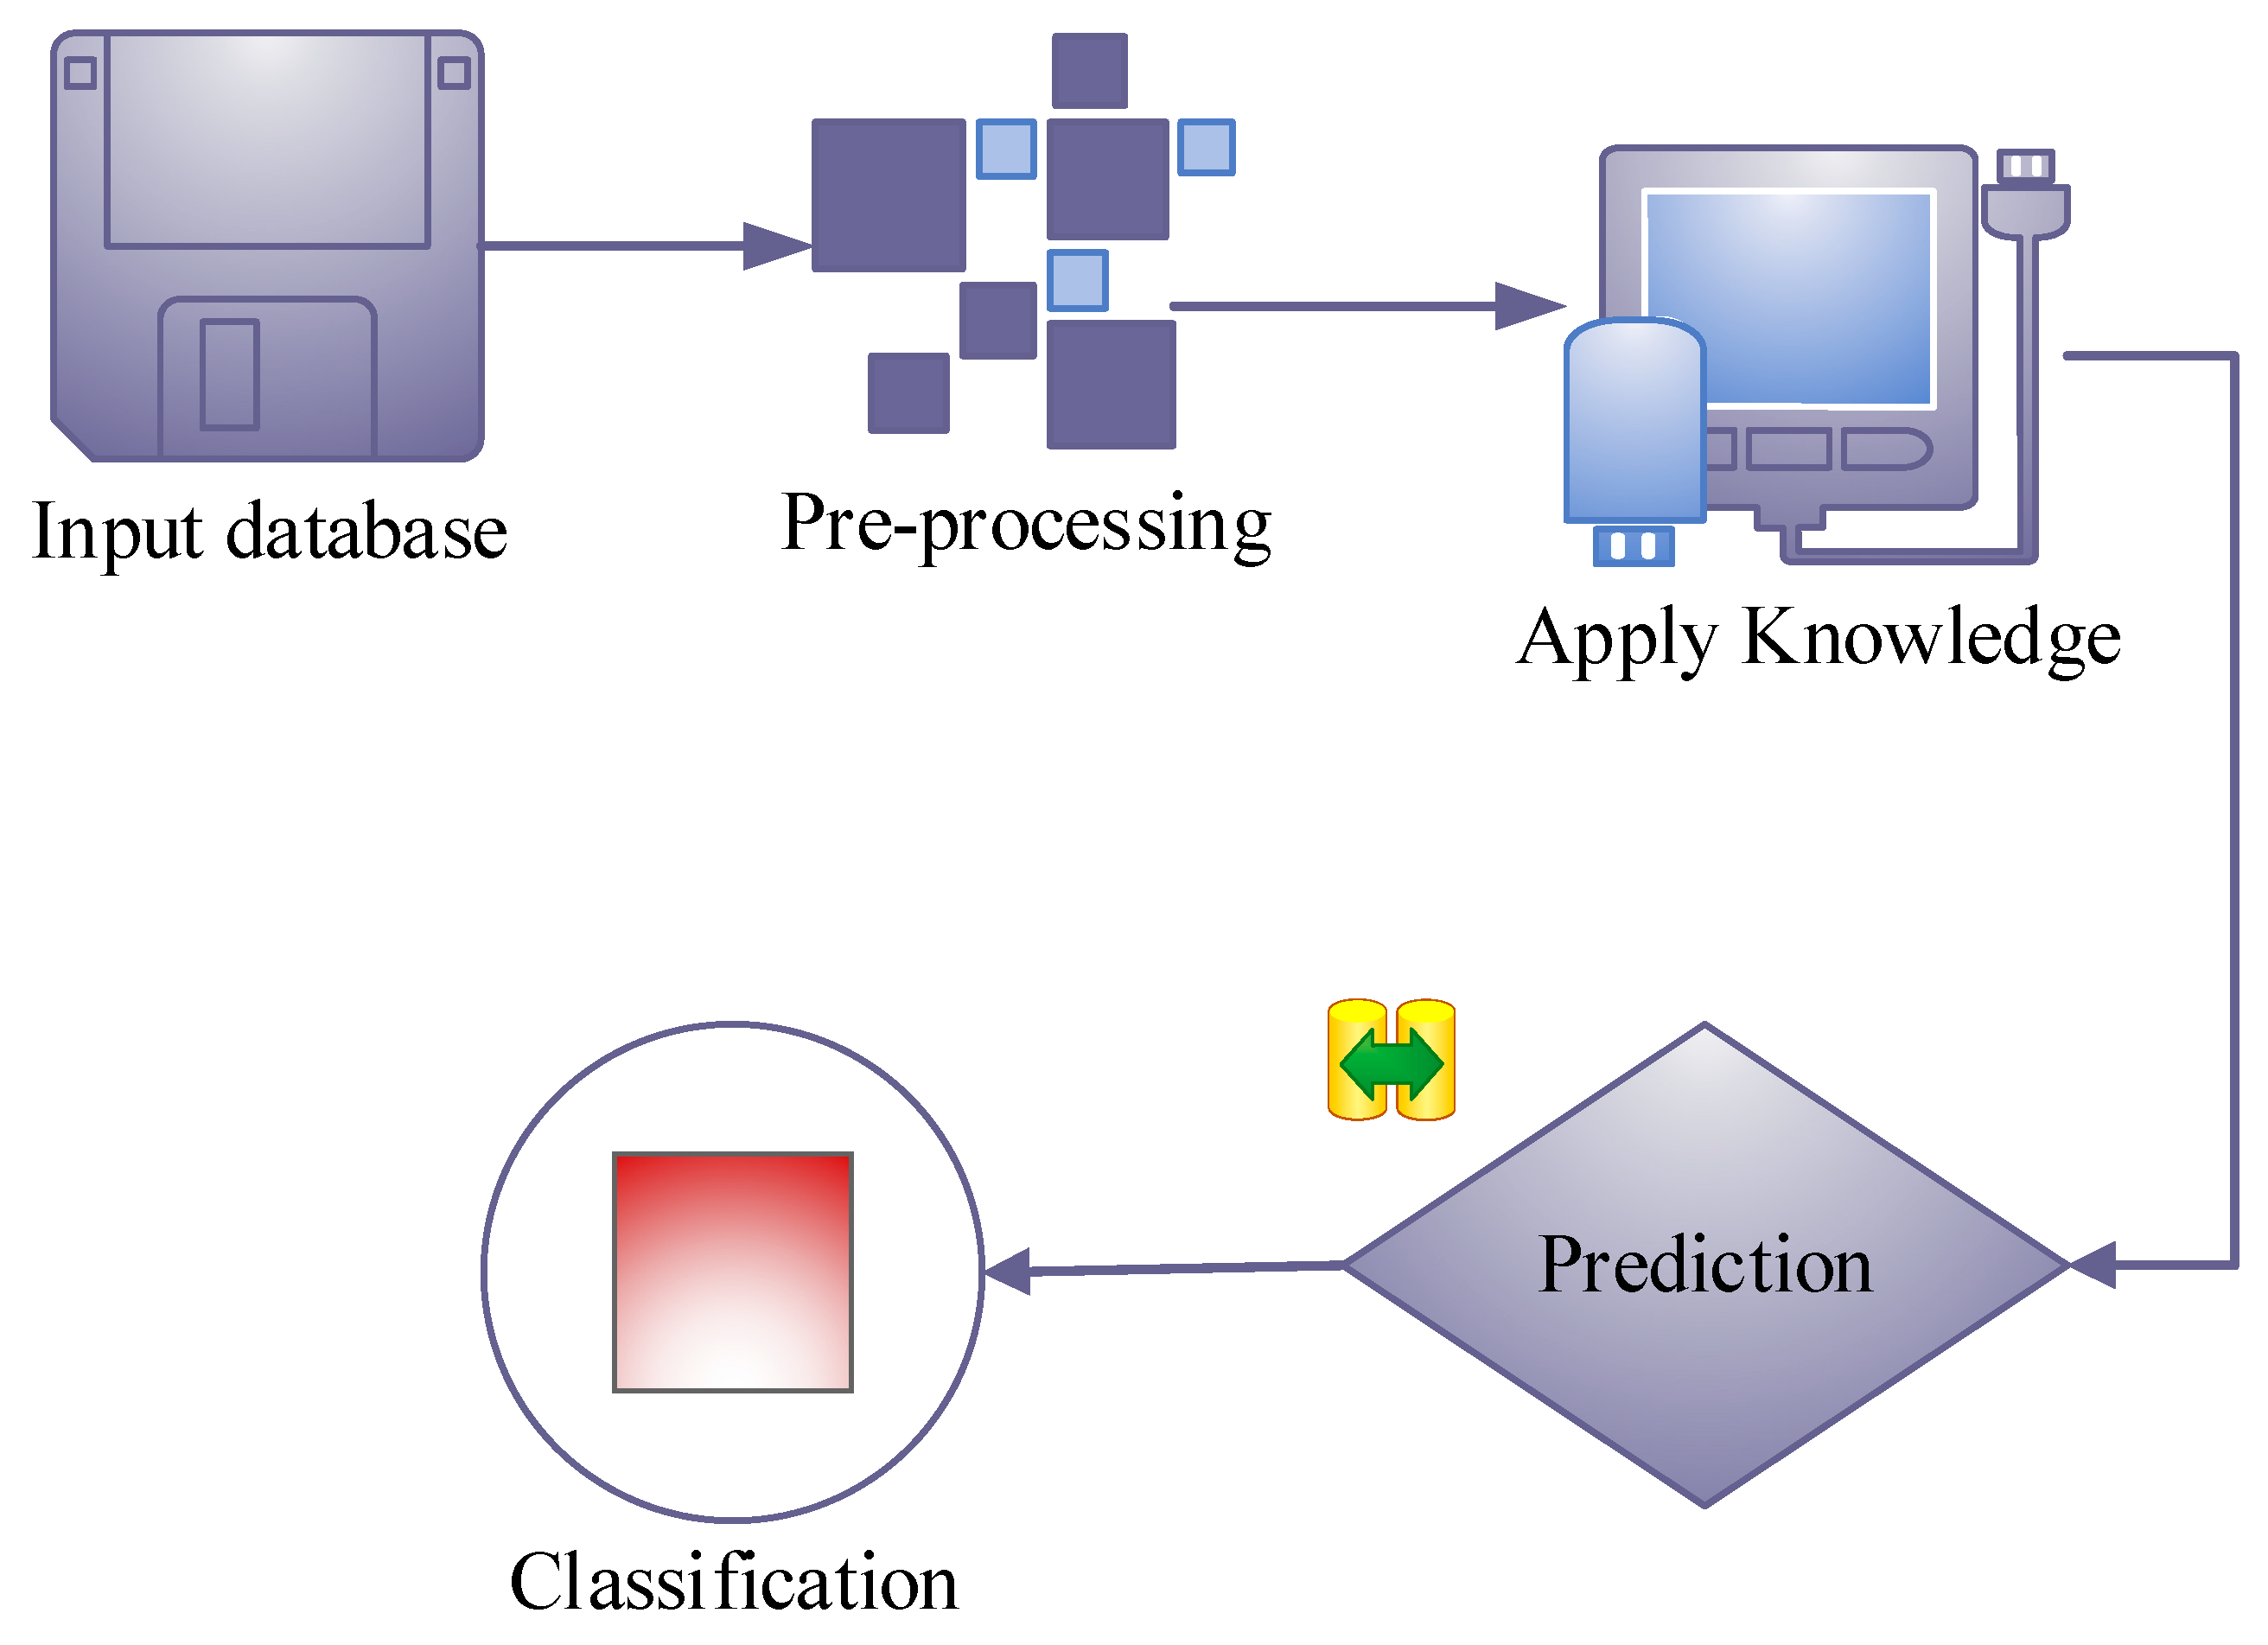
4. Proposed Methodology
4.1. Apply Sensors in the Human Body
Internet of Things
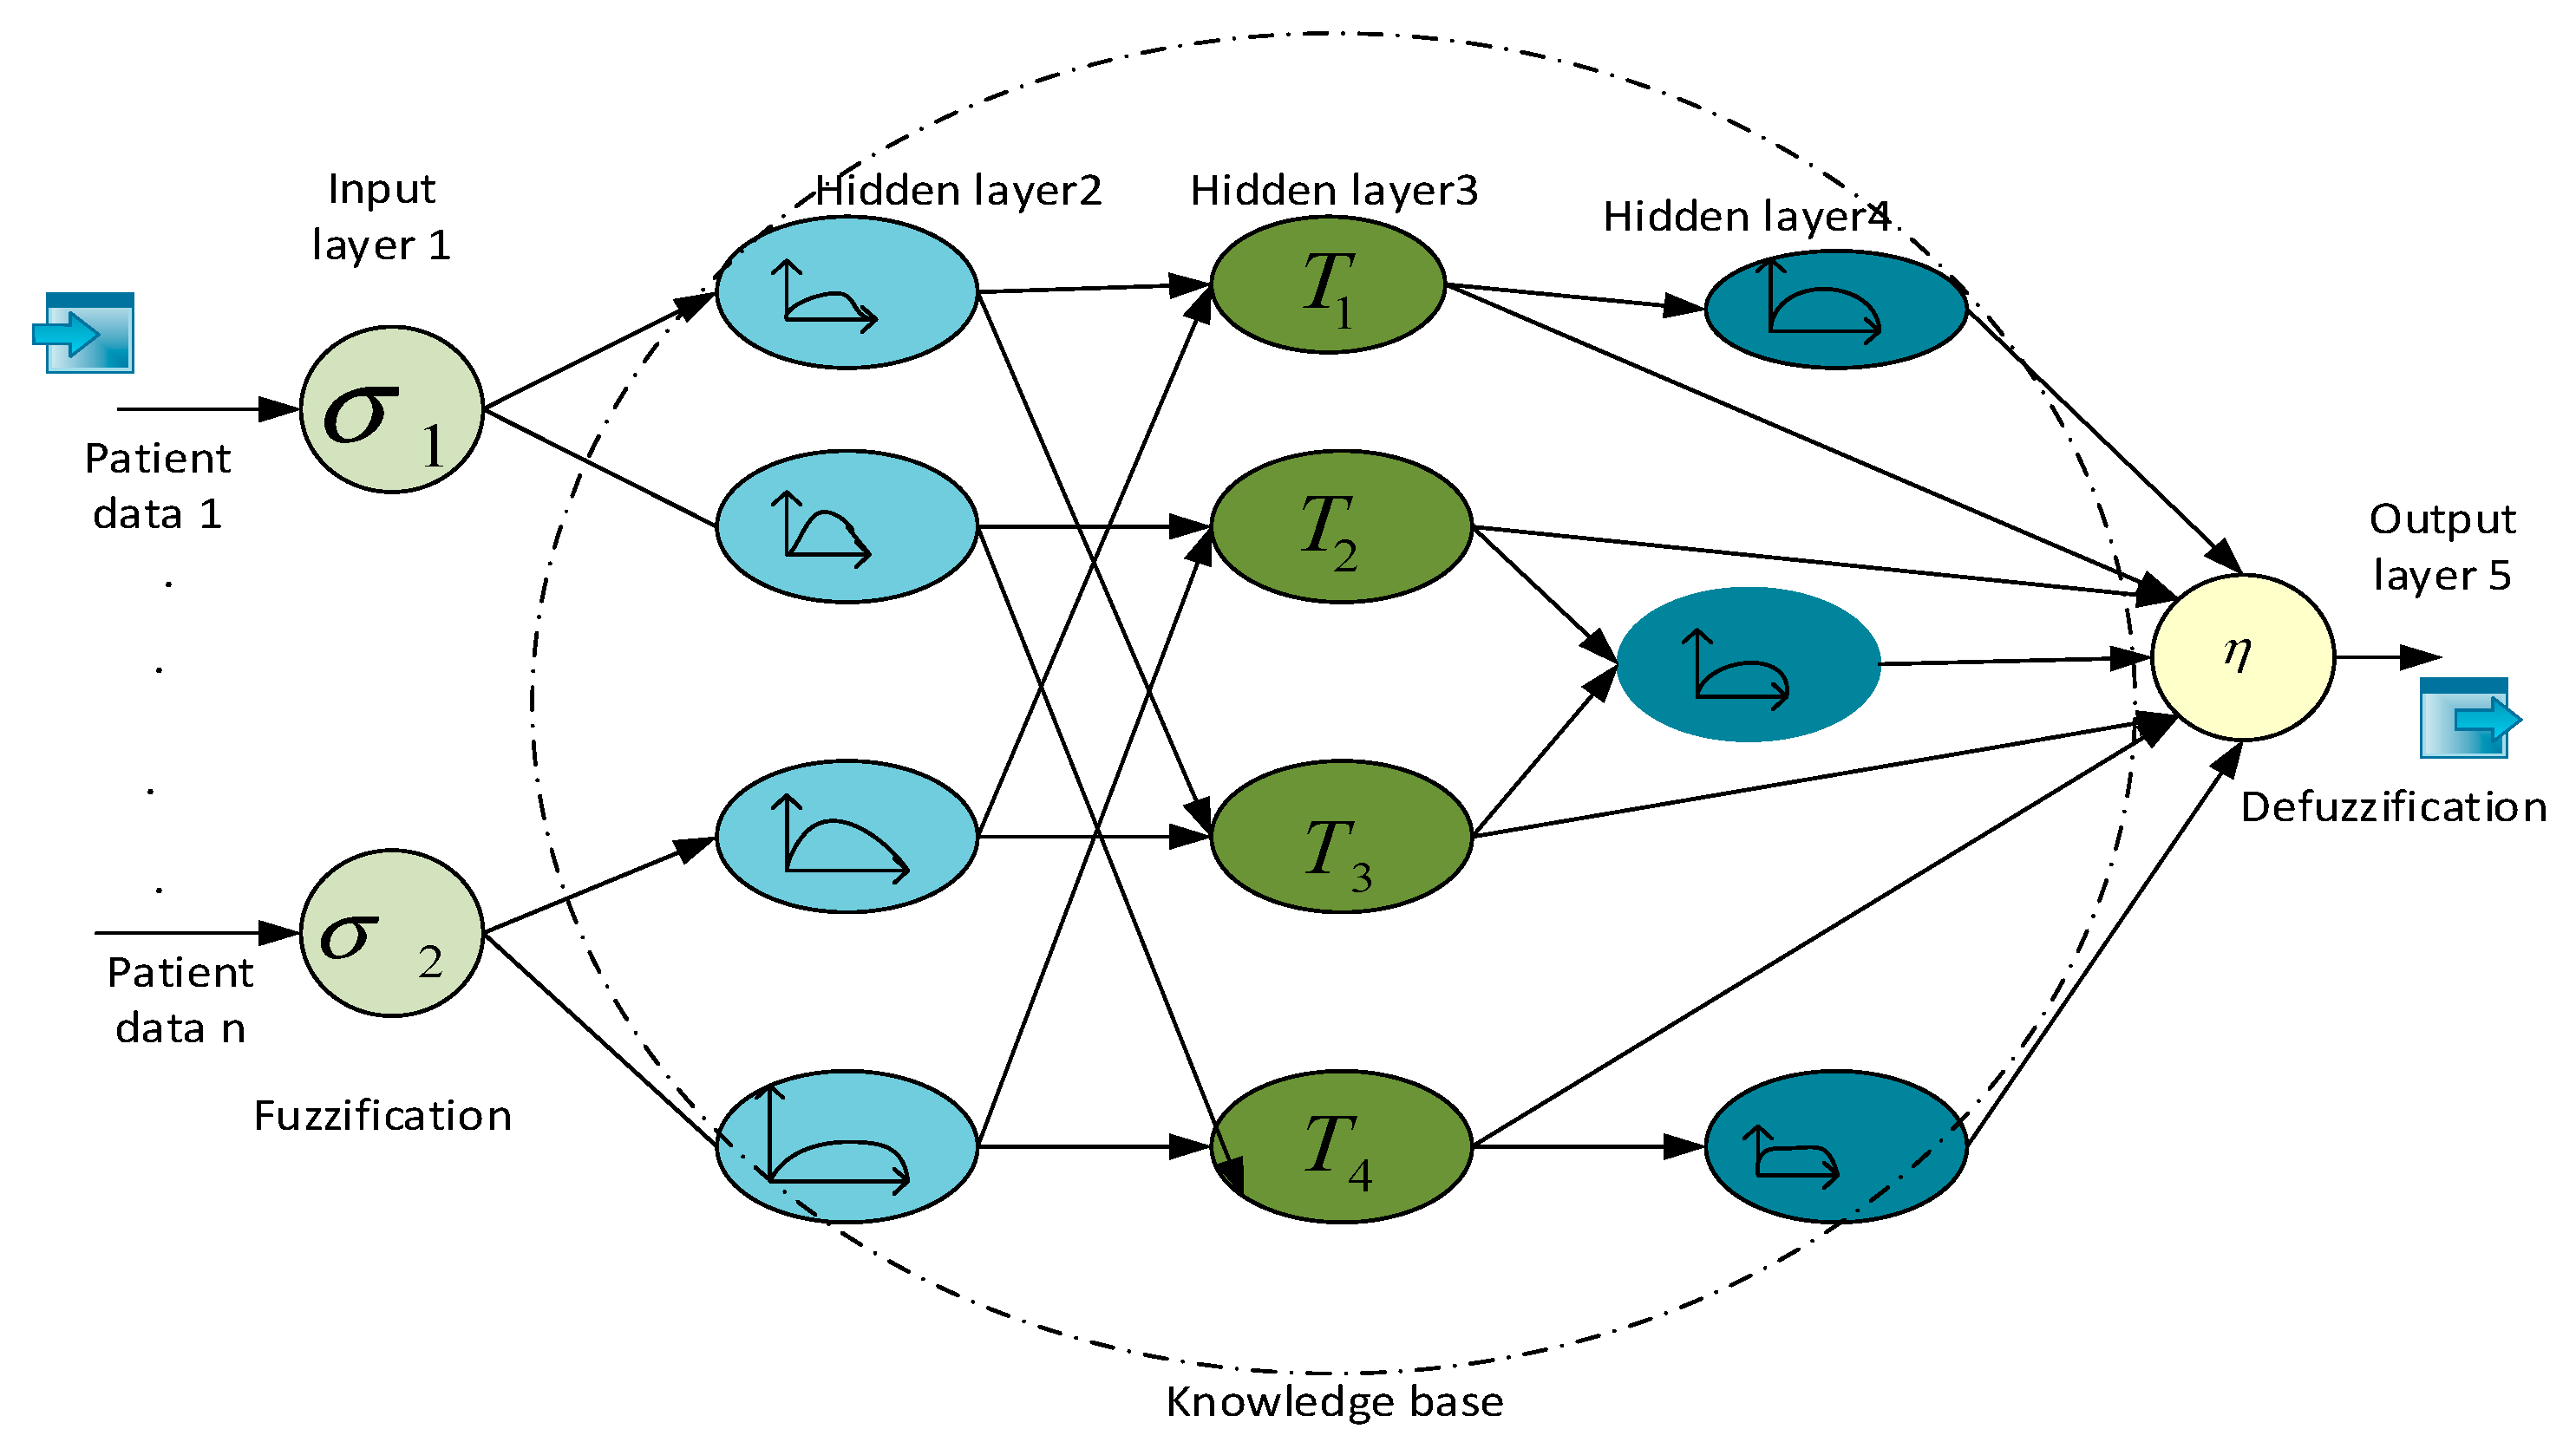
4.2. GARIC Architecture with Regression Rule
4.2.1. Diseases Prediction Using Regression Tree Rule
4.2.2. Predict The Symptoms of Particular Diagnosis
4.3. Ant Lion Optimizer
| Algorithm 1: GARLIC-ALO | ||
| 1 | Start() | |
| 2 | { | |
| 3 | Input | |
| 4 | ||
| 5 | Fuzzy function () | |
| 6 | { | |
| 7 | ||
| 8 | //removing unwanted noise from the bio-signal | |
| 9 | } | |
| 10 | Feature exaction () | |
| 11 | { | |
| 12 | ||
| 13 | //exacting the feature of data | |
| 14 | } | |
| 15 | ALO_fitness () | |
| 16 | { | |
| 17 | ||
| 18 | Heartbeat rate () | |
| 19 | { | |
| 20 | 60–100 beats/min //normal heart beat range | |
| 21 | >60–100 beats/min //high heart beat range | |
| 22 | <60–100 beats/min //low heart beat range | |
| 23 | } | |
| 24 | Respiratory rate() | |
| 25 | { | |
| 26 | 12–18 breaths/min, Normal; <12–18 breaths/min High; >12–18 breaths/min Low | |
| 27 | } | |
| 28 | Diastolic blood pressure() | |
| 29 | { | |
| 30 | 60–90 mmHg, Normal; >60–90 mmHg, High; <60–90 mmHg, Low. | |
| 31 | } | |
| 32 | Systolic blood pressure() | |
| 33 | { | |
| 34 | 90–120 mmHg, Normal(0); >90–120 mmHg, High(2); <90–120 mmHg, Low(−1) | |
| 35 | } | |
| 36 | LDL cholesterol () | |
| 37 | { | |
| 38 | 100–129 mg/dL, Normal(0); >129 mg/dL, High(1) | |
| 39 | } | |
| 40 | HDL cholesterol | |
| 41 | { | |
| 42 | 41–59 mg/dL, Normal(0); >59 mg/dL, High(0) | |
| 43 | } | |
| 44 | Total cholesterol | |
| 45 | { | |
| 46 | 200 mg/dL, Normal(0); >200 mg/dL, High(1) | |
| 47 | } | |
| 48 | Body temperature | |
| 49 | { | |
| 50 | 97–99F, normal(0); >99F, High(1) | |
| 51 | } | |
| 52 | } | |
| 53 | Output | |
| 54 | { | |
| 55 | Heart-disease(0); Diabetic(1); High-Cholesterol(2); Kidney-failure(3); Hypertension(4) | |
| 56 | } | |
| 57 | } | |
| 58 | End | |
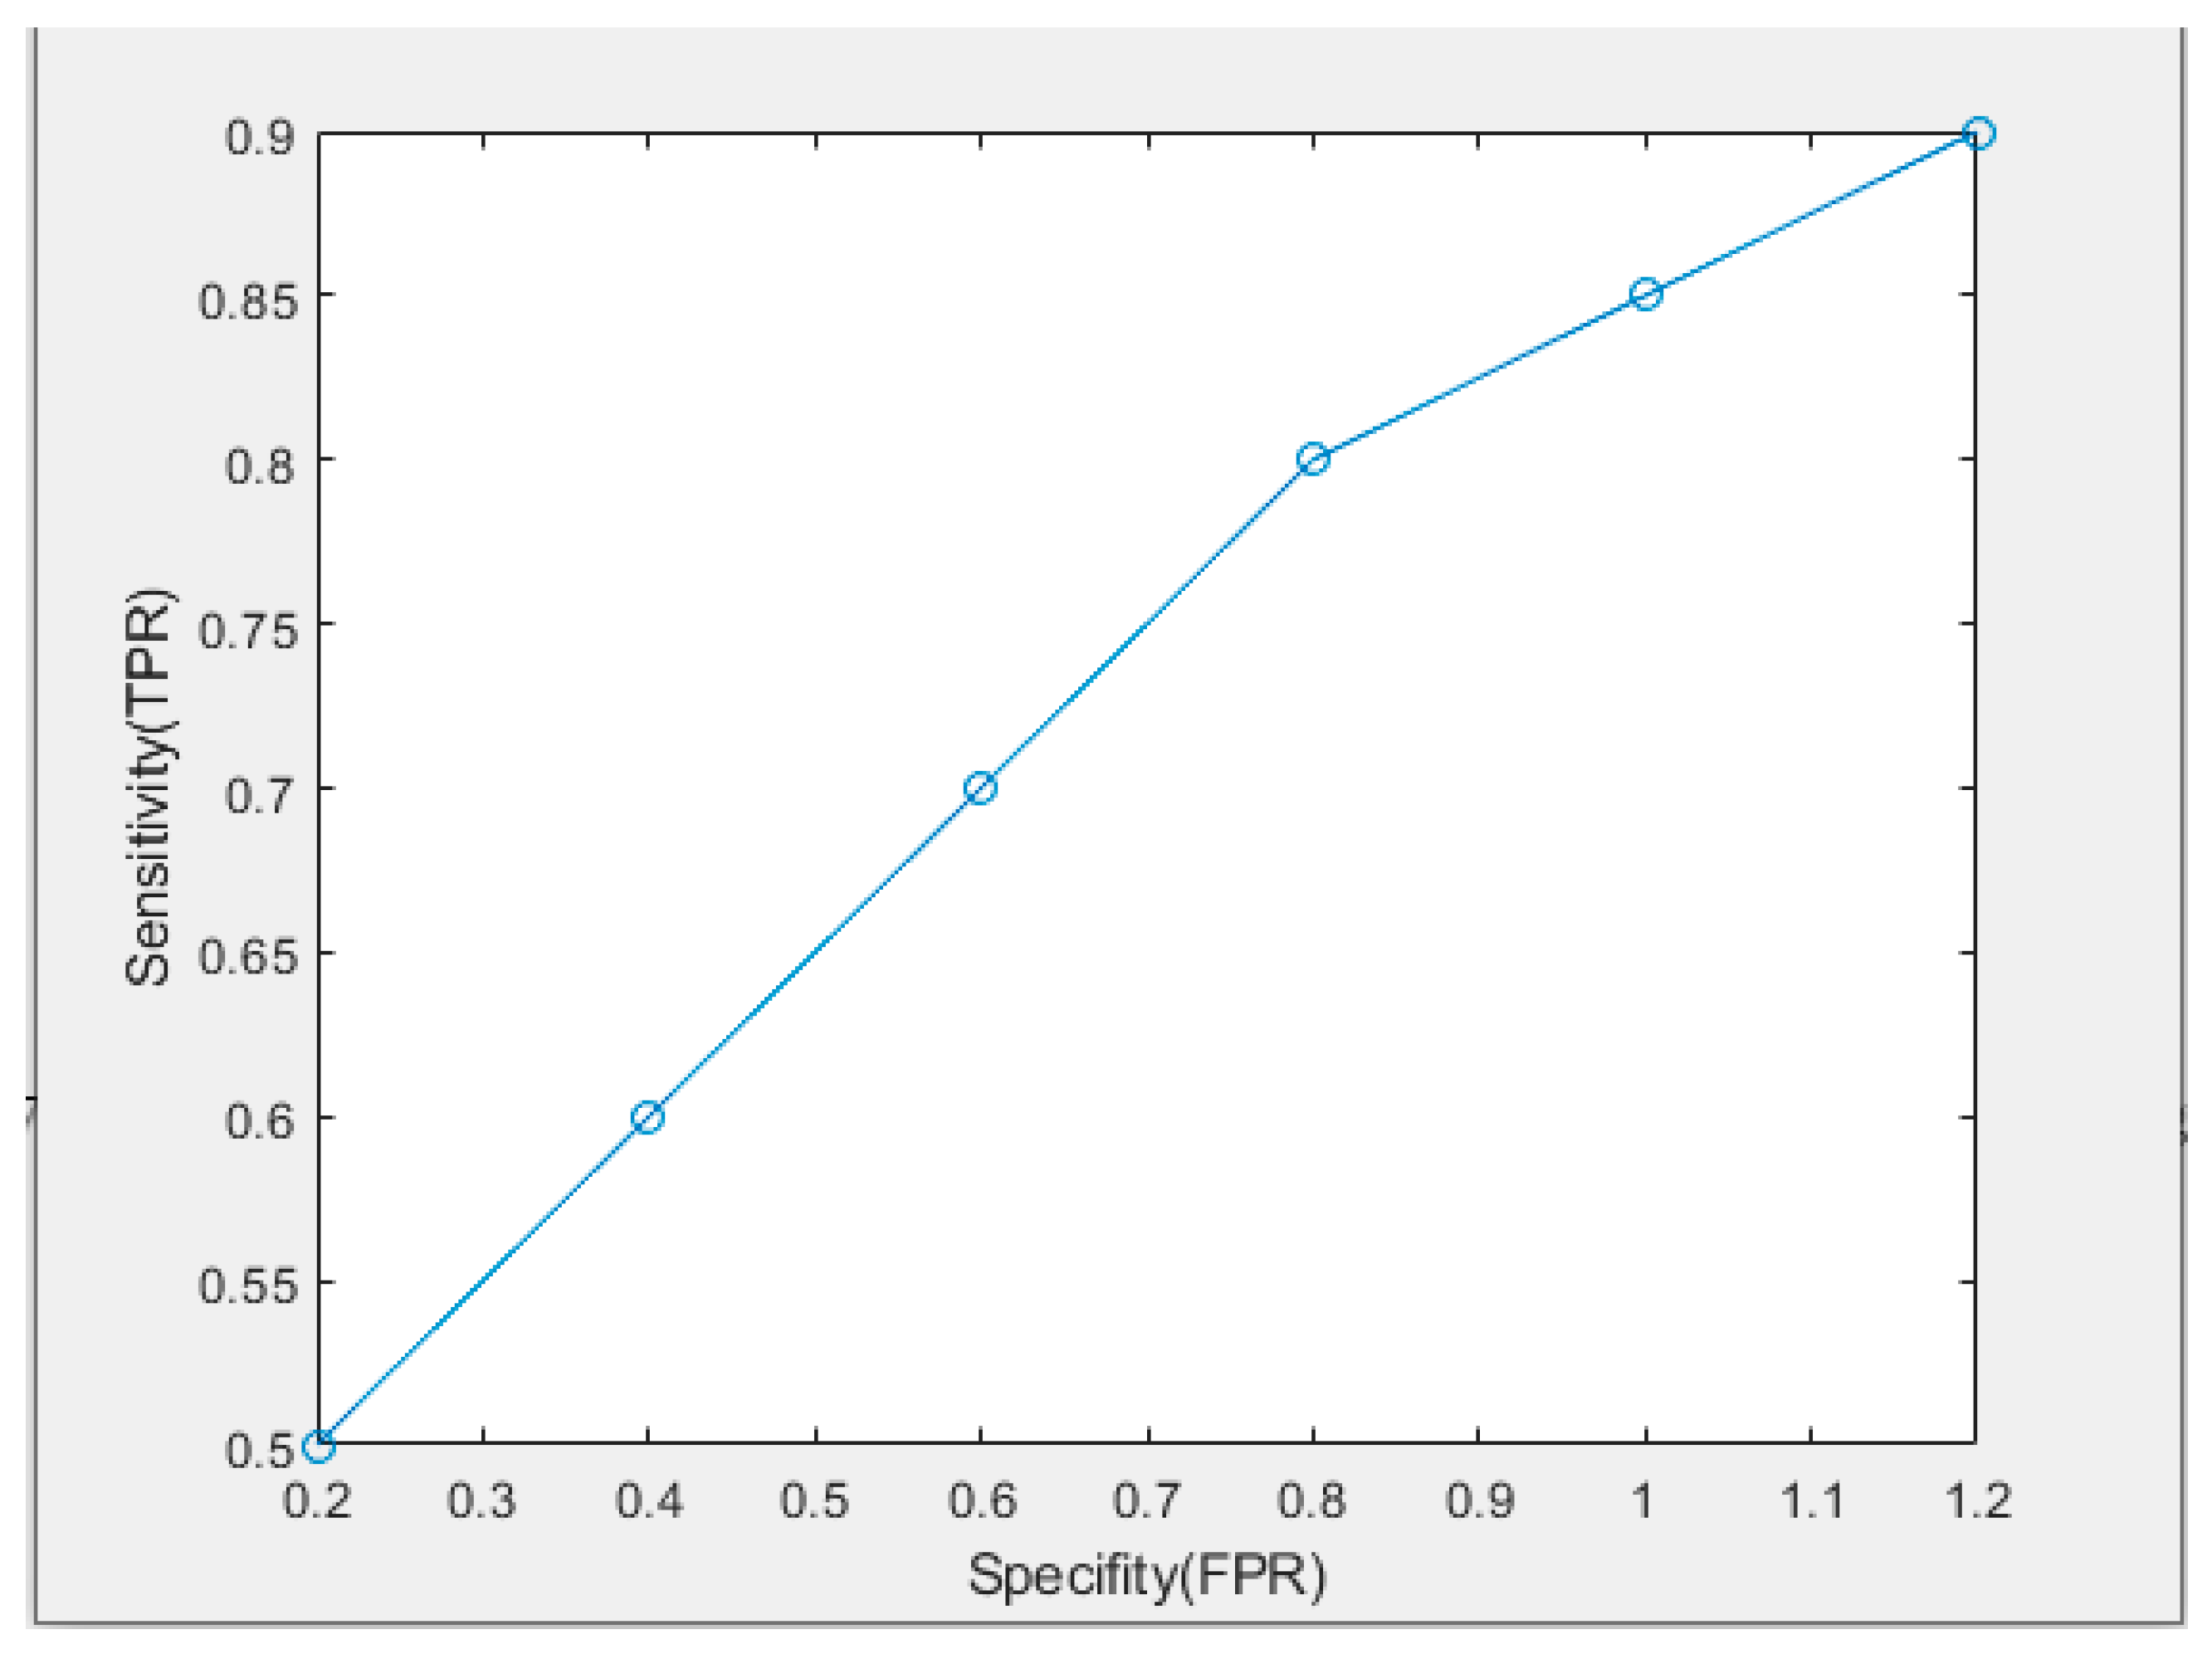
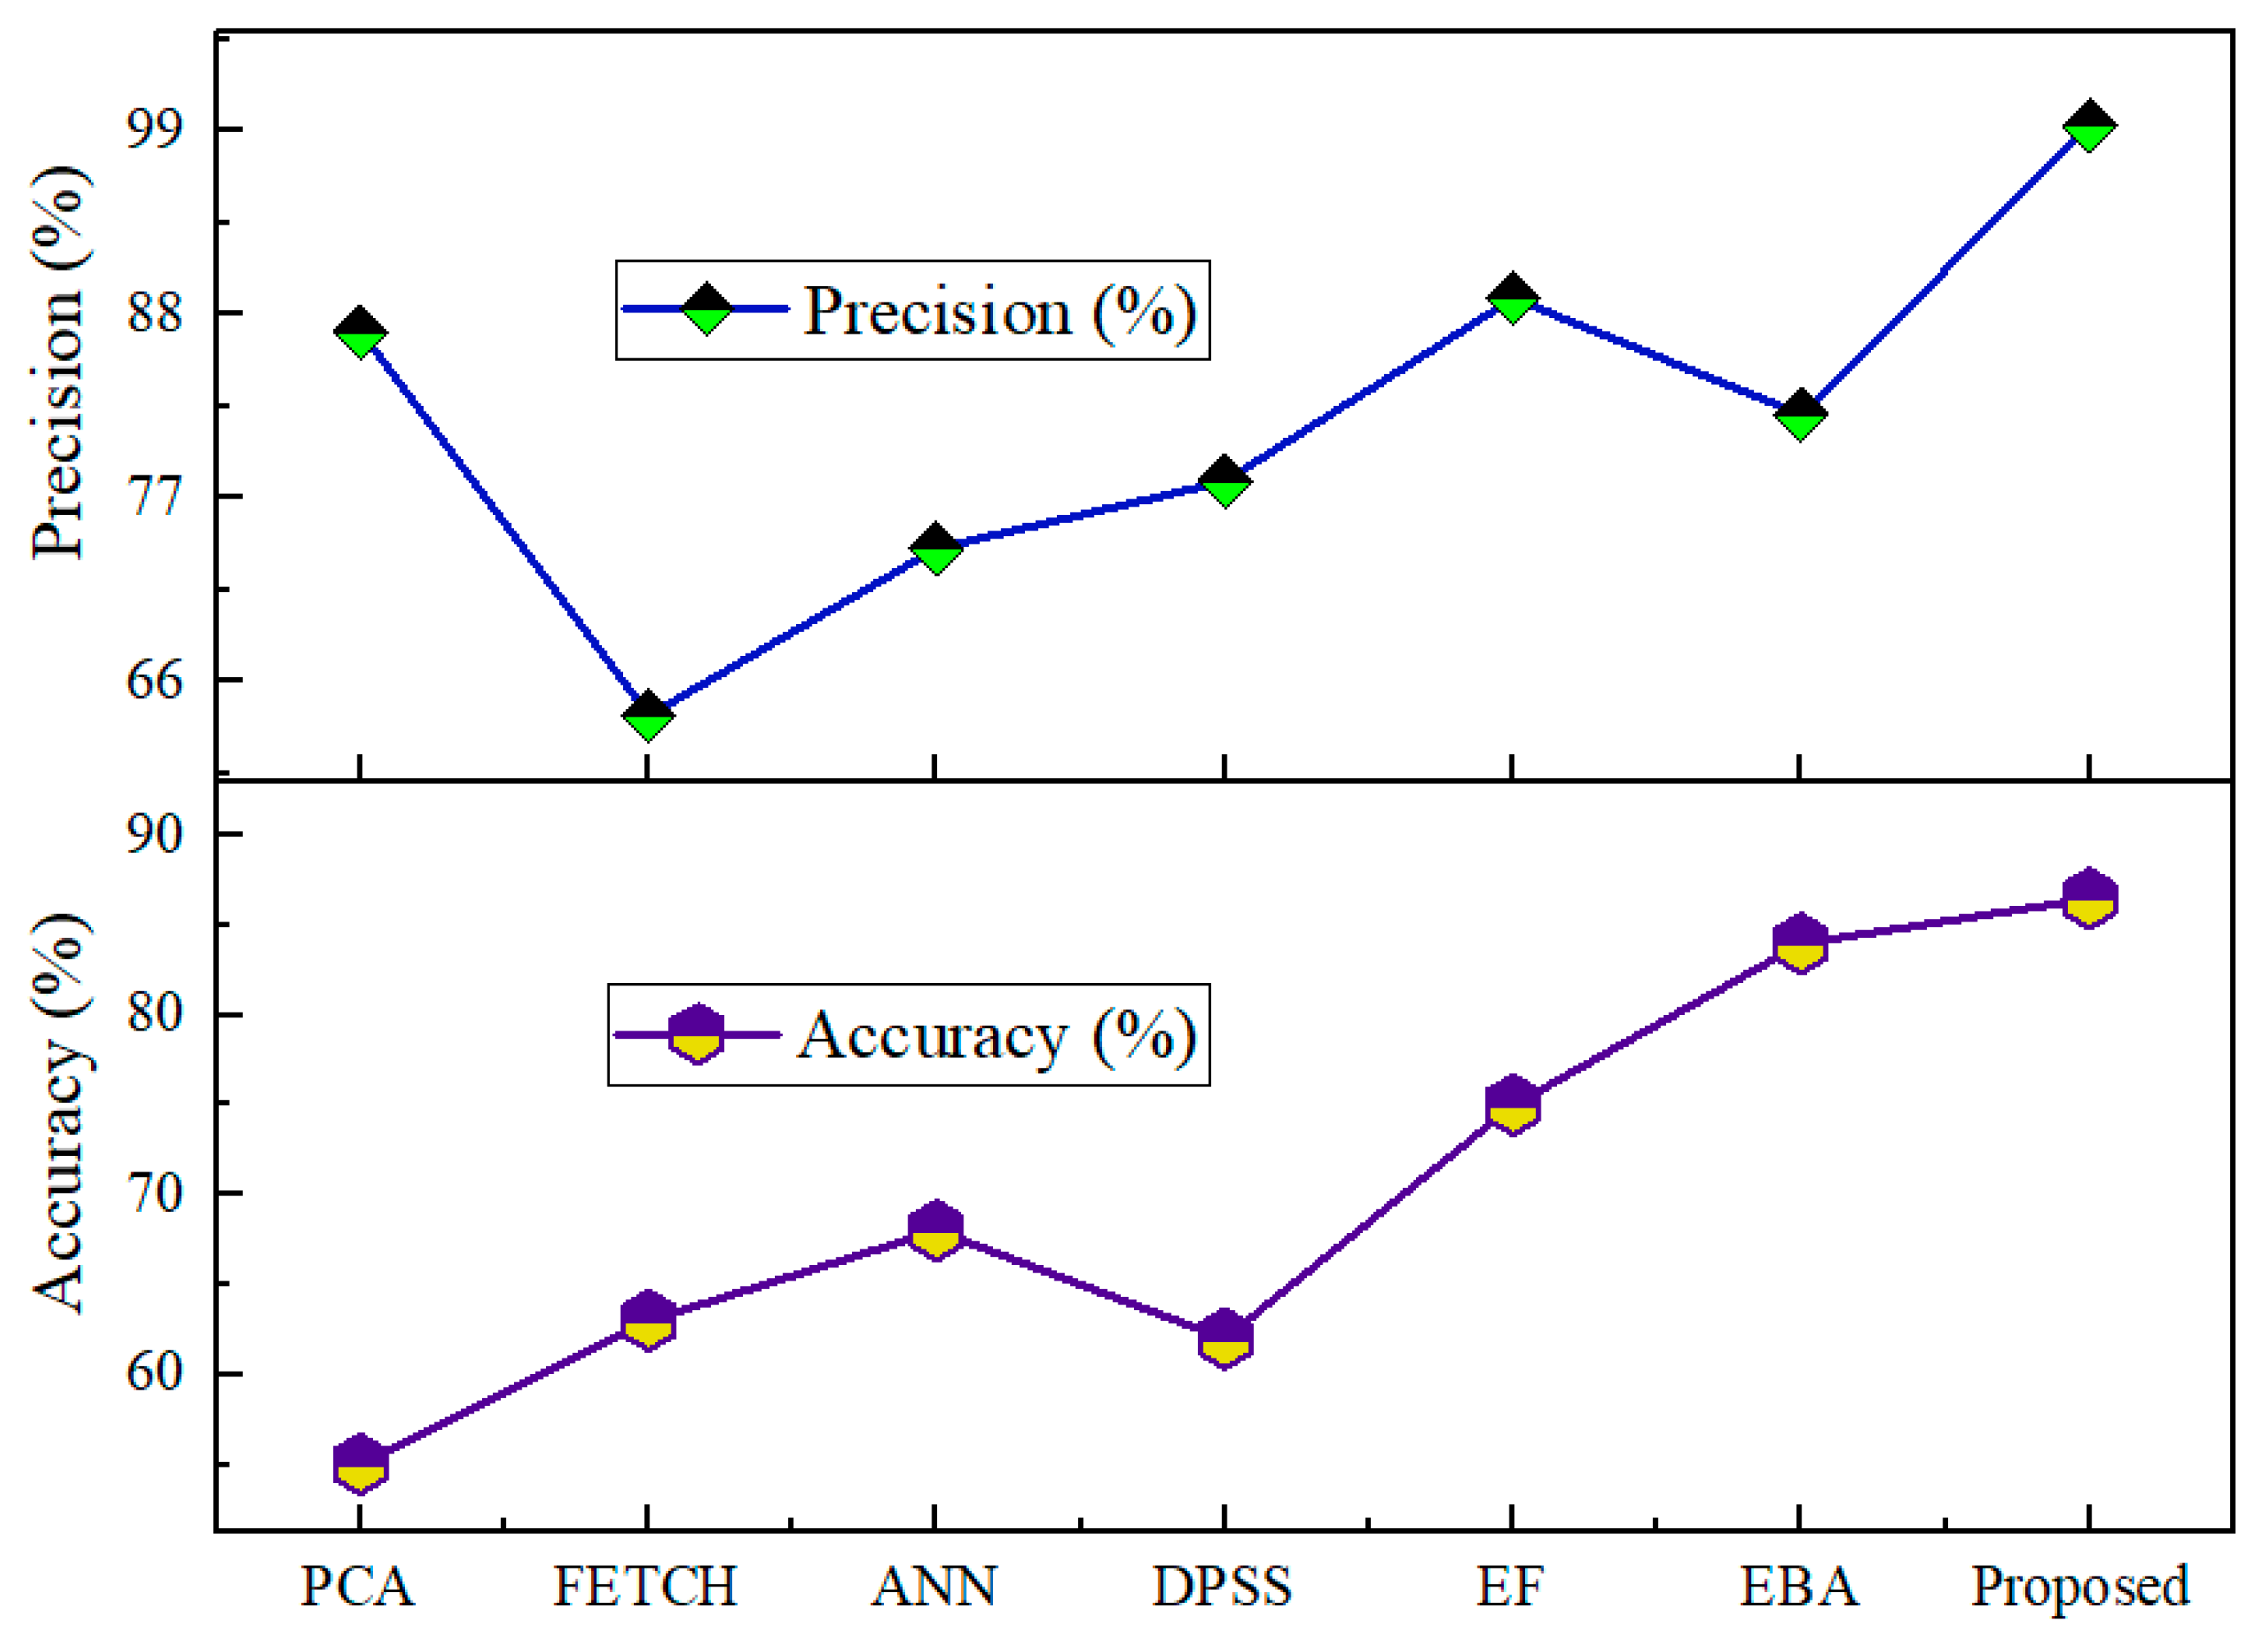
5. Result and Discussion
Performance
6. Conclusions
Author Contributions
Funding
Institutional Review Board Statement
Informed Consent Statement
Data Availability Statement
Conflicts of Interest
Nomenclature
| Notation | Definition |
| Estimation derivative | |
| D | Control the curvature |
| T | Hidden layer |
| L | Minimum operators |
| change in parameter values of gradient | |
| derivatives consequent labels | |
| S (t) | stochastic feature |
| saving the position concerning every ant | |
| M | Number regarding ant |
| B | |
| saving the position concerning each ant | |
| D | range on the variable |
| G | objective function |
| True negative | |
| True positive | |
| False positive | |
| False-negative | |
| NPV | negative predictive value |
| PPV | positive predictive value |
References
- Shahidul, I.M.; Islam, M.T.; Almutairi, A.F.; Beng, G.K.; Misran, N.; Amin, N. Monitoring of the human body signal through the Internet of Things (IoT) based LoRa wireless network system. Appl. Sci. 2019, 9, 1884. [Google Scholar] [CrossRef]
- Selvaraj, S.; Sundaravaradhan, S. Challenges and opportunities in IoT healthcare systems: A systematic review. Appl. Sci. 2019, 2, 1–8. [Google Scholar] [CrossRef]
- Naik, S.; Sudarshan, E. Smart healthcare monitoring system using Raspberry Pi on IoT platform. J. Eng. Appl. Sci. 2019, 14, 872–876. [Google Scholar]
- Karthick, R.A.; Manoj, P.; Selvaprasanth, P. Internet of things based high security border surveillance strategy. Asian J. Appl. Sci. Technol. 2019, 3, 94–100. [Google Scholar]
- Yang, Y.; Nan, F.; Yang, P.; Meng, Q.; Xie, Y.; Zhang, D.; Muhammad, K. GAN-based semi-supervised learning approach for clinical decision support in health-IoT platform. IEEE Access 2019, 7, 8048–8057. [Google Scholar] [CrossRef]
- Sony, P.; Sureshkumar, N. Concept-Based Electronic Health Record Retrieval System in Healthcare IoT. Cognitive Informatics and Soft Computing; Springer: Berlin/Heidelberg, Germany, 2019; pp. 175–188. [Google Scholar]
- Hao, Y.; Usama, M.; Yang, J.; Hossain, M.S.; Ghoneim, A. Recurrent convolutional neural network based multimodal disease risk prediction. Futur. Gener. Comput. Syst. 2018, 92, 76–83. [Google Scholar] [CrossRef]
- DeMartini, J.; Fenton, J.J.; Epstein, R.; Duberstein, P.; Cipri, C.; Tancredi, D.; Xing, G.; Kaesberg, P.; Kravitz, R.L. Patients’ Hopes for Advanced Cancer Treatment. J. Pain Symptom Manag. 2018, 57, 57–63. [Google Scholar] [CrossRef]
- Chou, F.-I.; Huang, T.-H.; Yang, P.-Y.; Lin, C.-H.; Lin, T.-C.; Ho, W.-H.; Chou, J.-H. Controllability of Fractional-Order Particle Swarm Optimizer and Its Application in the Classification of Heart Disease. Appl. Sci. 2021, 11, 11517. [Google Scholar] [CrossRef]
- Reddy, K.V.; Elamvazuthi, I.; Aziz, A.A.; Paramasivam, S.; Chua, H.N.; Pranavanand, S. Heart disease risk prediction using machine learning classifiers with attribute evaluators. Appl. Sci. 2021, 11, 8352. [Google Scholar] [CrossRef]
- Chen, J.-J.; Su, T.Y.; Chen, W.S.; Chang, Y.H.; Lu, H.H.S. Convolutional neural network in the evaluation of myocardial ischemia from czt spect myocardial perfusion imaging: Comparison to automated quantification. Appl. Sci. 2021, 11, 514. [Google Scholar] [CrossRef]
- Melgarejo-Meseguer, F.-M.; Gimeno-Blanes, F.-J.; Salar-Alcaraz, M.-E.; Gimeno-Blanes, J.-R.; Martínez-Sánchez, J.; García-Alberola, A.; Rojo-Álvarez, J.L. Electrocardiographic Fragmented Activity (II): A Machine Learning Approach to Detection. Appl. Sci. 2019, 9, 3565. [Google Scholar] [CrossRef]
- Mastoi, Q.-U.; Wah, T.Y.; Raj, R.G. Reservoir Computing Based Echo State Networks for Ventricular Heart Beat Classification. Appl. Sci. 2019, 9, 702. [Google Scholar] [CrossRef] [Green Version]
- Talal, M.; Zaidan, A.A.; Zaidan, B.B.; Albahri, A.S.; Alamoodi, A.H.; Albahri, O.S.; Alsalem, M.A.; Lim, C.K.; Tan, K.L.; Shir, W.L.; et al. Smart Home-based IoT for Real-time and Secure Remote Health Monitoring of Triage and Priority System using Body Sensors: Multi-driven Systematic Review. J. Med. Syst. 2019, 43, 42. [Google Scholar] [CrossRef]
- Malathi, D.; Logesh, R.; Subramaniyaswamy, V.; Vijayakumar, V.; Sangaiah, A.K. Hybrid reasoning-based privacy-aware disease prediction support system. Comput. Electr. Eng. 2019, 73, 114–127. [Google Scholar]
- El Zouka, H.A.; Hosni, M.M. Secure IoT Communications for Smart Healthcare Monitoring System. Internet Things 2019, 13, 100036. [Google Scholar] [CrossRef]
- Carvalho, J.V.; Rocha, Á.; van de Wetering, R.; Abreu, A. A Maturity model for hospital information systems. J. Bus. Res. 2019, 94, 388–399. [Google Scholar] [CrossRef]
- Pace, P.; Aloi, G.; Gravina, R.; Caliciuri, G.; Fortino, G.; Liotta, A. An Edge-Based Architecture to Support Efficient Applications for Healthcare Industry 4.0. IEEE Trans. Ind. Inform. 2018, 15, 481–489. [Google Scholar] [CrossRef]
- Kaur, M.J. A Comprehensive Survey on Architecture for Big Data Processing in Mobile Edge Computing Environments. Edge Comput. 2019, 33–49. [Google Scholar] [CrossRef]
- Avola, D.; Cinque, L.; Foresti, G.L.; Marini, M.R. An interactive and low-cost full body rehabilitation framework based on 3D immersive serious games. J. Biomed. Inform. 2018, 89, 81–100. [Google Scholar] [CrossRef]
- Dautov, R.; Distefano, S.; Buyya, R. Hierarchical data fusion for Smart Healthcare. J. Big Data 2019, 6, 19. [Google Scholar] [CrossRef]
- Al-Tudjman, F. Security in IoT-Enabled Spaces; CRC Press: Boca Raton, FL, USA, 2019. [Google Scholar]
- Yousefpour, A.; Fung, C.; Nguyen, T.; Kadiyala, K.; Jalali, F.; Niakanlahiji, A.; Kong, J.; Jue, J.P. All one needs to know about fog computing and related edge computing paradigms: A complete survey. J. Syst. Archit. 2019, 98, 289–330. [Google Scholar] [CrossRef]
- Maes, K.; van Meerbeeck, L.; Reynders, E.; Lombaert, G. Validation of vibration-based structural health monitoring on retrofitted railway bridge KW51. Mech. Syst. Signal Process. 2021, 165, 108380. [Google Scholar] [CrossRef]
- Saeed, U.; Shah, S.Y.; Ahmad, J.; Imran, M.A.; Abbasi, Q.H. Machine learning empowered COVID-19 patient monitoring using non-contact sensing: An extensive review. J. Pharm. Anal. 2022, 12, 193–204. [Google Scholar] [CrossRef]
- Gupta, N.; Gupta, S.K.; Pathak, R.K.; Jain, V.; Rashidi, P.; Suri, J.S. Human activity recognition in artificial intelligence framework: A narrative review. Artif. Intell. Rev. 2022, 55, 4755–4808. [Google Scholar] [CrossRef]
- Baser, O.; Yavuz, M.; Ugurlu, K.; Onat, F.; Demirel, B.U. Automatic detection of the spike-and-wave discharges in absence epilepsy for humans and rats using deep learning. Biomed. Signal Process. Control 2022, 76, 103726. [Google Scholar] [CrossRef]
- Levrat-Guillen, F.; Ghazi, T. Cost-Effectiveness of Intermittently Scanned Continuous Glucose Monitoring Versus Advanced Hybrid Closed-Loop Systems in Type 1 Diabetes: Comment on Jendle et al. Diabetes Ther. 2022, 13, 1121–1123. [Google Scholar] [CrossRef]
- Available online: https://www.kaggle.com/code/infernop/iot-temperature-readings-data-health-checkup (accessed on 14 June 2022).
- Hamaya, R.; Yonetsu, T.; Kanaji, Y.; Usui, E.; Hoshino, M.; Hada, M.; Yoshinori, K.; Tadashi, M.; Tetsumin, L.; Tsunekazu, K. Interrelationship in the prognostic efficacy of regional coronary flow reserve, fractional flow reserve, high-sensitivity cardiac troponin-I and NT-proBNP in patients with stable coronary artery disease. Heart Vessel. 2019, 34, 410–418. [Google Scholar] [CrossRef]
- Radanliev, P.; De Roure, D.; Ani, U.; Carvalho, G. The ethics of shared COVID-19 risks: An epistemological framework for ethical health technology assessment of risk in vaccine supply chain infrastructures. Health Technol. 2021, 11, 1083–1091. [Google Scholar] [CrossRef] [PubMed]
- Radanliev, P.; De Roure, D. Epistemological and Bibliometric Analysis of Ethics and Shared Responsibility—Health Policy and IoT Systems. Sustainability 2021, 13, 8355. [Google Scholar] [CrossRef]


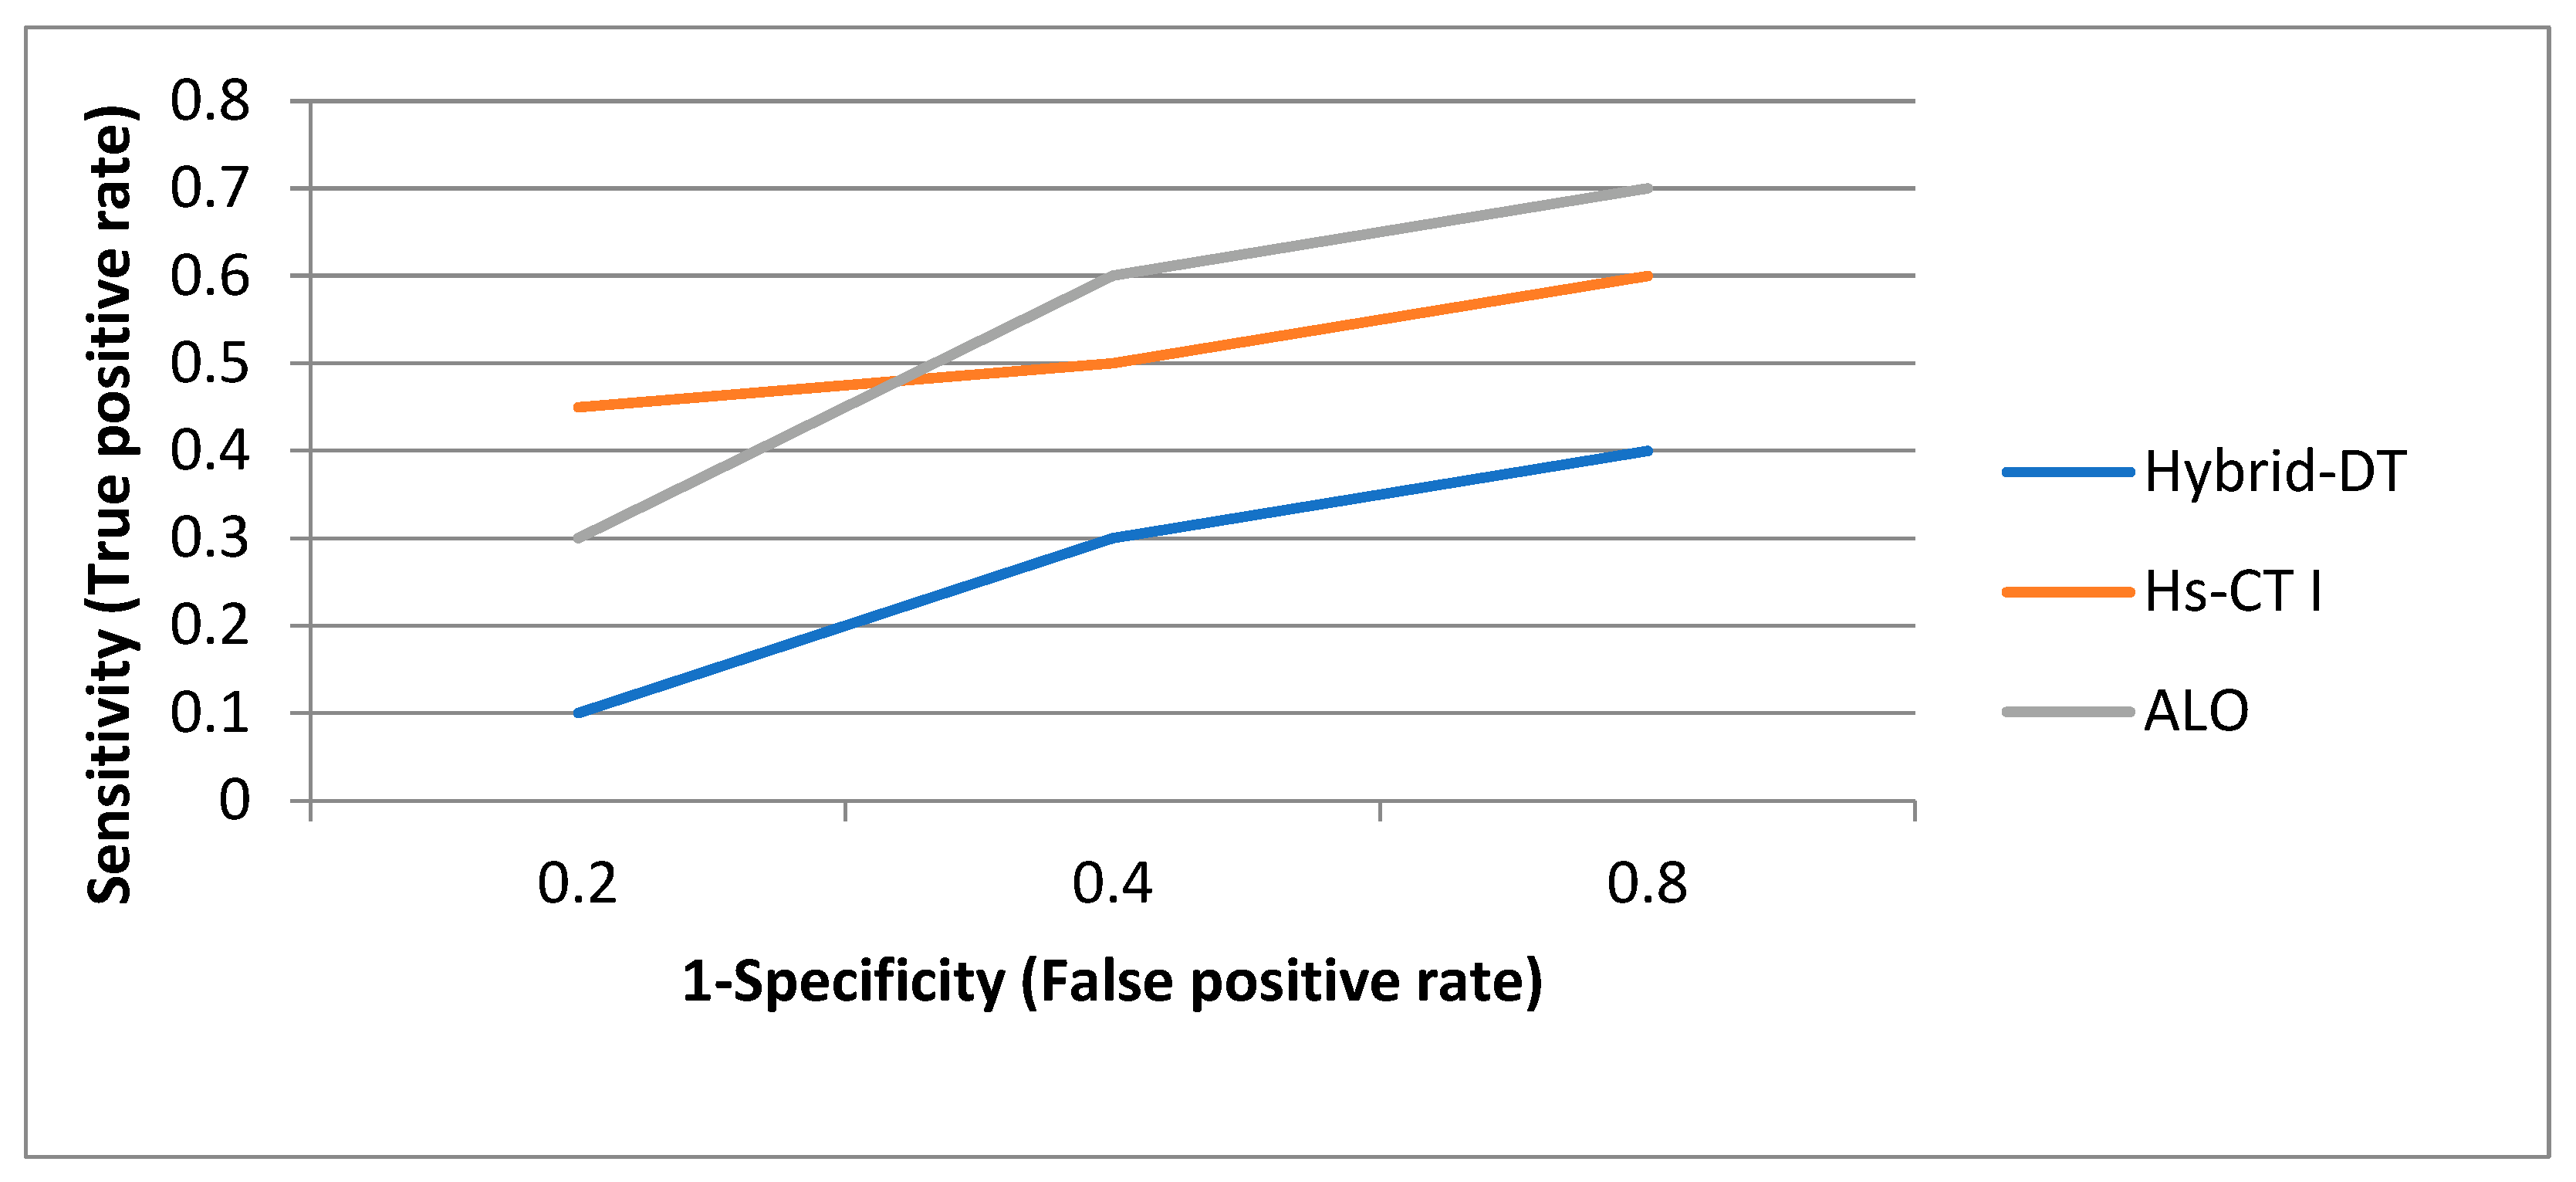
| False Positive Rate | Hybrid-DT [29] | Hs-CT I [29] | ALO |
|---|---|---|---|
| 0.2 | 0.1 | 0.45 | 0.3 |
| 0.4 | 0.3 | 0.5 | 0.6 |
| 0.8 | 0.4 | 0.6 | 0.7 |
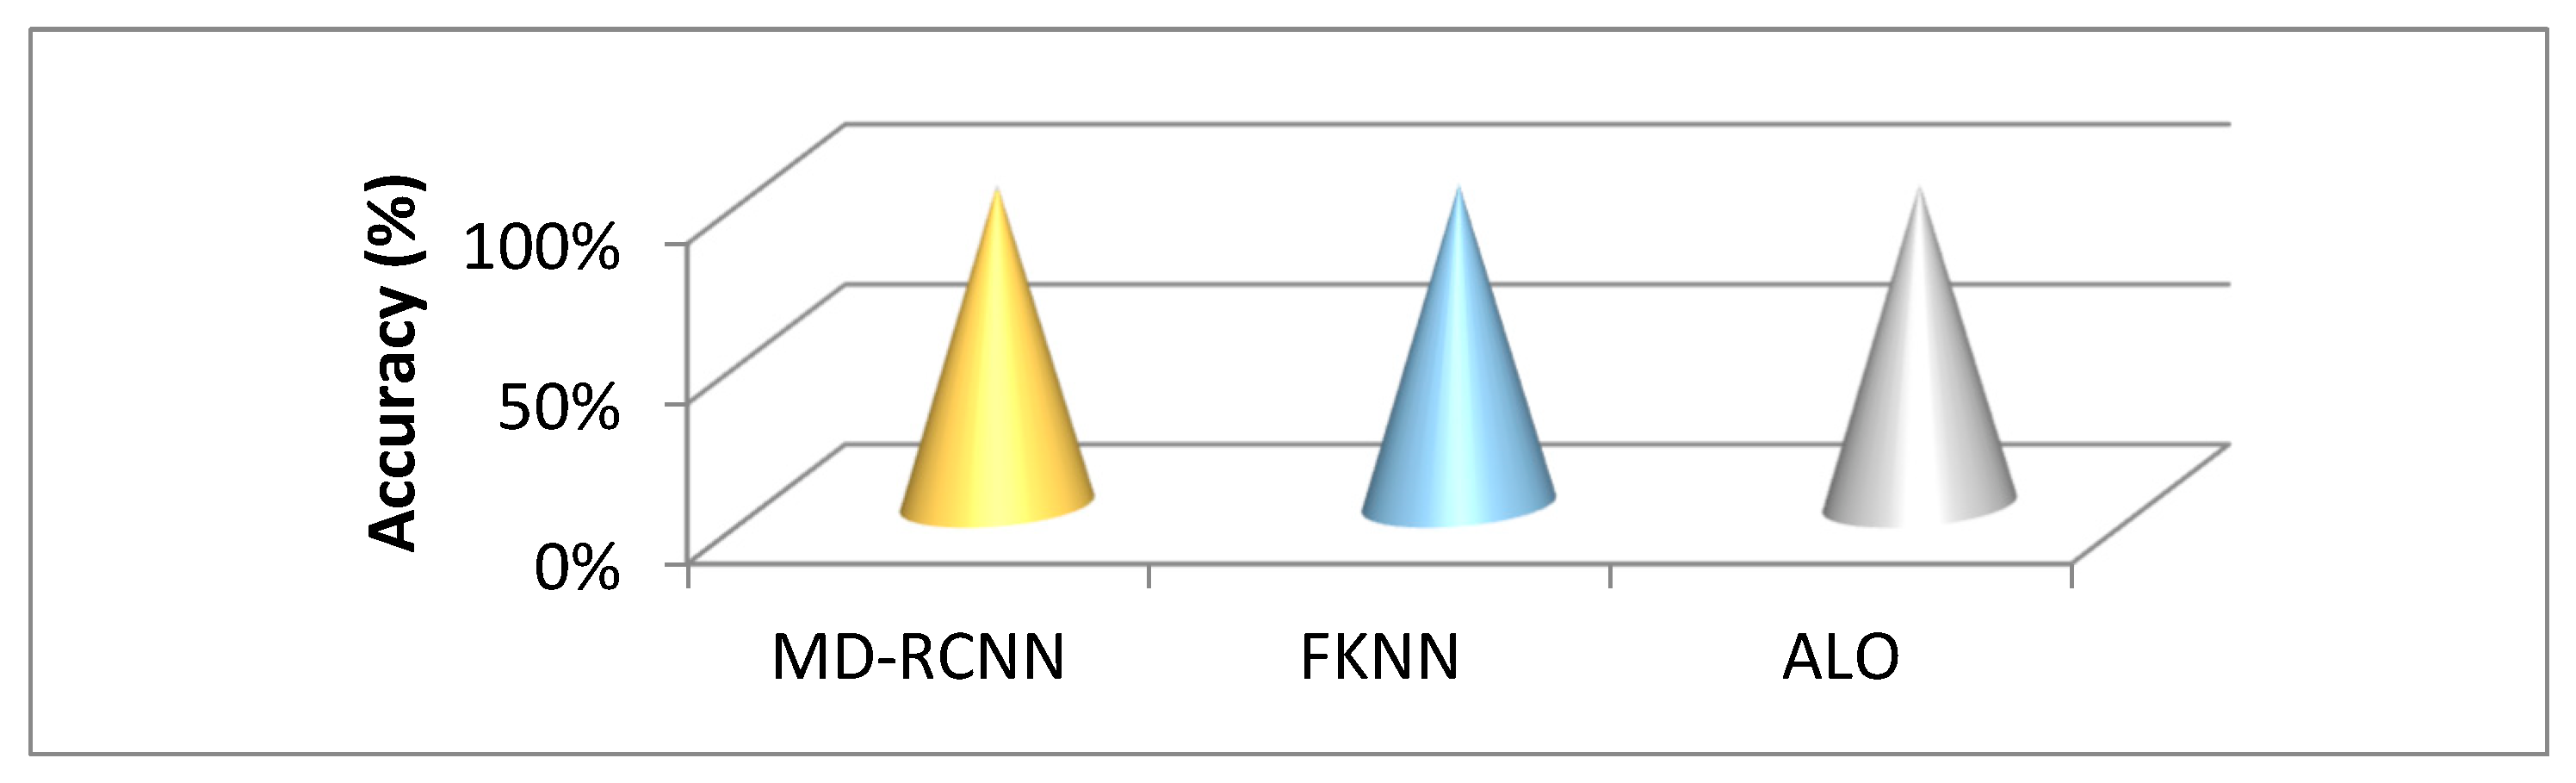
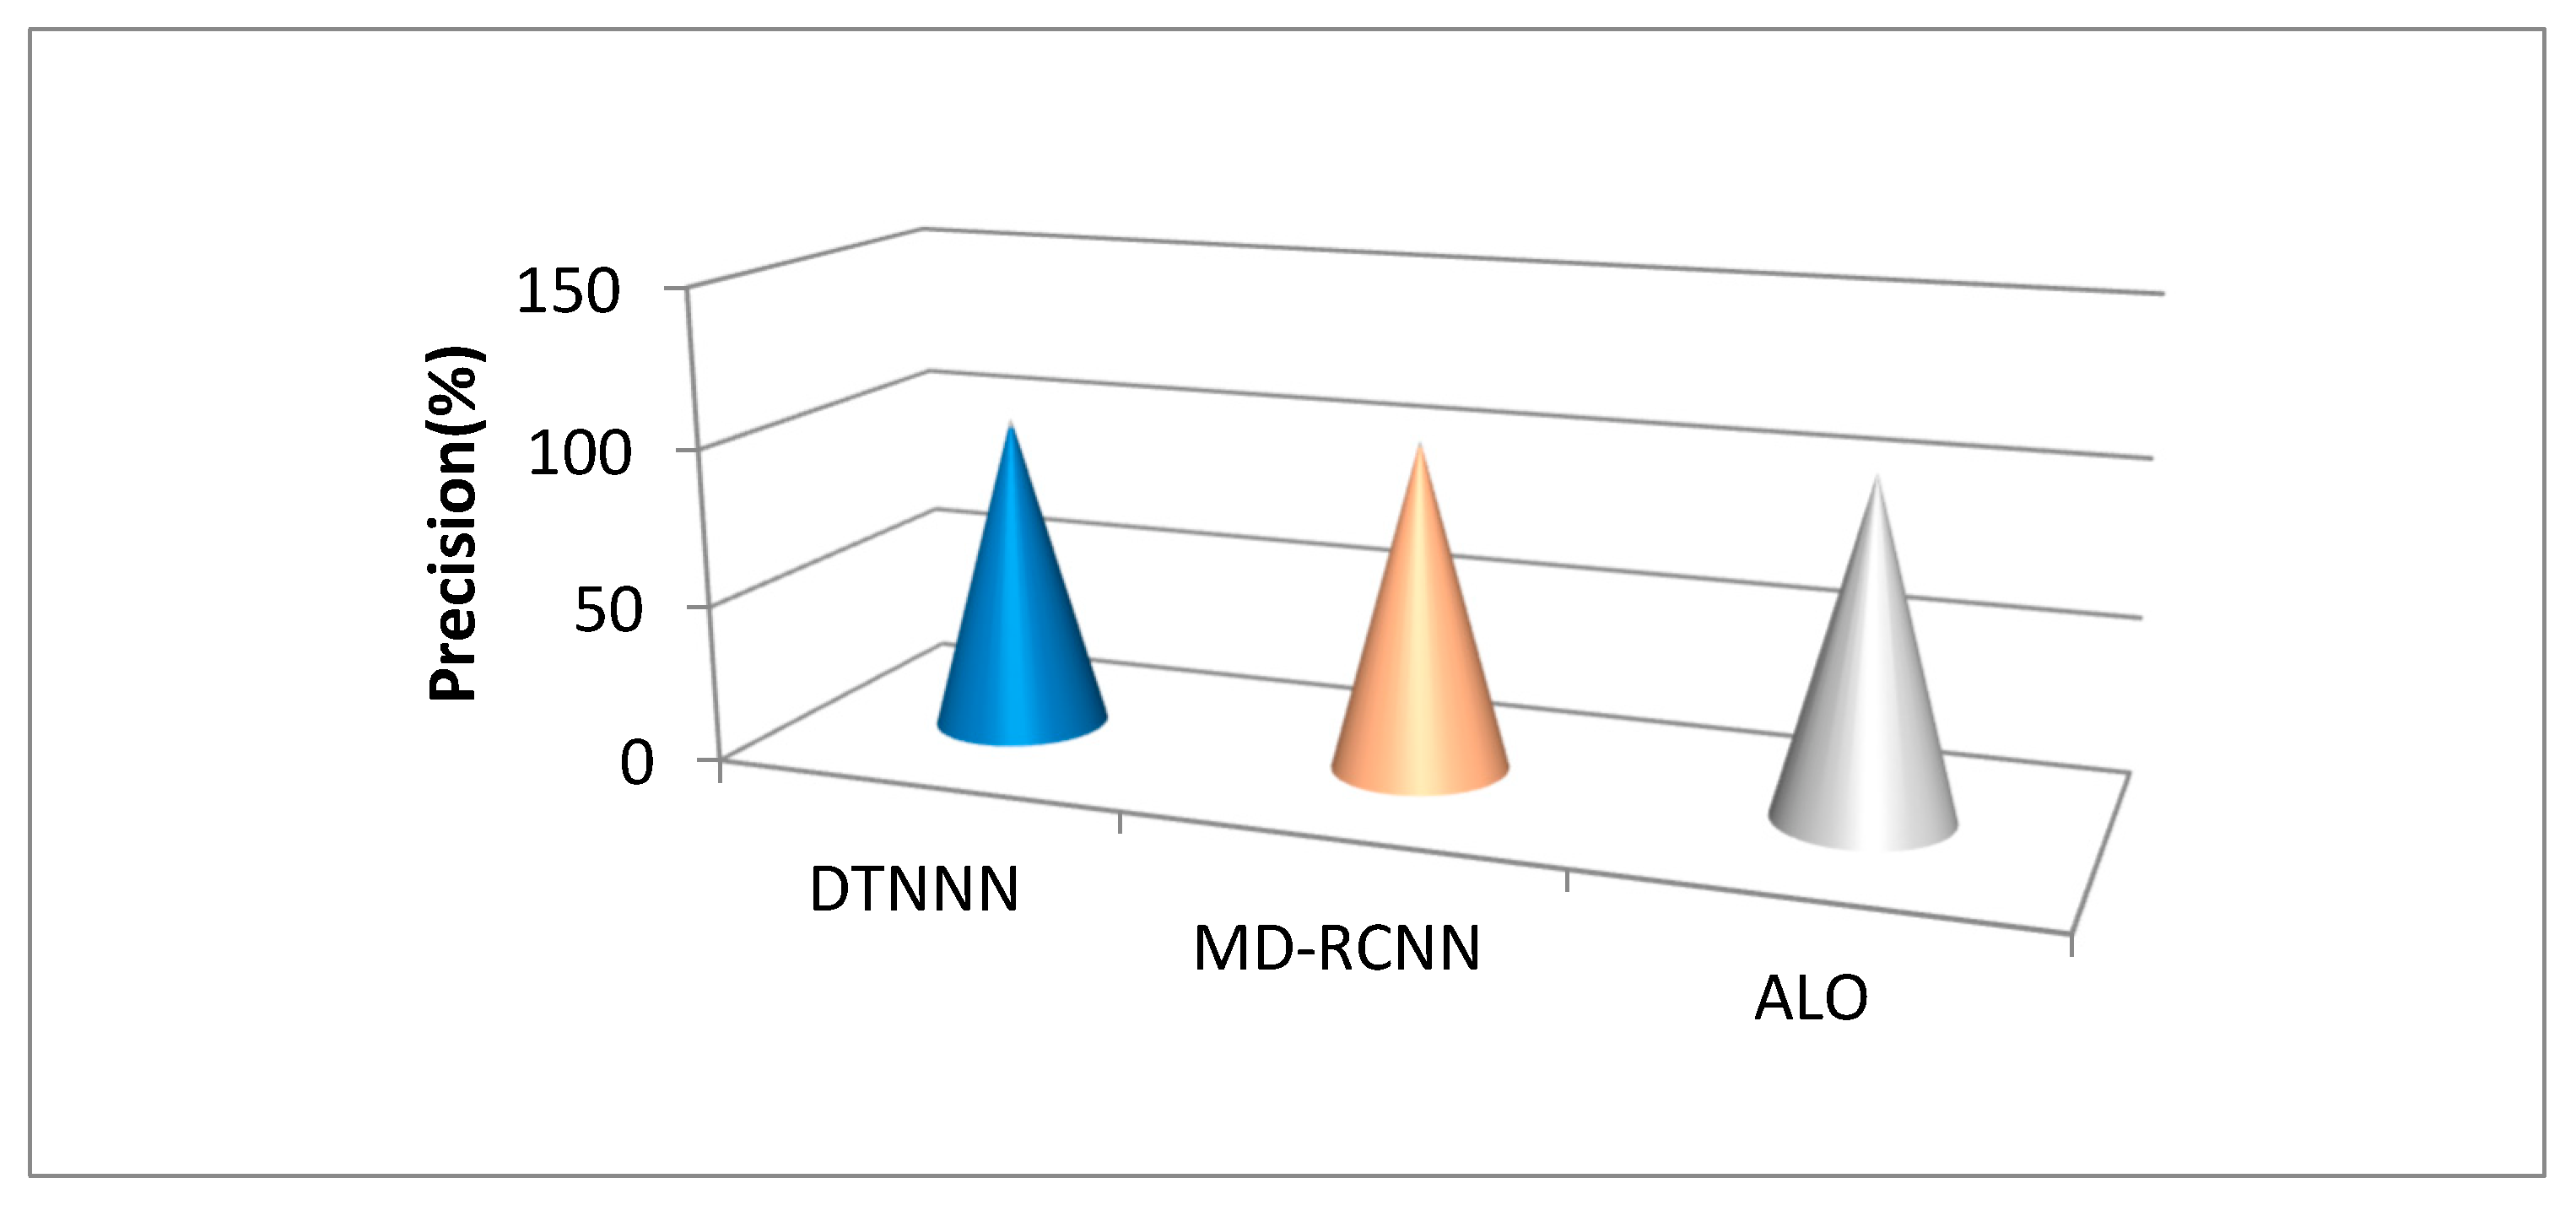
| Technique | Accuracy (%) | Precision (%) |
|---|---|---|
| MD-RCNN | 89.4 | 96.24 |
| FKNN | 85.43 | 98.56 |
| ALO | 86.0 | 99.34 |
Publisher’s Note: MDPI stays neutral with regard to jurisdictional claims in published maps and institutional affiliations. |
© 2022 by the authors. Licensee MDPI, Basel, Switzerland. This article is an open access article distributed under the terms and conditions of the Creative Commons Attribution (CC BY) license (https://creativecommons.org/licenses/by/4.0/).
Share and Cite
Verma, A.; Agarwal, G.; Gupta, A.K.; Sain, M. An Optimized Neuro_Fuzzy Based Regression Trees for Disease Prediction Framework. Appl. Sci. 2022, 12, 8487. https://doi.org/10.3390/app12178487
Verma A, Agarwal G, Gupta AK, Sain M. An Optimized Neuro_Fuzzy Based Regression Trees for Disease Prediction Framework. Applied Sciences. 2022; 12(17):8487. https://doi.org/10.3390/app12178487
Chicago/Turabian StyleVerma, Ankit, Gaurav Agarwal, Amit Kumar Gupta, and Mangal Sain. 2022. "An Optimized Neuro_Fuzzy Based Regression Trees for Disease Prediction Framework" Applied Sciences 12, no. 17: 8487. https://doi.org/10.3390/app12178487