1. Introduction
A multivariate network is a general abstract network model that can both express the structure of relationships between entities and effectively record the multidimensional attribute information possessed by entities or relationships. In the real world, one example of a multivariate network is social networking; the nodes represent users and the edges represent the friend relationships between users. The users have plentiful attribute information, including age, gender, occupation, and residence. It can be seen that the multidimensional attribute information attached to nodes and relationships can reflect the association patterns and cohesive properties among entities from different perspectives, which is important for users when exploring and analyzing relationship establishment, association formation, and network evolution.
Network visual analytics can help to efficiently mine the correlation between entities, and plays an important role in various fields. For network visual analytics in different areas, visual analytics solutions are often designed according to specific data and analysis tasks. In the field of psychology, network analysis is used to identify and analyze correlation patterns in multivariate psychological data [
1]. In social networks, network visualization and semantic analysis methods are utilized to identify semantic features and subtopics; for example, in the Weibo corpus related to Ebola during the 2014 Ebola outbreak in West Africa [
2]. In addition, several studies have developed general network analysis tools, such as Gephi, Cytoscape, etc. Nevertheless, these comprehensive network analysis tools lack guidance and require a professional knowledge background and much time to find breakthroughs. For multivariate network visual analysis, attributes and topological structures can be presented through diversified visual expressions with multi-view collaborative interactions. However, these methods are limited by their single-dimensional spatial layouts. Presenting multiple attributes simultaneously in the topology structure increases visual complexity; selectively presenting certain attributes is inconvenient for comparison and association analysis among the attributes. In addition, the association analysis between topology structures and attributes cannot be flexibly supported; for example, topology structures with multiple attributes cannot be compared.
Aiming at the limitations of visual analytics of multivariate networks in single-dimensional spatial layouts, a multi-dimensional integrated layout scheme is proposed in this paper. A layout scheme is proposed in which the global network structure is presented in 3D space, which is effective in allowing users to master the global topology of the network. We note that community exploration is efficient both for quickly understanding network topology and for mining potential correlations [
3,
4]. Therefore, the Louvain community detection algorithm [
5] is introduced to conduct a preliminary analysis of the network, and in combination with the force-directed algorithm we achieve a Louvain-3D FDA algorithm. In addition, the 2.5D hierarchical layout is drawn on multiple 2D planes and arranged in the third dimension, with the layers indicating the network attributes. To reduce visual confusion caused by crossing edges, an edge bundling algorithm is used to optimize edge crossing among multiple layers. A 2D network layout view design is used to present details of local networks on a 2D surface. Additional analysis perspectives and richer network information are presented according to the provided multiple dimensional spatial layouts scheme. A novel layout transformation method is proposed to maintain the relative position of the topological context layouts in multiple dimensions.
Multi-dimensional layouts in 3D, 2.5D, and 2D provide a multi-granularity analysis scenario while taking into account both topology and attribute correlation analysis. Finally, a visual analysis system, Multi-NetVis, is developed based on the layout scheme and interaction workflow. The major contributions of this paper are summarized as follows:
A context-preserving layout scheme is proposed to solve the limitations of multivariate network visual analysis in single-dimensional layouts. We apply a layout transformation method to preserve the relative position of the topological context in different dimensional layouts.
By combining the Louvain community detection algorithm and force-directed layout for 3D layouts, a layout algorithm (Louvain-3D FDA) is proposed to integrate the community-based topology for association analysis in a 3D layout. In addition, we select the network attributes to present in the 2.5D layout, which consist of multiple planes. Moreover, an edge bundling algorithm is applied to further reduce visual clutter in the 2.5D layout.
According to our layout scheme and analysis process, named “from global to detail”, we implement a visual analysis system which provides varied analytical granularity and perspectives. Finally, we select two datasets for experimental analysis and design an evaluation experiment to verify the effectiveness of the layout scheme.
2. Related Work and Design Requirements
2.1. Network Visualization
There are many forms of network visualization, such as node-link diagram, adjacency matrix and implicit tree diagram. In these studies, the node-link diagram is the most general presentation approach. Paranyushkin [
6] designed a node-link network diagram to present the text, which can help to discover and analyze prejudices and loopholes in the notes. Bigelow et al. [
7] designed a visual analysis tool called Origraph to assist analysts in performing operations such as network establishment and filtering of nodes and edges. The network visualization in these studies is based on the 2D plane, which has greater limitations in terms of viewing angle and presentation space compared to 3D space. Therefore, a network visualization layout method in 3D was proposed by Kim et al. [
8]. Pavlopoulos et al. [
9] developed Arena3D, a visualization tool for analyzing biological networks in 3D space. With the increasing complexity of networks, multi-layer network models have been proposed; Mcgee et al. [
10] proposed a 2.5D layout to represent the hierarchical attributes of the network. Xiaolei et al. [
11] adopted a 2.5D layout to visualize the two-layer network and reveal the dependencies between the network layers. Zhao et al. [
12] proposed a new graph sampling method called mino-centric graph sampling (MCGS), stipulating that graphs are simple, unattributed, undirected, and connected, thereby simplifying representations. Michael et al. [
13] described a visually and algorithmically scalable approach. The importance of nodes and node groups can be detected, computed, and visualized by considering several layout and reordering properties in combination along with different edge properties for the same set of nodes.
In summary, the above works have found that a 3D layout can contain a large-scale network, enabling the global topology of the network to be effectively mastered. In 2.5D layouts, users can explore the dependencies among network layers with abundant attributes by abstracting the network into 2D planes of different layers. As for the 2D plane layout, although its visual space is limited, plane-based interaction is simpler and easier. Therefore, we believe that the 2D plane is more suitable for presenting the details of small-scale local networks and carrying out accurate network operations.
2.2. Multivariate Network Visual Analysis
With the diversification of data, a network abstracted from entity correlation is a complex network with multiple attributes rather than a simple network. For a multivariate network, research [
14] has shown that while the node-link diagram is the most frequent network expression, it is limited in terms of its encoding attributes. Although a table-based network representation is more conducive to presenting the network attributes, it is not able to visually present the topology.
Visual analytics research into multivariate networks has provided a variety of methods to reconcile these deficiencies. Cao et al. [
15] implemented an interactive system called g-Miner to mine group correlation structures in multivariate network data. Through the integration of a mining algorithm, cross-level exploration, a multi-structure group view, and other visual design elements, the network group was iteratively mined and user feedback was integrated into the loop analysis. Cava et al. [
16] designed a visualization technology called ClusterVis to support the exploration of clustered or user-defined subgraph node attributes. In another study [
17], nodes were allowed to be aggregated based on node attributes, topology, or a combination of the two, providing multiple patterns for exploration of multivariate networks. For interaction analysis, Liu et al. [
18] proposed the analysis method HyBridVis and established an interactive layout to present a features swarm of one or more attributes at different scales. In order to improve the analysis and understanding of pure topology structures, Gibson et al. [
19] proposed an interactive and linear dimensionality reduction network layout and interactive analysis method. Zhao et al. [
20] presented an evaluation that investigated the effects of background stories on graph perception.
In conclusion, the current work mainly focuses on the exploration of structure and multivariate data, neither of which is convenient for structural or multivariate analysis. In addition, few of the works mentioned above provide users with a simplified overview.
3. Design Requirements
Multivariate network data contains both structural information and attribute information. In situations involving different kinds of analysis, users and experts pay more attention to the topic and content, respectively, which means that multivariate network visualization methods have different focuses in terms of their form of expression. In order to obtain a design scheme, we invited experts and scholars to discuss the key tasks and difficulties in multivariate network analysis. The tasks (see
Table 1) should be used with either a single entity or a small subset, which are necessarily low-level. The challenges can be divided into representational and functional challenges. First, we try to present the topology scheme of multi-dimensional networks through multidimensional transformation. In addition, users are interrupted due to missing functionality, which results in a tedious interaction process. After a series of conversations with domain experts, we put forward the following requirements:
R1: Supporting the topology analysis of specific attributes. It is fundamental that the identified task consists of entity discovery based on spatial location or the values of associated properties. Here, our goals include presenting the multivariate network topology by edge attributes, node attributes, and communities, which can help users to gain crucial information about multivariate networks.
R2: Providing multi-dimensional network presentation based on selected attributes of multivariate networks. Different dimensions of network topology help users to obtain insights into the network. Although multivariate networks are hard to explore in the same dimension, it is necessary to present the topology of multivariate networks through multiple dimensions.
R3: Developing a progressive analysis process. The interactive techniques for visualization of multivariate network include several challenges, which can be classified into data type, data exploration, user interface, and assessment challenges. Here, we develop a progressive analysis process to guide users in carrying out progressive analysis on multivariate networks.
4. Research Methods
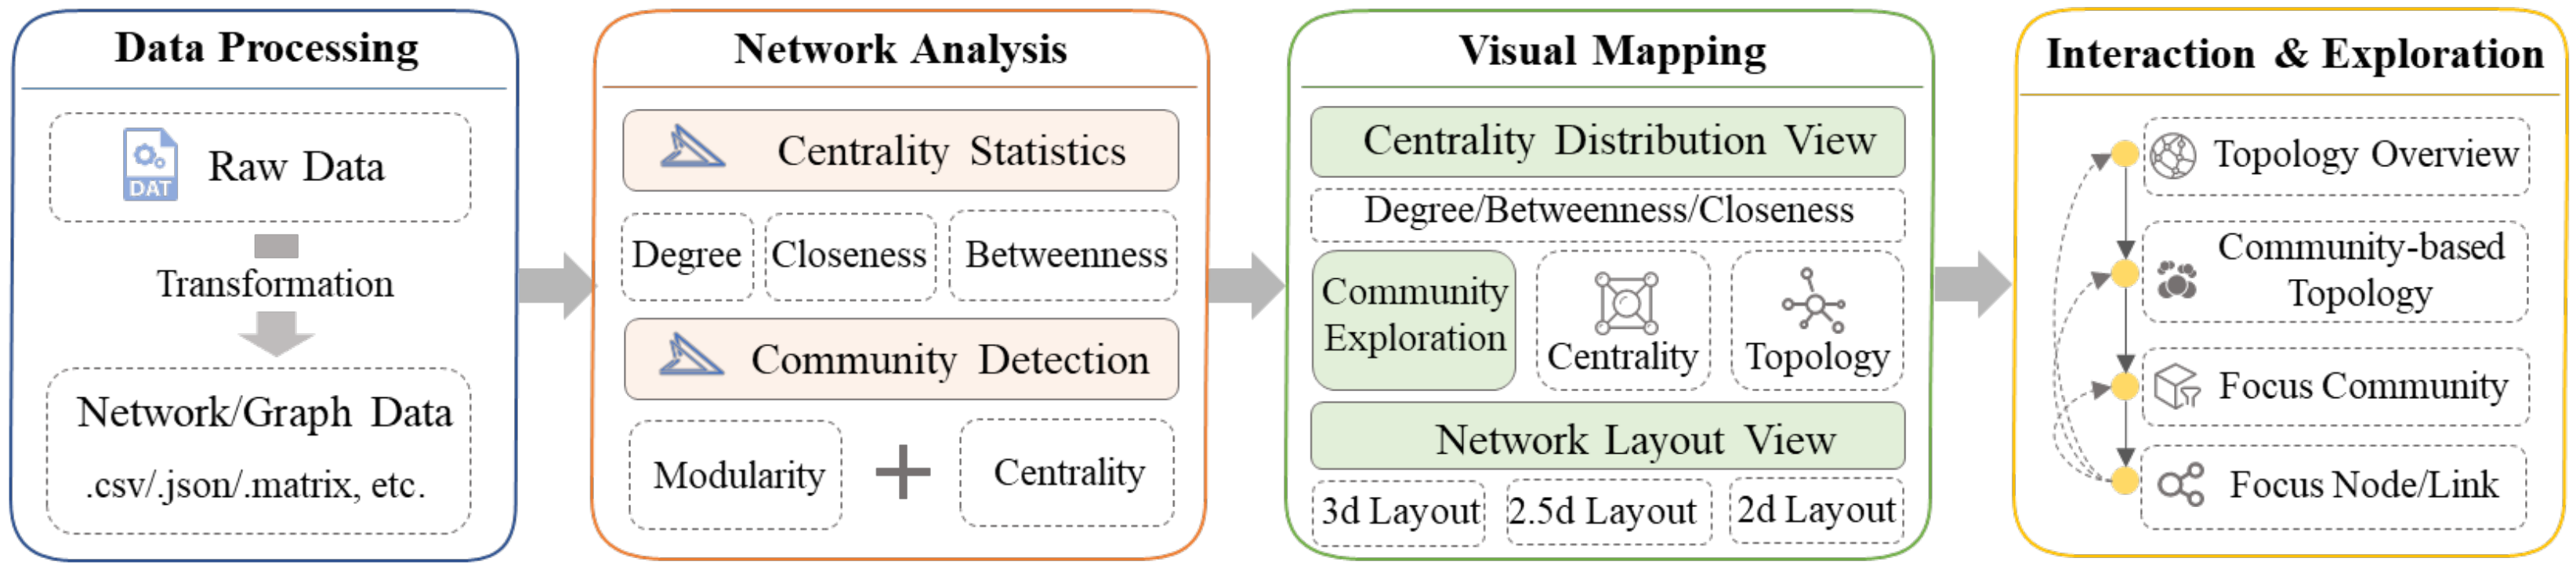
Based on the aforementioned requirements, we designed a workflow consisting of four parts (
Figure 1). Data Processing: data preprocessing is performed, and the data attributes are extracted during data processing. The data are constructed as network data with nodes and edge objects. Network Analysis: network analysis mainly includes centrality analysis, community mining, and attribute-based analysis. Community mining focuses on the choice of division of two adjacent network communities, and includes network division based on its attributes and the community mining algorithm. Visual Mapping: visual mapping visualizes the original information and structure of the network from its attributes and topological structure, including the community exploration module and the network topological module. The community exploration module includes the analysis of community centrality and community topology. The network layout module completes different network layouts, including the 3D layout showing the global network structure, the 2.5D layout showing the associated structure of the network community, and the 2D layout showing the local structure of the network. Interactive Exploration: the interactive exploration module combines the three kinds of layouts to provide multi-granularity topology contexts. Users can complete the whole exploration process according to multiple interaction modes such as selection and browsing, beginning with the global overview, which gradually reduces exploration granularity, and finally focusing on local nodes or edges. Meanwhile, multiple topology contexts can be compared and correlated during analysis.
In order to consider both the attributes and the topological structure, we represent the network attributes from the perspective of topological layout and design the layout scheme with the characteristics of the 2D layout, the 2.5D layout, and the 3D layout. The same network presents different layout effects in different dimensional layouts, which makes it difficult to lock and analyze the target. Therefore, we propose a multidimensional space layout transformation method for layout calculation in order to maintain the relative position of the topological context layouts in multiple dimensions.
The 3D space provides infinite space and a 360° observation angle, which is suitable for presenting the large-scale network structure. In this study, the 3D layout is selected to present the overall network structure, allowing users to master the global topology of the network. The 2.5D layout of nodes depends on the network attribute value, which can be mapped directly from the topology. Here, we adopt a hierarchical layout model to implement the 2.5D layout and introduce an edge bundling algorithm to improve the visual effects of the network layout. Due to the limitation of 2D space and the simplicity of interaction, it is more suitable for presenting the local details of the network (R2). Therefore, the 2D layout is adopted to present the small-scale local network structure, with a 2D force-directed layout and a circular layout.
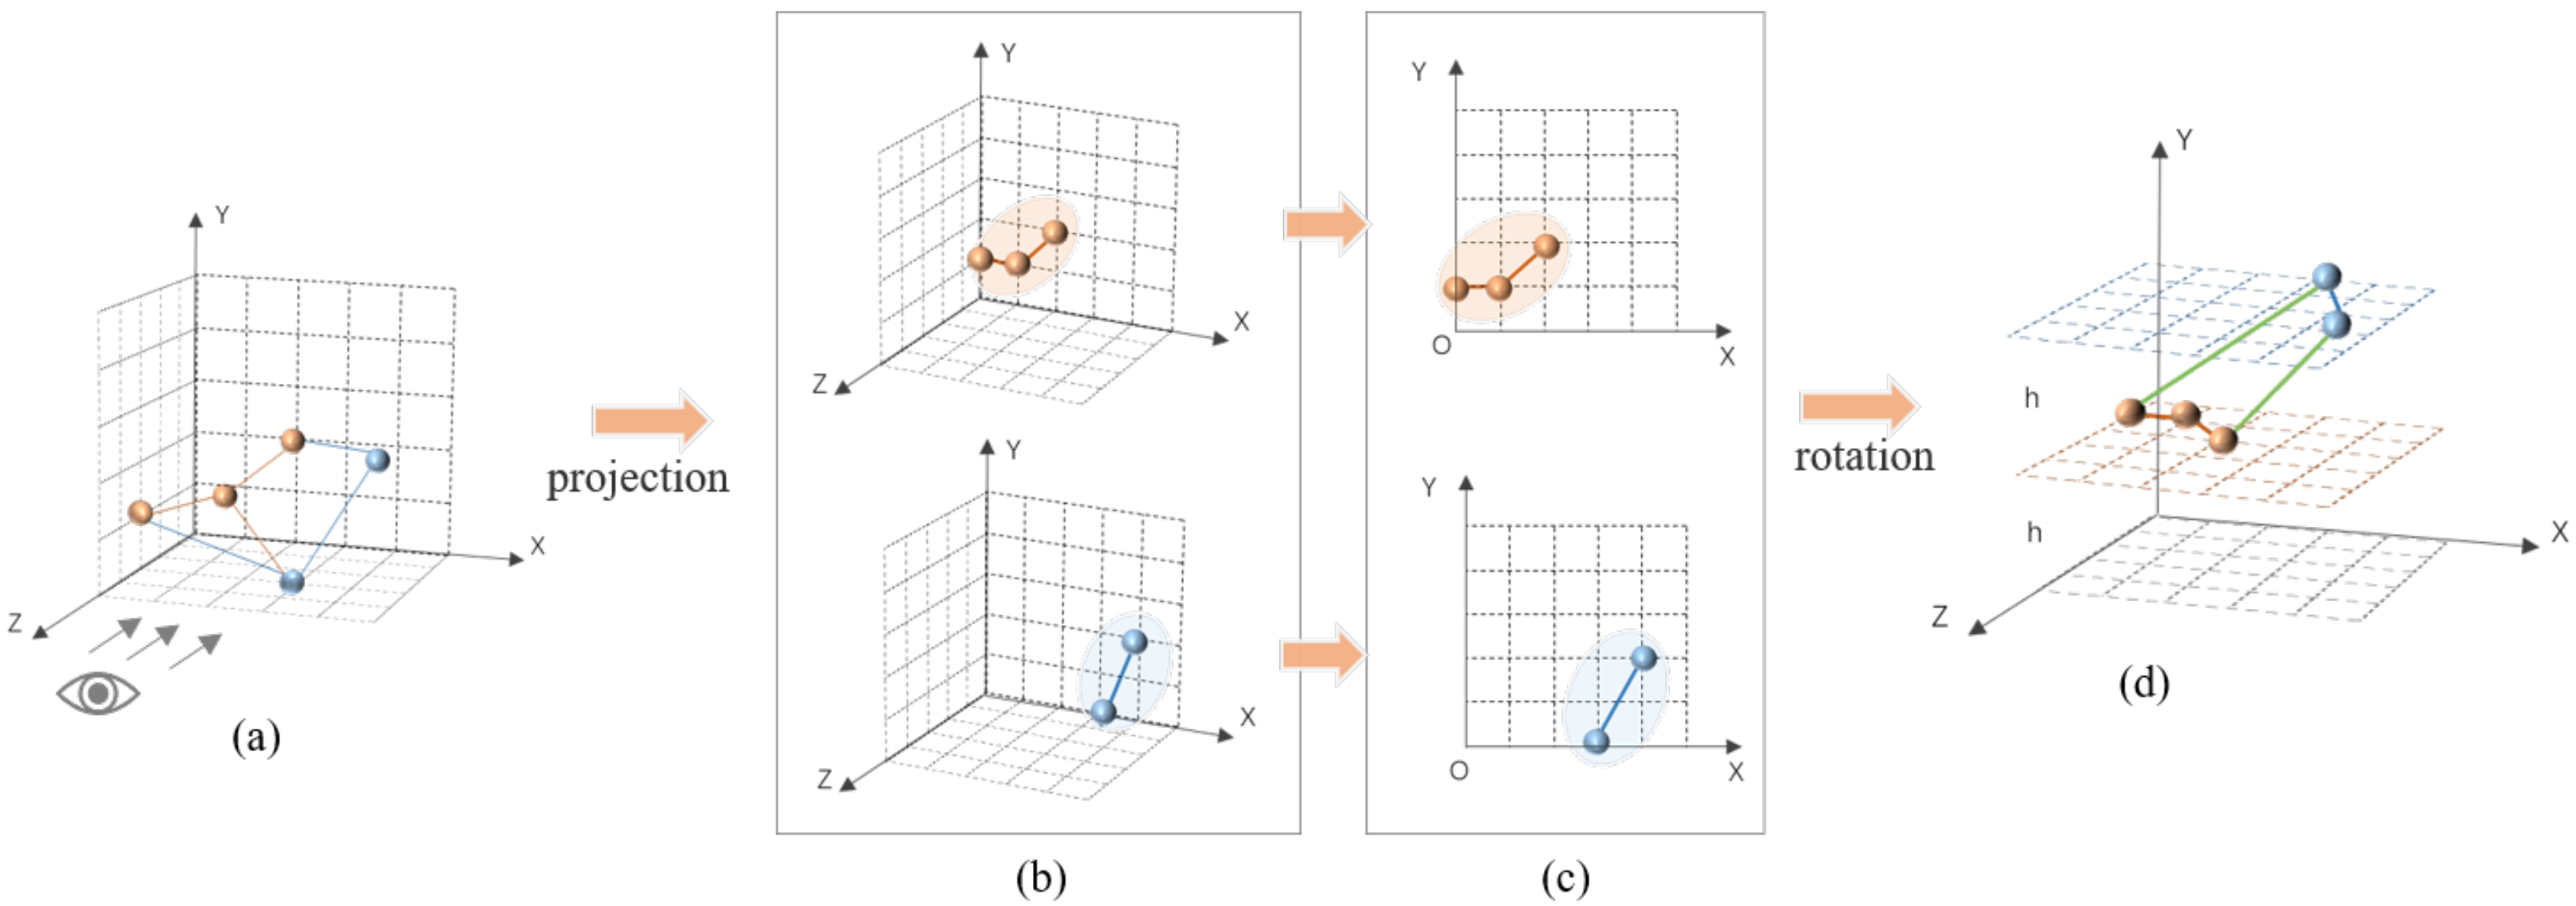
4.1. Spatial Transformation Based on the Stability of the Network Structure
Computing each network layout may lead to changes in the relative positions of the network nodes, which is unhelpful for identifying the analysis target in multiple layouts. In order to maintain the relative positions of nodes in the three different dimension layouts, we propose a multi-dimensional spatial transformation method for layout transformation. The method generates a network layout according to the original layout position instead of recalculating each layout. The layout transformation process includes three steps: projection, rotation, and scaling. As shown in
Figure 2, it contains two types of node attributes and two types of edge attributes.
Layout transformation can be performed using the node type and edge type. First, the network projects the topology to the
plane based on the original structure in the 3D layout. According to graphing principles, the coordinates of the nodes are calculated as follows:
where
is the projection matrix and the 2D layouts of the two communities are obtained through projection transformation. Second, we rotate the projected topology from the
plane to the
plane, for which the calculation is as follows:
where
is the rotation matrix and the value of
is
. Third, we scale the topology obtained from the previous step and gather the discrete nodes in proportion to ensure that the topology exists on a set of parallel
planes.
A method called the context preserving layout is used to solve the problem of overlap with the network nodes; this projects multiple networks in the 3D space into the 2D plane while preserving their topological structure and connection relationships. In the 2D plane, where the nodes are laid out in a circle, the node radius is defined as
r. The nodes overlap when the distance
d between nodes is less than
. The nodes that overlap with node
i are the set
, with repulsive force calculated as follows:
Therefore, the coordinate of node
i is adjusted according to the repulsion force, calculates as follows:
where
is the included angle between directions
and
.
The 2.5D layout is carried out based on the network structure obtained by the above transformation, and the values of Y are determined according to the attribute values. Because nodes are in different communities, we assign values of Y for the nodes in each community to ensure that nodes with the same attribute value are laid out on the same plane. When multiple communities are drawn across layers, the occlusion crossover of community-associated edges needs to be considered. In this study, an optimal ranking method based on the minimum cross-layer coefficient is proposed to determine the hierarchical order of community in 2.5-dimensional layout. The order of each community is random by default, and the distance between community and can be defined as . We set the total edge number among communities as , and the cross-layer coefficient can be described as . Next, the hierarchy order is adjusted to minimize the cross-layer coefficient; the hierarchical order is then optimal. We set the value of each layer node as , where n is the self-defined layer height and h is the number of the layer. The collection of associated edges between communities in the community group is defined as , and the associated edges of the layers are added in the 2.5D layout.
4.2. Louvain-3D FDA Layout
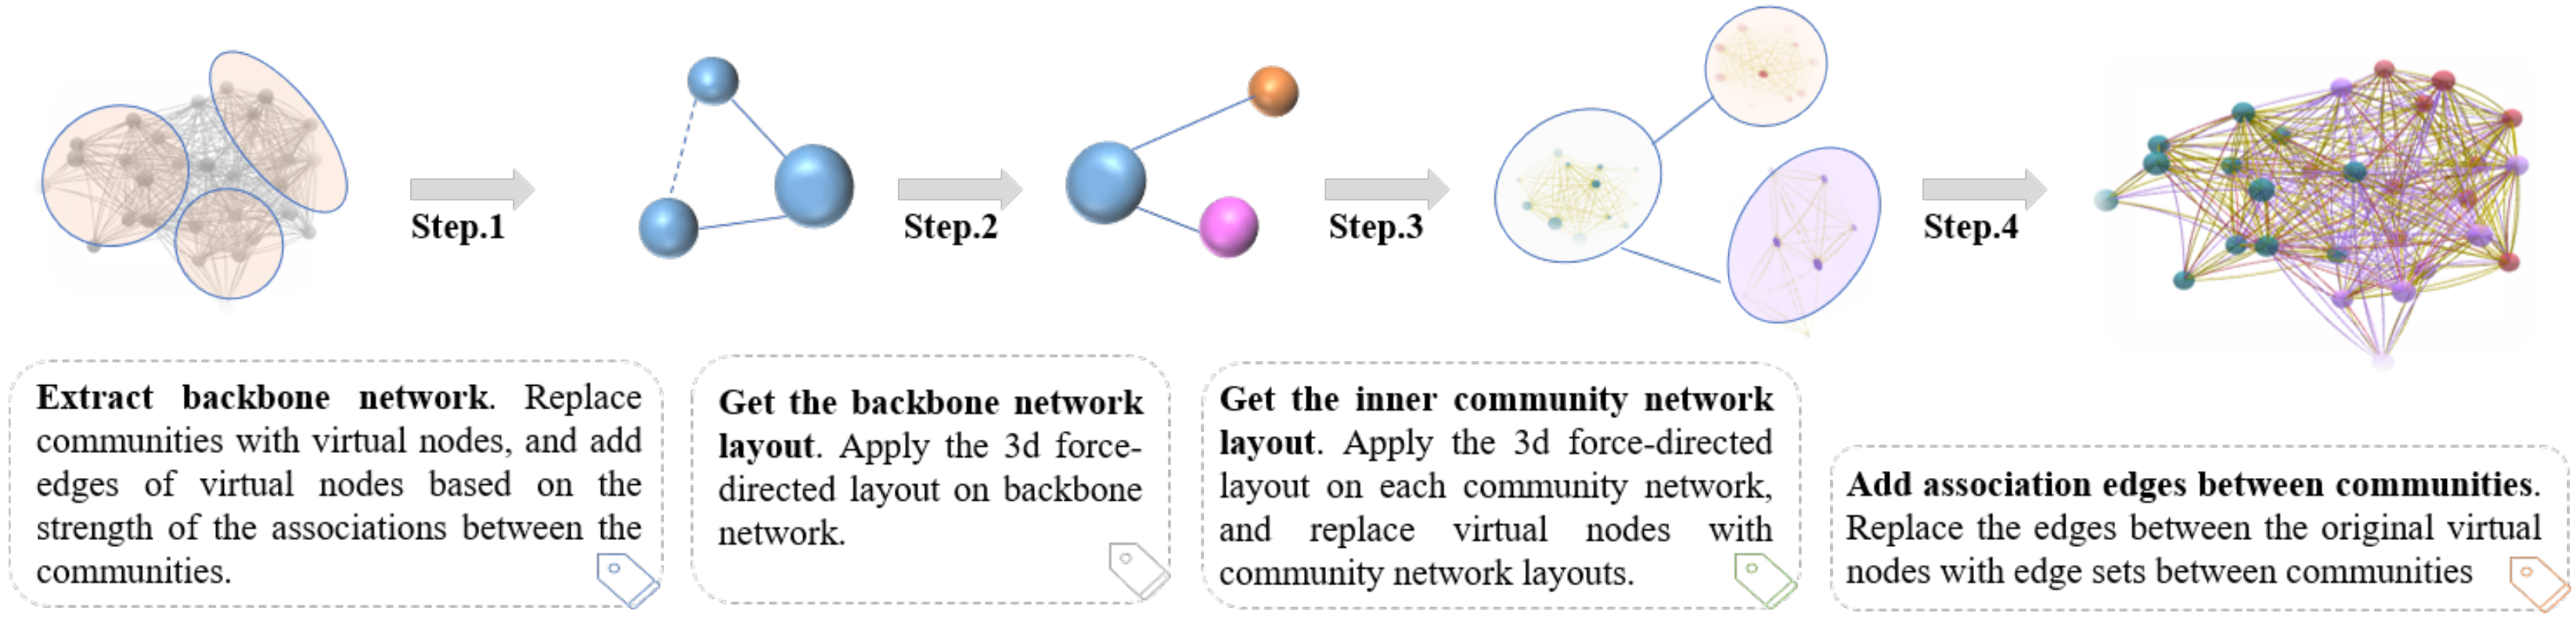
The 3D space can accommodate a large network structure, however, the network topology containing all nodes and edges is not conducive to quickly observing the backbone structure. The combination of community mining and the layout algorithm can clearly present the community-based backbone structure in the network. Therefore, a 3D force-directed layout algorithm based on community structure (Louvain-3D FDA) is proposed by combining the Louvain community detection algorithm and force-directed layout for the 3D layout. The implementation process of the Louvain-3D FDA is shown in
Figure 3, including the backbone structure extraction, 3D force-directed layout, community-based layout, and adding association edge between communities.
Backbone structure extraction: in this study, we extract the network backbone topology based on the community structure. The Louvain algorithm [
5] is a community discovery algorithm based on the optimization module; the concept is to divide the community through iteration in order to maximize the overall module of the network. The modularity is defined as
where
indicates whether nodes
i and
j are connected (if there is a connected edge, the value is 1; otherwise it is 0),
m indicates the number of all edges in the network,
stands for the degree of node
i,
represents the community to which node
i belongs, and
indicates whether nodes
i and the node
j are divided into the same community.
We assume that network G has n communities after community division; then, G can be expressed as . The community is defined as a virtual node , and a set of virtual nodes can be represented as . We use an edge set to replace the associated edges among communities, which can be expressed as , where represents the associated edge connecting the virtual nodes and . Finally, the backbone network of G can be expressed as .
3D force-directed layout: we select the force-directed layout [
21] to calculate the layout of the backbone network and the community internal network. In the network
, the position of a virtual node
i can be represented as
. The core concept of a force-directed layout is that adjacent nodes are close to each other due to mutual gravitation and non-adjacent nodes are moved away from each other due to mutual repulsion. The calculation formula for the gravitational force
, repulsive force
, and moving step length
of node
i in each iteration are as follows:
where
is the set of neighbor nodes of node
i, while
and
indicate the positions of nodes
i and
j, respectively. We define the adjustable parameters for the control distance as
, where
V indicates the volume of a sphere with a custom radius for the layout and
indicates the number of virtual nodes.
Community network layout and layout constraint specification: we use a 3D force-oriented layout for the community network corresponding to each virtual node; the location of a virtual node is applied as the layout center for its community, with half the number of nodes in each community used as the layout space radius of that community network. We constrained the layout results of the community network according to the specification, adjusting the node position to prevent the the community network layout structure from overflowing the community scope. The layout constraint specification is shown in Algorithm 1.
| Algorithm 1: Layout constraint specification |
| Require: Coordinates of node V; center coordinates and sphere |
| radius R of the drawing region |
| Ensure: The regular layout |
1: |
2: |
3: |
4: if not in the sphere then |
5: |
6: end if |
Adding association edges between communities: after completing the trunk layout and community layout, we add the association edges between the different community nodes to gain the complete network structure.
4.3. Attribute-Oriented Topology Layout
In the 2.5D layout, one of the three layout criteria is selected for the network layout, which contain the nodes, edges and communities. The network with the same attributes is placed at the same layer based on the attributes selected by users. Based on the node layout, the nodes in each layer have the same node attributes in the 2.5-dimensional layout, and thus the network topology can be compared and analyzed under different node attributes. Based on the edge layout, the edges in each hierarchical network have the same attribute type. By associating the same node objects in the hierarchical network, the topological positions of one node in different relationships can be analyzed. Based on the hierarchical layout of the community, one hierarchy represents a community, and thus the topology structure and node attribute distribution of each community can be compared and analyzed.
In order to reduce the visual confusion caused by the intersection of associative edges between layers, we propose several solutions from two aspects. On one hand, the number of cross-layer edges is reduced by adjusting the layout hierarchy order. On the other hand, the associated edges between layers are bundled to reduce crossing of edges between layers.
Inspired by the edge bundling method [
22] we divide each edge into equidistant segments, as shown in
Figure 4. In this study, the angle compatibility, scale compatibility, position compatibility, and visibility compatibility are introduced to solve the problem of excessively high bundling and an excessively stiff bundling effect. The angle compatibility
is proposed based on the idea that perpendicular edges should not be bundled, where
,
. Edges that differ greatly in length should not be bundled, as the original edges become overstretched or bent. Therefore, the scale compatibility
is proposed. The position compatibility
is proposed according to the suggestion that distant edges should not be bundled. For parallel edges with approximate length and close position, the visibility compatibility
is introduced to prevent bundling. According to the angle compatibility, scale compatibility, position compatibility, and visibility compatibility, the combined force
can be redefined as
where
is the result of multiplying the four compatibilities.
5. System Implementation and Case Studies
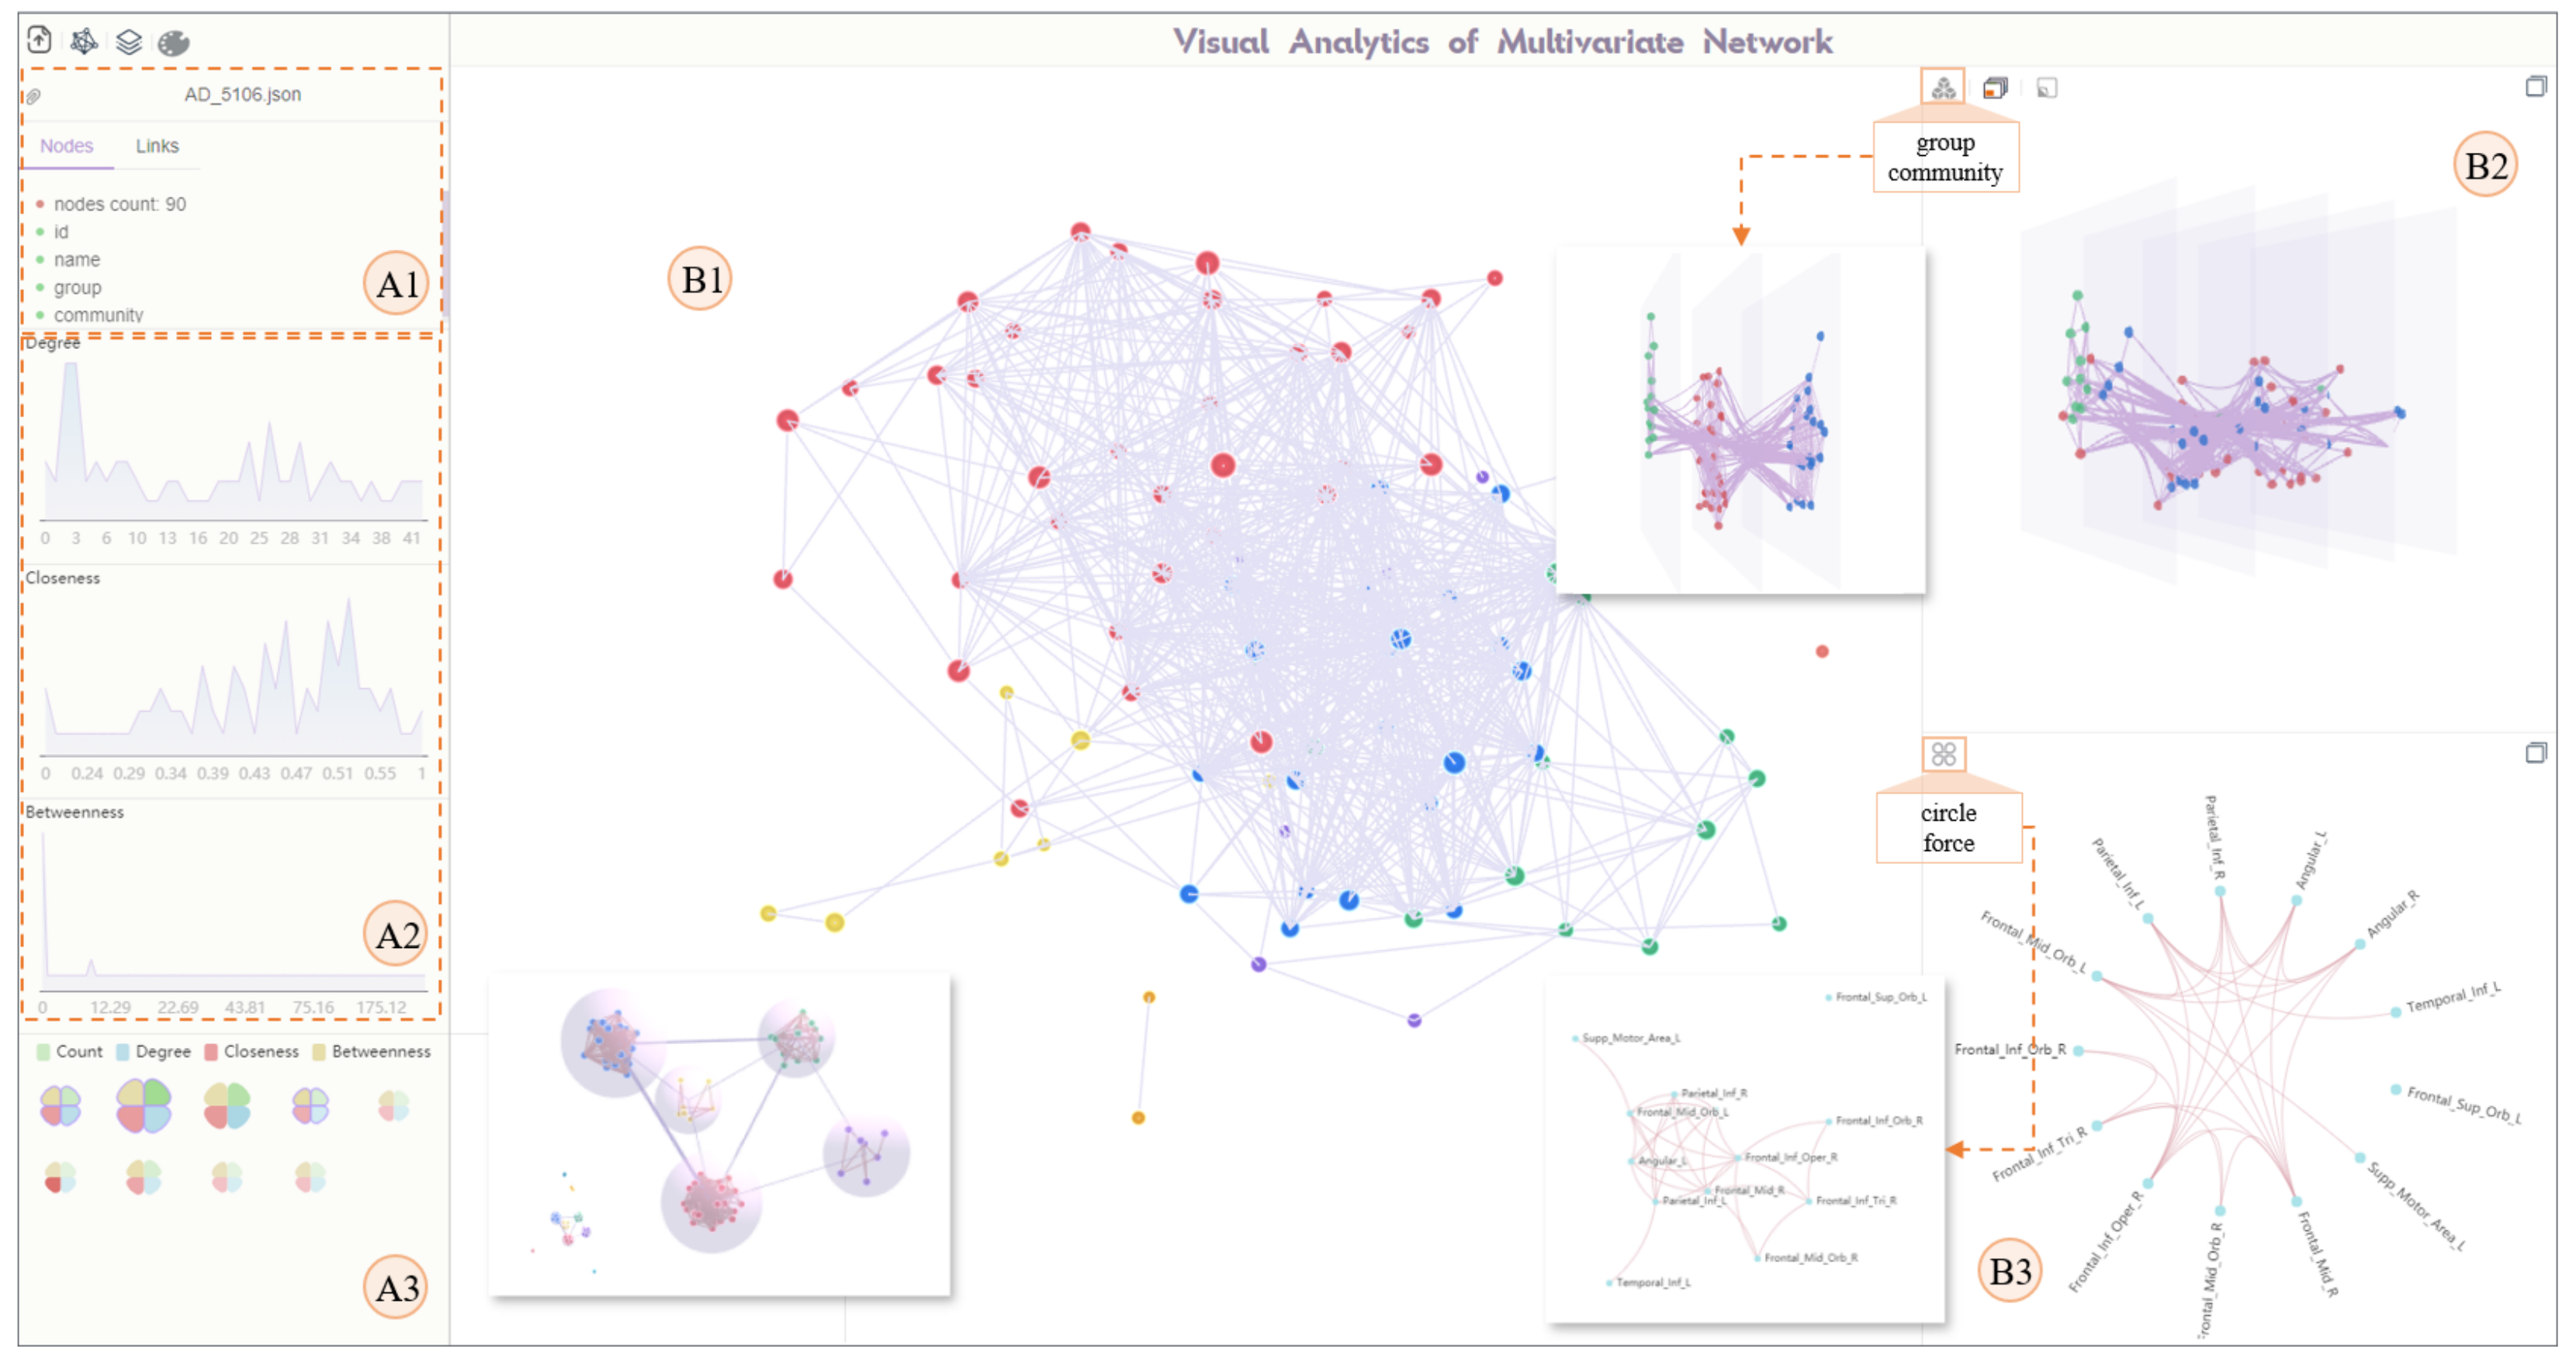
5.1. Visual Design and System Interaction
According to the layout scheme and system workflow, the visual analysis system implemented herein is shown in
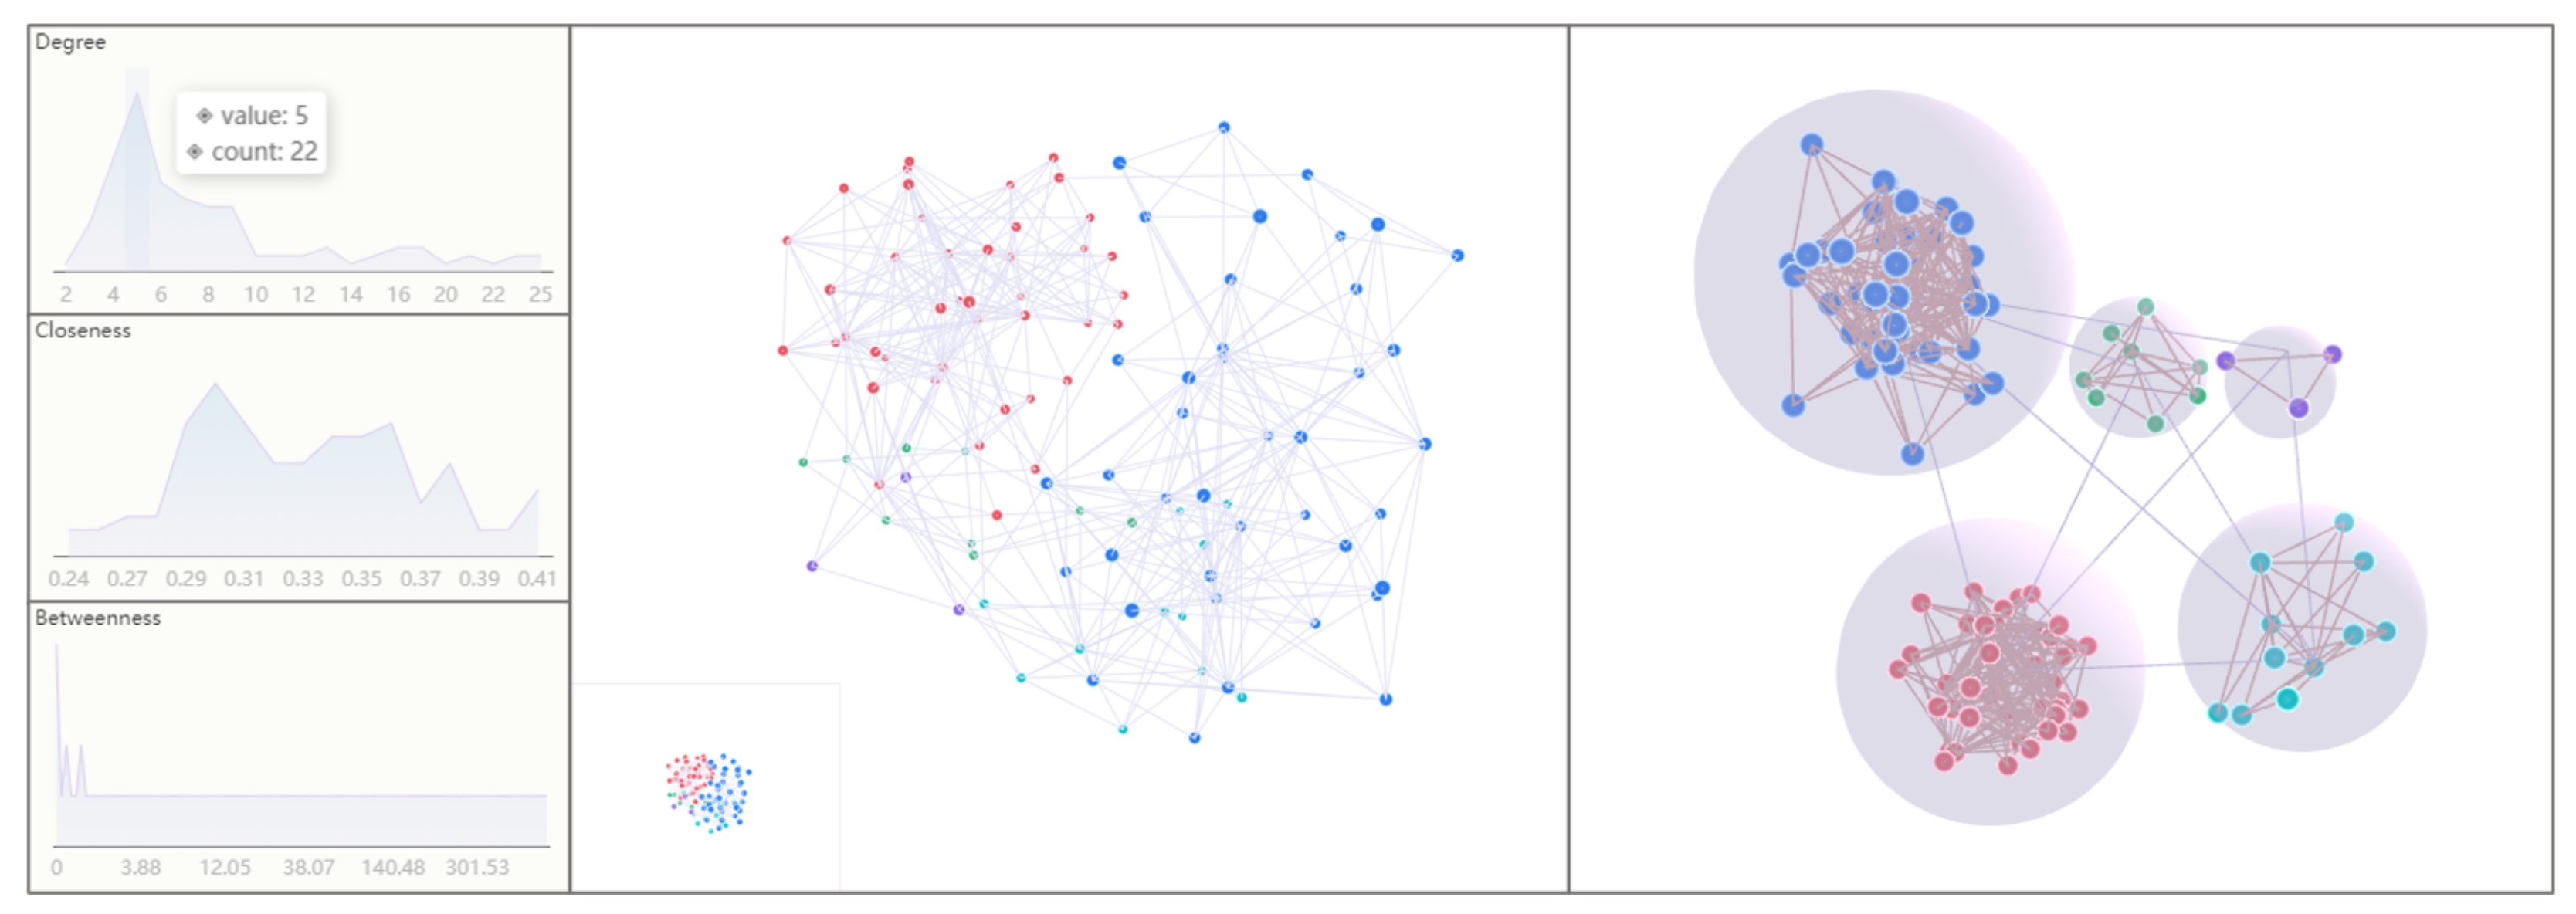
Figure 5. We use a curve graph to show the distribution of the centrality (
Figure 5(A2)) and design the flower petals to depict the centrality of the community (
Figure 5(A3)). One flower represents one community, and the petals represent the attributes of the community, including the average degree, closeness centrality, betweenness, and number of community nodes. The 3D layout view (
Figure 5(B1)) shows the overall network and the community-based layout. In the community-based layout (
Figure 5(B1) thumbnail), we adopt an edge to represent the correlation between two communities; the edge width indicates the correlation value among the two communities. In the 2.5D layout view (
Figure 5(B2)), we place the nodes on different planes based on the network properties and arrange the 2D planes vertically to facilitate analysis. Users can select the hierarchical conditions according to the attribute categories of the nodes or edges in the network. The 2D layout view (
Figure 5(B3)) provides the option of choosing between a circular layout and a force-directed layout. Users can view the detailed attribute information and select one node to identify its neighbors using the different layouts.
As shown in
Figure 6, we designed an interactive scheme to explore and analyze the network. The program consists of four steps. Global network understanding (
Figure 6a) supports the centrality distribution and total preliminary understanding of the topology from the global perspective. Exploration based on community granularity can use the community exploration to locate multiple communities while learning about each community’s information and community-based topology (
Figure 6(b1)). In this stage, users can analyze the relationships that exist in the community network by using the mouse to integrate interested communities into a single network (
Figure 6(b2)). Attribute-oriented topology analysis (
Figure 6c) locates a single-level network of interest. In addition, users can select attribute conditions for layout hierarchies, specify the attribute topology for comparison and association analysis, and hide non-essential hierarchies. Local network topology analysis (
Figure 6d) includes the layout switch function (circular layout to force-directed layout), allowing users to view the detailed information of a single entity, node neighbors, etc.
5.2. Case Studies
In this section, two datasets (
Table 2) are chosen to demonstrate the usage scenarios of the system. The first one is applied to compare and analyze the brain network of the AD (Alzheimer Disease) patients, with the reference to the healthy control (HC). The second one is to study the correlation among the American political books sold on the Amazon.
5.2.1. Brain Network Analysis of AD Patients
We extracted brain activity data from a database consisting of healthy people and AD patients, selecting a threshold of 0.2 to extract brain network data [
23] and obtaining a final network containing 90 nodes and 811 edges. The nodes retained “He Yong” partitioning as an attribute. The node attribute groups 1–5 were “Auditory and language/visuospatial”, “Emotion/decision-making”, “Social/visual”, “Control of action”, and “Memory and learning/visual”, respectively. In this case, we compared and analyzed the brain network of AD patients to explore the brain areas of AD patients with abnormal connections.
Overall network-based analysis: Based on the overall network shown in
Figure 7, it can be seen that the AD network is sparse and uneven. Certain areas are too sparse or too dense, and the difference in the betweenness centrality distribution range of the AD and HC groups is relatively large. As for attribute distribution, there are numerous brain areas in the AD network that appear to be low, indicating that these brain areas lack connections with other areas. The closeness centrality index of a few brain areas is much higher than in healthy people, allowing us to infer increased connectivity in certain brain regions.
Community-based analysis: Switching the 3D layout view to a community-based layout, we can set the color of nodes by "group" attribute, as shown in
Figure 8. The AD network is divided into nine communities, while the HC network has only four communities. It can be inferred that certain brain areas have lost many connections with other brain areas and become separated into small communities. From the AD graph, it can be seen that the nodes in these communities possess a small scale and sparse connections. Thus, we select such communities in the AD network for integration and further analyze them in the 2.5D layout.
Local-based analysis: Using the 2.5D layout of the merged multiple community networks, as shown in
Figure 9, we take the “group” as the layering condition, and as layer four is the brain area related to memory, we view the 2D layout of this layer. It can be observed that the connectivity of the hippocampus is relatively low. Selecting this node in the 2.5D layout, we find that this brain area is only correlated with a few nodes in layers 0 and 2. Additionally, the degree of this node is only 11, while its degree in the normal brain network is 18. Through common analysis we can obtain other brain areas with weakened correlations, such as the amygdala and insula.
5.2.2. Correlation Analysis of Co-Purchased Books
The dataset used in this case study is from [
24], which contains 105 nodes and 441 edges. The nodes are of three types, namely, “liberal”, “neutral”, and “conservative”. One edge indicates that two books are often purchased by the same user at the same time. We try to find the popular books in each category and the potential correlations between jointly purchased books.
Overall network-based analysis: in
Figure 10, the degree distribution is in accord with the power-law distribution characteristics, indicating that the books are popular. However, it is not clear which category these popular books fall into. By combining the global and community-based topologies we can find two large communities connected by three other small-scale communities in the middle. We speculate that the books in the two large communities are dominated by “neutral” and “conservative” books from their contrasting standpoints. We infer that the “neutral” books are mainly in the middle position, and may be bought along with other books by buyers of books from the two different viewpoints.
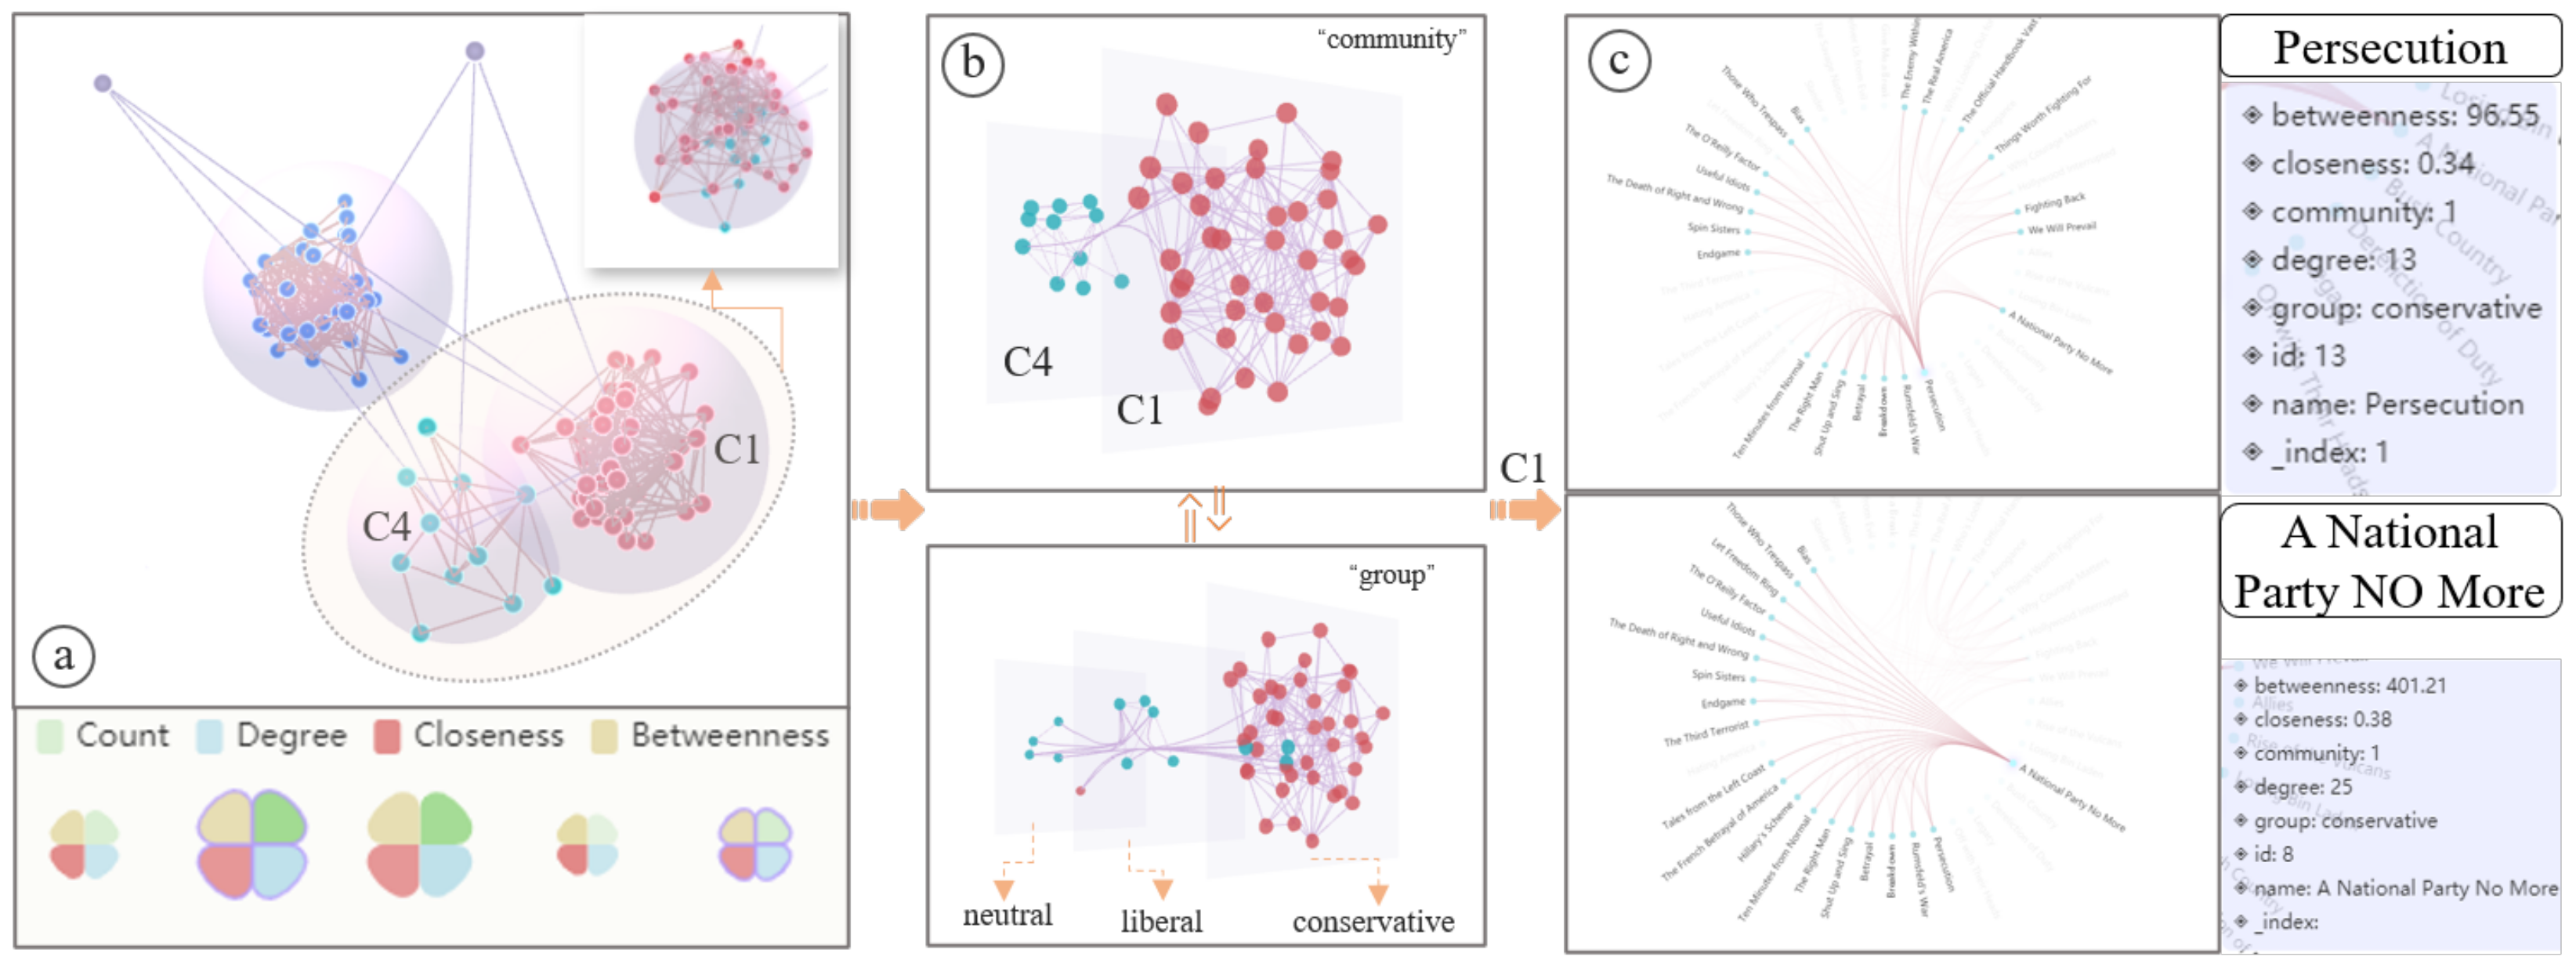
Community-based analysis: based on our analysis of the global network and the five obtained communities, we infer that the two larger communities are composed of popular “liberal” books and “conservative” books. We select C1 with a higher average degree and C4 at the middle position for further analysis of the characteristics and correlation when they are purchased. We drag and drop the two communities for community integration (
Figure 11a) and create a 2.5D layout of the integrated network. From the 2.5D layout, it can be seen that the correlation between the two communities is low, the communities only correlate by a few edges, and the C1 network is obviously more dense than the C4 network. We can obtain a hierarchical layout using the “group” attribute, as shown in (
Figure 11b). It can be seen from the layout that the correlation degree between the two communities is not high. There are only a few correlation edges between the two communities, indicating that only a few books in the two communities are purchased together. In addition, community C1 is significantly more dense than community C4, meaning that books in C1 are more likely to be picked up by users at the same time, while books in C4 are not.
Local-based analysis: As shown in (
Figure 11b), we can select a hierarchical layout using the Group attribute to find which categories of books are contained in the two communities. It can be seen that most of the nodes in community C1 (red nodes in the figure) are distributed on the “conservative” level, while only two nodes are distributed in the “neutral” level, which is consistent with the previous prediction. These two books are “Power Plays” and “Meant To Be”. For community C4, although it contains fewer nodes, the nodes are widely distributed in the three-layer network, which indicates that the community contains three types of books. The two categories “neutral” and “liberal” account for a large proportion of this community, and we speculate that the buyers of books in community C4 are relatively neutral. We select the “conservative layer” to view more detailed information, which is shown in (
Figure 11c), and find that the books “A National Party No More” and “Persecution” are purchased at the same time as many other books in the “liberal” category. Viewing the details of “A National Party No More”, we can find that it is the most popular book in the “conservative” category.
6. System Evaluation
In order to verify the effectiveness of the network layout scheme and visual analysis system, a comparative evaluation experiment was designed with Gephi. We invited sixteen participants and randomly divided them into two groups to analyze the brain network of AD patients using Multi-Netvis and Gephi. Among the sixteen users, fourteen users had a computer-related professional background and nine users had experience using network analysis tools such as Gephi.
6.1. Tasks
We conducted evaluation work based on the present study. As most participants had an understanding of multivariate network analysis, we decided to use the brain network data of AD patients to verify the effectiveness of our method. We then developed a series of analytical tasks (
Table 3) based on our system requirements.
6.2. Process
First, we began with a practical demonstration to introduce the interactive process of the system to the participants. The demonstration contained the knowledge required to accomplish the analytical tasks for this evaluation. The participants were asked to repeat similar steps and encouraged to ask questions. Next, the participants were guided to finish the analytical tasks (
Table 3). They were required to solve their tasks in thirty minutes without any help. Moreover, we encouraged the participants to present the results of their analysis. Finally, we created a questionnaire (
Table 4) and interviewed them to collect their feedback.
6.3. Results
The evaluation process was as follows: (1) introducing data information and analysis tasks to the participants, as shown in
Table 3; (2) introducing the basic usage methods and functions of Gephi and Multi-NetVis for the participants; (3) randomly dividing the sixteen participants into two groups to complete the network analysis tasks using Multi-NetVis and Gephi; (4) after completing their analytical tasks, participants rated the system according to each description in
Table 4. A five-level Likert scale was used to score points, with scores ranging from 1 to 5 representing “strongly disagree”, “disagree”, “not sure”, “agree” and “strongly agree”, respectively.
The evaluation results (
Figure 12) show that both Multi-NetVis and Gephi perform well in the analysis task completion (A1) and fast positioning analysis goals (A2), with Multi-NetVis having an advantage on A1. According to user feedback, Multi-NetVis provides a multi-granular topology view that facilitates analysis from a variety of perspectives. On A2, the analysis process and method designed in this paper require a “global to local” interaction process, while the interaction provided by Gephi is more direct. For the small-scale network data used in the evaluation experiment, Gephi is more advantageous. However, it is necessary to provide gradual exploration guidance with increases in scale. As a result, Multi-NetVis has a clear advantage in global, community, and local analysis (A3). According to the network layout scheme, the network attributes are represented by the topology structure, which helps provide association analysis of the topology structure and attributes (A4). However, the interaction aspect (A5) is slightly inadequate. Gephi provides ample search filtering and statistical methods for the attributes. Therefore, it is more conducive to quickly finding objects with specified attributes and analyzing the crucial nodes in the network from various perspectives.
Based on this user feedback and the evaluation results, Multi-NetVis has two main advantages. On one hand, association analysis and the comparative analysis of different dimensional layouts make analysis more efficient and effective and provide more information than a one-dimensional spatial layout. On the other hand, a progressive analytical process is more clear. Nevertheless, the method is relatively weak in terms of diversified interactions, and we intend to continue to make further improvements in our future work. The multi-grained context of this process provides flexible community analysis and links between attributes and topology.
7. Conclusions
Based on the requirements of network analysis, we have proposed a guiding analysis framework and implemented a visual analysis system. This system supports overall, community, and local multi-granularity analysis for multivariate network, breaking out of the limitations of a single-dimensional layout space.
Through system-based case studies, we find that the searching and matching of nodes is very important. Although the detailed information of nodes can be obtained through the analysis process, search and match functions for specific conditions are not supported. For multivariate networks with more attribute dimensions, the performance of the hierarchical layout needs to be optimized. In light of these drawbacks, we intend to make continued improvements to the system’s functionality by comparing it with similar tools such as Gephi, Cytoscape, etc.
8. Future Work
In this paper, we have studied the layout and interaction aspects of visual analysis of multivariate networks and proposed a topology layout and context-based interaction system for multi-dimensional spatial networks suitable for multivariate network analysis. According to the layout and interaction scheme, we designed and developed a system supporting visual analysis of multiple networks. The system was evaluated and analyzed by comparative experiments. Based on our analysis of the evaluation results, there are deficiencies in this work which need to be further improved in future work.
Improve layout effect: for large scale networks, the layout effect obtained by the multi-dimensional space transformation proposed in this paper is not ideal, and a large number of nodes can easily cause occlusion and overlapping. Although this paper uses the layout constraint method for adjustment, this can cause problems with excessive tightness or sparsity for networks with uneven density. In future work, continued improvements should be made to the layout method and layout constraint specification in order to make the layout more uniform.
Improve system function: firstly, we found that searching and matching nodes are very efficient for locating and analyzing targets quickly in the process of system comparison and evaluation. In this paper, although we provide a progressive exploration scheme to guide users in locating analysis targets, this requires going through a complete exploration process, and lacks the function of searching and matching specific conditions at any time. Second, the 2D layout of the system has great expansibility. Except for the transformation layout, the system developed in this paper only provides the ring layout. In subsequent work, more layouts could be added to the 2D layout module of the system for different analysis scenarios. As the 2D layout is very suitable for fine operations, network editing functions such as node addition and deletion, attribute change, etc., could be added in the 2D layout module. Finally, because this paper mainly studied the layout and interaction of multivariate networks, the network analysis method is not perfect. For example, when analyzing the transmission network of infectious diseases, it is necessary to predict the network transmission mode and trend. Diversified network analysis algorithms could be provided as configuration plug-ins in future work to select corresponding analysis methods according to specific data background requirements.
Author Contributions
Data curation, T.C.; Methodology, S.W. and T.C.; Resources, S.C.; Software, S.C.; Supervision, T.C.; Validation, T.C.; Visualization, T.C.; Writing—original draft, S.C.; Writing—review & editing, S.W. and Y.W. All authors have read and agreed to the published version of the manuscript.
Funding
This research was funded by the National Natural Science Foundation of China (61802320, 61872304); Natural Science Foundation of Sichuan Province (2022NSFSC0961); Doctoral Fund of Southwest University of Science and Technology (19ZX7144); and Southwest University of Science and Technology Quality Education Reform (Youth Development Research) Special Fund Project (No. 20SZJG17).
Data Availability Statement
Not applicable.
Conflicts of Interest
The authors declare no conflict of interest.
References
- Borsboom, D.; Deserno, M.K.; Rhemtulla, M.; Epskamp, S.; Fried, E.I.; McNally, R.J.; Robinaugh, D.J.; Perugini, M.; Dalege, J.; Costantini, G.; et al. Network analysis of multivariate data in psychological science. Nat. Rev. Methods Prim. 2021, 1, 58. [Google Scholar] [CrossRef]
- Machacon, H. Network Visualization and Analysis of Ebola Tweet Semantics. In Proceedings of the International Conference on Mechanical, Electrical and Medical Intelligent System, Kiryu, Japan, 4–6 December 2019. [Google Scholar]
- Linhares, C.D.; Ponciano, J.R.; Pereira, F.S.; Rocha, L.E.; Paiva, J.G.S.; Travençolo, B.A. Visual analysis for evaluation of community detection algorithms. Multimed. Tools Appl. 2020, 79, 17645–17667. [Google Scholar] [CrossRef]
- Huang, X.; Chen, D.; Ren, T.; Wang, D. A survey of community detection methods in multilayer networks. Data Min. Knowl. Discov. 2021, 35, 1–45. [Google Scholar] [CrossRef]
- Blondel, V.D.; Guillaume, J.L.; Lambiotte, R.; Lefebvre, E. Fast unfolding of communities in large networks. J. Stat. Mech. Theory Exp. 2008, 2008, P10008. [Google Scholar] [CrossRef]
- Paranyushkin, D. InfraNodus: Generating insight using text network analysis. In Proceedings of the World Wide Web Conference, San Francisco, CA, USA, 13–17 May 2019; pp. 3584–3589. [Google Scholar]
- Bigelow, A.; Nobre, C.; Meyer, M.; Lex, A. Origraph: Interactive network wrangling. In Proceedings of the 2019 IEEE Conference on Visual Analytics Science and Technology (VAST), Vancouver, BC, Canada, 20–25 October 2019; pp. 81–92. [Google Scholar]
- Kim, S.; Lee, C.; Park, J.; Yoon, S.; Choi, Y.; Kim, J. A Simple Visualization Method for Three-Dimensional (3D) Network. Discret. Dyn. Nat. Soc. 2021, 2021, 1426212. [Google Scholar] [CrossRef]
- Pavlopoulos, G.A.; O’Donoghue, S.I.; Satagopam, V.P.; Soldatos, T.G.; Pafilis, E.; Schneider, R. Arena3D: Visualization of biological networks in 3D. BMC Syst. Biol. 2008, 2, 104. [Google Scholar] [CrossRef] [PubMed]
- Mcgee, F.; Ghoniem, M.; Melançon, G.; Otjacques, B.; Pinaud, B. The state of the art in multilayer network visualization. In Proceedings of the Computer Graphics Forum; Wiley Online Library: Hoboken, NJ, USA, 2019; Volume 38, pp. 125–149. [Google Scholar]
- Du, X.; Wei, Y.; Wu, L. Visual Analysis of Double-Layer networks using a 2.5 D method. In Proceedings of the IEEE 2015 International Conference on Virtual Reality and Visualization (ICVRV), Xiamen, China, 17–18 October 2015; pp. 253–259. [Google Scholar]
- Zhao, Y.; Jiang, H.; Chen, Q.; Qin, Y.; Xie, H.; Wu, Y.; Liu, S.; Zhou, Z.; Xia, J.; Zhou, F. Preserving Minority Structures in Graph Sampling. IEEE Trans. Vis. Comput. Graph. 2021, 27, 1698–1708. [Google Scholar] [CrossRef]
- Burch, M.; Ten Brinke, K.B.; Castella, A.; Peters, G.K.S.; Shteriyanov, V.; Vlasvinkel, R. Dynamic graph exploration by interactively linked node-link diagrams and matrix visualizations. Vis. Comput. Ind. Biomed. Art 2021, 4, 23. [Google Scholar] [CrossRef] [PubMed]
- Nobre, C.; Meyer, M.; Streit, M.; Lex, A. The state of the art in visualizing multivariate networks. In Proceedings of the Computer Graphics Forum; Wiley Online Library: Hoboken, NJ, USA, 2019; Volume 38, pp. 807–832. [Google Scholar]
- Cao, N.; Lin, Y.R.; Li, L.; Tong, H. g-miner: Interactive visual group mining on multivariate graphs. In Proceedings of the 33rd Annual ACM Conference on Human Factors in Computing Systems, Seoul, Korea, 18–23 April 2015; pp. 279–288. [Google Scholar]
- Cava, R.; Freitas, C.M.D.S.; Winckler, M. Clustervis: Visualizing nodes attributes in multivariate graphs. In Proceedings of the Symposium on Applied Computing, Marrakech, Morocco, 27–31 March 2017; pp. 174–179. [Google Scholar]
- Shi, L.; Liao, Q.; Tong, H.; Hu, Y.; Wang, C.; Lin, C.; Qian, W. OnionGraph: Hierarchical topology+ attribute multivariate network visualization. Vis. Inform. 2020, 4, 43–57. [Google Scholar] [CrossRef]
- Liu, Y.; Wang, C.; Ye, P.; Zhang, K. HybridVis: An adaptive hybrid-scale visualization of multivariate graphs. J. Vis. Lang. Comput. 2017, 41, 100–110. [Google Scholar] [CrossRef]
- Gibson, H.; Vickers, P. graphTPP: A multivariate based method for interactive graph layout and analysis. arXiv 2017, arXiv:1712.05644. [Google Scholar]
- Zhao, Y.; Shi, J.; Liu, J.; Zhao, J.; Zhou, F.; Zhang, W.; Chen, K.; Zhao, X.; Zhu, C.; Chen, W. Evaluating Effects of Background Stories on Graph Perception. IEEE Trans. Vis. Comput. Graph. 2021. [Google Scholar] [CrossRef]
- Fruchterman, T.M.; Reingold, E.M. Graph drawing by force-directed placement. Softw. Pract. Exp. 1991, 21, 1129–1164. [Google Scholar] [CrossRef]
- Holten, D.; Van Wijk, J.J. Force-directed edge bundling for graph visualization. In Proceedings of the Computer Graphics Forum; Wiley Online Library: Hoboken, NJ, USA, 2009; Volume 28, pp. 983–990. [Google Scholar]
- Wu, K.; Taki, Y.; Sato, K.; Sassa, Y.; Inoue, K.; Goto, R.; Okada, K.; Kawashima, R.; He, Y.; Evans, A.C.; et al. The overlapping community structure of structural brain network in young healthy individuals. PLoS ONE 2011, 6, e19608. [Google Scholar] [CrossRef] [PubMed]
- Adamic, L.A.; Glance, N. The political blogosphere and the 2004 US election: Divided they blog. In Proceedings of the 3rd International Workshop on Link Discovery, Chicago, IL, USA, 21–25 August 2005; pp. 36–43. [Google Scholar]
Figure 1.
The schematic workflow of our system.
Figure 1.
The schematic workflow of our system.
Figure 2.
Layout transformation process. (a) 3D network topology; (b) Network community division; (c) 2D projection; (d) 2.5D network topology.
Figure 2.
Layout transformation process. (a) 3D network topology; (b) Network community division; (c) 2D projection; (d) 2.5D network topology.
Figure 3.
Louvain-3D FDA implementation process.
Figure 3.
Louvain-3D FDA implementation process.
Figure 4.
The interaction force between edges P and Q.
Figure 4.
The interaction force between edges P and Q.
Figure 5.
The interface of Multi-NetVis consists of six components: (A1) the data description panel shows the node and edge properties of the network; (A2) the centrality view depicts the degree, closeness centrality, and betweenness of the global network; (A3) the community view focuses on the community characteristics of the network, which consist of the average degree, closeness centrality, and betweenness of each community. Multiple communities can be selected directly for network topology analysis. (B1) The 3D layout view shows the three-dimensional topology and a thumbnail of the global network. The global network topology shows different visual representations via the force-directed and the community-based layouts, allowing users to encode the node color according to the node’s categories. (B2) The 2.5D layout view shows the attribute-oriented topology layout. Users can select the hierarchical network layout based on the node categories or edge categories, and each selected layer can be set as rendered or hidden in order to respond to different analysis requirements. (B3) The 2D layout view shows the network layer selected from 2.5D layout view. The force-directed layout and circular layout are supported to render the network topology, in which nodes can be selected to check the details as well as marked in the 3D layout view and 2.5D layout view.
![Applsci 12 08405 g005]()
Figure 6.
Workflow of interaction: (a) global network-based exploration; (b) community-based exploration; (c) attribute-oriented topology analysis; (d) local-based network topology analysis.
Figure 6.
Workflow of interaction: (a) global network-based exploration; (b) community-based exploration; (c) attribute-oriented topology analysis; (d) local-based network topology analysis.
Figure 7.
The overall topology and central distribution; the node colors indicate different communities.
Figure 7.
The overall topology and central distribution; the node colors indicate different communities.
Figure 8.
Community layout; the colors indicate different “groups”.
Figure 8.
Community layout; the colors indicate different “groups”.
Figure 9.
2.5D and 2D layouts of brain network.
Figure 9.
2.5D and 2D layouts of brain network.
Figure 10.
Global and community-based topology layout.
Figure 10.
Global and community-based topology layout.
Figure 11.
The analysis process from community to local. (a) Network community structure; (b) 2.5D network structure; (c) 2D work structure.
Figure 11.
The analysis process from community to local. (a) Network community structure; (b) 2.5D network structure; (c) 2D work structure.
Figure 12.
Evaluation results.
Figure 12.
Evaluation results.
Table 1.
Basic tasks in analysis of multivariate networks.
Table 1.
Basic tasks in analysis of multivariate networks.
| Number | Task |
|---|
| 1 | Finding entities and properties in the multivariate network |
| 2 | Calculating derived properties which are not originally presented in the data |
| 3 | Revisiting entities and properties already identified or determined |
| 4 | Deriving insight or knowledge from the data as an outcome of performing a sequence of operational and analytical tasks |
Table 2.
Data Declaration.
Table 2.
Data Declaration.
| Number | Name | Declaration |
|---|
| D1 | Brain network | The dataset has two part (Alzheimer’s disease patients and healthy individuals). |
| D2 | Book Correlation network | The dataset consists of American political books sold on the Amazon.com platform. |
Table 3.
Tasks.
| Number | Analysis Task Description |
|---|
| T1 | Find out which brain area “group” attribute is “group1”, and use analysis to find the more critical brain areas within these brain areas (R2) |
| T2 | Identify the community of the most connected brain areas, and identify the most important brain area within that community (R1) |
| T3 | Identify two or three brain areas considered important in “group2” and evaluate their global, community, and local importance (R2, R3) |
| T4 | Find the brain areas in the brain network of AD patients where activity is significantly lower than in the normal brain network (R1) |
| T5 | Find the brain areas in the brain network of AD patients where activity is significantly higher than in the normal brain network (R1) |
Table 4.
Assessment Items.
Table 4.
Assessment Items.
| Number | Number |
|---|
| A1 | Supports completing analytical tasks quickly and accurately |
| A2 | Supports quickly locating the target node or local structure |
| A3 | Instructively supports analysis of the network structure, community structure, and local structure |
| A4 | Renders topology associated with attributes |
| A5 | Friendly interaction design reduces interference with analysis caused by edge/node occlusion |
| Publisher’s Note: MDPI stays neutral with regard to jurisdictional claims in published maps and institutional affiliations. |
© 2022 by the authors. Licensee MDPI, Basel, Switzerland. This article is an open access article distributed under the terms and conditions of the Creative Commons Attribution (CC BY) license (https://creativecommons.org/licenses/by/4.0/).


