Article

Target Speaker Extraction by Fusing Voiceprint Features

School of Software Engineering, Tongji University, Shanghai 201804, China
*
Author to whom correspondence should be addressed.
Appl. Sci. 2022, 12(16), 8152; https://doi.org/10.3390/app12168152
Submission received: 14 July 2022 / Revised: 10 August 2022 / Accepted: 12 August 2022 / Published: 15 August 2022
(This article belongs to the Special Issue Advances in Speech and Language Processing)

Abstract

:
It is a critical problem to accurately separate clean speech in the multispeaker scenario for different speakers. However, in most cases, smart devices such as smart phones interact with only one specific user. As a consequence, the speech separation models adopted by these devices only have to extract the target speaker’s speech. A voiceprint, which reflects the speaker’s voice characteristics, provides prior knowledge for the target speech separation. Therefore, how to efficiently integrate voiceprint features into the existing speech separation models to improve their performance for the target speech separation is an interesting problem not fully explored. This paper attempts to solve this issue to some extent and our contributions are as follows. First, two different voiceprint features (i.e., MFCCs and d-vector) are explored in the performance enhancement for three speech separation models. Second, three different feature fusion methods are proposed to efficiently fuse the voiceprint features with the magnitude spectrograms originally used in the speech separation models. Third, a target speech extraction method which utilizes the fused features is proposed for two speaker-independent models. Experiments demonstrate that the speech separation models integrated with voiceprint features using three feature fusion methods can effectively extract the target speaker’s speech.

1. Introduction

Speech separation is an essential problem in human–computer interactions, the output of which provides clean audios for downstream tasks such as automatic speech recognition [1,2,3], speaker recognition [4], speaker diarization [5], etc. The existing speech separation models can be categorized into two types: speaker-independent and speaker-dependent. The speaker-independent models extract speech corresponding to different speakers from the mixing audio in an unsupervised way without any prior knowledge. They can be further classified into time–frequency-domain ones, such as deep clustering (DPCL) [6,7], deep attractor network (DANet) [8] and permutation invariant training network (PITNet) [9], and time-domain ones, such as time-domain audio separation network (TasNet) [10] and fully convolutional time-domain audio separation network (Conv-TasNet) [11]. DPCL [6] first maps time–frequency (T–F) bins in the magnitude spectrograms into the embedding space and then uses a clustering algorithm to generate binary spectrogram masks.Then, these masks are applied on the original magnitude spectrograms to obtain masked spectrograms corresponding to a single speaker. DANet [8] forms a reference point (attractor) for each speaker in the embedding space, which is used as the center point for clustering. PITNet [9] uses PIT techniques that minimize reconstruction errors under minimum energy ranking to solve the permutation problem in the training stage. The time–frequency domain model calculates the short-time Fourier transform (STFT) to create a T–F representation of the mixing audio, which imposes an upper bound on separation performance. TasNet [10] replaced the STFT and inverse STFT with a trained encoder–decoder pair to remove the constraint between time precision and feature dimension size in the STFT. Conv-TasNet [11] uses stacked dilated 1-D convolutional blocks to replace the deep long short-term memory (LSTM) [12] networks in the TasNet for the separation step, which increases the separation accuracy. The above methods extract the speech of different speakers from the mixing audio in an unsupervised way without any prior knowledge. Therefore, they are called speaker-independent methods.
Nowadays, smart devices such as smart phones receive and recognize speech from the target speaker most of the time. Speech separation techniques towards these smart devices are more concerned about separating the target speaker’s speech rather than all the speakers’ speech. The speaker-dependent models focus on extracting a specific speaker’s speech from the noisy audio based on speaker-dependent information. The task of speaker-dependent speech separation is also regarded as the target speaker extraction. A voiceprint is the sound spectrogram graph which reflects a speaker’s voice characteristics. It provides useful knowledge for the speech separation models and helps to improve their performance consequently. For example, SpeakerBeam [13] uses an additional slice of speech of the target speaker to separate the target speaker from the interfering talkers. The method embeds a speaker-adaptive layer into a deep neural network (DNN) to adapt to the target speaker. VoiceFilter [14,15] adopts the LSTM model to output the target speaker’s speech. It uses a speaker encoder to extract the target speaker’s embedding and predicts the T–F bin mask corresponding to the target speaker using LSTM network. The target speaker extraction network (TENet) [16] accumulates the robust speaker embeddings over all the speech of a single speaker to get stable speaker characteristics in the training stage. It can achieve a good performance based on only a few anchors. Most target speaker extraction models adopt a speaker extraction module to predict a spectral mask based on the output of the voiceprint encoder. Both the speaker extraction module and the voiceprint encoder are implemented using deep networks and optimized jointly in the training stage. However, in some low-resource conditions such as embedded platforms, these computationally heavy models are not feasible.
The mel-scale frequency cepstral coefficients (MFCCs) are a set of acoustic features which are often used in the tasks of speech recognition [17], speaker verification [18], sound classification [19,20], etc. They contain sufficient information about the speaker’s voice characteristics, such as energies in different frequency regions, and are regarded as voiceprint features for speaker identification and verification. With the development of deep learning techniques, the deep speaker embeddings (e.g., i-vector, d-vector, and x-vector) have been proposed. The i-vector [21] is extracted from the bottleneck layer of a DNN and is widely used in the speaker verification task [22,23] along with a probabilistic linear discriminant analysis (PLDA) [24] scoring model. The d-vector [25,26] is one of the DNN-based embeddings designed for the speaker verification task. It is extracted from the log-mel filter-bank features of the audio by employing a maxout DNN. The d-vector features are generated by averaging the last hidden layer activation of the model. The x-vector [27] is an important evolution of the d-vector, which is extracted using a time-delayed neural network [28] and a statistical pooling operation. It has demonstrated its effectiveness in many speaker recognition applications [29,30,31,32,33].
Considering that MFCCs and other widely used voiceprint features can be easily obtained, they can be directly applied to target speaker extraction tasks. However, to our knowledge, it has not been fully discussed how to effectively integrate the existing voiceprint features into the speaker extraction models. Therefore, in this paper, we propose three different voiceprint feature fusion methods and explore the effectiveness of fused features in the task of target speaker extraction. Specifically, two types of voiceprint features, i.e., MFCCs and d-vector, are fused with the magnitude spectrograms which were originally used in the speaker-independent speech separation models. Besides, three feature fusion methods are proposed for merging the features of voiceprint and magnitude spectrograms. These methods are uniformly named Tse-FV (short for target speaker extraction by fusing voiceprint features) model.
Our contributions are summarized as follows:
  • Two types of voiceprint features, i.e., MFCCs and d-vector, are explored and their effectiveness in performance enhancement when integrated into the speaker-independent speech separation models is investigated. Moreover, the d-vector features originally used by VoiceFilter are substituted for MFCC features for a performance comparison.
  • Three different feature fusion methods are proposed to fuse the voiceprint features with the magnitude spectrograms: (1) direct concatenation (Tse-FV(DC)); (2) expanded convolution and concatenation (Tse-FV(ECC)); and (3) concatenation and expanded convolution (Tse-FV(CEC)).
  • A feature integration method which efficiently integrates the voiceprint features into two speaker-independent speech separation models, i.e., DPCL and PITNet, is proposed.
Experimental results are presented to corroborate the effectiveness and computational efficiency of the proposed Tse-FV model.

2. Methodology

2.1. Overview of Tse-FV

As shown in Figure 1, the workflow of Tse-FV consists of three stages: (1) feature extraction; (2) feature fusion; and (3) target speech extraction. In the feature extraction stage, voiceprint features, e.g., MFCCs and d-vectors, are extracted from the reference speech. In addition, magnitude spectrograms are extracted from the noisy audio. In the feature fusion stage, extracted voiceprint features and magnitude spectrograms are concatenated in three ways to construct fused features. In the speech extraction stage, speech separation models are adopted to generate masked magnitude spectrograms corresponding to the target speaker. In the end, the masked magnitude spectrograms are transformed to the clean speech of the target speaker using an inverse STFT. The three stages of the model are described in detail in the following.

2.1.1. Feature Extraction

Given a noisy audio containing different speakers’ speech a m i x , the magnitude spectrograms can be extracted as follows. First, a m i x is transformed into the complex domain using an STFT. Then, the phase spectrograms x p h a s e and the magnitude spectrograms x m a g are obtained. x m a g was adopted to generate the masked magnitude spectrograms corresponding to the target speaker according to the scheme used in [6,8,9].
Given a reference speech s of the target speaker, two types of voiceprint features are extracted (as shown in Figure 1a). The first type is the MFCC features r m f c c . When calculating the mel spectrograms, the lengths of the fast Fourier transform (FFT) window, the frame shift, and the number of mel filters are set to 256, 64, and 40, respectively. The dimension of the extracted MFCC features is set to 13. In the end, a set of MFCC features r m f c c R T × 13 , where T denotes the number of time frames, can be obtained.
The second type of voiceprint features is the d-vector. The d-vector extraction model, which consists of three LSTM layers and a linear layer, is trained on the VoxCeleb1 [34] dataset with the generalized end-to-end loss function [26]. The d-vector is computed based on the 40-dimension log-mel spectrograms of the reference speech s . An L2 normalization is performed on the 256-dimension output of the d-vector extraction model to obtain the d-vector features r d v e c R 256 using Equation (1), where f ( · ) denotes the output of the model and w denotes the parameters of the d-vector extraction model.
r l o g _ m e l = Log _ Mel _ Spec ( s ) r d v e c = f r l o g _ m e l ; w f r l o g _ m e l ; w 2
The lengths of the FFT window and the frame shift used in the d-vector extraction are the same as those in MFCCs’ extraction. Therefore, the first dimension of r m f c c and x m a g is the same.

2.1.2. Feature Fusion

The voiceprint features extracted from the reference speech are fused with the magnitude spectrograms extracted from the noisy audio using three different methods, i.e., Tse-FV(DC), Tse-FV(ECC), and Tse-FV(CEC). Finally, a set of fused features x f u s e is constructed and fed into the next stage.
Three proposed feature fusion methods are shown in Figure 1b. Specifically, the expanded convolutional neural network (CNN) is used to capture the low-level features of the audio signals. Because the expanded CNN was demonstrated to perform well in the task of audio feature extraction in [14], it was also adopted in our work. Denote the column number of the voiceprint features as D, the number of time frames as T, and the frequency as N. Because the magnitude spectrogram feature x m a g R T × N , and the d-vector r d v e c R 1 × D , r d v e c is copied T times along the first dimension (as shown in Equation (2)) to match the first dimension of x m a g . In the end, r d v e c R T × D is obtained and then concatenated to x m a g .
r d v e c = d 1 , d 2 , d D 1 × D r d v e c = d 1 , d 2 , d D d 1 , d 2 , d D d 1 , d 2 , d D T × D
Direct Concatenation. In the DC method, voiceprint features ( r m f c c or r d v e c , which are uniformly denoted by r f e a t ) are directly concatenated to x m a g along the first dimension using Equation (3).
x f u s e = x m a g ; r f e a t
Expanded Convolution and Concatenation. In the ECC method, x m a g is first input into the expanded CNN layer and then concatenated to r f e a t as
x c o n v = CNN ( x m a g ) x f u s e = x c o n v ; r f e a t
Concatenation and Expanded Convolution. In the CEC method, first r f e a t is concatenated to x m a g and then the concatenated feature x c o n c a t is fed into the expanded CNN layer to obtain the fused feature x f u s e using Equation (5).
x c o n c a t = x m a g ; r f e a t x f u s e = CNN ( x c o n c a t )

2.1.3. Target Speech Extraction

As shown in Figure 1c, the speech separation models predict the masked magnitude spectrograms corresponding to the target speaker based on the fused features x f u s e . Three speech separation models were explored: (1) the DPCL model [6,7] consisting of four LSTM layers, a dropout layer, and a linear layer; (2) the PITNet model [9] consisting of four LSTM layers, a dropout layer, and two linear layers; and (3) the VoiceFilter [14] model consisting of three LSTM layers and two linear layers. Both DPCL and PITNet are speaker-independent speech separation models which output several estimated spectrograms according to a preset number of speakers without prior knowledge of speakers. In order to apply the speaker’s voiceprint features into DPCL and PITNet, a new feature integration method is proposed as shown below.
First, DPCL and PITNet adopt LSTM to generate an embedding e for each T–F bin in x f u s e as
e = LSTM ( x f u s e ; θ )
where θ is a model parameter vector. The speaker-dependent voiceprint information contained in x f u s e helps to make embeddings of the target speaker’s T–F bins more distinctive from the others.
Then, DPCL uses the K-means clustering algorithm to generate a partition of the embeddings m 1 , , m C corresponding to a preset number of speakers C as
m 1 , , m C = K - Means ( e , C )
where m 1 , , m C are called the magnitude spectrogram masks. By contrast, PITNet uses linear layers to estimate m i for all embeddings as
m 1 , , m C = g l i n e a r ( e ; θ ) ; m i 0 , i = 1 C m i = 1
To extract the target speaker’s speech, DPCL and PITNet are designed to output two spectrogram masks, i.e., C equals 2. One spectrogram mask corresponds to the target speaker and the other corresponds to all the other speakers including the background noise. However, which spectrogram mask corresponds to the target speaker has not been determined yet.
Then, m i is applied on x m a g to generate the ith estimated magnitude spectrograms x ^ m a g i for the ith speaker using Equation (9), where ⊙ denotes the Hadamard Product.
x ^ m a g i = m i x m a g
After that, x ^ m a g i is transformed into waveforms y ^ i using the inverse STFT. The cosine similarity between the referenced d-vector r d v e c and the d-vector of the generated speech y ^ i , i.e., r d v e c i , are computed and the speech y ^ corresponding to the largest similarity is regarded as the target speaker’s speech as shown in Equation (10).
y ^ = arg max y ^ i cos ( r d v e c , r d v e c i )
Different from DPCL/PITNet, VoiceFilter is a speaker-dependent model which only outputs the estimated magnitude spectrogram mask corresponding to the target speaker. It adopts LSTM to predict the target magnitude spectrogram mask m based on the inputs of r d v e c and x m a g . In this work, r d v e c was substituted by r m f c c and m was obtained using the speech separation module of VoiceFilter based on x f u s e .
After obtaining the magnitude spectrogram mask m corresponding to the target speaker, the estimated magnitude spectrogram feature x ^ m a g corresponding to the target speaker is generated by multiplying m with x m a g using Equation (9).
In the end, the estimated clean speech y ^ of the target speaker is generated from x ^ m a g using the inverse STFT.

3. Experiments and Results

3.1. Experiment Settings

Data generation The train-clean-100 subset and test-clean subset of the LibriSpeech [35] were used to generate the dataset for the performance evaluation experiments. There were 251 speakers and 40 speakers in the train-clean-100 subset and the test-clean subset, respectively. Tse-FV requires two inputs: (1) the noisy audio a m i x and (2) the reference speech s of the target speaker.
In the stage of dataset generation, two speakers marked as speaker A and speaker B were selected and speaker A was regarded as the target speaker. Then, the reference speech and target speech of the target speaker were randomly selected from the speech library of speaker A and the interfering speech was randomly selected from the speech library of speaker B. After that, silent segments in the speech were removed. The signal-to-noise (SNR) value was used to adjust the amplitude of the target speech and the interfering speech, which is a common way of controlling the relative level of two segments of speech [6,8,9,36]. Denote the selected SNR value as α . The amplitude of the target speech was enhanced by multiplying a coefficient 10 α 20 to its time-domain signal. By contrast, the amplitude of the interfering speech was reduced by multiplying a coefficient 10 α 20 to its time-domain signal. In order to balance the SNR distribution in the training set and the test set, the selected SNR values obeyed the uniform distribution. The values of SNR were uniformly distributed over the half-open interval [ 0 dB , 5 dB ) in this work. Then, a m i x was generated by adding the adjusted speech together. Moreover, to accelerate the speed of training, the length of each speech was limited to 3 s. In this way, a dataset consisting of 50,000 noisy audios together with 50,000 clean segments of speech of the target speakers were constructed for training. Similarly, a test set contain 1000 noisy audios and 1000 clean segments of speech of the target speaker were constructed. The sampling rate of the speech was 16 kHz.

3.1.1. Configurations of Speech Separation Models

As illustrated in Section 2.1.3, three speech separation models were selected for performance evaluation, i.e., DPCL, PITNet, and VoiceFilter. Table 1 shows the configurations of these models used in the experiments. The LSTM networks in DPCL and PITNet were used to generate speaker embeddings and the Adam optimizer was used to optimize the models.

3.1.2. Evaluation Method

Source-to-Distortion Ratio The source-to-distortion ratio (SDR) [37] was used to evaluate the performance of the proposed Tse-FV model. It is a common evaluation method to assess the performance of speech separation models, which reflects the degree of similarity between the estimated speech y ^ and the corresponding ground truth speech y . SDR can be computed using Equation (11).
SDR = 10 log 10 y 2 y y ^ 2
The higher the similarity between y ^ and y , the smaller the error y y ^ 2 . Hence, the higher the SDR, the better the performance of the model. In this work, the mir_eval [38] python library was used to compute the SDR.
Mean Opinion Score The mean opinion score (MOS) is a numerical measure of the human-judged overall quality of the speech, which is used to further evaluate the qualities of separated speech. In this experiment, 10 test audios were first randomly selected from the test set. Then, the target speech was separated using 14 speech separation models, which included DPCL, PITNet, and VoiceFilter, with and without integrating the voiceprint features using DC, CEC, and ECC feature fusion methods, as shown in Table 2. In the end, 140 segments of speech were obtained and used for evaluation. A questionnaire named MOS evaluation questionnaire (see Supplementary Materials) was set up and 20 participants were invited to rank the qualities of the 140 segments of speech. The quality score for each ranked speech varied from one to five, where one corresponded to the worst quality and five corresponded to the best quality. The final MOS value for the evaluated speech s i was calculated by averaging the scores from 20 participants as,
M O S s i = n = 1 N r n i N
where N = 20 is the number of participants and r n i is the rating score of the ith speech s i from the nth participant. For each model to be evaluated, its performance was represented by the average MOS of 10 segments of evaluated speech which can be computed as,
M O S m o d e l = i = 1 M n = 1 N r n i N × M
where M = 10 is the number of the evaluated speech segments.

3.2. Results

3.2.1. Comparison of Model Performance

The SDR results and the MOS results of Tse-FV model using three feature fusion methods (i.e., DC, ECC, and CEC) are shown in Table 2 and Table 3, respectively. The model sizes of Tse-FV based on DPCL, PITNet, and VoiceFilter are shown in Table 4. In the second column of Table 2, Table 3 and Table 4, “none” represents the settings of not integrating with voiceprint features. Therefore, the “none” columns in Table 2 and Table 3 give the original performance of the DPCL and PITNet models in the two-speaker speech separation task. Because VoiceFilter, as a speaker-dependent model, is designed to adopt the d-vector to extract the target speaker’s speech, the “none” setting is inapplicable for VoiceFilter. The third column “MFCC” gives the performance of three models integrating the MFCCs features. The last column “d-vector” gives the performance of three models integrating the d-vector features.
The d-vector was fused with the magnitude spectrogram only when using the ECC method. It is because d-vector is a compact representation of the target speaker and irrelevant to time and frequency. Conversely, the expanded convolutional layer was used to extract high-level features reflecting the relationship between time and frequency. Therefore, only the ECC method was adopted when integrating the d-vector features.
From Table 3, it can be seen that the original performances of the speaker-independent models, i.e., DPCL and PITNet, are the worst when evaluated on the dataset with their SDR values of 8.279 and 3.371. After integrating the MFCCs and d-vector features, the performances of DPCL and PITNet are both greatly improved. When integrating the MFCCs features, the best performance of DPCL is improved from 8.279 to 12.430 using CEC fusing method. Furthermore, the best performance of PITNet is improved from 3.371 to 11.970 using the ECC fusing method. The performances of the two models are improved by 50% and 255%, respectively. When integrating the d-vector features, the performances of DPCL and PITNet are also improved to 9.483 and 9.325. These results indicate that the voiceprint features, which reflect the characteristics of the speaker’s voice, provide useful information for the target speech extraction and have great potential in improving the performances of the speaker-independent models.
When integrating the MFCCs features using the DC, ECC, and CEC fusing methods, the best performance of the DPCL model is achieved by adopting the CEC method with SDR value 12.430. The DC fusing method exhibits the worst performance compared with that of the ECC and CEC methods with an SDR value of only 10.530. Such pattern is also found from the results of PITNet and VoiceFilter. When adopting the DC method, PITNet and VoiceFilter exhibit the worst performance with SDR values of 10.540 and 10.420. As a comparison, when adopting the ECC and CEC methods, PITNet and VoiceFilter both exhibit higher performances. The results indicate that the convolutional layer in the feature fusion process can effectively extract represented features from spectrograms or fused features and consequently improve the performances of the models.
Compared with the MFCCs features, the d-vector offers less improvement to the speech separation models. When adopting the ECC fusing method, the SDR value of the DPCL model integrating the MFCCs is 10.660. By contrast, the SDR value of DPCL integrating the d-vector is 9.483, which is slightly smaller than its counterpart. Similarly, the SDR values of PITNet integrating the MFCCs and d-vector using the ECC method are 11.970 and 9.325, respectively. Furthermore, the SDR values of VoiceFilter integrating the MFCCs and d-vector using the ECC method are 11.470 and 8.159, respectively. The worse performances of the three speech separation models integrating the d-vector features may be caused by the nature of the d-vector. The d-vector features extracted highly depend on the training speech, while the MFCCs features only contain information about energy distributions over frequencies. Therefore, they are less influenced by the irrelevant characteristics of the training speech and more stable in the speech separation task.
From Table 2, it can be seen that the qualities of the audios evaluated by the MOS are quite consistent with those evaluated by the SDR. The MOS values of the speech separation models without integrating voiceprint features are the smallest. After integrating the voiceprint features, the MOS values of these models are much improved, especially those models integrating the MFCCs features. The inconsistencies between Table 2 and Table 3 are the performances of VoiceFilter integrating the MFCCs using the ECC and CEC feature fusion methods. The SDR results indicate that VoiceFilter integrating the MFCCs using the ECC method is better than that using the CEC method. However, the MOS results indicate that VoiceFilter integrating the MFCCs using the ECC method is a little worse than when using the CEC method. In fact, the performances of these two models are very similar. Considering that the MOS is a subjective evaluation measure related to the participant, there might be some inconsistencies between the two types of evaluation results.
From Table 4, it can be seen that the size of DPCL is much smaller than that of PITNet and VoiceFilter. Nevertheless, it achieves comparable performances compared with the other two models. It even achieves the best performance when integrating the MFCCs features using the CEC fusion method. The lightweight characteristic of the DPCL model means it can be deployed in low-resource computing devices.

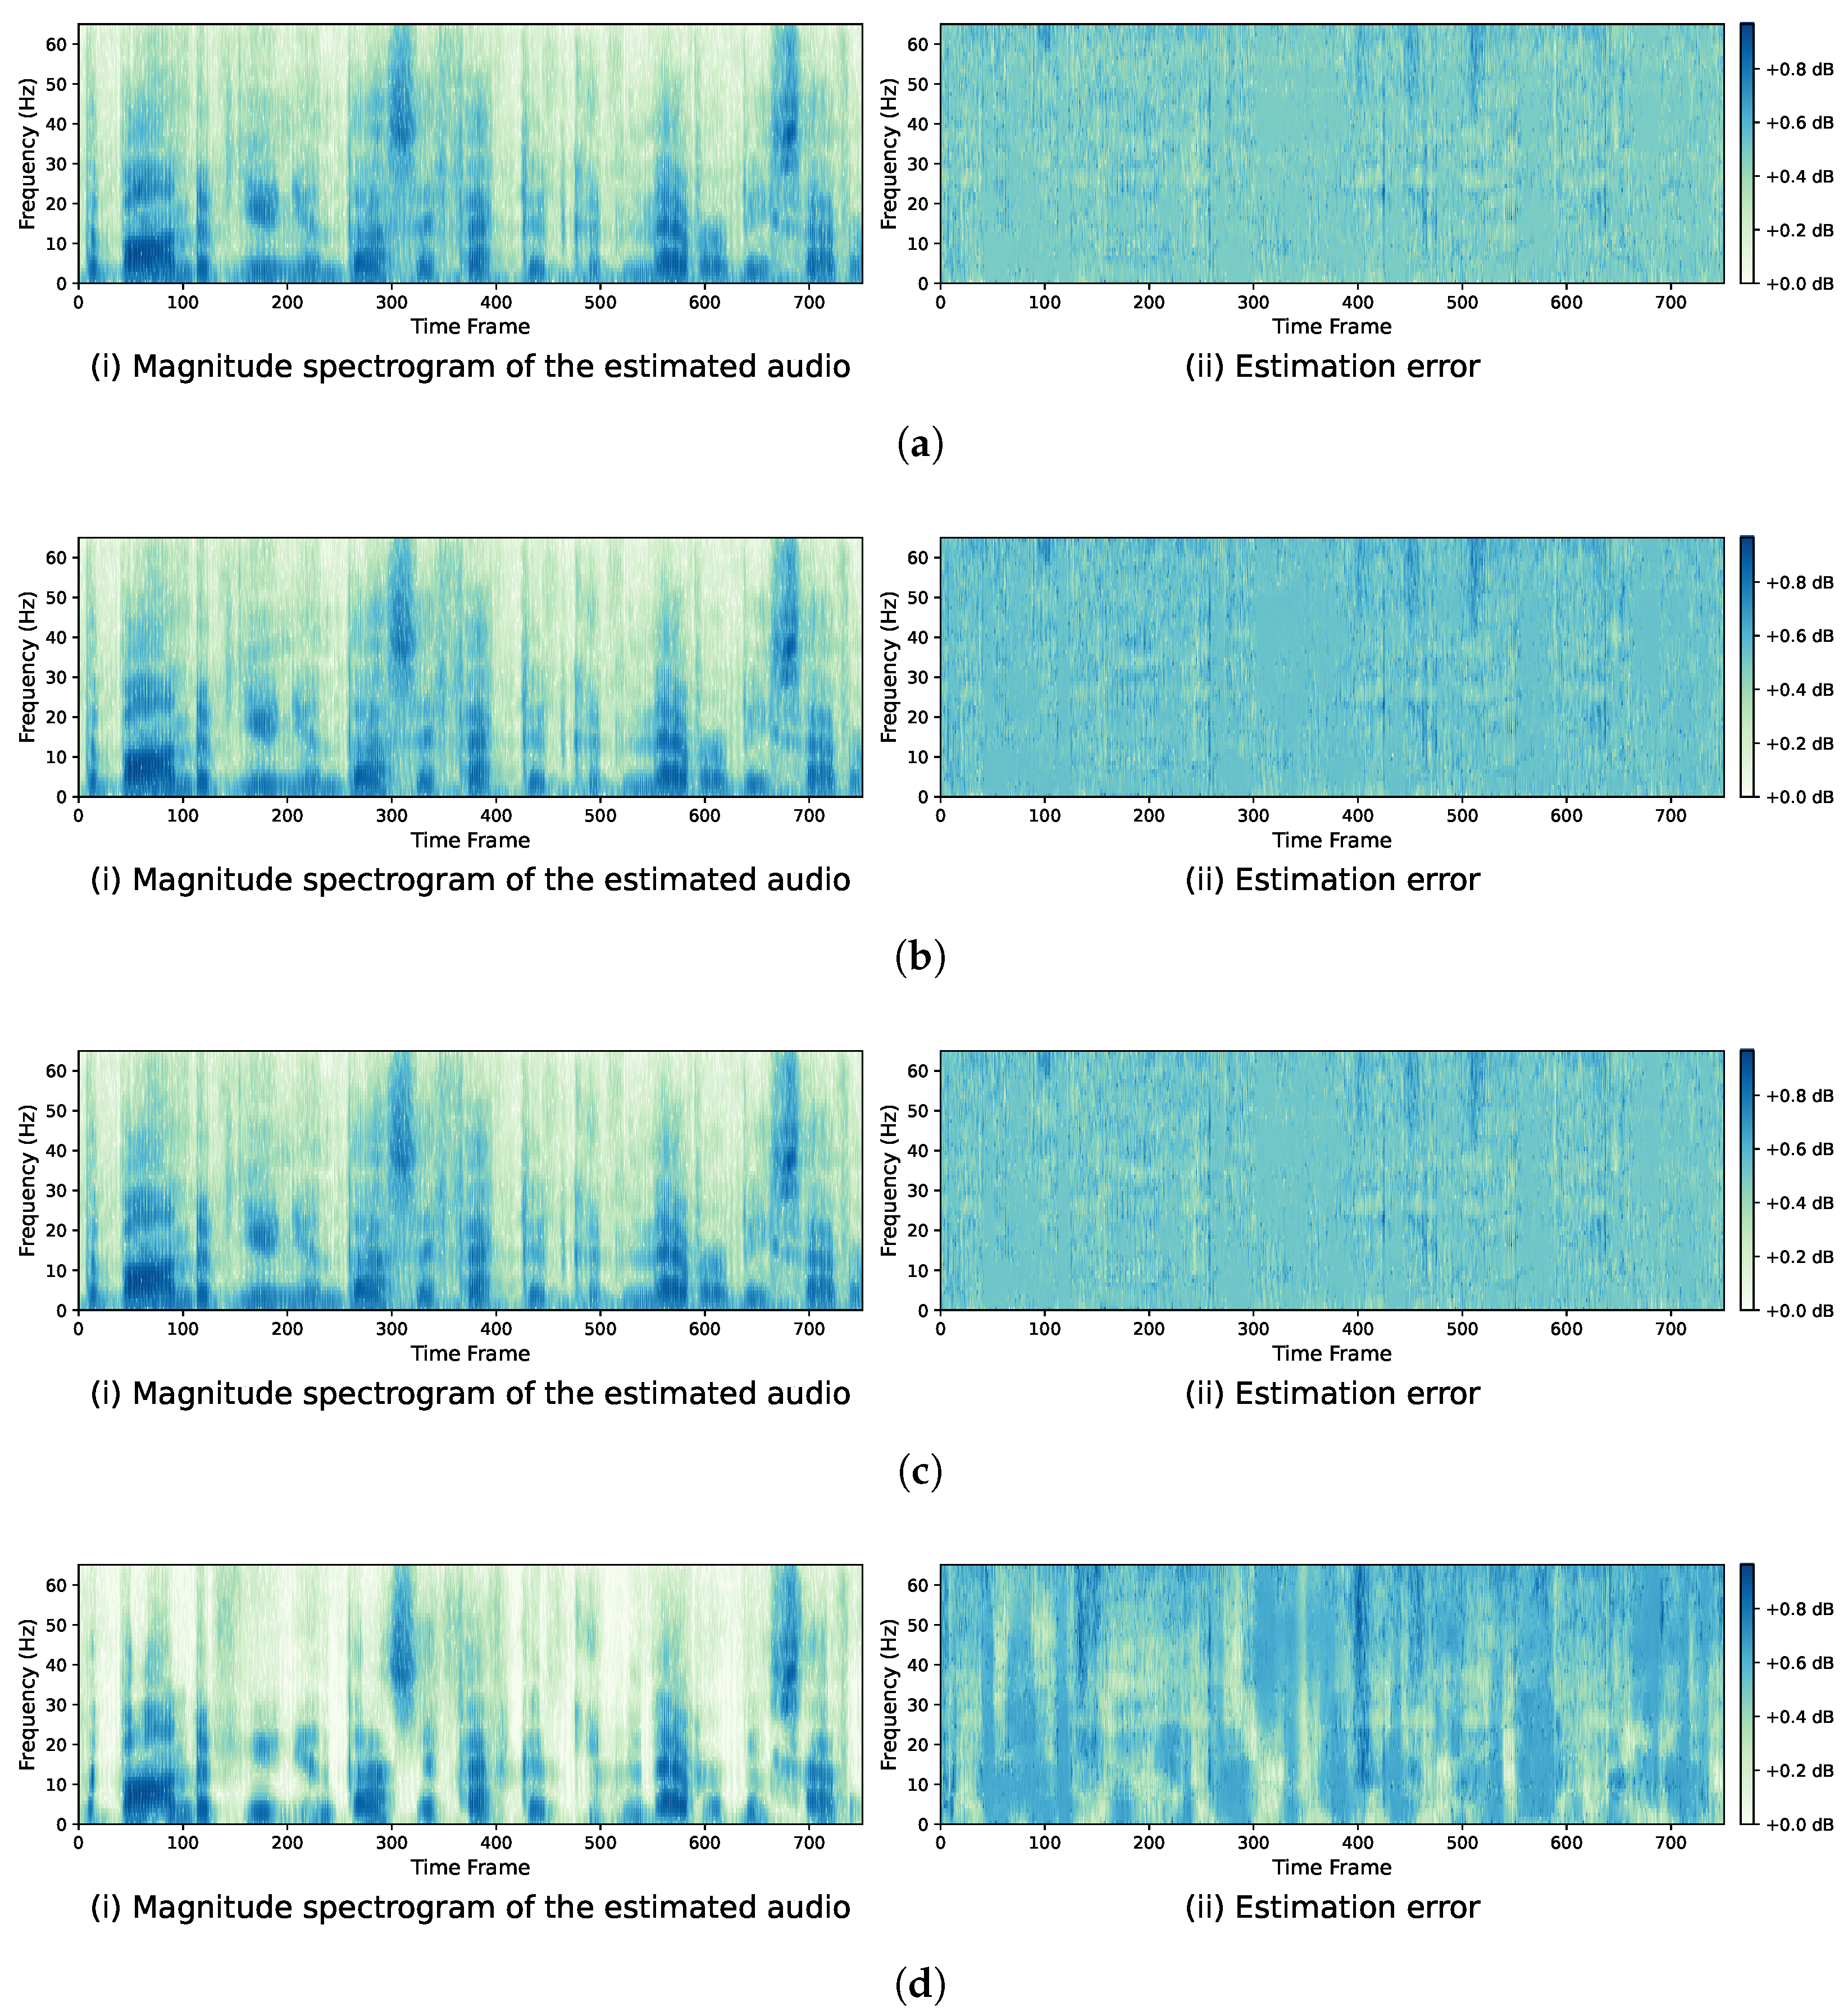
3.2.2. Comparison of Estimated Spectrogram

A noisy audio together with the target clean speech were randomly selected to analyze the characteristics of the magnitude spectrograms estimated by the proposed Tes-FV model. Figure 2 shows the log-magnitude spectrogram of the selected noisy audio and the target clean speech.
Figure 3 shows the estimated spectrogram and the estimation error of the DPCL model with and without voiceprint feature integration, when evaluated on the selected noisy audio. In the subfigures of the estimation error, the color indicates the absolute distance between the estimated spectrogram and the spectrogram of the target clean speech. The darker the point, the greater the estimation error. Compared with Figure 3a(ii), Figure 3b–e(ii) is much lighter in color, which indicates that the integration of the MFCCs/d-vector features improves the accuracy of estimation, especially in the 400~500 frame segment.
Figure 4 shows the estimated spectrogram and the estimation error of the PITNet model with and without voiceprint feature integration. Similar to Figure 3, the estimation error of the PITNet model integrating voiceprint features is much smaller than that of the original PITNet model. However, Figure 4b–e(ii) are darker than Figure 3b–e(ii), which means that the estimation error of PITNet is larger than that of DPCL. Moreover, DPCL assigns each T–F bin to only one speaker. As a comparison, PITNet predicts the percentage of the different speaker’s speech in each T–F bin. Therefore, the magnitude spectrograms estimated by PITNet look smoother than those of DPCL.
Figure 5 shows the estimated spectrogram and the estimation error of the VoiceFilter model integrating voiceprint features. From Figure 5a–d(ii), it can be seen that the estimation error of the model integrating the MFCCs features distributes more evenly compared with that of the model integrating the d-vector features. However, in certain T–F bins, the estimation error of the model integrating the d-vector features is smaller than that of the model integrating the MFCCs features. For example, in Figure 5d(ii), the area located in [150, 250; 25 Hz, 40 Hz] is brighter than the corresponding area in Figure 5a–c(ii). A conclusion can be drawn that VoiceFilter integrating the d-vector features shows a better performance in certain time frame and frequency ranges, while VoiceFilter integrating the MFCCs features shows an overall better performance.

4. Conclusions

In this paper, we explored the effectiveness of voiceprint features for the performance enhancement of speech separation models for the target speaker extraction task. Specifically, two types of voiceprint features were explored: MFCCs and d-vector. In order to integrate the voiceprint features into the magnitude spectrograms used by speaker-independent models, three feature fusion methods were proposed, i.e., Tse-FV(DC), Tse-FV(ECC), and Tse-FV(CEC). In addition, to utilize the fused features, a target speech extraction method was proposed for DPCL and PITNet. Experiments on the simulated dataset generated from the LibriSpeech demonstrated that the integration of the voiceprint feature of the target speaker could effectively improve the performances of speaker-independent models. Besides, the performances of the speech separation models using the MFCC features were generally better than those using the d-vector features. Compared with the d-vector, the MFCCs revealed a great advantage in improving the performances of both speaker-independent and speaker-dependent models.

Supplementary Materials

The following supporting information can be downloaded at: https://www.mdpi.com/article/10.3390/app12168152/s1, Table S1: MOS Evaluation: The quality score varied from 1 (WORST) to 5 (BEST).

Author Contributions

Supervision, Y.S.; writing—original draft, S.C.; writing—review and editing, Y.S. and D.W. All authors have read and agreed to the published version of the manuscript.

Funding

This work was supported in part by the National Natural Science Foundation of China under Grant 61972285, in part by the Natural Science Foundation of Shanghai under Grant 19ZR1461300, in part by the Shanghai Municipal Science and Technology Major Project under Grant 2021SHZDZX0100, and in part by the Fundamental Research Funds for the Central Universities.

Institutional Review Board Statement

Not applicable.

Informed Consent Statement

Not applicable.

Data Availability Statement

Publicly available datasets were analyzed in this study. This data can be found here: http://www.openslr.org/12.

Conflicts of Interest

The authors declare no conflict of interest.

References

  1. Li, J.; Deng, L.; Haeb-Umbach, R.; Gong, Y. Robust Automatic Speech Recognition: A Bridge to Practical Applications; Academic Press: Cambridge, MA, USA, 2015. [Google Scholar]
  2. Watanabe, S.; Delcroix, M.; Metze, F.; Hershey, J. New Era for Robust Speech Recognition; Springer International Publishing: Berlin/Heidelberg, Germany, 2017; pp. 978–983. [Google Scholar]
  3. Xiao, X.; Xu, C.; Zhang, Z.; Zhao, S.; Sun, S.; Watanabe, S.; Wang, L.; Xie, L.; Jones, D.; Chng, E. A Study of Learning Based Beamforming Methods for Speech Recognition. In CHiME 2016 Workshop; 2016; pp. 26–31. Available online: https://www.semanticscholar.org/paper/A-Study-of-Learning-Based-Beamforming-Methods-for-Xiao-Xu/242cf2e991f0eed4b1309a2a9dff548e8b95900f (accessed on 10 August 2022).
  4. Rao, W.; Xu, C.; Chng, E.; Li, H. Target speaker extraction for overlapped multi-talker speaker verification. arXiv 2019, arXiv:1902.02546. [Google Scholar]
  5. Sell, G.; Snyder, D.; McCree, A.; Garcia-Romero, D.; Villalba, J.; Maciejewski, M.; Manohar, V.; Dehak, N.; Povey, D.; Watanabe, S. Diarization is Hard: Some Experiences and Lessons Learned for the JHU Team in the Inaugural DIHARD Challenge. In Proceedings of the INTERSPEECH, Hyderabad, India, 2–6 September 2018; pp. 2808–2812. [Google Scholar]
  6. Hershey, J.; Chen, Z.; Roux, J.; Watanabe, S. Deep clustering: Discriminative embeddings for segmentation and separation. In Proceedings of the 2016 IEEE International Conference on Acoustics, Speech and Signal Processing (ICASSP), Shanghai, China, 20–25 March 2016; pp. 31–35. [Google Scholar]
  7. Isik, Y.; Roux, J.; Chen, Z.; Watanabe, S.; Hershey, J. Single-channel multi-speaker separation using deep clustering. arXiv 2016, arXiv:1607.02173. [Google Scholar]
  8. Chen, Z.; Luo, Y.; Mesgarani, N. Deep attractor network for single-microphone speaker separation. In Proceedings of the 2017 IEEE International Conference on Acoustics, Speech and Signal Processing (ICASSP), New Orleans, LA, USA, 5–9 March 2017; pp. 246–250. [Google Scholar]
  9. Yu, D.; Kolbæk, M.; Tan, Z.; Jensen, J. Permutation invariant training of deep models for speaker-independent multi-talker speech separation. In Proceedings of the 2017 IEEE International Conference on Acoustics, Speech and Signal Processing (ICASSP), New Orleans, LA, USA, 5–9 March 2017; pp. 241–245. [Google Scholar]
  10. Luo, Y.; Mesgarani, N. Tasnet: Time-domain audio separation network for real-time, single-channel speech separation. In Proceedings of the 2018 IEEE International Conference on Acoustics, Speech and Signal Processing (ICASSP), Calgary, AB, Canada, 15–20 April 2018; pp. 696–700. [Google Scholar]
  11. Luo, Y.; Mesgarani, N. Conv-tasnet: Surpassing ideal time-frequency magnitude masking for speech separation. IEEE/ACM Trans. Audio Speech Lang. Process. 2019, 27, 1256–1266. [Google Scholar] [CrossRef] [PubMed]
  12. Hochreiter, S.; Schmidhuber, J. Long short-term memory. Neural Comput. 1997, 9, 1735–1780. [Google Scholar] [CrossRef] [PubMed]
  13. Delcroix, M.; Zmolikova, K.; Kinoshita, K.; Ogawa, A.; Nakatani, T. Single channel target speaker extraction and recognition with speaker beam. In Proceedings of the 2018 IEEE International Conference on Acoustics, Speech and Signal Processing (ICASSP), Calgary, AB, Canada, 15–20 April 2018; pp. 5554–5558. [Google Scholar]
  14. Wang, Q.; Muckenhirn, H.; Wilson, K.; Sridhar, P.; Wu, Z.; Hershey, J.; Saurous, R.; Weiss, R.; Jia, Y.; Moreno, I. Voicefilter: Targeted voice separation by speaker-conditioned spectrogram masking. arXiv 2018, arXiv:1810.04826. [Google Scholar]
  15. Wang, Q.; Moreno, I.; Saglam, M.; Wilson, K.; Chiao, A.; Liu, R.; He, Y.; Li, W.; Pelecanos, J.; Nika, M.; et al. Voicefilter-lite: Streaming targeted voice separation for on-device speech recognition. arXiv 2020, arXiv:2009.04323. [Google Scholar]
  16. Li, W.; Zhang, P.; Yan, Y. TEnet: Target speaker extraction network with accumulated speaker embedding for automatic speech recognition. Electron. Lett. 2019, 55, 816–819. [Google Scholar] [CrossRef]
  17. Ittichaichareon, C.; Suksri, S.; Yingthawornsuk, T. Speech recognition using MFCC. In Proceedings of the International Conference on Computer Graphics, Simulation and Modeling, Pattaya, Thailand, 28–29 July 2012; pp. 135–138. [Google Scholar]
  18. Tiwari, V. MFCC and its applications in speaker recognition. Int. J. Emerg. Technol. 2010, 1, 12–22. [Google Scholar]
  19. Shetty, S.; Hegde, S. Automatic Classification of Carnatic Music Instruments Using MFCC and LPC. In Data Management, Analytics and Innovation; Springer: Berlin/Heidelberg, Germany, 2020; pp. 463–474. [Google Scholar]
  20. Xiao, B.; Xu, Y.; Bi, X.; Zhang, J.; Ma, X. Heart sounds classification using a novel 1-D convolutional neural network with extremely low parameter consumption. Neurocomputing 2020, 392, 153–159. [Google Scholar] [CrossRef]
  21. Dehak, N.; Kenny, P.; Dehak, R.; Dumouchel, P.; Ouellet, P. Front-end factor analysis for speaker verification. IEEE Trans. Audio Speech Lang. Process. 2010, 19, 788–798. [Google Scholar] [CrossRef]
  22. Kanagasundaram, A.; Vogt, R.; Dean, D.; Sridharan, S.; Mason, M. I-vector based speaker recognition on short utterances. In Proceedings of the INTERSPEECH, Florence, Italy, 27–31 August 2011; pp. 2341–2344. [Google Scholar]
  23. Kanagasundaram, A.; Dean, D.; Sridharan, S.; Gonzalez-Dominguez, J.; Gonzalez-Rodriguez, J.; Ramos, D. Improving short utterance i-vector speaker verification using utterance variance modelling and compensation techniques. Speech Commun. 2014, 59, 69–82. [Google Scholar] [CrossRef]
  24. Ioffe, S. Probabilistic linear discriminant analysis. In Proceedings of the European Conference on Computer Vision 2006, Graz, Austria, 7–13 May 2006; pp. 531–542. [Google Scholar]
  25. Variani, E.; Xin, L.; McDermott, E.; Moreno, I.; Gonzalez-Dominguez, J. Deep neural networks for small footprint text-dependent speaker verification. In Proceedings of the 2014 IEEE International Conference on Acoustics, Speech and Signal Processing (ICASSP), Florence, Italy, 4–9 May 2014; pp. 4052–4056. [Google Scholar]
  26. Li, W.; Quan, W.; Papir, A.; Moreno, I. Generalized End-to-End Loss for Speaker Verification. In Proceedings of the 2018 IEEE International Conference on Acoustics, Speech and Signal Processing (ICASSP), Calgary, AB, Canada, 15–20 April 2018; pp. 4879–4883. [Google Scholar]
  27. Snyder, D.; Garcia-Romero, D.; Sell, G.; Povey, D.; Khudanpur, S. X-vectors: Robust dnn embeddings for speaker recognition. In Proceedings of the 2018 IEEE International Conference on Acoustics, Speech and Signal Processing (ICASSP), Calgary, AB, Canada, 15–20 April 2018; pp. 5329–5333. [Google Scholar]
  28. Waibel, A.; Hanazawa, T.; Hinton, G.; Shikano, K.; Lang, K. Phoneme recognition using time-delay neural networks. IEEE Trans. Audio Speech Lang. Process. 1989, 37, 328–339. [Google Scholar] [CrossRef]
  29. Fang, F.; Wang, X.; Yamagishi, J.; Echizen, I.; Todisco, M.; Evans, N.; Bonastre, J. Speaker anonymization using x-vector and neural waveform models. arXiv 2019, arXiv:1905.13561. [Google Scholar]
  30. Garcia-Romero, D.; Sell, G.; McCree, A. MagNetO: X-vector Magnitude Estimation Network plus Offset for Improved Speaker Recognition. In Proceedings of the Speaker and Language Recognition Workshop (Odyssey 2020), Tokyo, Japan, 1–5 November 2020; pp. 1–8. [Google Scholar]
  31. Snyder, D.; Ghahremani, P.; Povey, D.; Garcia-Romero, D.; Carmiel, Y.; Khudanpur, S. Deep neural network-based speaker embeddings for end-to-end speaker verification. In Proceedings of the 2016 IEEE Spoken Language Technology Workshop (SLT), San Diego, CA, USA, 13–16 December 2016; pp. 165–170. [Google Scholar]
  32. Snyder, D.; Garcia-Romero, D.; Povey, D.; Khudanpur, S. Deep neural network embeddings for text-independent speaker verification. In Proceedings of the INTERSPEECH, Stockholm, Sweden, 20–24 August 2017; pp. 999–1003. [Google Scholar]
  33. Li, C.; Ma, X.; Jiang, B.; Li, X.; Zhang, X.; Liu, X.; Cao, Y.; Kannan, A.; Zhu, Z. Deep speaker: An end-to-end neural speaker embedding system. arXiv 2017, arXiv:1705.02304. [Google Scholar]
  34. Nagrani, A.; Chung, J.; Zisserman, A. VoxCeleb: A Large-Scale Speaker Identification Dataset. In Proceedings of the INTERSPEECH, Stockholm, Sweden, 20–24 August 2017; pp. 2616–2620. [Google Scholar]
  35. Panayotov, V.; Chen, G.; Povey, D.; Khudanpur, S. Librispeech: An asr corpus based on public domain audio books. In Proceedings of the 2015 IEEE International Conference on Acoustics, Speech and Signal Processing (ICASSP), South Brisbane, Australia, 19–24 April 2015; pp. 5206–5210. [Google Scholar]
  36. Luo, Y.; Chen, Z.; Mesgarani, N. Speaker-independent speech separation with deep attractor network. IEEE Trans. Audio Speech Lang. Process. 2018, 26, 787–796. [Google Scholar] [CrossRef]
  37. Vincent, E.; Gribonval, R.; Févotte, C. Performance measurement in blind audio source separation. IEEE Trans. Audio Speech Lang. Process. 2006, 14, 1462–1469. [Google Scholar] [CrossRef]
  38. Raffel, C.; Humphrey, B.M.E.; Salamon, J.; Nieto, O.; Liang, D.; Ellis, D.; Raffel, C. mir_eval: A transparent implementation of common MIR metrics. In Proceedings of the 15th International Society for Music Information Retrieval Conference, ISMIR 2014, Taipei, Taiwan, 27–31 October 2014. [Google Scholar]
Figure 1. The workflow of Tse-FV model. (a) Feature extraction. MFCCs r m f c c and d-vectors r d v e c are extracted from the reference speech. Magnitude spectrograms x m a g are extracted from multispeaker signals. (b) Feature fusion. r m f c c and r d v e c are concatenated in three ways, i.e., DC, ECC, and CEC, to construct the fused features x f u s e . (c) Speech separation. Three models (DPCL, PITNet, and VoiceFilter) are adopted to generate the estimated magnitude spectral mask corresponding to the target speaker, and the masked magnitude spectrograms are transformed to clean speech using the inverse STFT.
Applsci 12 08152 g001
Figure 2. The magnitude spectrogram of the noisy audio and the target clean speech. The x-axis represents the time frame, the y-axis represents the frequency, and the unit of color scale is dB. (a) The magnitude spectrogram of the noisy audio; (b) the magnitude spectrogram of the target clean speech.
Applsci 12 08152 g002
Figure 3. The estimated spectrograms and estimation error diagrams of DPCL model. The x-axis represents the time frame, the y-axis represents the frequency, and the unit of color scale is dB. (a) The estimated magnitude spectrogram (i) and the estimation error (ii) of the DPCL model without voiceprint feature integration. (b) The estimated magnitude spectrogram (i) and the estimation error (ii) of the DPCL model integrating MFCCs features using DC fusion method. (c) The estimated magnitude spectrogram (i) and the estimation error (ii) of the DPCL model integrating MFCCs features using ECC fusion method. (d) The estimated magnitude spectrogram (i) and the estimation error (ii) of the DPCL model integrating MFCCs features using CEC fusion method. (e) The estimated magnitude spectrogram (i) and the estimation error (ii) of the DPCL model integrating d-vector features using ECC fusion method.
Applsci 12 08152 g003
Figure 4. The estimated spectrograms and estimation error diagrams of PITNet model. The x-axis represents the time frame, the y-axis represents the frequency, and the unit of color scale is dB. (a) The estimated magnitude spectrogram (i) and the estimation error (ii) of the PITNet model without voiceprint feature integration. (b) The estimated magnitude spectrogram (i) and the estimation error (ii) of the PITNet model integrating MFCCs features using DC fusion method. (c) The estimated magnitude spectrogram (i) and the estimation error (ii) of the PITNet model integrating MFCCs features using ECC fusion method. (d) The estimated magnitude spectrogram (i) and the estimation error (ii) of the PITNet model integrating MFCCs features using CEC fusion method. (e) The estimated magnitude spectrogram (i) and the estimation error (ii) of the PITNet model integrating d-vector features using ECC fusion method.
Applsci 12 08152 g004
Figure 5. The estimated spectrograms and estimation error diagrams of VoiceFilter model. The x-axis represents the time frame, the y-axis represents the frequency, and the unit of color scale is dB. (a) The estimated magnitude spectrogram (i) and the estimation error (ii) of the VoiceFilter model integrating MFCCs features using DC fusion method. (b) The estimated magnitude spectrogram (i) and the estimation error (ii) of the VoiceFilter model integrating MFCCs features using ECC fusion method. (c) The estimated magnitude spectrogram (i) and the estimation error (ii) of the VoiceFilter model integrating MFCCs features using CEC fusion method. (d) The estimated magnitude spectrogram (i) and the estimation error (ii) of the VoiceFilter model integrating d-vector features using ECC feature fusion method.
Applsci 12 08152 g005
Table 1. Configurations of three speech separation models.
DPCLPITNetVoiceFilter
LSTMnum_layers443
hidden_size300896600
bidirectionalTrueTrueTrue
OptimizeractivationTanhReluRelu, sigmoid
typeAdamAdamAdam
learning_rate1.0 × 10−41.0 × 10−31.0 × 10−4
weight_decay000
Table 2. Average MOS values corresponding to the three speech separation models with and without voiceprint feature integration.
ModelNone MFCCs d-Vector
DCECCCECECC
DPCL1.573.373.674.231.63
PITNet1.203.674.043.871.77
VoiceFilter-3.173.834.011.53
Table 3. Average SDR values corresponding to the three speech separation models with and without voiceprint feature integration (unit: dB).
ModelNone MFCCs d-Vector
DCECCCECECC
DPCL8.27910.53010.66012.4309.483
PITNet3.37110.54011.97011.9409.325
VoiceFilter-10.42011.47011.1608.159
Table 4. Model sizes of the proposed methods (unit: MB).
ModelNone MFCCs d-Vector
DCECCCECECC
DPCL121.68122.03153.09156.70159.77
PITNet530.89531.96612.29619.75632.22
VoiceFilter-346.99402.84407.85414.48
Publisher’s Note: MDPI stays neutral with regard to jurisdictional claims in published maps and institutional affiliations.

