Article

Predictability of COVID-19 Infections Based on Deep Learning and Historical Data

by
Rafat Zrieq
1,
Souad Kamel
2,
Sahbi Boubaker
2,*,
Fahad D. Algahtani
1,
Mohamed Ali Alzain
1,
Fares Alshammari
3,
Badr Khalaf Aldhmadi
4,
Fahad Saud Alshammari
3 and
Marcos J. Araúzo-Bravo
5,6,7
1
Department of Public Health, College of Public Health and Health Informatics, University of Ha’il, Ha’il 55476, Saudi Arabia
2
Department of Computer & Network Engineering, College of Computer Science and Engineering, University of Jeddah, Jeddah 21959, Saudi Arabia
3
Department of Health Informatics, College of Public Health and Health Informatics, University of Ha’il, Ha’il 55476, Saudi Arabia
4
Department of Health Management, College of Public Health and Health Informatics, University of Ha’il, Ha’il 55476, Saudi Arabia
5
Computational Biology and Systems Biomedicine, Biodonostia Health Research Institute, C/Doctor Beguiristain s/n, 20014 San Sebastián, Spain
6
IKERBASQUE, Basque Foundation for Science, C/María Díaz Harokoa 3, 48013 Bilbao, Spain
7
Department of Cell Biology and Histology, Faculty of Medicine and Nursing, University of Basque Country (UPV/EHU), 48940 Leioa, Spain
*
Author to whom correspondence should be addressed.
Appl. Sci. 2022, 12(16), 8029; https://doi.org/10.3390/app12168029
Submission received: 22 June 2022 / Revised: 31 July 2022 / Accepted: 4 August 2022 / Published: 11 August 2022
(This article belongs to the Special Issue Artificial Intelligence Computing and Applications for COVID-19)

Abstract

:
The COVID-19 disease has spread worldwide since 2020, causing a high number of deaths as well as infections, and impacting economic, social and health systems. Understanding its dynamics may facilitate a better understanding of its behavior, reducing the impact of similar diseases in the future. Classical modeling techniques have failed in predicting the behavior of this disease, since they have been unable to capture hidden features in the data collected about the disease. The present research benefits from the high capacity of modern computers and new trends in artificial intelligence (AI), specifically three deep learning (DL) neural networks: recurrent neural network (RNN), gated recurrent unit (GRU), and long short-term memory (LSTM). We thus modelled daily new infections of COVID-19 in four countries (Saudi Arabia, Egypt, Italy, and India) that vary in their climates, cultures, populations, and health systems. The results show that a simple-structure RNN algorithm is better at predicting daily new infections and that DL techniques have promising potential in disease modeling and can be used efficiently even in the case of limited datasets.

1. Introduction

1.1. Study Motivation

The COVID-19 disease was first reported in Wuhan, Hubei province, China. SARS-CoV-2, the virus that causes COVID-19, has a high sequence similarity to SARS-CoV and to a bat coronavirus: 79.6% and 96%, respectively [1]. COVID-19 is a dangerous respiratory disease that has spread rapidly and dramatically via point mutations and recombination around the world during the last two years, resulting in a major pandemic [2,3,4]. In addition to millions of fatalities, the disease has had a significant impact on social and economic systems, developing new secondary consequences, notably on the psychological aspect of many people. Despite the vaccination campaigns organized worldwide, the disease still appears in multiple waves. This is more than likely due to the fact that new variants emerge regularly and, subsequently, can escape immune response [5]. The emergence of variants is a result of generating new point mutation(s) in the spike protein, which leads to the emergence of variants of SARS-CoV-2, such as the “omicron” variant [3,4]. Many other variants such as the “delta” variant have emerged, posing a major threat in terms of deaths; higher infectivity; mortality; and in particular, rapid virus transmission. Therefore, currently, most vaccination schemes are focused on the highly mutated spike gene [6].
The dynamics of SARS-CoV-2 transmission have revealed different patterns due to the diversity and complexity of the factors that play a role in the spread of the virus. Climatic and environmental conditions, health systems, vaccine availability, and the mitigation actions taken by local authorities are among those factors [7]. Mathematicians and health scientists, as well as computer scientists are working hard to model and simulate the disease’s spread. Such work efficiently contributes to decision-making and provides tools to optimally implement suitable interventions to mitigate the disease [8,9].
Despite the good results provided by many case studies and the numerous factors impacting the disease’s spread, classical models such as the well-known Susceptible–Infected–Recovered (SIR) model and its derivatives [10,11,12,13,14,15], as well as time-series [16,17] and phenomenological epidemic models (generalized growth (GG), classical logistic growth (CLG), and generalized Richards (GR)) [18] may fail in detecting hidden patterns of the disease due to the complex nature of the disease’s dynamics and the numerous factors impacting the disease’s spread [9]. In fact, the SIR model and its derivatives were unable to forecast the current dynamics and patterns of COVID-19. According to [14], this may be due to the fact that the adopted assumptions for calibrating an SIR model may not be true in the case of COVID-19. The authors concluded that more sophisticated models facilitating capturing the disease’s hidden patterns should be used. Moreover, the SIR model was found to be unable to capture multiple epicenters of the disease when they appeared at different times, particularly in the case of the USA. This has led to difficulties in optimally selecting the model parameters [15]. SIR models are also known to be continuous-time nonlinear differential equations. As a consequence, there are no efficient analytic techniques to solve such equations. Researchers should resort to discretized forms of such equations in order to find approximate solutions based on computerized codes known not to provide exact solutions [12]. Regarding the usefulness of ARIMA time-series models, the main claim reported by many researchers such as [17] is that it cannot be efficiently used in complex contexts where dynamics are fast, such as in the case of COVID-19. In fact, time-series models have the limitation of requiring stationary observations and, therefore, cannot fit non-stationary datasets, which is generally the case with COVID-19. In addition, the calibrations of the above-cited parametric models should involve solving optimization problems known to be hard, non-convex, and constrained. The classical ML models’ main drawback is the way they handle the data when predicting the future. In fact, the data are processed forward, and therefore, there is no impact of the historical state of the neurons. Many researchers have developed more sophisticated models benefiting from the boom in artificial intelligence (AI), machine learning (ML), and deep learning (DL) tools when seeking more accurate and useful models. The main disadvantage of using classical ML models is the way they handle data for predicting the future. With respect to model-based methods, the main motivations behind using DL models for modeling/predicting COVID-19 infections can be summarized by the following points. First, in contrast to SIR and phenomenological models, DL are non-parametric models, and therefore, weights and biases are free coefficients to be determined optimally without any constraints or required regularities of the optimization problems. Second, when compared to time-series (such as autoregressive integrated moving average (ARIMA)) models, DL does not require stationary datasets. Thus, DL can operate even when using non-stationary observations. Finally, although classical ML models (artificial neural networks (ANNs)) belong to the same family of modeling techniques (artificial intelligence (AI)) as DL, the latter has the advantage of processing the data in two directions: forward and backward. As a result, DL can keep previous information hidden in the data and model its impact on the future values.

1.2. Related Work

For COVID-19 forecasting, many researchers have developed DL-based approaches for analyzing and predicting the number of infections, recoveries, and deaths in different locations [7,8,9,19,20,21,22,23,24,25,26,27,28,29,30,31]. Because of the high sensitivity of the disease dynamics with location features, the reported results were consequently different from one location to another, even in the same country. In Table 1 below, the case studies selected including the reference, country/location, DL techniques used, period covered, results, advantages, and shortcomings are summarized.
By examining state-of-the-art DL work related to predicting COVID-19 spread dynamics, it can be noted that they were distributed over many countries situated at different locations, with different climatic conditions and cultures. In terms of datasets, the investigated studies were based on periods covering the beginning of the disease when an insufficient amount of data was available. This limitation was overcome by [19] using an augmentation technique to generate more data with the same features as the original data, which were insufficient for a data-demanding technique such as DL. The authors in [8] adopted an incremental training technique to handle the newly released data. In addition, several studies used simple DL algorithms, such as LSTM, GRU, and RNN [7,9,19,24,25], while other authors adopted bidirectional variants of the previous techniques [20,22,30]. Another important trend was the hybridization of two DL algorithms [20,22,25,27] or the combination of DL with classical disease models based on SIR [28]. Finally, few work has been conducted using datasets covering the period after the arrival of vaccines. The main difficulties faced by the work considered can be summarized as follows: (i) non-availability of a systematic procedure for choosing DL hyperparameters, (ii) use of a limited number of features, and (iii) non-availability of a sufficient amount of data required by DL.
DL techniques generally require much larger datasets to be trained efficiently. However, in the case of COVID-19, the number of new infections, recoveries, and deaths are released daily. Therefore, the maximum number of observations available for any technique should not exceed 940 (covering two years (2020 and 2021) and the first 7 months of 2022) until present day (20 July 2022). As can be seen in Table 1, the DL techniques in use have provided, for the majority of case studies, good performance metrics in terms of MAPE (less than 1% in some cases) and R2 (more than 0.99 in a scale ranging from 0 to 1), although they were trained with limited-size datasets. In addition, LSTM, GRU, and RNN were chosen among many available DL methods for being simple and less demanding in terms of computation time. As can be noticed from the related work, the majority of papers have used these techniques and they yielded good results (which is one of our study findings).
The main contributions of this paper can be summarized as follows:
We used a prediction window of the 14 previous days to predict new infections one day ahead, which corresponds to the incubation period of COVID-19. Intuitively, any new infection may result from a person who was infected during the previous 14 days or less.
Through our study, the simple-structure DL techniques in use (RNN, GRU, and LSTM) are found to yield good forecasts although the available datasets are of limited size (due to the fact that COVID-19 data are released daily). Therefore, it is not necessary to train complex-structure DL algorithms for small (not guaranteed) improvements in accuracy. Simple DL algorithms are sufficient in the case of COVID-19.
To the best of the authors’ knowledge, our study is among a small number of works covering a dataset that includes the periods before and after the appearance of vaccines. For this reason, our study is expected to capture the effect of vaccination on the disease spread.
The case studies considered possess different features in terms of demographic patterns, climatic conditions, cultures, quality of health systems, economic situation, etc. This may help evaluate the predictability of new COVID-19 infections using the same DL tools as in various case studies.
The rest of this paper is structured as follows. In Section 2, the study material and methods are provided. In Section 3, the results obtained and their discussion are presented. Finally, the conclusion and suggestions regarding future works are detailed in Section 4.

2. Material and Methods

The procedure adopted for predicting new COVID-19 infections is presented in this section. Moreover, the three DL algorithms as well as the tuning of the hyperparameters are succinctly discussed. Note that, before adopting these three DL algorithms, many other more sophisticated variants of DL techniques have been tested. In particular, we tested convolutional neural networks (CNN) and tested the bidirectional versions of RNN, GRU, and LSTM (Bi-RNN, Bi-GRU, and Bi-LSTM, respectively), following which we found that there is no improvement in the accuracy of the forecasts. DL, as an advanced technology derived from the classical artificial neural networks (ANNs), has demonstrated successful modeling capabilities spanning from image processing to time-series forecasting. DL algorithms are a type of learning-based tool. In fact, DL can learn from raw sequential datasets and generalize to new datasets [20]. Owing to the high potential of DL technology in modeling complex phenomena without the need for analytical tools and thanks to high performance computers, the task of predicting the effects of COVID-19 in terms of number of infections and deaths seems to become more promising. This paper’s main aim is to investigate the modeling capabilities and the predictability of new daily COVID-19 infections based on three essentially similar but fundamentally different DL algorithms, namely, the recurrent neural network (RNN), the gated recurrent unit (GRU), and the long short-term memory (LSTM).
In a prediction framework, the performance metrics are the most important measures for evaluating the quality of investigated models. These metrics are also presented in this section. The case studies used to illustrate the effectiveness of the DL methods evaluated will be presented in addition to the dataset adopted.

2.1. Design Methodology

In this paper, three DL algorithms are used for predicting the one-day-ahead number of new infections based on the daily new infections of the previous 14 days. We used the previous 14 days as input to consider the influence of all possible virus carriers when transmitting the disease. According to the WHO, the transmission of the virus from people with infections to others continues from the Day 2 to day 10 or 13 for symptomatic or asymptomatic individuals, respectively. Thus, all people carrying the virus even 13 days before contribute to the next-day infections. Moreover, as per the “Criteria for releasing COVID-19 patients from isolation Geneva: World Health Organization; 2020 (available at https://www.who.int/news-room/commentaries/detail/criteria-for-releasing-covid-19-patients-from-isolation (accessed on 30 July 2022)), any person with an infection should be released within 14 days, which is likely the period during which they are able to transmit the virus to others. However, the number of days that may contribute to the coming days’ infections depends on the COVID-19 variant, the location, and the period. As an example, the authors in [23] chose the length of the subsequence as being equal to 20 consecutive days. In addition, according to a study conducted in Japan for the BA.1 omicron variant, the incubation period was found to vary from 1.3 days to 9.6 days [32]. Taking into account the fact that DL techniques are robust against uncertainties, the choice of the previous 14 days is likely to be reasonable. Regarding the model itself, the structures of the deep learning (DL) algorithms used in this study are highly nonlinear and involve interactions between the numbers of infections of the previous days to model the number of infections in the forthcoming days. Accordingly, the DL includes several multiplicative terms, which indicate the highly nonlinear character of the models adopted. The problem of modeling SARS-CoV-2 transmission dynamics is considered difficult because it depends on many factors (the health system efficiency, vaccine availability, climatic conditions, demography of the location, the movement of people, the day of the week [33], etc.) including also “the measures taken by the government” to mitigate/limit the spread of the disease. In the proposed DL, all of those factors, in addition to any other hidden factor, are included implicitly in the number of daily new infections. As per the DL structure, those factors are retained during training via the memory cells. The forecasting procedure is depicted in Figure 1. The first step consists of the COVID-19 dataset collection. The collected dataset is then divided into two subsets: 80% used for the models’ training (in-sample), and the remaining 20% employed for the models’ validation and testing (out-of-sample). Three performance metrics, namely, the mean absolute percentage error (MAPE), the coefficient of determination (R2), and the root mean square error (RMSE), are calculated to measure the accuracy of the investigated models. More details about the operation of the three DL algorithms as well as the performance metrics’ calculation will be provided in the following subsections.

2.2. Problem Statement

In this paper, the one-day-ahead estimated number of new infections is modeled as a function of the number of infections recorded for the previous 14 days. Therefore, it is represented as in Equation (1).
I ^ ( t + 1 )   = F ( I ( t ) ,   I ( t 1 ) ,   ,   I ( t i ) ,   ,   I ( t 14 ) )
where F(.) is a nonlinear function of its arguments for the previous days’ number of infections, I(t) denotes the number of infections on Day t, and I ^ ( t + 1 ) is the estimated number of infections on Day ( t + 1 ) .
The modeling problem is formulated as an optimization problem, where the quadratic error function (Equation (2)) between the number of daily infections estimated and recorded is minimized with respect to the DL algorithm parameters (weights and biases).
E 2 ( W i , b i )   =   t = 1 N ( I ( t )     I ^ ( t ) + e ( t ) ) 2
where E 2 is the quadratic error function; N denotes the number of out-of-sample observations; Wi and bi represent, respectively, the deep neural network weights and biases; and e(t) denotes an error function considered to be a white signal and following a normal distribution.

2.3. Recurrent Neural Networks

RNNs are a special variant of artificial neural networks (ANNs) that have the ability to deal with sequential data and, when trained, retain knowledge of the past to model its effect on the present and on the future [22]. In RNN, data are assumed to involve sequences. As opposed to classical ANNs, where the data sampling times are independent, RNNs are an implementation of the “memory” concept, where the states of the previous information related to the inputs are used to generate the next output of the sequence. In classical feed-forward neural networks, the information is fed in a forward manner and processed through hidden layers to finally reach the output layer. However, in RNNs, the network cells remember their states and provide them as feedback information.
In an RNN, information is transferred through a loop. Therefore, the decision made by the RNN is based on both the current input and recently received past information [29]. Despite the interesting features of RNN, this DL technique has many limitations, including the short memory effect and vanishing gradient problem due to backward propagation. In fact, when training an RNN algorithm, the vanishing/exploding gradient problems must be faced. The main cause of these two problems is that it is too difficult to keep the data for a long time. In the case of long sequences, the training algorithm may fail at updating the RNN weights. Thus, these weights may converge to zero values or may explode when going toward high values. In conclusion, it can be noted that short memory and vanishing gradients are two linked problems of RNNs. Solutions to those problems are provided by introducing GRU and LSTM structures.

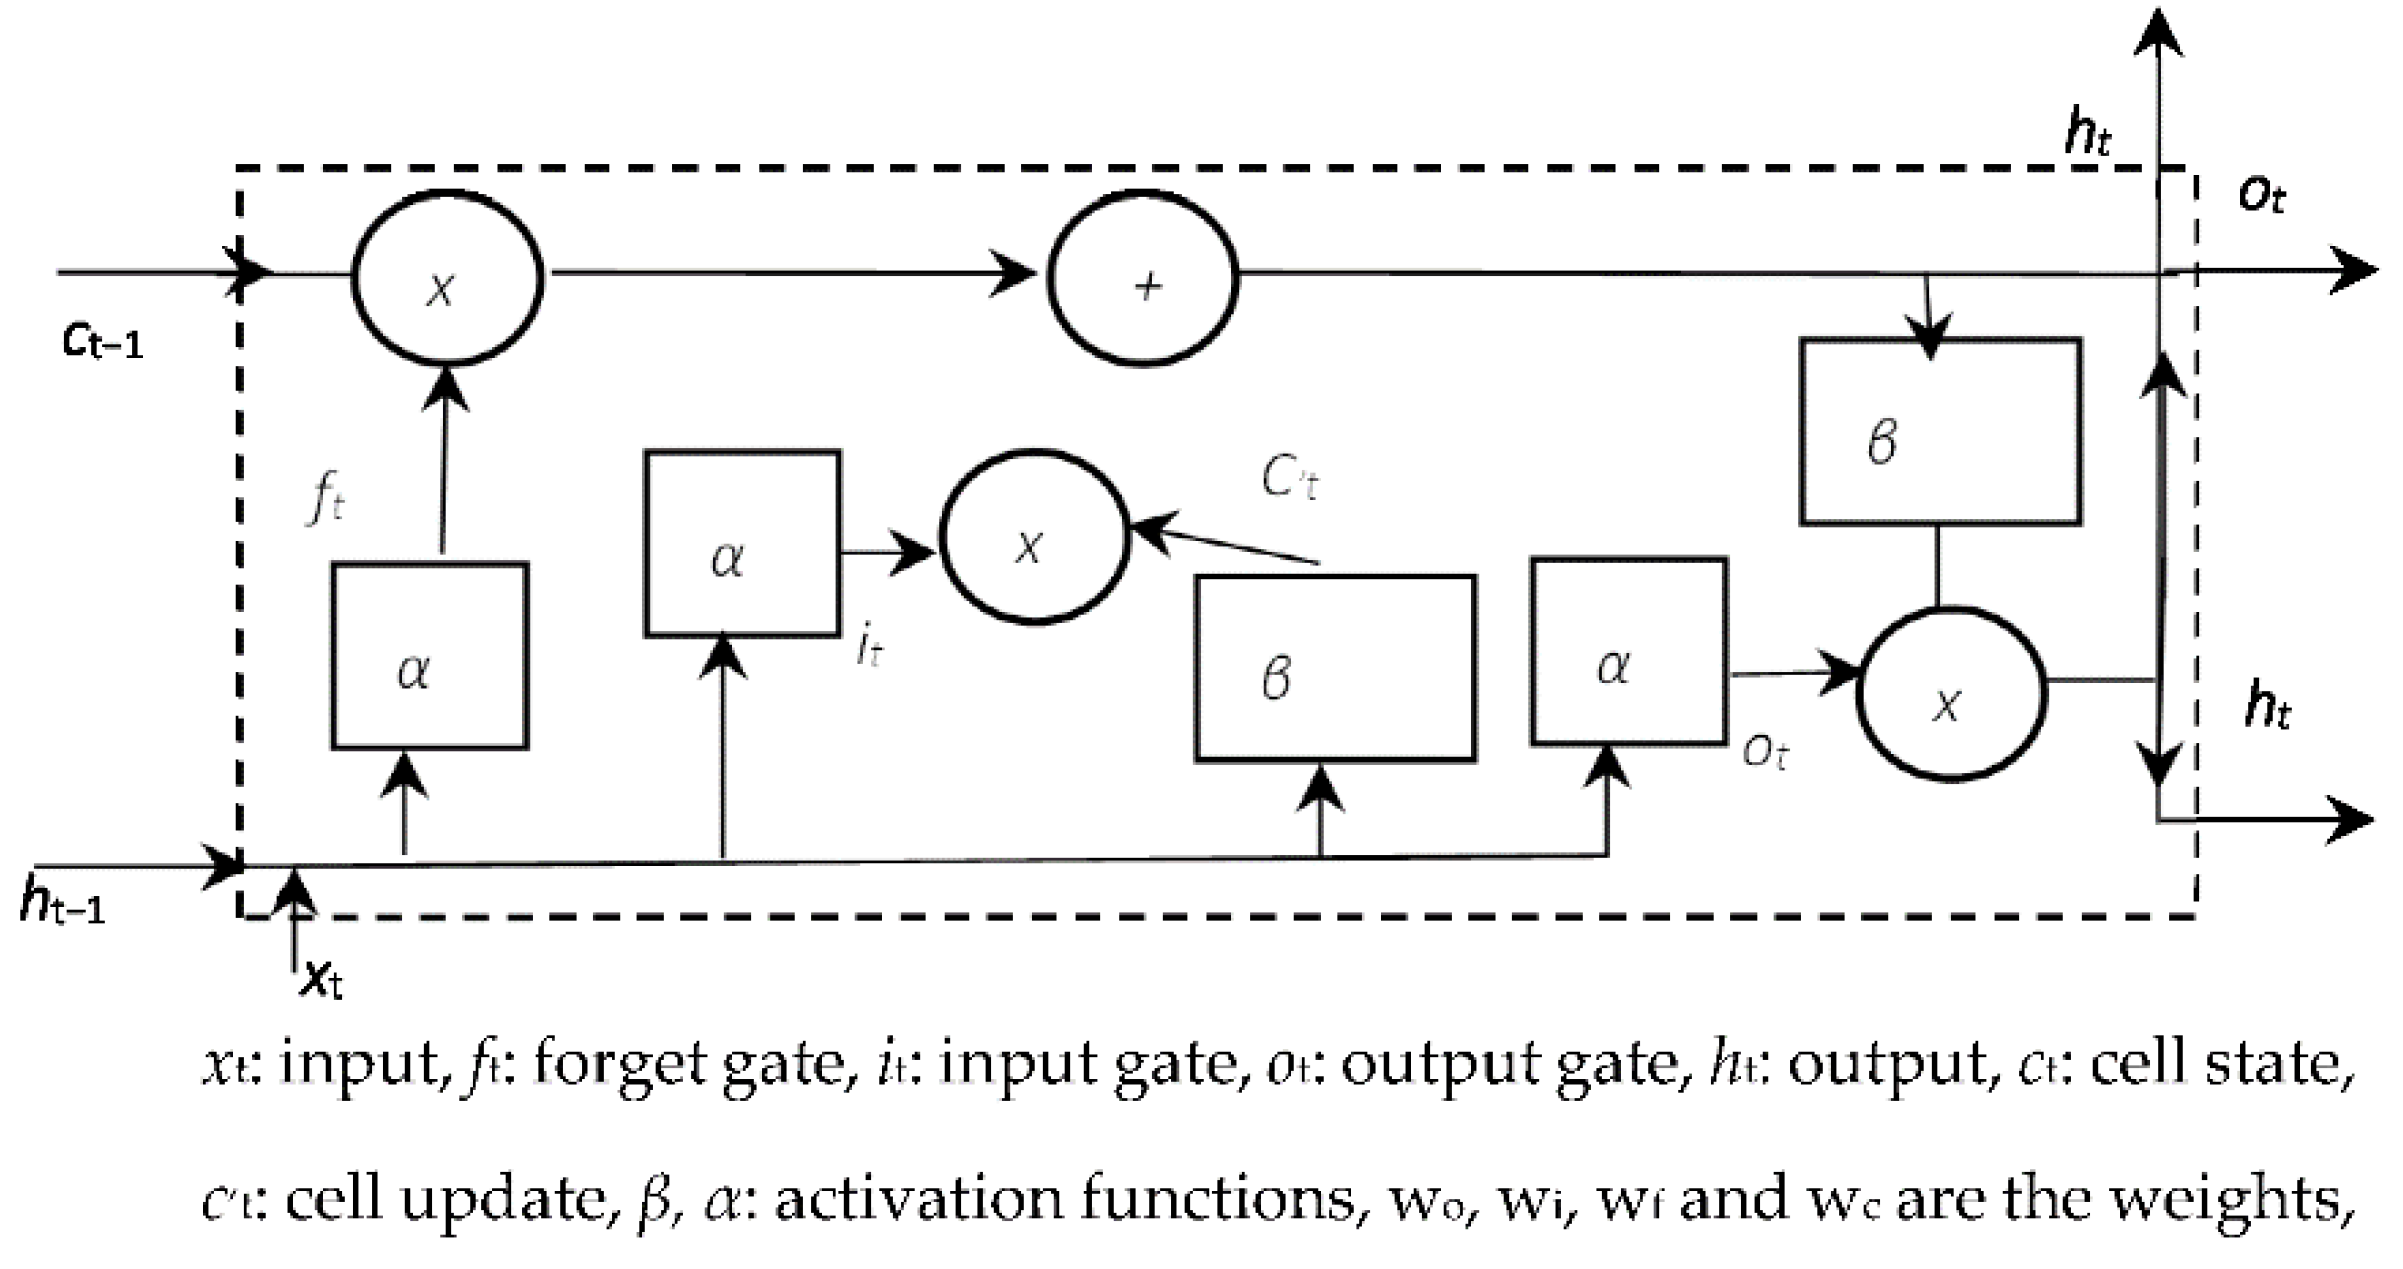
2.4. Long Short-Term Memory (LSTM)

RNNs are known to have difficulties in training because of the vanishing/exploding gradients. Therefore, long short-term memory (LSTM) has been introduced to overcome this difficulty [25]. LSTM is an advanced type of RNN. Its structure is composed mainly of three types of gates: input, output, and forget [26] (Figure 2). With reference to Figure 2, the transfer equations of an LSTM unit are described according to Equations (3)–(7). Note that RNN and GRU are particular structures of an LSTM. More details about DL algorithms as well as their structures and transfer equations can be found in [26] and [28,29]. In LSTM, memory cells are introduced to detect hidden features and to continuously track long-term historical information. The main idea behind using memory cells is to model historical self-states of the network through self-connections [22].
f t = σ ( w f . [ h t 1 , x t ] + b f )
i t = σ ( w i . [ h t 1 , x t ] + b i )
o t = σ ( w o . [ h t 1 , x t ] + b o )
C t = f t C t 1 + i t . t h ( w c . [ h t 1 , x t ] + b c )
h t = O t . t h ( C t )
All of the variables in Equations (3)–(7) are defined in Figure 2.

2.5. Study Areas and Datasets

In order to investigate the three DL algorithms’ abilities to model new COVID-19 infections, four countries from different geographic locations, climates, and cultures were selected as case studies. Saudi Arabia, Egypt, India, and Italy were considered. Table 2 below depicts the geographic location, population, and climate information of the case studies considered.
The dataset (number of confirmed infected cases) used in this study for the four countries was collected from https://github.com/owid/covid-19-data/tree/master/public/data (accessed on 5 February 2022). The dataset covers the period from 1 April 2020 to 4 February 2022.
Thus, the 675 observations collected were divided into 80% for the models’ development and 20% for the models testing and calibration. Each sequence of 14 observations was used to predict the next-day number of infections. Additionally, the time period was selected such that it covers almost all epidemic peaks as well as the discovery of different variants of the virus. Moreover, more than one year of vaccination campaigns were also covered.

3. Results and Discussion

3.1. DL Algorithms’ Hyperparameters

The DL network structure as well as its training parameters were determined in terms of what are known as hyperparameters. Since there is no existing straightforward and systematic procedure to optimally tune those hyperparameters, we adopted a trial-and-error strategy. Although it is time-consuming, this strategy remains, to the best of the authors’ knowledge, the most efficient method, so far, of time-series modeling and analysis used by researchers and data scientists. The hyperparameters of the RNN, GRU, and LSTM DL networks selected are summarized in Table 3 below.
The number of units has a significant effect on the prediction accuracy. Increasing the number of units generates better fitting data. However, this number cannot be increased to a very high value since this may increase the training time and cause overfitting. After several trials, the number of units adopted was 200. The batch size hyperparameter was the number of samples handled before updating the DL model. This number is usually set to powers of 2. The higher this number, the faster the algorithm converges. However, the choice of batch size is case-sensitive and strongly linked to the dataset size. We selected 64 as an intermediate value, which provided reasonable results without inducing a longer convergence time. The number of epochs refers to the number of opportunities that each sample in the training dataset has had to update the internal model parameters. After trying different values, the adopted value was determined at 1000. Scaling the dataset before initiating the DL model training is a common practice in data science. Since the majority of activation functions operates in the range [–1, 1], here, we adopted the Min–Max scaler. For activation of the neurons, we selected a rectified linear unit (ReLU), which is a piecewise linear function that outputs a value equal to the input if it is positive and outputs zero otherwise. It has been used frequently in training various DL structures [7,9,21] and has been found to provide better fitting data while being easier to train. In DL, optimizers are the algorithms employed to optimally tune the weights and biases of the ANN while minimizing a loss function. The training process is consequently transferred to an optimization problem where the objective function is the error between the ANN output and the target value of the same output, and the decision variables are the features of the network (weights and biases).

3.2. Experimental Results

Our main objective is to compare the performance of three DL algorithms (RNN, GRU, and LSTM) in modeling new COVID-19 infections in four countries (Saudi Arabia, Egypt, Italy, and India) with different demographic patterns, culture, geographic locations, and climatic conditions. As performance metrics, we used the mean absolute percentage error (MAPE), the coefficient of determination (R2), and the root mean square error (RMSE). These considered metrics are widely used by researchers in time-series prediction and are defined using the following formulas [24,28]:
M A P E = 100 N   t = 1 N | I ( t )     I ^ ( t ) | I ¯
R 2 = 1 1 N t = 1 N ( I ( t ) I ^ ( t ) ) 2 1 N t = 1 N ( I ( t ) I ¯ ) 2  
R M S E = 1 N   t = 1 N ( I ( t ) I ^ ( t ) ) 2    
The models’ validation dataset is composed of N (last 20% of the original dataset); I(t) and I ^ ( t ) denote the number of daily new infections at day t and the number estimated by the model, respectively; and I ¯ represents the average number of daily infections over the testing period.
In order to conduct a reasonable comparative study, all DL models have been run under the same conditions in terms of hyperparameters and the period covered by the dataset for the four case studies. All experiments were performed using the Python Keras TensorFlow library on a machine with a 64-bit/2.6 Ghz processor and a random-access memory (RAM) of 32 GB. The performance measures for the four case studies are summarized in Table 4 and Table 5 below. Since the deep learning (DL) techniques proposed are non-deterministic methods and since they present a large amount of randomness (bias), the whole training/testing process has been run several times (more than 10), and the results of the best runs are considered.
The curves of the (actual) new daily infections recorded as well as those obtained by the RNN, GRU, and LSTM DL algorithms are depicted in Figure 3 for the four case studies.

3.3. Discussion

Based on the results of each case study, the following comments can be made:
Case of Saudi Arabia: From Table 3, the average MAPE of the three DL algorithms is around 25%, which is a moderate value. The higher the MAPE, the better the prediction. However, the three techniques’ R2 is about 0.8 (1 is the ideal value). Other studies, such as [34,35], have tackled the problem of predicting the number of COVID-19 infections in Saudi Arabia while covering different periods and datasets. Compared with other studies in the same territory, such as [35], our R-squared value can be considered good, since the period covered by our models is larger than the one covered by that study. This value can be considered good and reflects an interesting predictability of daily new infections in Saudi Arabia. The average RMSE is around 330 new infections per day. It can be observed also that RNN has been found to outperform GRU and LSTM, since it yielded the best MAPE, R2, and RMSE. Therefore, for the case study of Saudi Arabia, a less complex DL algorithm in terms of structure and training time is preferred for modeling daily new COVID-19 cases. Saudi Arabia’s population is a mixture of nationalities, religions, and culture. In addition, Saudi Arabia is a host to two holy mosques at Makkah and Madinah, which are visited by Muslim people who perform Hajj and Umrah, which may induce hidden features in terms of factors impacting new infections. The desert climate of Saudi Arabia may be one the factors negatively affecting daily new infections. From Figure 3a, it can be observed that the actual recorded new infections curve and the DL algorithms curves were almost the same during the first 100 days of the testing period (out-of-sample) and that there were some fluctuations during the remaining days of the same period, with a relatively small superiority for the RNN curve.
Case of Egypt: Based on Table 3’s performance measures, the MAPE of the three algorithms is around 8%, which can be considered good. In addition, the values of RMSE are also good (around 160 cases per day). However, the values of R2 are around 0.75. This value can be considered moderate, which may be due to jumps in new infections recorded around days 55 and 82 during the out-of-sample testing period. As observed from Figure 3b, sudden high daily new infections were recorded and the DL algorithms did not capture those jumps. As in the case of Saudi Arabia, the RNN has the best ability to capture the hidden features of the data for the case of Egypt. Therefore, an RNN can be recommended in this case study.
Case of Italy: The GRU was found to better model the dynamics of daily new infections since it yielded the lowest MAPE (24.4818%), the highest R2 (0.8499), and the lowest RMSE (2648 cases/day). However, the MAPE value can be considered high, which indicates bad predictability of the daily new infections using DL. The GRU DL network has an intermediately complex structure, situated between a simple structure (RNN) and a complex structure (LSTM). Therefore, this may result in a moderate training time. In conclusion, the GRU can be recommended for the case study of Italy. The relatively bad performance of the three DL techniques can be attributed to the fluctuations in daily new infections noticed particularly starting from Day 95 (Figure 3c). Note that, among recent studies concerning the prediction of the number COVID-19 infections in Italy, the authors of [36] focused on predicting the reproduction number, which is complementary to the number of infections predicted in our study. Future directions can be built around a combination of the two topics.
Case of India: The best MAPE was provided by the RNN (17.58%) and the best R2 and RMSE (0.8759 and 3902, respectively) were yielded by the GRU DL algorithm. In this case study, the GRU can be adopted as the best forecasting technique. From Figure 3d, it can be observed that LSTM fails in capturing the strong fluctuation in daily new infections occurring around Day 120. However, the average value of the MAPE of the three techniques is relatively high, which reflects the relatively bad predictability of the daily new infections using DL.
As an overall observation, the values of MAPE yielded by the three DL techniques can be considered moderate (ranging from 8% to 25%). The values of R2 can be considered to range from good to very good (ranging from 0.8 to more than 0.9). The RNN technique is recommended for three case studies (Saudi Arabia, Egypt, and India), and GRU is recommended for Italy. From this, it can be concluded that there is no need to use complex-structure DL networks to model the daily new infections dynamics. Simpler DL algorithms can yield better forecasts within reasonable training time. Moreover, DL techniques are known to require large amounts of data, which is not true in the case of COVID-19, since health authorities are releasing data on a daily basis. The 80% used (540 observations out of 675 collected) can be considered a relatively small dataset to train DL algorithms. It should also be noted that, when compared with the results of model-based techniques, the forecasts yielded by the three DL techniques can be considered good, since the coefficient of determination (R2) ranges between 0.8 and 0.9, which was the case in many studies using classical models. However, a fair comparison should be conducted between methods from the same family, under the same conditions, and using the same datasets in the same country/location. Forecasting COVID-19 dynamics was shown through several studies (and confirmed in this study) to be case-sensitive.
Overfitting is the situation where a DL algorithm performance on the training dataset is good (in-sample) and “bad” for new dataset or testing (out-of-sample). To investigate this problem, we performed the following:
We conducted various experiments (for the four case studies) while varying the number of iterations (epochs). The quality of the DL models was measured by calculating three performance metrics (the RMSE, the coefficient of determination (R2), and the mean absolute percentage error (MAPE)) for the out-of-sample datasets.
As seen from Table 4 and Table 5, the coefficient of determination was found to be more than 0.8 and reached 0.97 in some cases (this value varies between 0 and 1 for the ideal fit). In addition, the MAPE and RMSE were in good ranges, which indicates the “good” quality of our investigated models and no overfitting.
Predictions and modeling in the case of pandemics are very useful for supporting decision-making. In fact, in the case of the unprecedented COVID-19 pandemic, several models have been developed under different circumstances in different locations. DL models including those developed in this study, were found to be very useful since they were able to take into consideration hidden factors implicitly. Moreover, they have been found to be relatively accurate in estimating the future numbers of infections. Decision-makers can benefit from these models in efficiently managing resources (including human resources) and supplies as well as preparing their health systems for any dangerous situation that may occur.

4. Conclusions

Three DL techniques, namely, the RNN, the GRU, and the LSTM, have been investigated for their predictability of one-day-ahead daily new infections of COVID-19, as explained by the infections recorded during the previous 14 days, which is considered the virus incubation period. The three techniques have yielded acceptable forecasts for the case studies investigated (Saudi Arabia, Egypt, Italy, and India), although they were trained using a dataset of limited size. Through this study, it has been concluded that the simple-structure DL technique (RNN) is recommended for modeling daily new infections since it generated better forecasts using limited training times. The results of this study can be used pertinently by health authorities and decision-makers to analyze the dynamics of the COVID-19 disease (since the disease is currently almost at its end) and can be generalized to other epidemics that may occur in the future. Future work can be allocated to model the effect of climatic and pollution indicators using DL networks in a multi-variate time-series context.

Author Contributions

Conceptualization, R.Z., S.B. and F.D.A.; methodology, S.B.; software, S.K.; validation, S.B. and S.K.; formal analysis, R.Z.; investigation, M.J.A.-B., F.A. and M.A.A.; resources, F.D.A., B.K.A., F.S.A. and F.A.; data curation, S.K.; writing—original draft preparation, S.B.; writing—review and editing, R.Z., F.S.A. and M.J.A.-B.; visualization, S.K.; supervision, R.Z.; project administration, M.A.A.; funding acquisition, R.Z. All authors have read and agreed to the published version of the manuscript.

Funding

This research has been funded by Scientific Research Deanship at University of Ha’il—Saudi Arabia through project number RG-20 214.

Institutional Review Board Statement

Not applicable.

Informed Consent Statement

Not applicable.

Data Availability Statement

The dataset (number of confirmed infected cases) used in this study for the four countries was collected from https://github.com/owid/covid-19-data/tree/master/public/data (accessed on 5 February 2022). The dataset covers the period from 1 April 2020 to 4 February 2022.

Conflicts of Interest

The authors declare conflicts of interest.

References

  1. Zhou, P.; Yang, X.-L.; Wang, X.-G.; Hu, B.; Zhang, L.; Zhang, W.; Si, H.-R.; Zhu, Y.; Li, B.; Huang, C.-L.; et al. A pneumonia outbreak associated with a new coronavirus of probable bat origin. Nature 2020, 579, 270–273. [Google Scholar] [CrossRef] [PubMed]
  2. Gorbalenya, A.E.; Baker, S.C.; Baric, R.S.; de Groot, R.J.; Drosten, C.; Gulyaeva, A.A.; Haagmans, B.L.; Lauber, C.; Leontovich, A.M.; Neuman, B.W.; et al. Coronaviridae Study Group of the International Committee on Taxonomy of Viruses. The species Severe acute respiratory syndrome-related coronavirus: Classifying 2019-nCoV and naming it SARS-CoV-2. Nat. Microbiol. 2020, 5, 536–544. [Google Scholar] [CrossRef]
  3. Nikolaidis, M.; Papakyriakou, A.; Chlichlia, K.; Markoulatos, P.; Oliver, S.G.; Amoutzias, G.D. Comparative Analysis of SARS-CoV-2 Variants of Concern, Including Omicron, Highlights Their Common and Distinctive Amino Acid Substitution Patterns, Especially at the Spike ORF. Viruses 2022, 14, 707. [Google Scholar] [CrossRef] [PubMed]
  4. Nikolaidis, M.; Markoulatos, P.; Van de Peer, Y.; Oliver, S.G.; Amoutzias, G.D. The Neighborhood of the Spike Gene Is a Hotspot for Modular Intertypic Homologous and Nonhomologous Recombination in Coronavirus Genomes. Mol. Biol. Evol. 2022, 39, 1. [Google Scholar] [CrossRef] [PubMed]
  5. Cameroni, E.; Bowen, J.E.; Rosen, L.E.; Saliba, C.; Zepeda, S.K.; Culap, K.; Pinto, D.; VanBlargan, L.A.; De Marco, A.; di Iulio, J.; et al. Broadly neutralizing antibodies overcome SARS-CoV-2 Omicron antigenic shift. Nature 2022, 602, 664–670. [Google Scholar] [CrossRef]
  6. Amoutzias, G.D.; Nikolaidis, M.; Tryfonopoulou, E.; Chlichlia, K.; Markoulatos, P.; Oliver, S.G. The Remarkable Evolutionary Plasticity of Coronaviruses by Mutation and Recombination: Insights for the COVID-19 Pandemic and the Future Evolutionary Paths of SARS-CoV-2. Viruses 2022, 14, 78. [Google Scholar] [CrossRef]
  7. Shahid, F.; Aneela, Z.; Muneeb, M. Predictions for COVID-19 with deep learning models of LSTM, GRU and Bi-LSTM. Chaos Solitons Fractals 2020, 140, 110212. [Google Scholar] [CrossRef]
  8. Farooq, J.; Bazaz, M.A. A deep learning algorithm for modeling and forecasting of COVID-19 in five worst affected states of India. Alex. Eng. J. 2021, 60, 587–596. [Google Scholar] [CrossRef]
  9. Nathan, C. A Deep Learning Model for Predicting COVID-19 Transmission in Connecticut 2021. Honors Scholar Theses. 782. Available online: https://opencommons.uconn.edu/srhonors_theses/782 (accessed on 20 March 2022).
  10. Scarabaggio, P.; Carli, R.; Cavone, G.; Epicoco, N.; Dotoli, M. Nonpharmaceutical Stochastic Optimal Control Strategies to Mitigate the COVID-19 Spread. IEEE Trans. Autom. Sci. Eng. 2022, 19, 560–575. [Google Scholar] [CrossRef]
  11. Carli, R.; Cavone, G.; Epicoco, N.; Scarabaggio, P.; Dotoli, M. Model predictive control to mitigate the COVID-19 outbreak in a multi-region scenario. Annu. Rev. Control 2020, 50, 373–393. [Google Scholar] [CrossRef]
  12. Zrieq, R.; Boubaker, S.; Kamel, S.; Alzain, M.; Algahtani, F.D. Analysis and Modeling of COVID-19 Epidemic Dynamics in Saudi Arabia Using SIR-PSO and Machine Learning Approaches. J. Infect. Dev. Ctries. 2022, 16, 90–100. [Google Scholar] [CrossRef] [PubMed]
  13. Scarabaggio, P.; Carli, R.; Cavone, G.; Epicoco, N.; Dotoli, M. Modeling, Estimation, and Optimal Control of Anti-COVID-19 Multi-dose Vaccine Administration. In Proceedings of the 2021 IEEE 17th International Conference on Automation Science and Engineering (CASE), Lyon, France, 23–27 August 2021; pp. 990–995. [Google Scholar] [CrossRef]
  14. Moein, S.; Nickaeen, N.; Roointan, A.; Borhani, N.; Heidary, Z.; Javanmard, S.H.; Ghaisari, J.; Gheisari, Y. Inefficiency of SIR models in forecasting COVID-19 epidemic: A case study of Isfahan. Sci. Rep. 2021, 11, 4725. [Google Scholar] [CrossRef] [PubMed]
  15. Cooper, I.; Mondal, A.; Antonopoulos, C.G. A SIR model assumption for the spread of COVID-19 in different communities. Chaos Solitons Fractals 2020, 139, 110057. [Google Scholar] [CrossRef] [PubMed]
  16. Alzahrani, S.I.; Aljamaan, I.A.; Al-Fakih, E.A. Forecasting the spread of the COVID-19 pandemic in Saudi Arabia using ARIMA prediction model under current public health interventions. J. Infect. Public Health 2020, 13, 914–919. [Google Scholar] [CrossRef]
  17. Alabdulrazzaq, H.; Alenezi, M.N.; Rawajfih, Y.; Alghannam, B.A.; Al-Hassan, A.A.; Al-Anzi, F.S. On the accuracy of ARIMA based prediction of COVID-19 spread. Results Phys. 2021, 27, 104509. [Google Scholar] [CrossRef]
  18. Zreiq, R.; Kamel, S.; Boubaker, S.; Al-Shammary, A.A.; Algahtani, F.D.; Alshammari, F. Generalized Richards model for predicting COVID-19 dynamics in Saudi Arabia based on particle swarm optimization Algorithm. AIMS Public Health 2020, 7, 828–843. [Google Scholar] [CrossRef]
  19. Abbasimehr, H.; Paki, R.; Bahrini, A. A novel approach based on combining deep learning models with statistical methods for COVID-19 time series forecasting. Neural Comput. Appl. 2022, 34, 3135–3149. [Google Scholar] [CrossRef]
  20. Shastri, S.; Singh, K.; Deswal, M.; Kumar, S.; Mansotra, V. CoBiD-net: A tailored deep learning ensemble model for time series forecasting of covid-19. Spat. Inf. Res. 2022, 30, 9–22. [Google Scholar] [CrossRef]
  21. Mohimont, L.; Chemchem, A.; Alin, F.; Krajecki, M.; Steffenel, L.A. Convolutional neural networks and temporal CNNs for COVID-19 forecasting in France. Appl. Intell. 2021, 51, 8784–8809. [Google Scholar] [CrossRef]
  22. Zeroual, A.; Harrou, F.; Dairi, A.; Sun, Y. Deep learning methods for forecasting COVID-19 time-Series data: A Comparative study. Chaos Solitons Fractals 2020, 140, 110121. [Google Scholar] [CrossRef]
  23. Marzouk, M.; Elshaboury, N.; Abdel-Latif, A.; Azab, S. Deep learning model for forecasting COVID-19 outbreak in Egypt. Process Saf. Environ. Prot. 2021, 153, 363–375. [Google Scholar] [CrossRef] [PubMed]
  24. Elsheikh, A.H.; Saba, A.I.; Abd Elaziz, M.; Lu, S.; Shanmugan, S.; Muthuramalingam, T.; Kumar, R.; Mosleh, A.O.; Essa, F.A.; Shehabeldeen, T.A. Deep learning-based forecasting model for COVID-19 outbreak in Saudi Arabia. Process Saf. Environ. Prot. 2021, 149, 223–233. [Google Scholar] [CrossRef] [PubMed]
  25. Nabi, K.N.; Tahmid, M.T.; Rafi, A.; Kader, M.E.; Haider, M.A. Forecasting COVID-19 cases: A comparative analysis between recurrent and convolutional neural networks. Results Phys. 2021, 24, 104137. [Google Scholar] [CrossRef] [PubMed]
  26. Devaraj, J.; Elavarasan, R.M.; Pugazhendhi, R. Forecasting of COVID-19 cases using deep learning models: Is it reliable and practically significant? Results Phys. 2021, 21, 103817. [Google Scholar] [CrossRef] [PubMed]
  27. Kumar, R.L.; Khan, F.; Din, S.; Band, S.S.; Mosavi, A.; Ibeke, E. Recurrent Neural Network and Reinforcement Learning Model for COVID-19 Prediction. Front. Public Health 2021, 9, 744100. [Google Scholar] [CrossRef] [PubMed]
  28. Liao, Z.; Lan, P.; Fan, X.; Kelly, B.; Innes, A.; Liao, Z. SIRVD-DL: A COVID-19 deep learning prediction model based on time-dependent SIRVD. Comput. Biol. Med. 2021, 138, 104868. [Google Scholar] [CrossRef]
  29. Rauf, H.T.; Lali, M.I.U.; Khan, M.A.; Kadry, S.; Alolaian, H.; Razaq, A.; Irfan, R. Time series forecasting of COVID-19 transmission in Asia Pacific countries using deep neural networks. Pers. Ubiquitous Comput. 2021, 25, 1–18. [Google Scholar] [CrossRef]
  30. Ayoobi, N.; Sharifrazi, D.; Alizadehsani, R. Time series forecasting of new cases and new deaths rate for COVID-19 using deep learning methods. Results Phys. 2021, 27, 104495. [Google Scholar] [CrossRef]
  31. Alassafi, M.O.; Jarrah, M.; Alotaibi, R. Time series predicting of COVID-19 based on deep learning. Neurocomputing 2022, 468, 335–344. [Google Scholar] [CrossRef]
  32. Tanaka, H.; Ogata, T.; Shibata, T.; Nagai, H.; Takahashi, Y.; Kinoshita, M.; Matsubayashi, K.; Hattori, S.; Taniguchi, C. Shorter Incubation Period among COVID-19 Cases with the BA.1 Omicron Variant. Int. J. Environ. Res. Public Health 2022, 19, 6330. [Google Scholar] [CrossRef]
  33. Koureas, M.; Amoutzias, G.D.; Vontas, A.; Kyritsi, M.; Pinaka, O.; Papakonstantinou, A.; Dadouli, K.; Hatzinikou, M.; Koutsolioutsou, A.; Mouchtouri, V.A.; et al. Wastewater monitoring as a supplementary surveillance tool for capturing SARS-COV-2 community spread. A case study in two Greek municipalities. Environ. Res. 2021, 200, 111749. [Google Scholar] [CrossRef] [PubMed]
  34. Ahmad, H.F.; Khaloofi, H.; Azhar, Z.; Algosaibi, A.; Hussain, J. An Improved COVID-19 Forecasting by Infectious Disease Modelling Using Machine Learning. Appl. Sci. 2021, 11, 11426. [Google Scholar] [CrossRef]
  35. Shahin, A.I.; Almotairi, S. A Deep Learning BiLSTM Encoding-Decoding Model for COVID-19 Pandemic Spread Forecasting. Fractal Fract. 2021, 5, 175. [Google Scholar] [CrossRef]
  36. Gatto, A.; Aloisi, V.; Accarino, G.; Immorlano, F.; Chiarelli, M.; Aloisio, G. An Artificial Neural Network-Based Approach for Predicting the COVID-19 Daily Effective Reproduction Number Rt in Italy. AI 2022, 3, 146–163. [Google Scholar] [CrossRef]
Figure 1. Flowchart of the prediction procedure based on three different DL architectures.
Applsci 12 08029 g001
Figure 2. Basic structure of an LSTM.
Applsci 12 08029 g002
Figure 3. Curves of the new daily infections obtained by RNN, GRU, and LSTM for (a) Saudi Arabia, (b) Egypt, (c) Italy, and (d) India. Day 1 is 9 September 2021.
Applsci 12 08029 g003
Table 1. Summary of selected studies using DL and model-based methods for modeling/predicting COVID-19 spread dynamics.
Ref.Country/LocationUsed TechniquePeriodResultsAdvantagesShortcomings
[7]Brazil, Germany, India, Italy, RussiaLSTM, Bi-LSTM22 January 2020–27 June 2020Bi-LSTM: Best MAE = 0.0070, RMSE = 0.0077, R2 = 0.9997Good generalizationRequires data scaling
[8]IndiaDL using incremental learningMarch 2020–August 2020Results are different from one state to another (minimum MAE around 1.18%)Ability to forecast 30 days. No need to retrain the model when new data are available Training back-propagation algorithm may be trapped into local minima
[9]USA/ConnecticutLSTM, GCN-LSTM20 May 2020–8 October 2020Worse than classical ARIMAAbility to work at the macro levelARIMA model provided better results than DL
[19]USA, Brazil, India, France, Russia, UK, Italy, Spain, Turkey, GermanyGRU, LSTM, CNN20 January 2020–28 March 2021Good results in terms of symmetric MAPE and RMSEUse of an augmentation time-series technique to generate a larger datasetDifficulty of hyperparameter selection
[20]USA, India, BrazilBi-LSTM, Convolutional LSTM and ensemble method including both methodsJanuary 2020–April 2021MAPE = 0.87–1.90, Accuracy = 98.10–99.13%Combining two DL algorithms has provided good forecastsNo indication about the historical data used to predict the future values
[21]FranceCNNJan. 2020–March 20201% error rate in the national levelAbility to predict using a limited datasetRelative discrepancy between national and regional levels
[22]Italy, Spain, France, China, USA, AustraliaRNN, LSTM, Bi-LSTM, GRU, VAE22 January 2020–17 June 2020VAE outperformed the other DL algorithmsAbility to predict using a limited datasetUse of a limited number of features (only 1)
[23]EgyptLSTM, CNN, MLP14 February 2020–15 August 2020Determination coefficient more than 0.999 for DL algorithmsForecasting horizon of 1 week and 1 month aheadUsing 20 previous data, which are more than the incubation period (14 days)
[24]Saudi Arabia,
Brazil, India, South Africa, Spain, USA
LSTM2 March 2020–10 October 2020LSTM 11% better than ARIMACapability of learning nonlinear features of COVID-19 dataHyperparameters determined using a parametric study
[25]Brazil, Russia, UKLSTM, GRU, CNN, MCNNUp to 18 November 2020CNN has outperformed in terms of performance metricsGood performances with few dataLSTM provided bad results for long run forecasts
[26]India/ChennaiARIMA, LSTM, SLSTM, Prophet22 January 2020–8 May 2020LSTM 2% better than other DL algorithmsGood performances are reported by the authorsReliability depends on the dataset and location
[27]IndiaRNN, Modified LSTM, DRL30 January 2020–16 August 2020MLSTM-DRL was found to outperform the other methodsHigh predictability and good agreement between predicted and recorded dataCase-sensitive
[28]India, Argentina, France, South Korea, Germany, Russia, UK, ItalyCombination of SIRVD and DL algorithms15 January 2021–27 May 2021SIRVD-DL: R2 = 0.995 and MAPE = 0.92 outperformed standalone DL methodsHybrid methods yielded better results than standalone methodsComputationally hard
[29]Pakistan, Afghanistan, India, BangladeshLSTM, RNN, GRU22 January 2020–21 June 2020Accuracy rate greater than 90%Ability to forecast the next 10 coming daysNo details about hyperparameters’ choice
[30]Australia, IranLSTM, Conv-LSTM, GRU, Bi-LSTM, Bi-Conv-LSTM, Bi-GRU25 January 2020–19 August 2020 (Australia)
3 January 2020–6 October 2020 (Iran)
Bidirectional models were found to yield better than their simple form (without backward components)Two techniques were reported by the authors to be used for the first time at the time of their studyNo information about the hyperparameters settings
[31]Malaysia, Morocco, Saudi ArabiaRNN, LSTM15 March 2020–3 December 202098.58% of accuracy LSTM and 93.45% RNNSeven-day-ahead forecastsHigh computational burden
[10]ItalySIRCQTHE epidemiological modelItalian real data Efficient feedback control lawsBenefiting from modeling to design control strategiesModeling context (the purpose of the paper is more for control not for prediction)
[11]ItalyModel predictive optimal control based on SIR modelItalian multi-region study during 2020Synthesis of model predictive control in regional and national levelsSIRQTHE model used for a model predictive optimal control strategyThe study is relatively old and does not cover a large period of the COVID-19 pandemic
[16]Saudi ArabiaARIMA time-series model for predicting the number of people who were newly infected 2 March 2020 to 20 April 2020Prediction with a horizon of 4 weeksUseful models particularly in the beginning of the pandemic in Saudi ArabiaThe results were not sufficiently accurate
[18]Saudi ArabiaGeneralized Richards model calibrated by particle swarm optimization (PSO)2 March 2020 to 10 October 2020Forecasting of the number of cumulative infection and the pandemic probable end date (R2 = 0.9953)The end of the first wave of the disease in Saudi Arabia was accurately estimated An increasing bias was observed
[12]Saudi ArabiaSIR and ML learning models for predicting COVID-19 dynamics2 March 2020 to 21 February 2021Prediction of infections, recoveries, and deaths (MAPE = 7%)Simple and generic modelsData processed forward and no effect of the neurons’ historical states
Abbreviations: ARIMA (Autoregressive Integrated Moving Average), Bi-LSTM (Bidirectional LSTM), CNN (Convolutional Neural Network), DL (Deep Learning), DRL (Deep Reinforcement Learning), GCN-LSTM (Graph Convolutional Network LSTM), LSTM (Long Short-Term Memory), MAPE (Mean Absolute Percentage Error), MCNN (Multivariate CNN), MLP (Multi-Layer Perceptron), RMSE (Root Mean Square Error), SLSTM (Stacked LSTM), SIRVD (SIR–Vaccinated–Deceased), VAE (Variational Auto-Encoder).
Table 2. Information about the case studies considered.
CountryGeographic LocationClimatePopulation *
Saudi Arabia25°00′ N 45°00′ EDesert35,836,864
Egypt30°20′ N 31°13′ EDry and hot105,975,920
India8°4′–37°6′ N 68°7′–7°25′ E 97°25′ east longitudeHot and humid1,405,606,396
Italy41°87′ N 12°56′ EMediterranean60,294,088
* https://www.worldometers.info/coronavirus/ (accessed on 20 June 2022).
Table 3. Hyperparameters of RNN, GRU, and LSTM used in this study.
HyperparameterSet Value
Units200
ActivationReLu
Batch size64
Epochs1000
ScalerMin–Max
OptimizerAdam
Table 4. Performance metrics of the RNN, GRU, and LSTM DL algorithms during the testing period (Saudi Arabia and Egypt).
CountrySaudi ArabiaEgypt
DL modelMAPE (%)R2RMSE (case)MAPE (%)R2RMSE (case)
RNN12.090.97542997.530.7984164
GRU13.300.96903368.790.7609179
LSTM17.980.94384538.440.7961165
Table 5. Performance metrics of RNN, GRU, and LSTM DL algorithms during the testing period (Italy and India).
CountryItalyIndia
DL modelMAPE (%)R2RMSE (case)MAPE (%)R2RMSE (case)
RNN25.720.8245286317.580.87473920
GRU24.480.8499264821.590.87593902
LSTM25.860.8089298726.270.84384378
Publisher’s Note: MDPI stays neutral with regard to jurisdictional claims in published maps and institutional affiliations.

