Article

Study on Failure Mechanism of Mudstone Based on Digital Core and Digital Volume Correlation Method

1
College of Mining Engineering, Taiyuan University of Technology, Taiyuan 030024, China
2
Key Laboratory of In-Situ Property-Improving Mining of Ministry of Education, Taiyuan University of Technology, Taiyuan 030024, China
*
Author to whom correspondence should be addressed.
Appl. Sci. 2022, 12(15), 7933; https://doi.org/10.3390/app12157933
Submission received: 20 July 2022 / Revised: 1 August 2022 / Accepted: 6 August 2022 / Published: 8 August 2022

Abstract

:
In order to study the damage evolution law and failure mechanism of mudstone under different stress states, with the help of high-resolution CT scanning equipment, in situ CT scanning experiments of mudstone under uniaxial compression were carried out. Combined with digital core technology and the digital volume image correlation method, the 3D characterization of meso-structure and the evolution process of localized damage in mudstone were analyzed. The research shows that brittle minerals such as quartz in mudstone often exist in the form of agglomerated strips, resulting in the formation of weak structural planes at the contact surfaces of different minerals. There are a large number of primary intergranular pores near the mineral accumulation zone. With the increase in axial load, the connectivity of pores will gradually increase, cracks will gradually emerge, internal pores will develop abnormally, and rocks will reach the critical state of failure; at this time, the throat number and coordination number of pores increase obviously. There was no obvious difference found in the distribution of mineral particles of different sizes, and the slip between mineral zones was mainly dominated by small particles. The accumulated mineral zone was able to easily form a weak surface, and the aggregated mineral zone under loading was easily able to produce local deformation, which is related to the mechanical properties of the mineral zone and its surrounding rock matrix, with the rock failure easily occurring along the junction of the two minerals. The displacement in the polymeric mineral zone was small, the deformation displacement of the rock skeleton dominated by clay minerals near the quartz mineral zone was larger, and the stronger quartz minerals restrained the rock skeleton deformation in the region.

1. Introduction

Rock is a kind of heterogeneous material in which a large number of irregular primary pores, fractures, and mineral particles are distributed, which directly affect the physical and mechanical properties of rock. Therefore, the focus of the study of the macro-mechanical properties of rock is to clarify the microstructure characteristics of the rock. In this paper, the uniaxial failure mechanism of mudstone is studied on the basis of digital core and digital volume image correlation method.
The numerical reconstruction method is a widely used digital core construction method, one that is based on core slice images. The main construction principle is to reconstruct 3D digital cores by process simulation method. The pore network model is established by using the maximal ball algorithm, lattice Boltzmann method, image processing and threshold segmentation, fractal theory, and mathematical statistics to realize the quantitative representation of micro pore structure [1,2,3]. Yin Duohao et al. [4] and Lin Chengyan et al. [5] evaluated the characteristics of the pore network model through parameters such as pore throat radius, coordination number, and permeability. It was found that the increase in throat length and pore coordination number were the main factors causing meso-damage. Zhang Huimei et al. [6] studied the freeze-thaw rock damage variables of mesoscopic pores.
The physical experiment method is to use a high-power optical microscope, electron microscope, and CT to directly scan the rock samples to construct digital cores. Yang Zhifeng et al. [7] found the relationship between three kinds of pores and mineral composition by electron microscope and CT scanning. Mikko Voutilainen et al. [8] also conducted related studies. Many scholars obtained the law of fracture changing with stress and found that the CT scanning technique can better evaluate the spatial attribute, distribution, and connectivity of macropores [9,10,11]. On the basis of a high-resolution 3D CT scanning system, it is widely used to automatically identify the main mineral composition in rock and analyze the law of fracture propagation in rock [12,13,14]. The influence of mineral composition and microstructure on rock mechanical properties is discussed by constructing digital cores [15,16,17,18,19].
It is impossible to analyze the internal dynamic strain of rock only with the help of digital core. The digital volume image correlation method provides the possibility for this. Guo Weina et al. [20] found that DIC technology can effectively characterize the strain evolution and crack formation and propagation of materials. Bay et al. [21] extended the digital image correlation method and proposed the continuous field 3D digital volume image correlation method DVC. Mao Lingtao et al. [22] revealed the strain evolution characteristics and failure mechanism of glass fiber composites by the DVC method.
The failure of rock has an extremely important relationship with its internal microstructure, main diagenetic composition, and spatial distribution of diagenetic composition. In order to study the failure mechanism of rock, it is necessary to explore the process of crack propagation and development and stress failure zone distribution from macro and micro angles. It is well known that rock is a kind of complex heterogeneous material. The composition and distribution of main components and pore space distribution in rock have an important influence on the mechanical properties of rock. The way in which to accurately describe the composition and spatial distribution of the main diagenetic minerals and the spatial distribution of primary pores and cracks in the rock, as well as the way to establish the diagenetic composition and the relationship between cracks and rock failure is the focus of this article.
In this paper, the influence of brittle mineral composition on rock failure was studied by establishing a pore network model based on digital core by using the CT scanning method in a physical experiment, combined with XRD and SEM analysis results. The quantitative analysis of minerals and pores from the aspects of content and distribution characteristics can comprehensively master the microstructure information of rock, so as to indirectly evaluate the mechanical properties and failure mechanism of rock.

2. Real-Time Loading CT Scanning Experimental System and Experimental Scheme

2.1. Real-Time Loading CT Scanning Experimental System

The experimental system is mainly composed of two parts:
(1)
CT scanning system: The minimum focus size of the CT experimental equipment is 3 μm, which can distinguish the pore with 0.5 μm aperture and the crack with 1 μm width. After the loading equipment is fixed on the high-precision micro-CT mechanical rotation platform, the sample is in the best scanning position through the movement in X, Y, and Z directions.
(2)
Loading system: The loading system is a uniaxial loading equipment independently developed by the research group. The main structure includes an oil pump, motor, hydraulic cylinder, accumulator, tubing, displacement sensor, loading push rod, aluminum–magnesium alloy casing, spherical seat, and so on. The maximum output force of the cylinder of the loading device: Fmax = 40 KN, the cylinder stroke: S = 40 mm, the effective range of the displacement sensor: 40 mm, and the accuracy of the displacement sensor: 0.001 mm. After fixing it on the μCT225kVFCB CT mechanical turntable, the CT scanning of rock samples under the condition of real-time loading and steady pressure can be realized, and the pressure control system of the loading system can realize digital pressure control, as shown in Figure 1.

2.2. Experimental Scheme

The intact mudstone without obvious cracks was selected. Considering the resolution requirement of CT scanning, the samples were machined into φ 20 mm × 40 mm cylinders by stone processing machine, and 10 samples were made. Six of them were tested for mechanical properties, and the average peak load was 67.2 MPa, as shown in Figure 2.
Then, real-time pressurized CT scanning experiments were carried out on the remaining four samples. During the experiment, the sample was pressurized by operating the pressurization system outside the CT room. After the pressure was loaded to the expected pressure, the pressurization was stopped to stabilize the loading equipment, and then CT scanning was carried out. The voltage and current of CT scanning were 200 kV and 240 μA, respectively. The magnification of the rock scanning area was 12.8, that is, the minimum visible crack width was 15.4 μm. Through each scan, 1500 layers of two-dimensional CT images could be obtained, that is, the thickness of each layer was 27 μm.

3. Construction of the Digital Core Model

3.1. Composition Analysis of Mudstone

According to the results of the XRD experiments, the main components of the samples were quartz and clay minerals, accompanied by a small amount of pyrite and plagioclase. The content of quartz was 45.1%, and the content of illite was 43.74% (Figure 3, Table 1).
According to the SEM experimental results, when the sample was magnified to 30 times (Figure 4b), the mudstone contained a large number of quartz particles, with clay minerals mostly filling in the large particles and being attached to the edge of the large particles; the surface of the mudstone was relatively flat, the overall structure was relatively dense, and a small number of cracks were developed near the large quartz particles. When the sample was enlarged to 1300 times (Figure 4c), there were a large number of flake aggregates and microcracks in the field of view. According to the results of XRD analysis, these flake materials were clay minerals such as illite.
According to the results of XRD and SEM analysis, the quartz content of the mudstone was high; the other materials were mainly clay minerals; and the accumulation mineral zone was quartz mineral zone, which was embedded in the clay mineral. The distribution of the two minerals in the whole mudstone sample was extremely uneven, and the quartz mineral zone in the upper right part of the sample was denser, with the distribution range being larger in the lower left part, but more discrete. To sum up, brittle minerals such as quartz are beneficial to the development of pores in rocks and the preservation of primary pores. There may be a large number of intergranular pores between brittle minerals and clay minerals. The initiation location of cracks is likely to develop from these pores and produce macroscopic cracks.

3.2. Construction of Digital Core Model

The CT scanning images of different loading stages under uniaxial in situ loading were reconstructed. By extracting the information of porosity, mineral spatial distribution, and mineral content in different locations, a digital core model with mineral composition, mineral spatial distribution, and fracture information was established. According to the results of XRD and SEM, the extensive and easy-to-capture parts were extracted by the maximum inter-class method, and the part of microstructure information that was difficult to extract was based on the combination of watershed threshold segmentation and TopHat algorithm fine segmentation, so as to ensure that the feature elements of the scanned samples can be extracted completely and provide the basis for subsequent digital analysis and numerical calculation. A complete digital core model was obtained by adding mineral composition, rock skeleton, and pores. The construction process of digital core is shown in Figure 5.

4. Evolution Characteristics of Digital Core Fracture Model

According to the origin and distribution of pores, pores mainly include organic pores, inorganic pores, and primary microcracks. The minimum resolution of scanning in this paper was 15.4 μm/pixel; the mineral composition of the mudstone studied was relatively simple; and the distribution of cracks was mainly concentrated in the mineral zone, with emphasis on the intergranular pores and intragranular pores between mineral particles.

4.1. Distribution and Volume Change of Pores and Fractures

The change of internal pores in the process of rock loading can clearly reflect the time and space variation characteristics of rock instability and failure. Pore throat is a narrow channel in which pores are connected with each other in rock mass or soil, and pores are the space between solid mineral particles in rock and soil. In this paper, the porosity of CT data in the process of real-time in situ loading was analyzed, the pore connectivity in the process of rock failure was located and quantitatively counted, the pore evolution data obtained from experiments were analyzed, and the crack propagation trend and change characteristics were studied.
Figure 6 is a 3D distribution figure of pores and pore throats in mudstone at different loading stages. Through statistical analysis, we found 805 pores and 2 pore throats in mudstone in the initial stage, and the coordination number of pores was basically zero. No matter the spatial distribution and connectivity or the results of numerical statistics, the pore connectivity in the initial stage was poor. The initial pore volume was 0.804 mm3 (the size of the pore ball is plotted according to the proportion of the equivalent diameter of the pore).
With the progress of loading, the number of pore throats in the 3D pore network model increased, and the number of pores in the first loading stage (18.5 MPa) decreased. At this stage, the mudstone was in the compaction stage; a small number of pores were closed and compacted under the action of external load; and a small number of pores were connected, which was characterized by the enhancement of pore connectivity, and the fracture volume was 1.035 mm3.
When the loading continued, the pore connectivity in the second loading stage (37.5 MPa) was further enhanced, indicating that new pores were generated and the old pores were further developed and connected, and a macroscopic crack appeared on the surface of the sample. In the pore network model inside the sample, it can be seen that the pore network model was mainly developed into two clusters, and the positions of the two pore connecting clusters were very close to the distribution of the mineral zone. At this stage, the rock damage increased gradually, the number of pore development and penetration was also much higher than that in the previous loading stage, and the fracture volume also increased to 2.32 mm3.
With the continuous development of pores and the accumulation of penetration, the local microcracks gradually expanded into macroscopic cracks and further penetrated, reaching the maximum load limit of mudstone, and the damage of rock reached the peak. In the third loading stage, the fracture volume reached 180.75 mm3, and there was an obvious stress drop, indicating that in the previous stage, the pores in the mudstone had developed to a critical state of failure, which was extremely prone to instability failure, and the adjacent pores penetrated into cracks. The mudstone was completely destroyed, as shown in Figure 7.
Table 2 shows the parameters of fracture development in different loading stages of mudstone.

4.2. The Changing Law of Pore Coordination Number

The pore coordination number represents the pore throat number connected between pores and pores, and the pore coordination number can be directly related to the connectivity of the pore network model. The wide distribution of the coordination number can be understood as the rich development of micro-joints in this area. The coordination number is often used to evaluate the reservoir transport capacity of porous media.
The pore network model visually shows the change of the pore network at different loading stages (Figure 8). In the initial stage, most of the pores were isolated pores, which were dispersed in the rock. With the loading, the connected throat appeared between the adjacent pores and further expanded into a network. The pore-connected throat initially appeared near the mineral zone and gradually developed into a pore network in the two mineral accumulation areas. In the initial stage, the average coordination value of primary pores in mudstone was close to 0, indicating that the connectivity of primary pores was poor. At the first loading stage, the average coordination value of pores did not change much from that of the previous stage, and the pore compaction stage in the corresponding stress–strain curve was basically consistent with the pore change characteristics of this stage. At the second loading stage, the increase in the average coordination number of pores corresponded to the pore connectivity in the 3D pore network model. At the stage before the peak stress of loading failure, the average coordination number of pores increased rapidly, which may have been due to the fact that the pores in this stage had developed to the critical state of failure.

4.3. Spatial Distribution of Minerals in Rock Failure Process

Quartz is one of the main minerals of mudstone, and the existence of this mineral has a significant influence on the mechanical properties of mudstone.
D e q = 6 V 3 d π 3
The calibration analysis algorithm can be used to calculate the particle volume distribution parameters in the extracted mineral particle model, and then the equivalent diameter distribution can be calculated by using the equivalent diameter Formula (1), and the diameter of each particle can be counted to establish the particle equivalent diameter distribution histogram, as shown in Figure 9 and Table 3. According to the results of calculation and statistics, the diameter of quartz mineral particles in the mudstone sample was mainly distributed in the range of 25–100 pixels, and the scanning resolution was 15.4 μm/pixel. According to the equivalent diameter formula, the diameter of quartz particles in mudstone samples was distributed between 0.38 and 1.54 mm, and the proportion of quartz particles with 0.38 mm diameter was the highest, accounting for 64.7% of all quartz particles.
The particles with different equivalent diameters were characterized in space, and the particles in different positions were statistically analyzed, with the influence of the distribution of quartz particles with different particle sizes on the damage and its change law analyzed in depth.
Figure 10 and Figure 11 show the spatial distribution of quartz particles in the initial unstressed state of mudstone specimens. A total of 19,962 quartz particles were collected by CT scanning. The equivalent diameter of mineral particles larger than 75 voxels was divided into large particles, and those with equivalent diameters less than 75 voxels were divided into small particles. Among them, there were 656 large particles, accounting for 3.28% of the total, and 19,302 small particles, accounting for 96.72% of the total. The aggregate quartz particles were 1487, accounting for 7.42% of the total. In order to show the spatial distribution of quartz mineral particles more simply and clearly with different particle sizes, as well as to further show the relationship between particles and fracture development, the display and observation were carried out from the perspective of 45° and overlooking, respectively. Each surface observed was consistent with the position of digital core modeling and CT scanning of mudstone sample, as shown in Figure 12.
From the spatial distribution of small particles, the small quartz particles were basically uniformly distributed in the whole body of the mudstone sample; the number was relatively large; and the distribution was relatively concentrated in the XOY section, forming an accumulation zone that ran through the whole body of the sample, with the mineral zone on the other side being relatively scattered, and there being no obvious aggregation law. The occurrence relationship between them was essentially consistent with the macroscopic analysis of mineral composition, having a good corresponding relationship. By comparing the spatial distribution of quartz particles with different equivalent diameters, we found that there was no special aggregation of quartz particles in mudstone samples, and the spatial distribution rules of quartz particles of the two sizes were very similar. There was no obvious relationship between mineral accumulation zone and quartz particle size, so it is necessary to further analyze the quartz particles in the digital core in the loading stage.
From the relationship between the distribution form of quartz particles and the distribution of cracks in the failure stage (Figure 12), macroscopic cracks were mainly distributed in the quartz mineral zone (Figure 4a). The quartz mineral zones of A and B aggregation types led to different initiation modes of cracks—the A mineral zone was denser, and the shape and location of cracks were consistent with these kind of mineral zones. The type B mineral zone was more discrete, but there were mineral clusters with large equivalent diameter, and the changes of crack shape and pore position must have been deformed by the influence of nearby space compression. Under the action of axial load, mudstone samples mainly showed along weak plane shear slip failure and along weak plane splitting failure, mainly because quartz mineral strength is larger; clay mineral strength is small; and under axial pressure, slip failure occurs between two kinds of minerals with different mechanical properties. On the other hand, the intergranular pores around the gathered quartz minerals continued to develop and expand under the action of external forces, thus forming macroscopic cracks.

5. Analysis of Mudstone Failure Process by Digital Volume Correlation Method

When using CT image to analyze damage, it will be affected by the scanning resolution of the CT system, and the scales studied by different analysis methods will have their own applicability. The digital core and pore network model is suitable for the analysis, which is larger than the resolution scale. The digital volume image correlation method can be used to analyze the local deformation and evolution process caused by the micro-crack, which is smaller than the CT resolution scale before the occurrence of the CT resolution scale crack. The result of the CT scan was taken as the reference image of the DVC computation, and the scan image of the later loading stage was taken as the computation image, and so on, until the final destruction of the image as the computation image and the computation phase being completed. The range of the DVC computational area is shown in Figure 13.

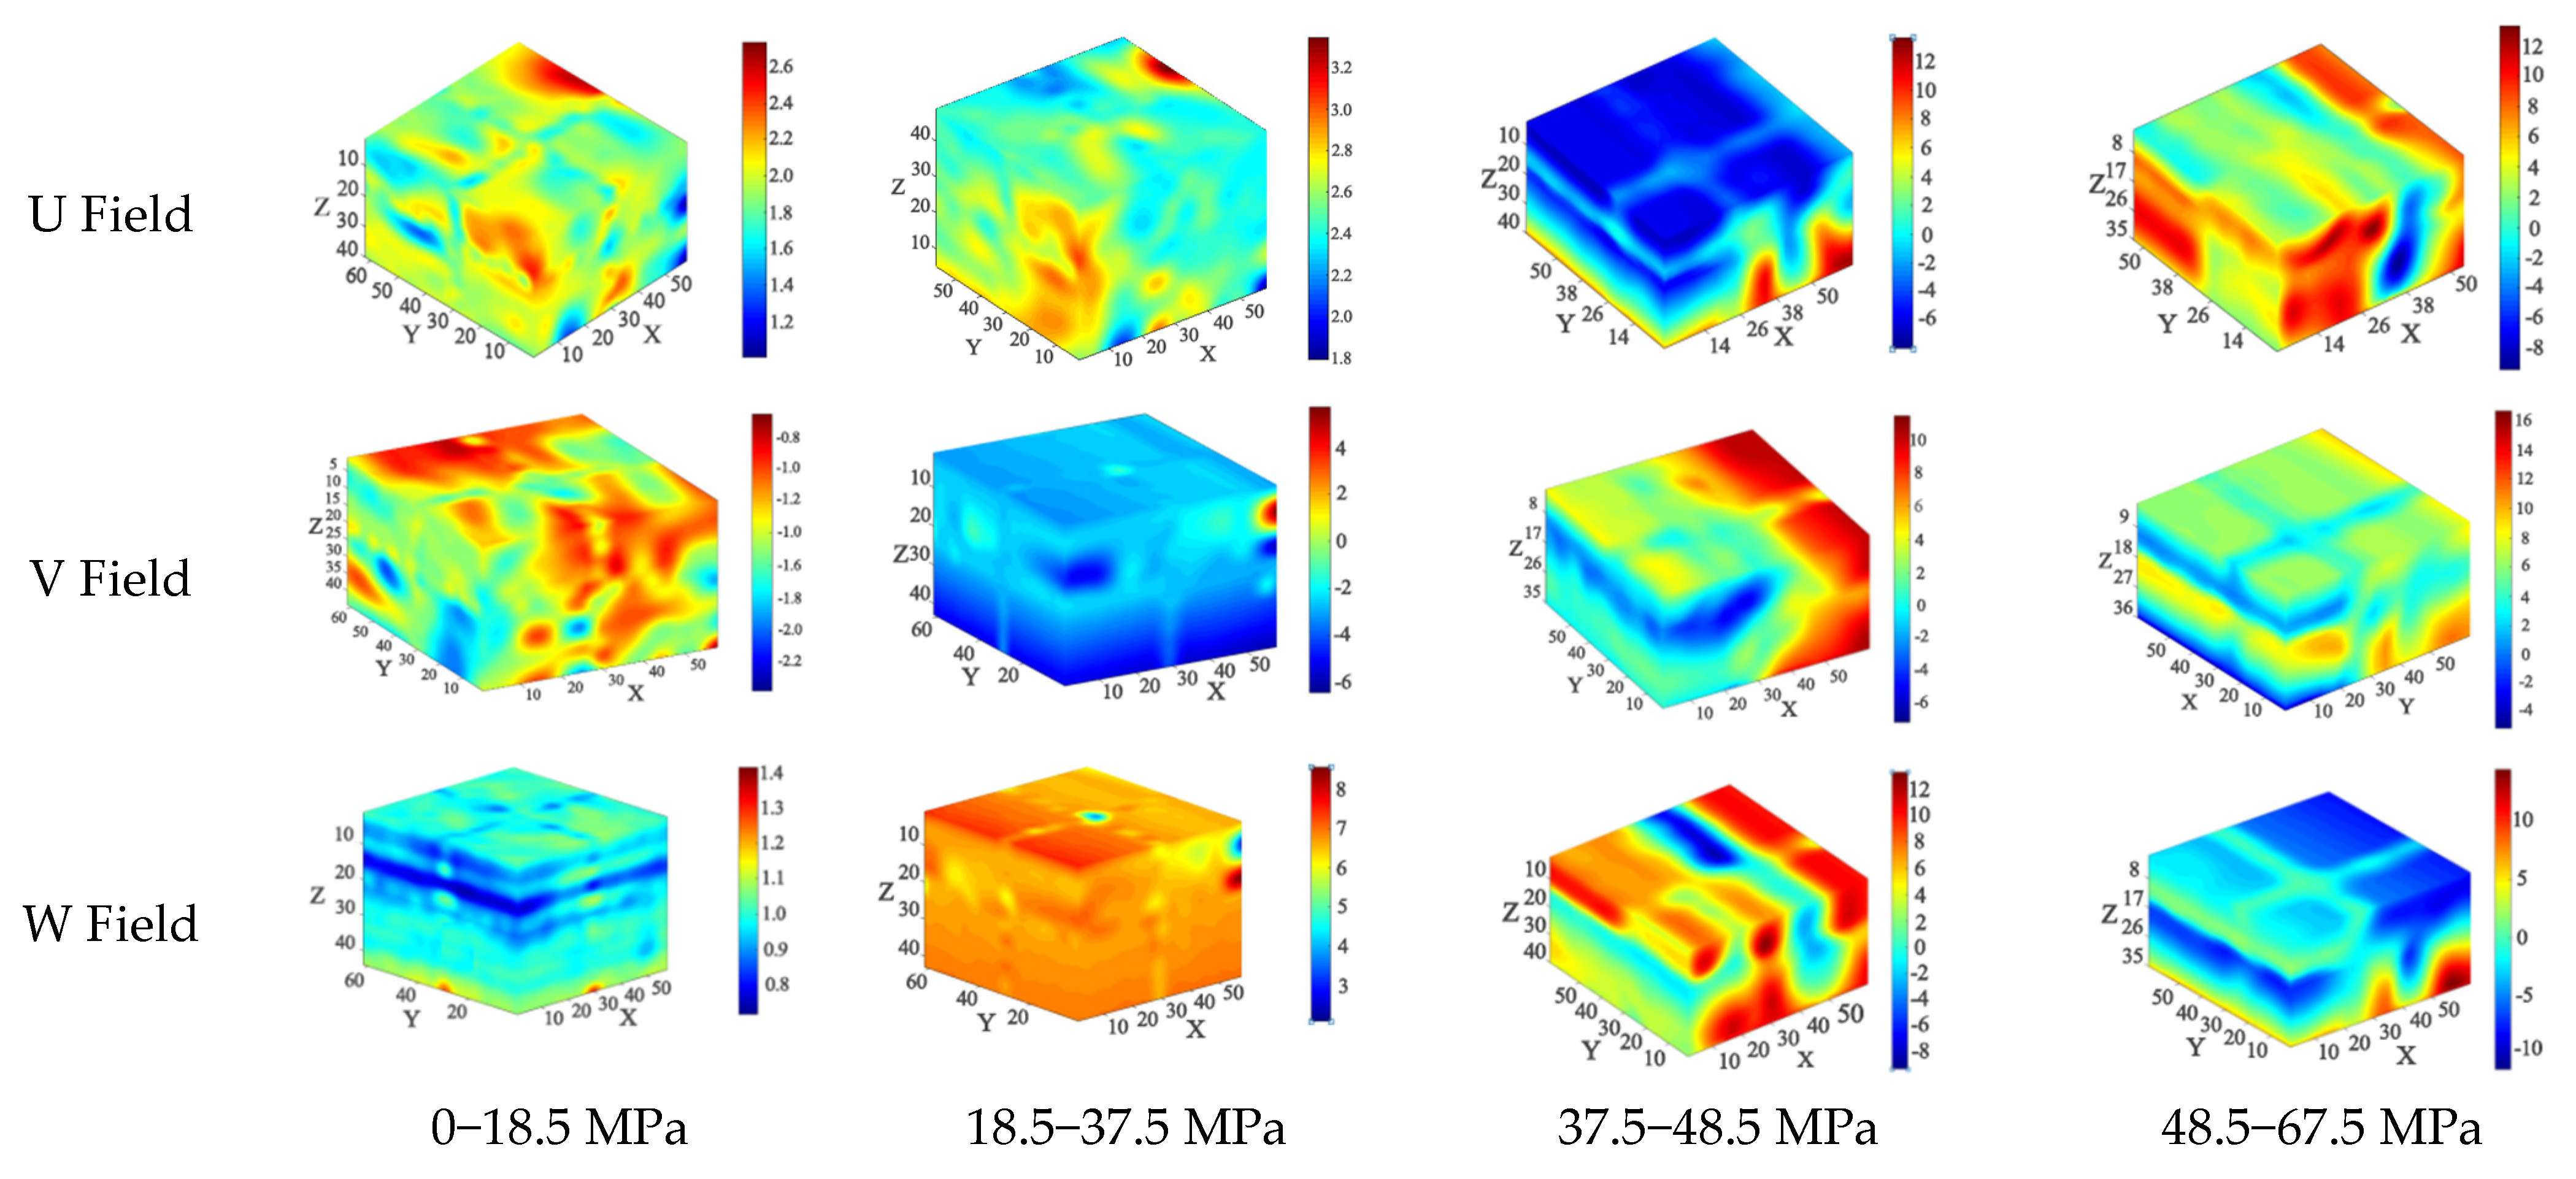
5.1. Analysis of the Evolution Process of Displacement Field

On the basis of the displacement distribution histogram calculated by DVC, the displacement field of mudstone sample under initial loading was analyzed. The X-axis displacement was uniformly distributed between −5 voxels and 5 voxels, and the frequency was concentrated at about 20. The displacement distribution of the Y-axis was close to that of the X-axis; there was only negative displacement in the Z-axis, which indicates that the mudstone sample was compressed and expanded in the X-axis direction. Moreover, a small abrupt increase in frequency appeared in the range of −5 voxels displacement, indicating that there were a large number of quartz mineral particles, micropores, and microcracks in the rock. At the initial stage of loading, microcracks were affected by external loads, and microcracks and micropores were gradually compressed and closed, which was the reason for voxel negative value in the numerical computation. On the other hand, a large number of quartz particles in the mudstone samples were hard and widely distributed in space. Under the influence of external load, the partially agglomerated quartz particles expanded and slid towards the X-axis and Y-axis after longitudinal extrusion, resulting in both negative and positive displacement in the X-axis and Y-axis. At the same time, in the state of uniaxial compression, at the initial stage of loading, the mudstone sample was mainly affected by the external load in the loading direction; the longitudinal microcracks were closed; and the hard mineral particles slipped in the plane, resulting in the expansion of the sample in the macroscopic range (Figure 14).
According to the analysis of the evolution process of the displacement fields u, v, and w in the x, y, and z directions of mudstone (in which u = u(x, y, z), v = v(x, y, z), w = w(x, y, z)) (Figure 15), we can know that the sample is mainly subjected to axial vertical compression, and because there were a large number of mineral particles in the sample, the sample showed obvious heterogeneity with the overall deformation being extremely uneven. In the first loading stage, the internal pores of mudstone samples were mostly isolated pores, and the pore connectivity was poor. The second loading stage (37.5 MPa) was the starting point of the localized deformation of the sample. The displacement value of the sample near the mineral zone was larger, and the obvious local deformation had appeared inside the sample. With the increase in the load, the overall element displacement of the specimen was gradually increasing. There were few primary cracks and micropores in the rock, and the porosity of the rock sample was low. At this time, a macroscopic crack appeared on the surface of the sample, and the pore network model was mainly developed into two clusters, with the position of the two pore connecting clusters being very close to the distribution of the mineral zone. In this stage, the rock failure increased gradually, and the number of pores and penetration was much higher than that in the previous loading stage. The large displacement area corresponded to the mineral distribution area in the 3D computational area shown in Figure 13 and gradually expanded, because in the first and second loading stages, the mudstone was in the elastic stage, and the lithology of the mudstone was more compact and the pores were compacted. In the third stage of loading, when the stress value reached 48.5 MPa, the internal microcracks developed rapidly, showing obvious positive and negative displacement zones, indicating that some areas had obvious local deformation, and these areas expanded further with the loading. The rapid growth of the average coordination number of pores may have been due to the fact that the pores at this stage had developed to the critical state of failure. At the peak load 67.5 MPa, there was a large range of large displacement regions in the sample as a whole, and the large displacement regions changed strongly compared with the previous stage, being redistributed and concentrated. There was an obvious boundary between the large displacement region and the low displacement region, and there was an obvious delamination phenomenon in each displacement region of the sample. The regions with smaller displacement values essentially appeared at the junction of the mineral zone, which was consistent with the final failure form of the sample. At this time, the internal microcracks and pores of the sample expanded and penetrated, and the sample was at the critical point of instability and failure.

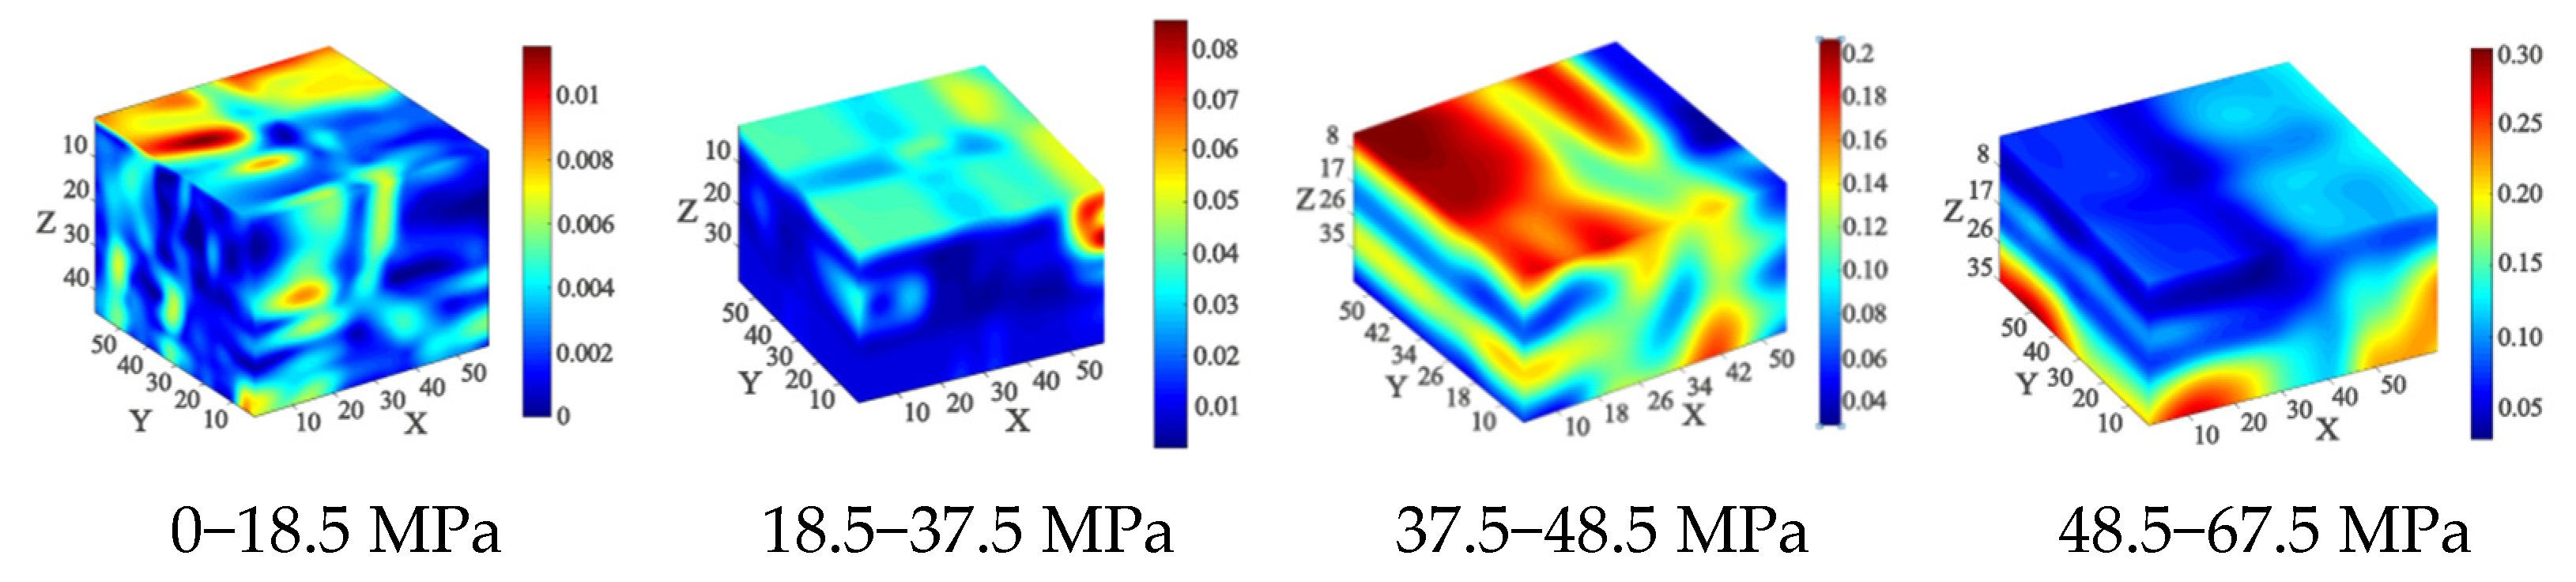
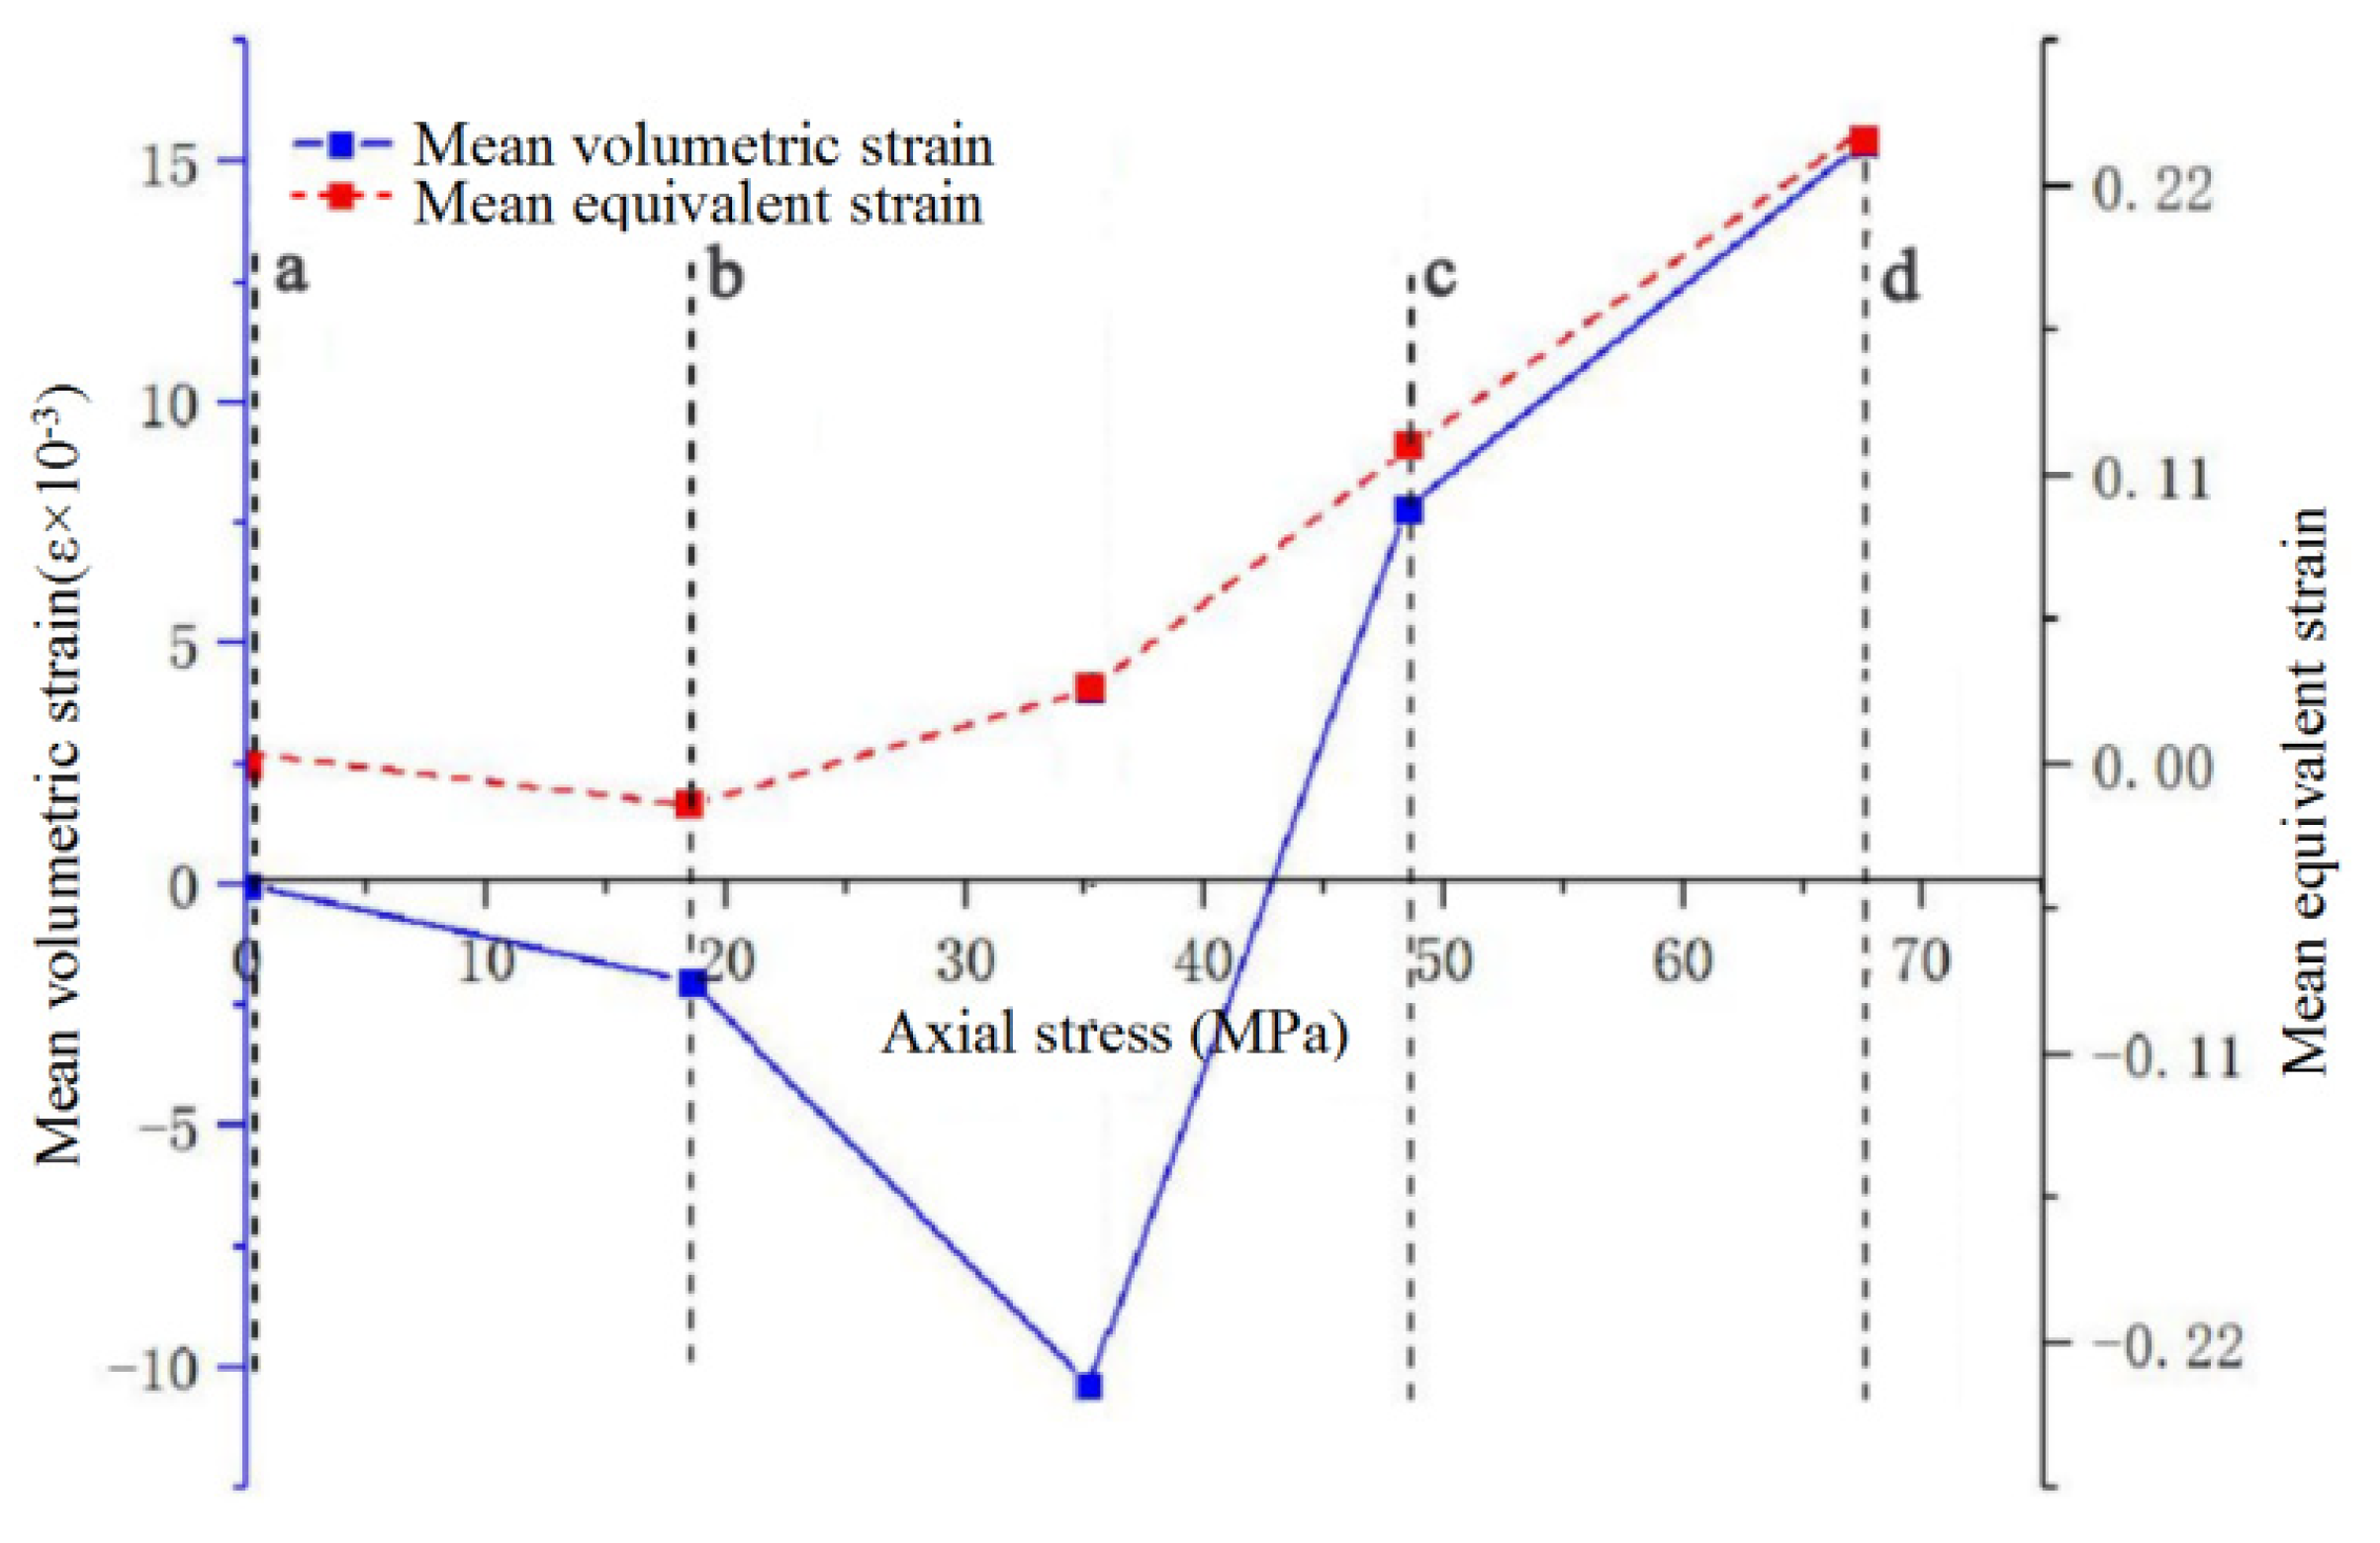
5.2. Analysis on the Evolution Process of Strain Field

The strain field can better reflect the evolution process of local deformation in rock, six strain components of Cauchy strain tensor were solved by local least square fitting method, and the equivalent strain and volume strain under different loads can be calculated.
It can be seen from the equivalent strain nephogram (Figure 16) and the 3D volumetric strain nephogram (Figure 17) of the mudstone sample during full loading, at the initial stage of loading, the overall strain of the sample was small, and the high strain area was mainly concentrated in the XOZ plane and YOZ plane. The reduction to the real sample was in the quartz dense accumulation area of the mudstone sample, and the high strain area was scattered near the quartz particles. When loading to 18.5 MPa, there was a higher equivalent strain in the lower left corner of the sample, and the maximum equivalent effect of the sample was 0.01; according to the strain and the ultimate failure strain of mudstone, it can be inferred that there should be small cracks in this area of the sample at this time. With the progress of loading, the main strain region gradually shifted to the right side, showing the phenomenon of localized zone, which reflected the closure and change of primary pores, cracks, and other structures in the rock at the initial stage of loading. The equivalent strain in the mudstone went through a process of first dispersion and then concentration, which was because the microcrack near the mineral zone was closed at the initial stage of loading, resulting in a small range of strain concentration in the elastic stage, resulting in the rapid increase in the main strain of this part; with the increase in loading, the deformation of the sample tended to be gentle, and the equivalent strain entered a quiet period. When loading to 37.5 MPa, the sample began to show local deformation, and the maximum volume strain inside the specimen was 0.3, indicating that when the load is low, the volume near the mineral zone changes greatly, so it is easy to produce local deformation in the first step. When loading to 48.5 MPa, the microcracks and pores in the sample continued to develop and penetrate, forming new cracks and large-scale local deformation. The equivalent strain in the sample was rapidly redistributed with the new deformation region, forming an obvious boundary between the two mineral zones.
Figure 18 shows the variation curve of volumetric strain and equivalent strain with axial stress in the process of uniaxial loading of mudstone. From the curve in the graph, it can be seen that there was a certain correlation between them. According to the change of the curve, it can be divided into three stages:
(1)
The stage of compaction (a–b). During the loading process (0–18.5 MPa), the volume strain of the sample was negative, and the equivalent effect increased slowly, indicating that the sample was affected by axial load and the sample was compressed. Combined with the equivalent strain distribution nephogram, the strain region was mainly distributed in the mineral zone, indicating that the intergranular pores near the mineral particles were squeezed, the pore connectivity increased, and the overall porosity showed an increasing trend. The number of pore throats between isolated pores increased, the coordination number of pores increased, and deformation occurred.
(2)
The stage of microcrack development (b–c). During the loading process (18.5 MPa–48.5 MPa), the volumetric strain reached the minimum rapidly, and with the increase in load, the volumetric strain began to rebound and increased to 0. At this stage, the equivalent strain was redistributed from the local discrete strain region to form a large range of strain region, and the high strain region was gradually connected, maintaining a rapid growth trend, while the porosity continued to increase, and the connectivity of the pore network increased. The number of connected pore throats between pores increased, and the coordination number of pores increased. It showed that the sample began to expand, and a large number of micro-hole cracks began to develop.
(3)
The stage of microcrack propagation (c–d). During the loading process (48.5 MPa–67.5 MPa), the change rate of volumetric strain and equivalent strain began to slow down, and the equivalent strain region was connected, with there being a clear boundary between the high strain region and the low strain region, indicating that cracks that were higher than the identification range of CT resolution were generated, and that the micro hole crack had expanded into a macroscopic crack. The stress corresponding to point c can be used as the critical point of the macroscopic crack, which was 62.9% of the peak load. The increasing trend of porosity, pore connectivity, and pore coordination number were essentially the same as that of the previous stage, and there was a crack on the surface of the sample, with a trend of continuous growth.

6. Conclusions

In this paper, mudstone was taken as the research object, and the failure mechanism of mudstone was studied according to rock microscopic physical property analysis, uniaxial in situ CT scanning, digital core reconstruction, pore network extraction, mineral composition, and pore structure. The following conclusions were drawn:
(1)
The diagenetic mineral composition of mudstone was relatively simple, being mainly composed of brittle materials such as quartz and clay minerals, and the proportion of brittle minerals was relatively high, which was the main reason for the high strength of mudstone. Moreover, through the scanning electron microscope, it was found that the brittle mineral quartz and so on often exist in the form of agglomerated strips in the mudstone, resulting in the formation of structural weak surfaces on different mineral interfaces. These results are similar to those reported by Zhao et al. (2013).
(2)
The digital core models of mudstone at different loading stages were established by using a uniaxial loading in situ CT scanning test system. There were a large number of primary intergranular pores near the mineral accumulation zone, and the connectivity of pores will gradually increase with the increase in axial load. Macroscopically, the porosity of the rock increased, and cracks gradually appeared, with the internal pores being abnormally developed. When the rock reached the critical state of failure, the throat number and coordination number of pores clearly increased.
(3)
There was no obvious difference in the distribution of mineral particles of different sizes, and the interior of mudstone was mainly affected by a large number of small size mineral particles, indicating that the slip between mineral zones was mainly dominated by small-size minerals.
(4)
The final propagation shape of the crack was very consistent with that of the mineral zone, indicating that it was easy to form a weak surface in the aggregated mineral zone, and the aggregated mineral zone under loading could easily produce local deformation, which is related to the mechanical properties of the mineral zone and its surrounding rock matrix. When rock breaks, it is easy to produce along the junction of the two kinds of minerals. The results are in good agreement with similar study by Yin et al. (2019).
(5)
The displacement in the polymeric mineral zone was small, the deformation displacement of the rock skeleton dominated by clay minerals near the quartz mineral zone was larger, and the stronger quartz minerals restrained the rock skeleton deformation in the region.

Author Contributions

Methodology, D.D.; validation, D.D., X.C. and X.W.; formal analysis, X.W.; investigation, X.C.; resources, J.S.; data curation, D.D.; writing—original draft preparation, D.D. and X.C.; writing—review and editing, X.F.; visualization, X.C.; supervision, X.F.; project administration, D.D.; funding acquisition, D.D. All authors have read and agreed to the published version of the manuscript.

Funding

This research was funded by the Chinese National Natural Science Foundation (no. 51304143) and the Chinese National Natural Science Foundation (no. 51604184).

Informed Consent Statement

Informed consent was obtained from all subjects involved in the study.

Conflicts of Interest

The authors declare no conflict of interest.

References

  1. Dong, H.M.; Sun, J.M.; Lin, Z.Z.; Chui, L.K.; Yan, W.C. Quantitative characterization and characteristics analysis of microscopic pore structure in natural gas hydrate based on CT scanning. J. China Univ. Pet. Ed. Nat. Sci. 2018, 42, 45–54. [Google Scholar]
  2. Ehab, M.K.K.; Gerard, P.C.J.B.; Massart, T.J. Modelling stress-induced permeability alterations in sandstones using CT scan-based representations of the pore space morphology. Int. J. Rock Mech. Min. 2022, 150, 104998. [Google Scholar] [CrossRef]
  3. Zhang, Z.H.; WEI, W.; Zhan, J.; Jia, H.B. Determining method of multiscale fractal dimension of red bed sandstone pores based on CT scanning. Bull. Geol. Sci. Technol. 2022, 41, 254–263. [Google Scholar]
  4. Yin, Z.H.; Xu, Q.J. Microscopic damage detection of sandstone using digital core technology. J. Hydr. Eng. 2021, 40, 169–178. [Google Scholar]
  5. Lin, C.Y.; Wang, Y.; Yang, S.; Ren, L.H.; You, C.M.; Wu, S.T.; Wu, Y.Q.; Zhang, Y.M. 3D Modeling of digital core based on X-ray computed tomography. J. Jilin Univ. Earth. Sci. Ed. 2018, 48, 307–317. [Google Scholar]
  6. Zhang, H.M.; Mu, N.N. Study on Meso-Damage of Freeze-Thaw rocks based on 3D reconstruction. Mech. Eng. 2021, 43, 687–694. [Google Scholar]
  7. Yang, Z.F.; Zeng, J.H.; Feng, X.; Feng, S.; Zhang, Z.D.; Qiao, J.C. Small-scaled heterogeneity of tight sandstone reservoirs and oil accumulation characteristics. J. China. U. Min. Techno. 2016, 45, 119–127. [Google Scholar]
  8. Voutilainen, M.; Miettinen, A.; Sardini, P.; Parkkonen, J.; Sammaljarvi, J.; Gylling, B.; Selroos, J.O.; Yli-Kaila, M.; Koskinen, L.; Siitari-Kauppi, M. Characterization of spatial porosity and mineral distribution of crystalline rock using X-ray micro computed tomography. C-14-PMMA autoradiography and scanning electron microscopy. Appl. Geochem. 2019, 101, 50–61. [Google Scholar] [CrossRef]
  9. Wang, D.K.; Zhang, P.; Wei, J.P.; Wu, Y.; Zeng, F.C. Dynamic evolution characteristics of fractures in gas-bearing coal under the influence of gas pressure using industrial CT scanning technology. J. China. Coal. Soc. 2021, 46, 3550–3564. [Google Scholar] [CrossRef]
  10. Larmagnat, S.; Des Roches, M.; Daigle, L.F.; Francus, P.; Lavoie, D.; Raymond, J.; Malo, M.; Aubiès-Trouilh, A. Continuous porosity characterization: Metric-scale intervals in heterogeneous sedimentary rocks using medical CT-scanner. Mar. Pet. Geol. 2019, 109, 361–380. [Google Scholar] [CrossRef]
  11. Farokhian, D.; Azin, R.; Ranjbar, A. Application of medical and dental CT-Scan technologies for determining porosity distribution of the Persian Gulf coastal zone and Zagros basin core samples. J. Afr. Earth. Sci. 2019, 150, 96–106. [Google Scholar] [CrossRef]
  12. Mao, W.Z.; Lv, Q.; Zheng, J.; Peng, Y.; Liu, J. Analysis of mineral composition and Meso-Structure of ruanite using ctimages. J. Eng. Geol. 2022, 30, 216–222. [Google Scholar]
  13. Cao, A.; Long, W.; Du, H.B.; Chen, F.F.; Zhao, H.; Wang, G.Q.; Yuan, P. Study on the influence of asphaltene recognition on rock physical parameters based on micro CT technology. Contemp. Chem. Ind. 2021, 50, 2869–2872, 2876. [Google Scholar]
  14. Kumari, W.G.P.; Ranjtth, P.G.; Perera, M.S.A.; Li, X.; Li, L.H.; Chen, B.K.; Isaka, B.L.A.; De Silva, V.R.S. Hydraulic fracturing under high temperature and pressure conditions with micro CT applications: Geothermal energy from hot dry rocks. Fuel 2018, 230, 138–154. [Google Scholar] [CrossRef]
  15. Yang, Y.M.; Ju, Y.; Liu, H.B.; Wang, H.J. Infilence of porous structrue properties on mechanical performances of rock. Chin. J. Rock. Mech. Eng. 2009, 28, 2031–2038. [Google Scholar]
  16. Zhao, B.; Wang, Z.Y.; Wu, J.P. Relation between mineralogical composition and microstructure to the mechanical properties of rock materials. Coal. Geol. Explor. 2013, 41, 59–63, 67. [Google Scholar]
  17. Yin, X.M.; Yan, E.C.; Wang, L.N.; Chen, L. Quantitative microstructure information extraction and microscopic morphology analysis of anisotropic schist. Rock. Soil. Mech. 2019, 40, 2617–2627, 2729. [Google Scholar]
  18. Li, J.; Liu, C.; Liu, H.M.; Wang, J.D.; Zeng, Z.P.; Xie, Y.T. Research on the Mesoscopic Damage Mechanism of Shale Reservoir Based on Digital Core. Chin. J. Rock. Mech. Eng. 2022, 41, 1103–1113. [Google Scholar]
  19. Wu, N.; Liang, Z.Z.; Zhang, Z.H.; Li, S.H.; Lang, Y.X. Development and verification of three-dimensional equivalent discrete fracture network modelling based on the finite element method. Eng. Geol. 2022, 306, 106759. [Google Scholar] [CrossRef]
  20. Guo, W.N.; Bao, J.W.; Zhang, P.; Sun, Y.Q.; Ma, Y.X.; Zhao, T.J. Mechanical Properties and Deformation Characteristics of Hybrid Fiber Strain Hardening Cementitious Composites Based on Digital Image Method. J. Chin. Ceram. Soc. 2022, 50, 1401–1409. [Google Scholar]
  21. Bay, B.K.; Smith, T.S.; Fyhrie, D.P. Saad M Digital volume correlation: Three-dimensional strain mapping using X-ray tomography. Exp. Mech. 1999, 39, 217–226. [Google Scholar] [CrossRef]
  22. Mao, L.T.; Wei, K.; Zhu, Z.Y.; Liu, H.Z. Measurement and analysis of 3D deformation in glass fiber reinforced composites by using computed tomography. J.Reinf. Plast. Compos. 2018, 9, 5–10. [Google Scholar]
Figure 1. CT platform experimental system.
Applsci 12 07933 g001
Figure 2. Part of mudstone test piece.
Applsci 12 07933 g002
Figure 3. XRD test results of mudstone samples.
Applsci 12 07933 g003
Figure 4. Microcracks and pores near mineral particles. (a) Mineral accumulation zone. (b) Quartz particles. (c) Microcracks near mineral particles.
Applsci 12 07933 g004
Figure 5. Gray image segmentation process. (a) Primitive mudstone. (b) Sub-block statistical feature. (c) Calculation of connectivity of mineral particles. (d) Extraction of aggregate mineral zone.
Applsci 12 07933 g005
Figure 6. Pores and pore throats distribution of mudstone in the third loading stage. (a) First loading stage. (b) Second loading stage. (c) Third loading stage.
Applsci 12 07933 g006
Figure 7. Complete failure result of mudstone and 3D image of fractures.
Applsci 12 07933 g007
Figure 8. Change of pore coordination number during mudstone loading.
Applsci 12 07933 g008
Figure 9. Histogram of equivalent diameter distribution of quartz particles.
Applsci 12 07933 g009
Figure 10. Spatial distribution of small size mineral particles.
Applsci 12 07933 g010
Figure 11. Spatial distribution of large-size mineral particles.
Applsci 12 07933 g011
Figure 12. Relationship between final failure cracks and quartz particle distribution.
Applsci 12 07933 g012
Figure 13. DVC computational area.
Applsci 12 07933 g013
Figure 14. DVC computation of x, y, and z direction displacement and ZNCC distribution histogram.
Applsci 12 07933 g014
Figure 15. Evolution process of displacement field u, v, and w in x, y, and z directions.
Applsci 12 07933 g015
Figure 16. Evolution process of equivariant strain nephogram.
Applsci 12 07933 g016
Figure 17. Evolution process of volume strain nephogram.
Applsci 12 07933 g017
Figure 18. Variation graph of volume strain mean and equivalent strain mean. (a) 0MPa. (b) 18.5MPa. (c) 48.5MPa. (d) 67.5MPa.
Applsci 12 07933 g018
Table 1. Main chemical composition of mudstone (%).
CategoryQuartzIlliteChloritePlagioclasePyriteOthers
Content (%)45.143.744.864.60.21.5
Table 2. Fracture development parameters of mudstone at different loading stages.
Loading PhaseFracture Volume (mm³)Number of PoresNumber of Pore ThroatNumber of Macro Cracks
Initial stage0.80480520
The first stage1.035810260
The second stage2.3212862642
The third phase180.75--5
The fourth stage210.56--7
Table 3. Particle equivalent diameter distribution parameter table.
Mean/PixelStandard Deviation/PixelMax/PixelMin/PixelQuantity
38.9334.68328.9822.3519,961
Publisher’s Note: MDPI stays neutral with regard to jurisdictional claims in published maps and institutional affiliations.

