
Study on the Measurement of the On-Site Overvoltage and Internal Temperature Rise Simulation of the EMU Arrester

 , , ,
, , ,
Abstract
:1. Introduction
2. Arrester Temperature Rise Test
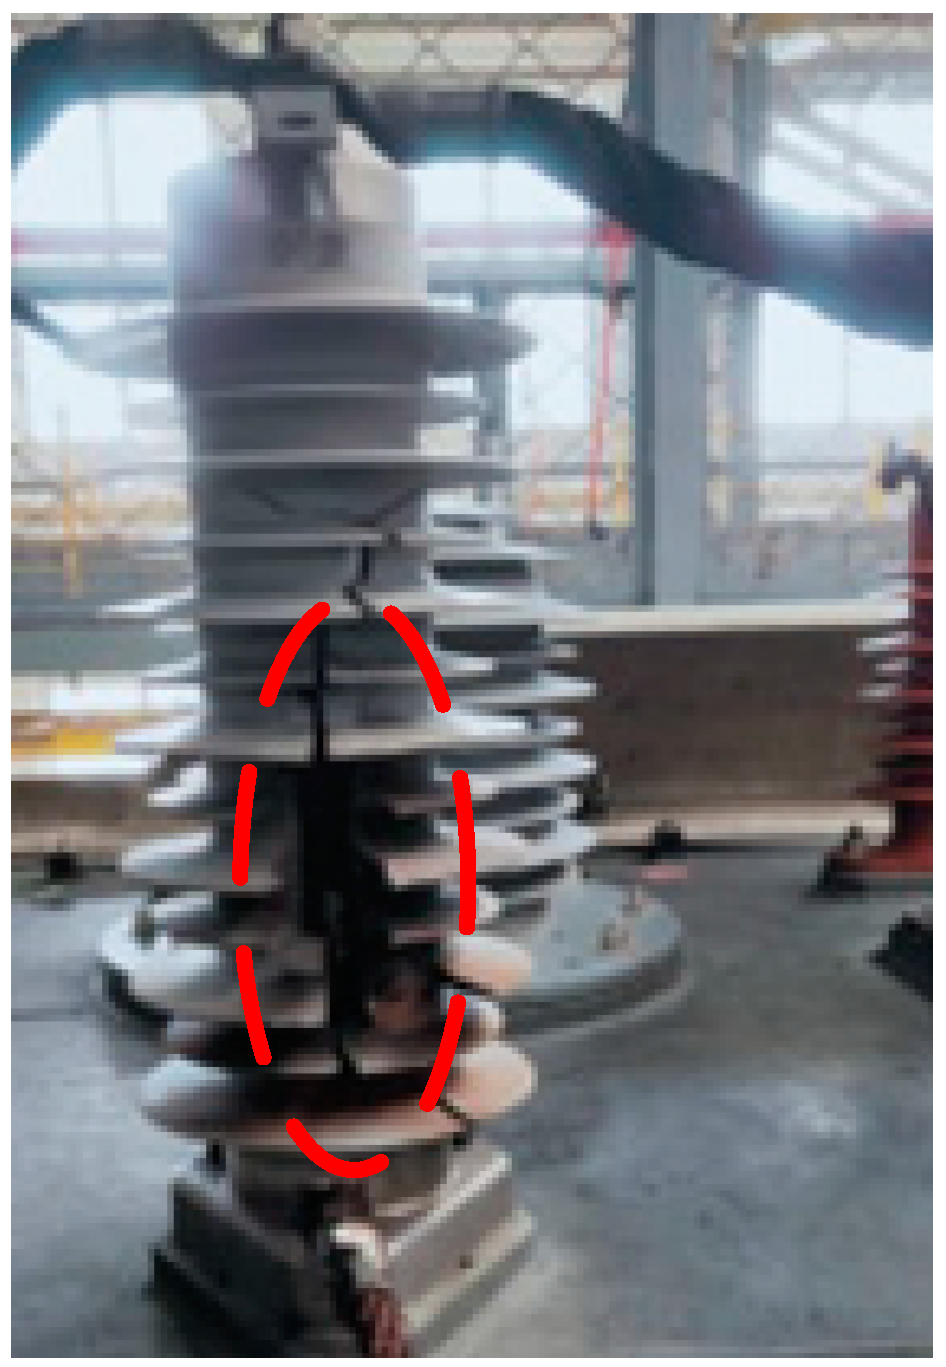
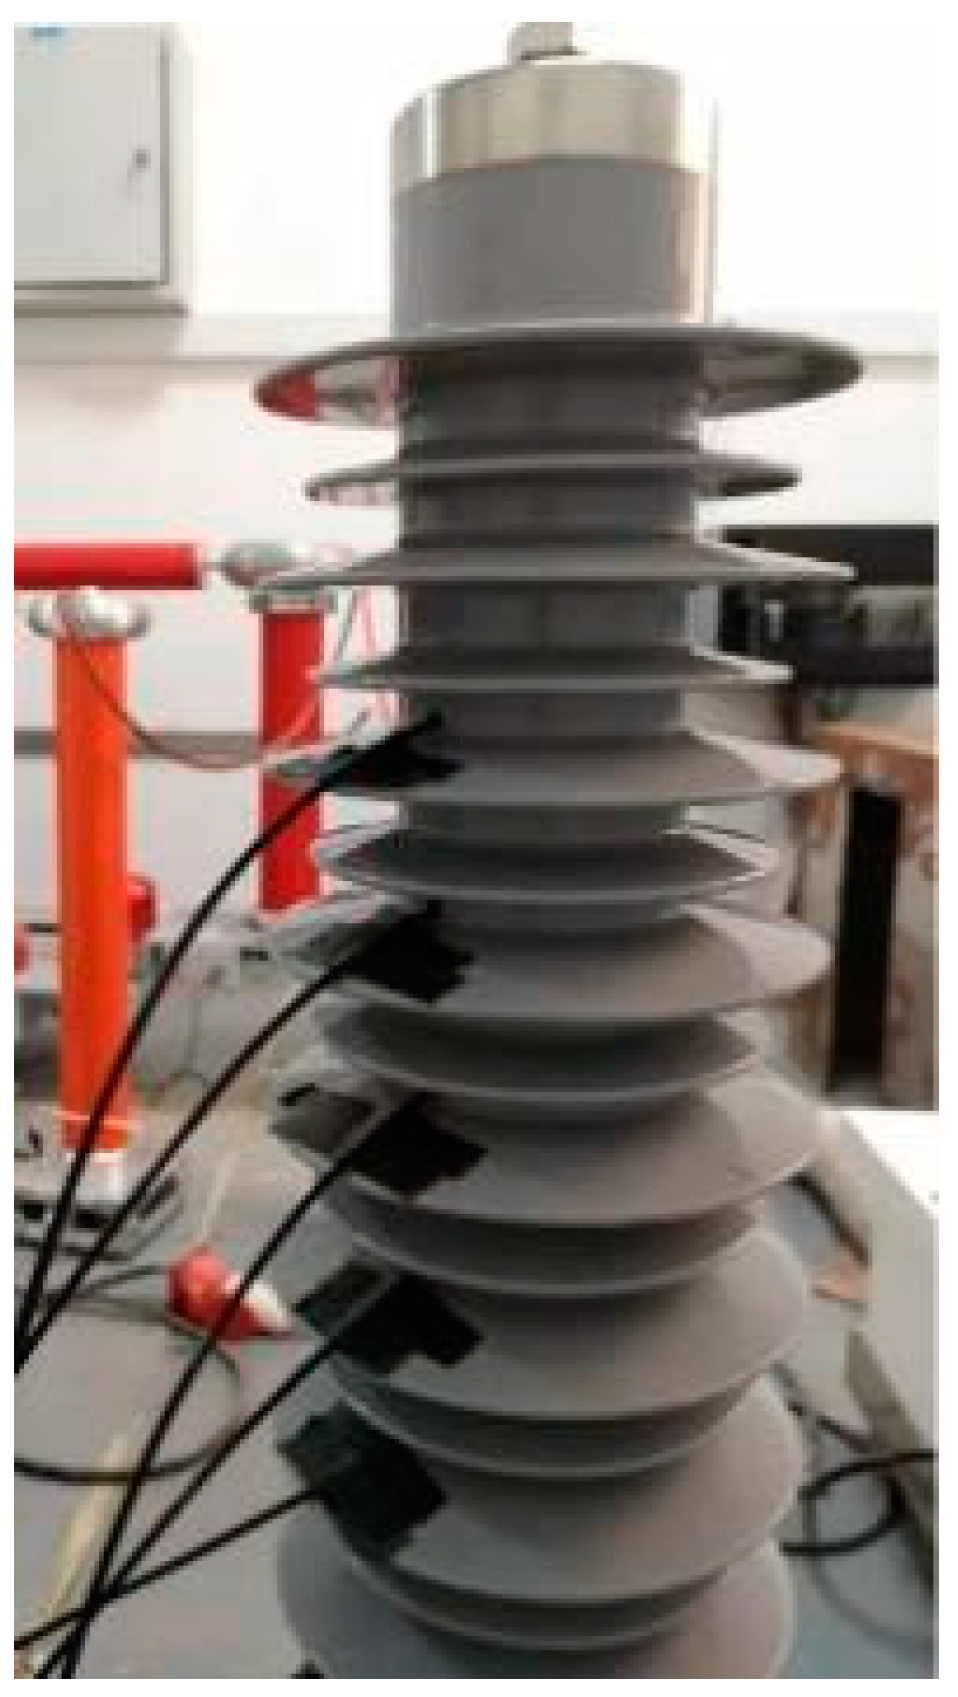
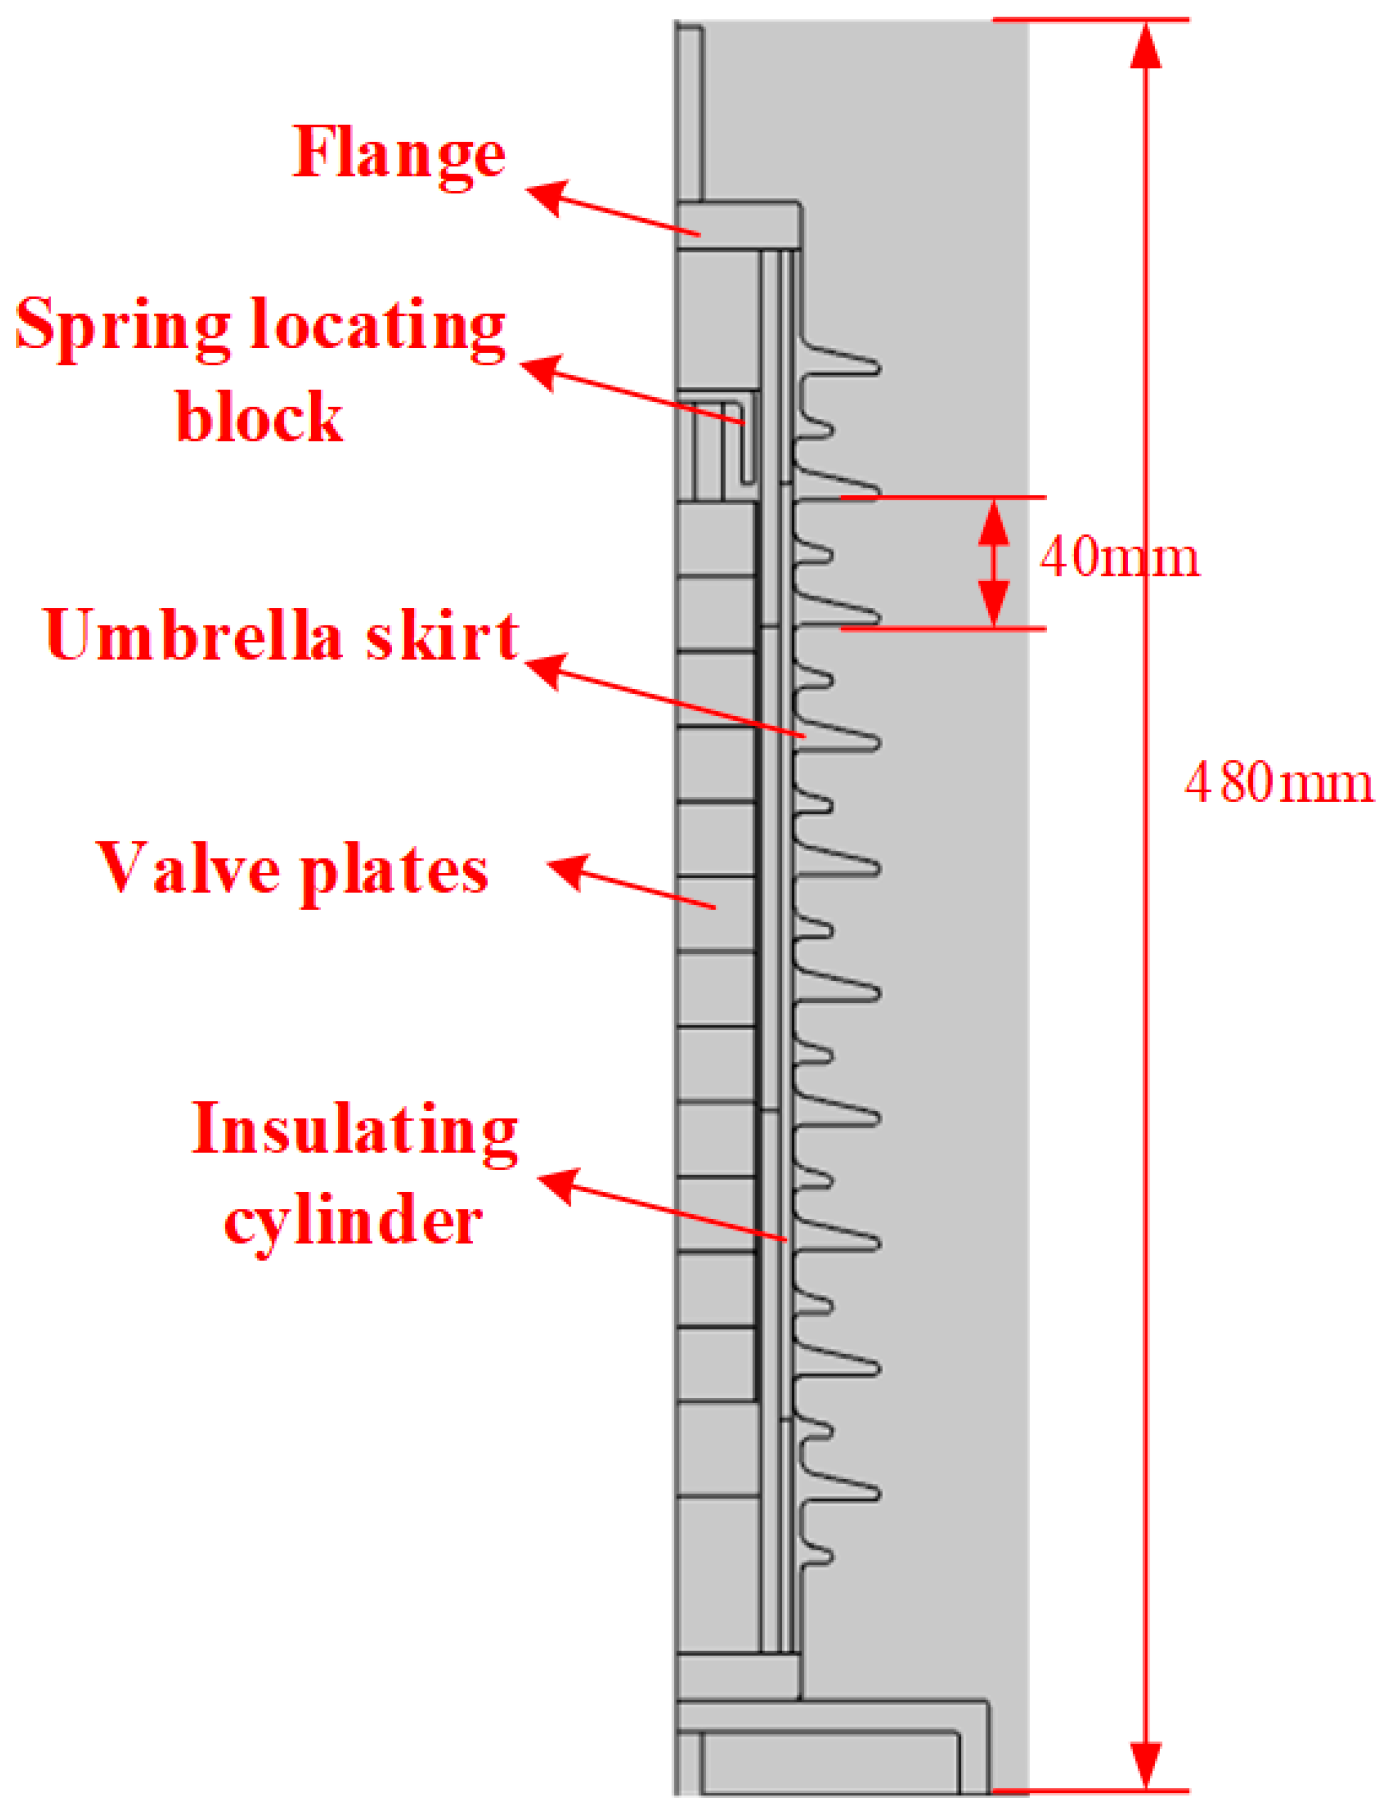
2.1. The Tested Sample
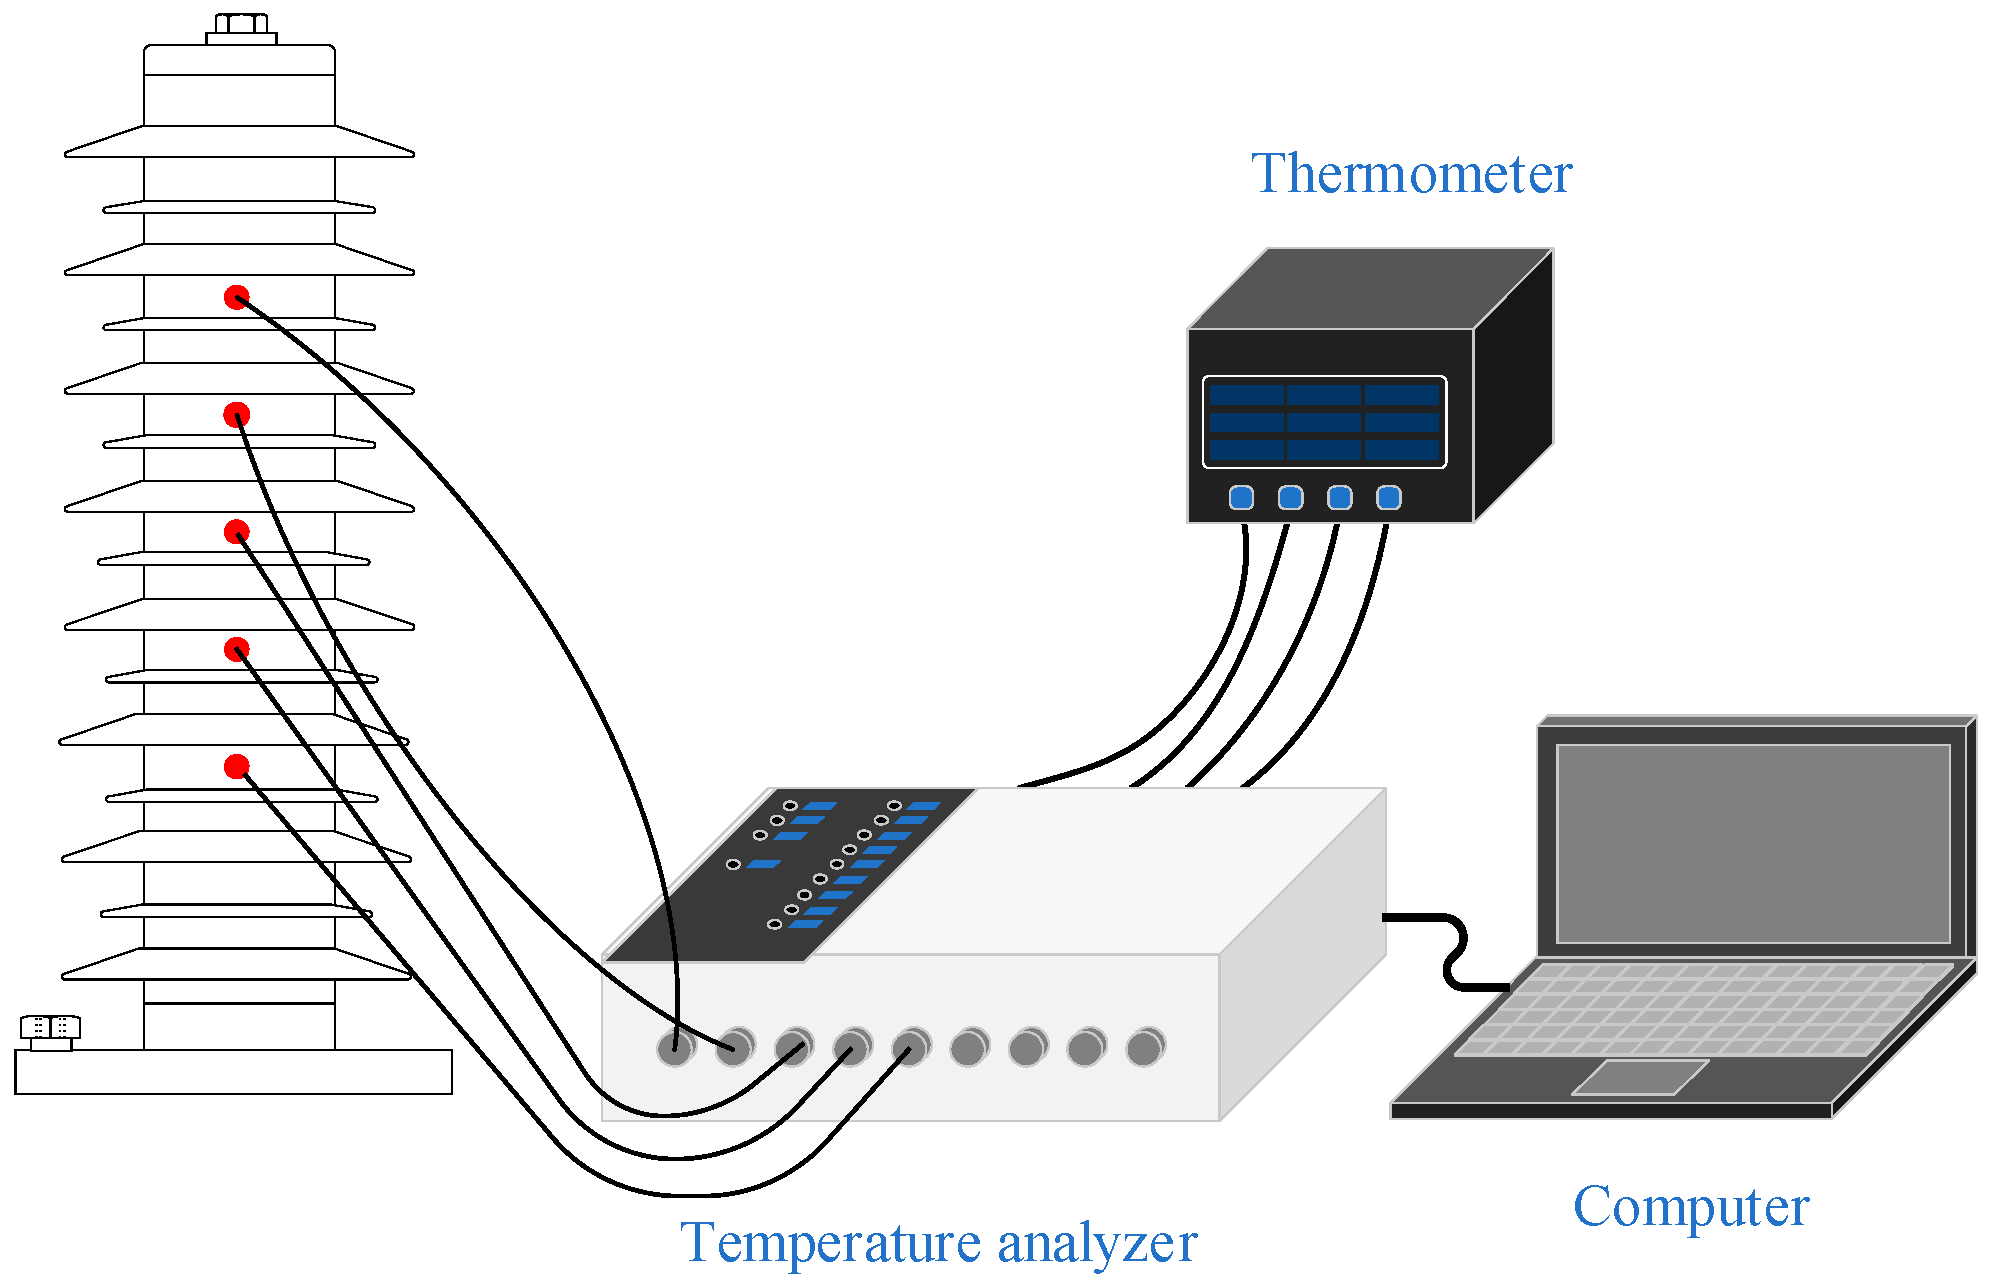
2.2. Fluorescent Optical Fiber Temperature Measuring System
2.3. Test Method and Procedure
- (1)
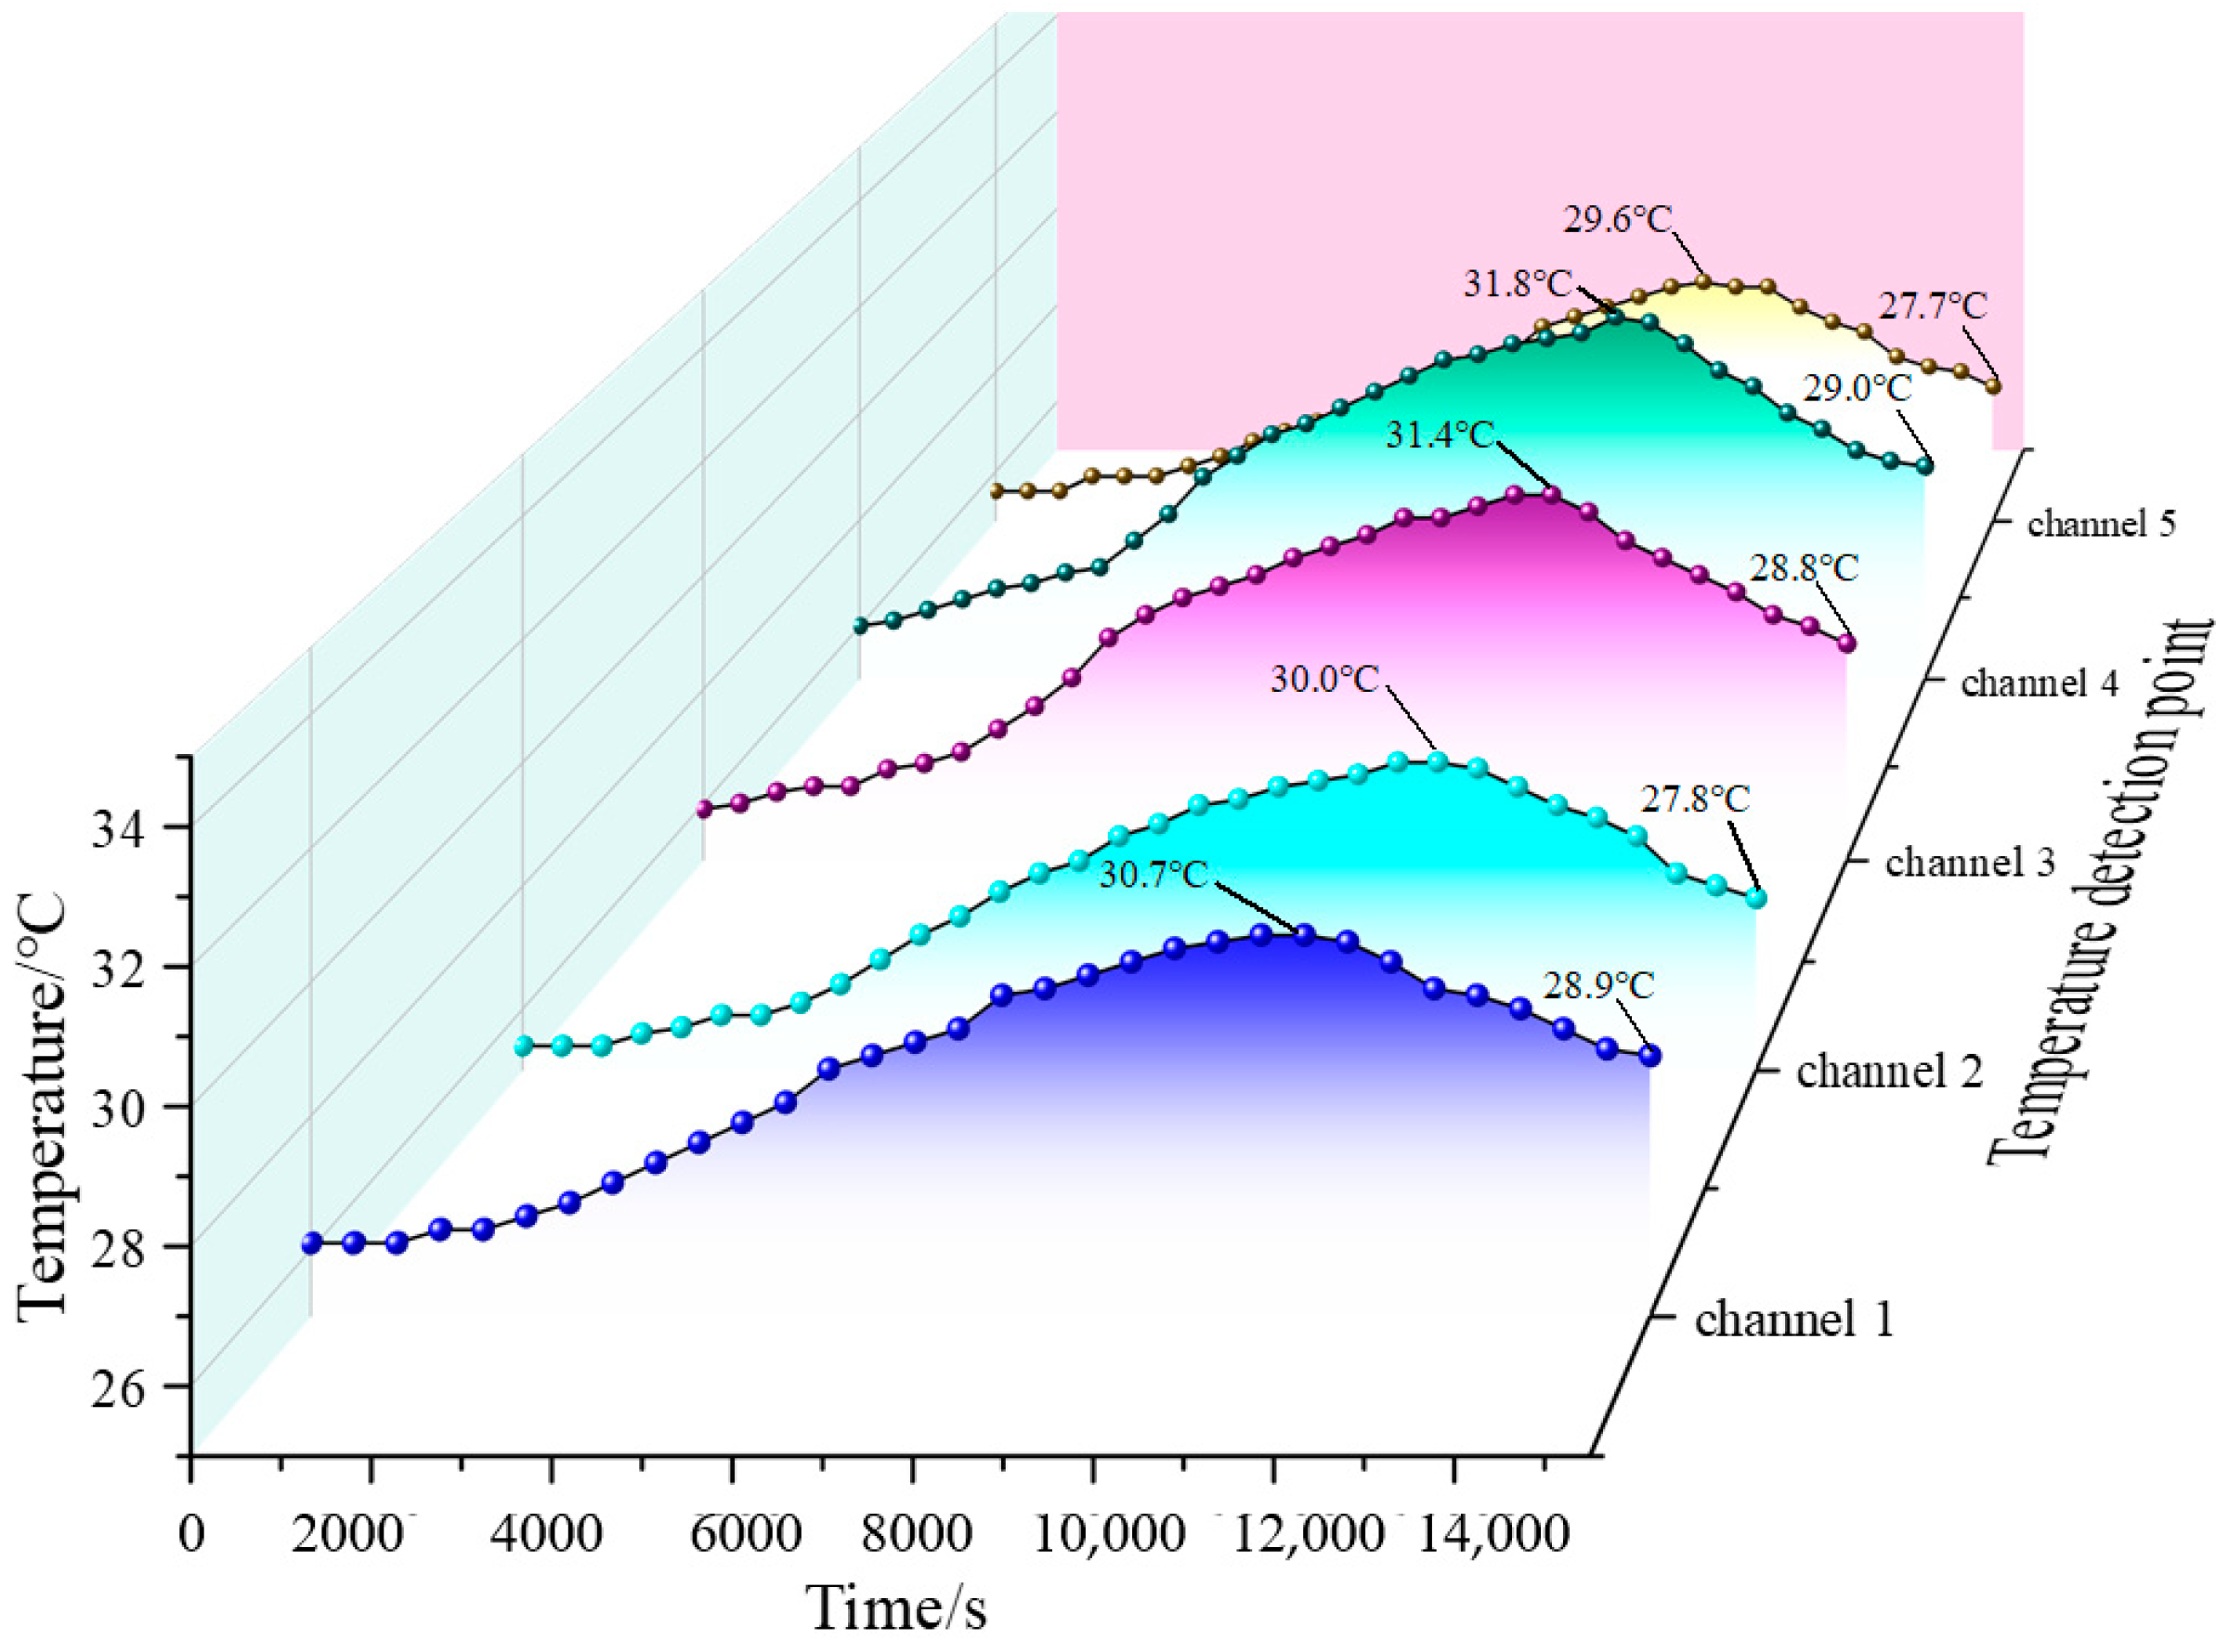
- The temperature rise test under continuous operation voltage. Before the test, the indoor ambient temperature was 25.8 °C. First, the 34 kV voltage was applied to the arrester for 3 h; then, the power was cut off and it was let to cool down to room temperature naturally; finally, the temperature changes in each channel were measured.
- (2)
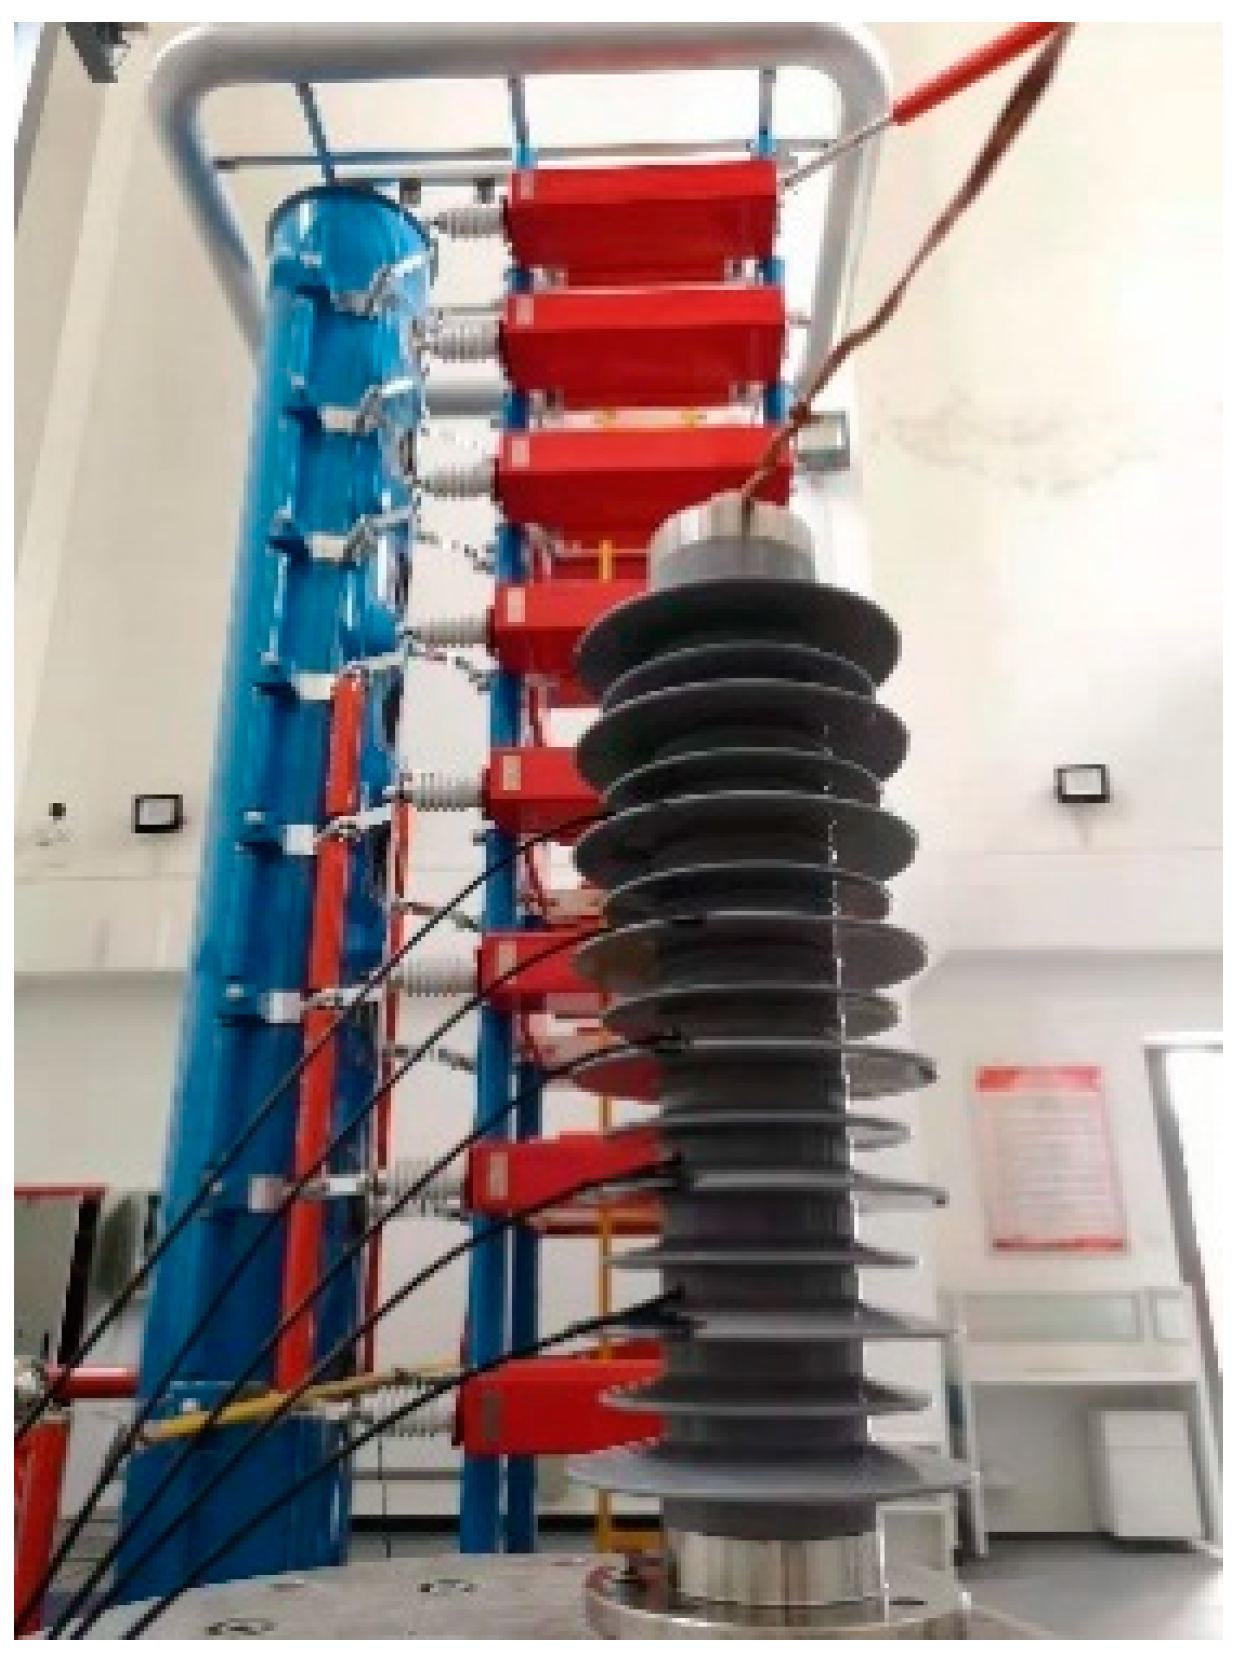
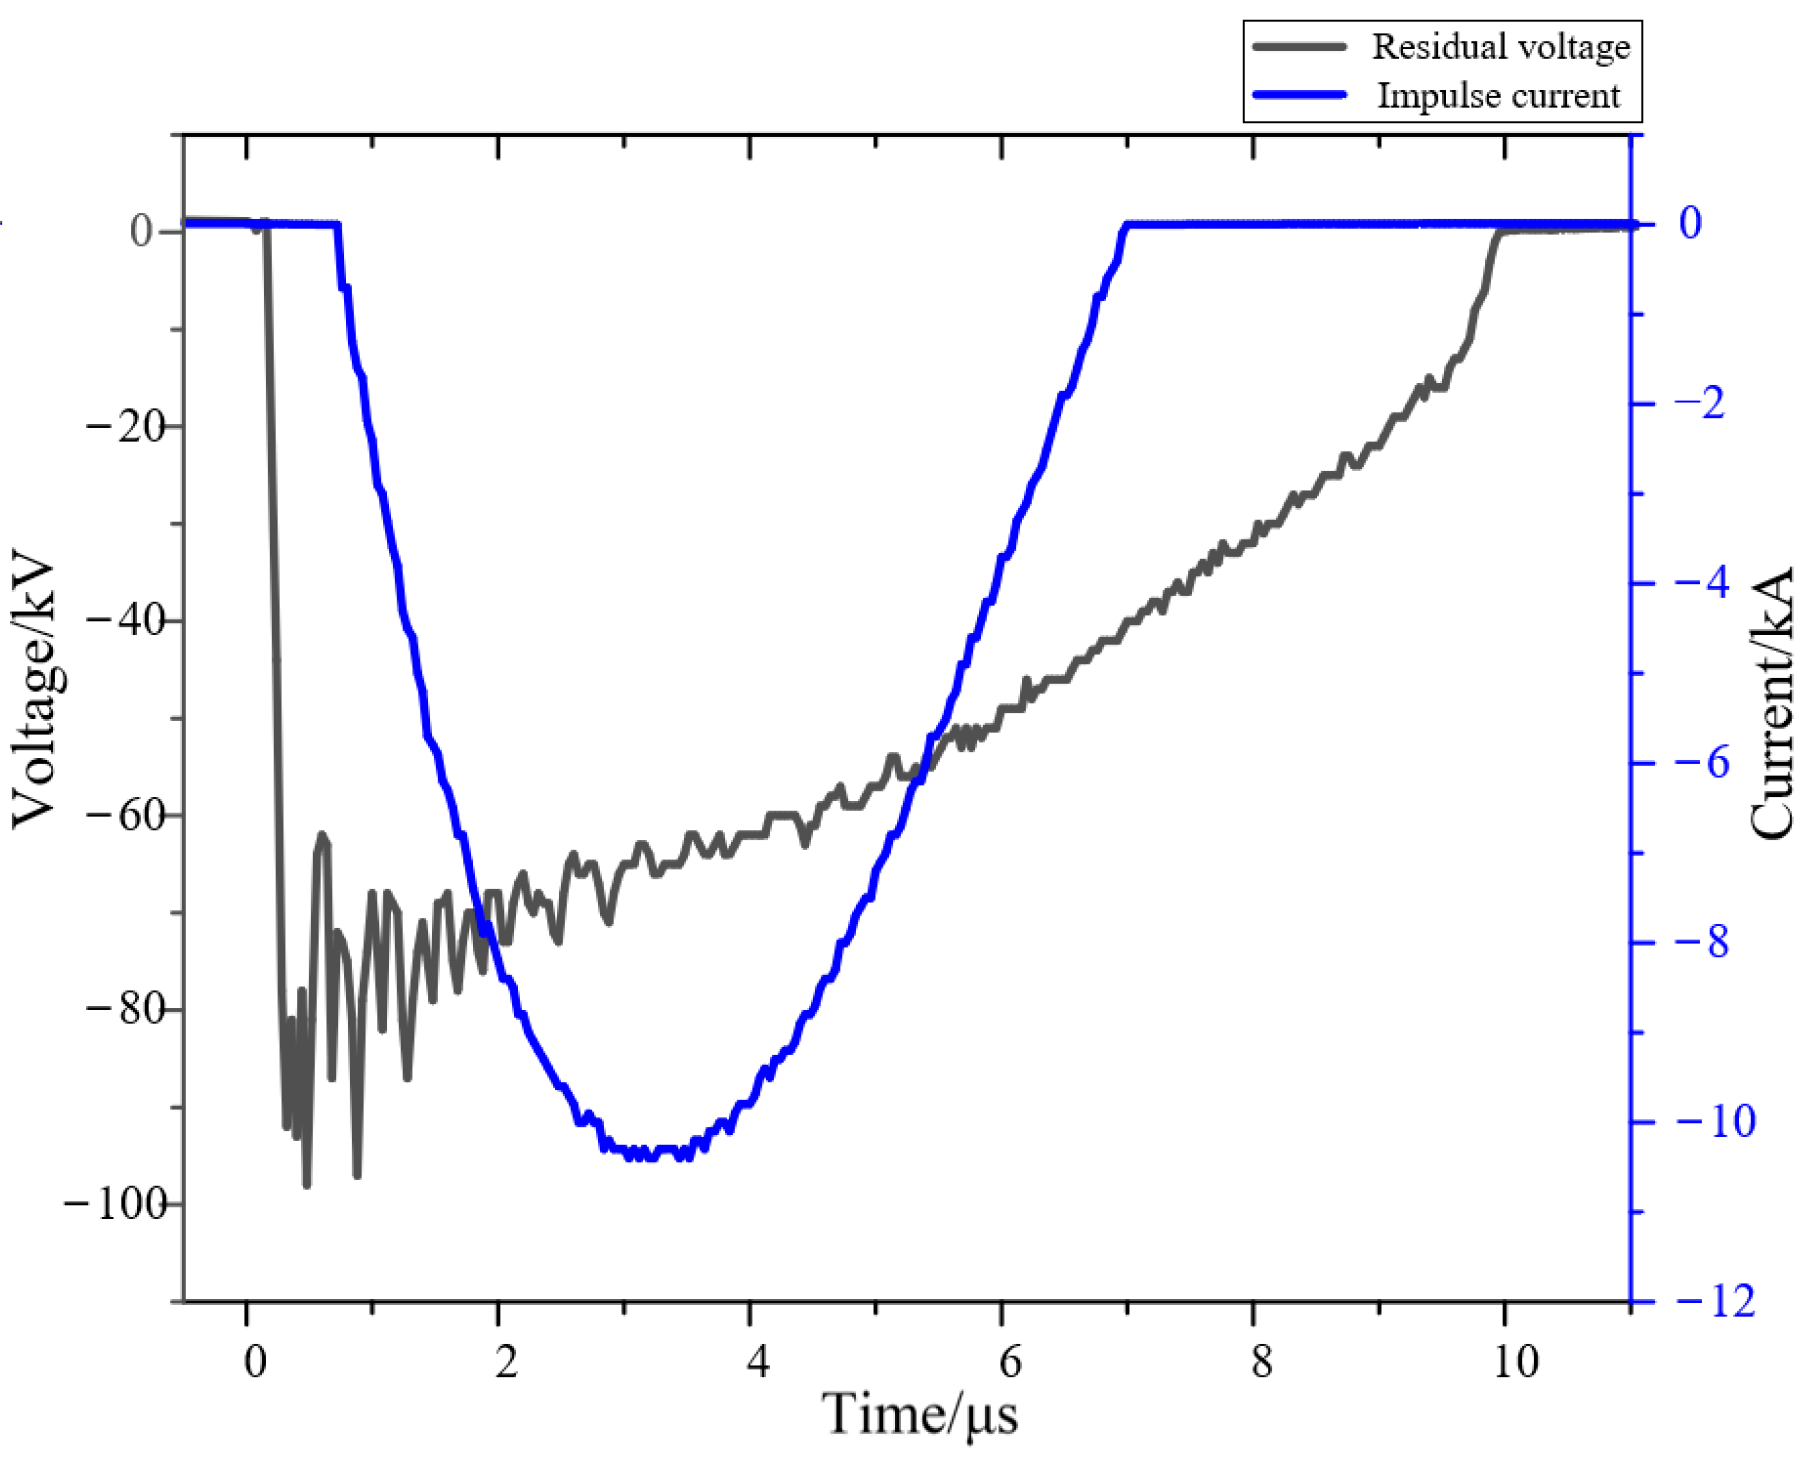
- The temperature rise test under high-current impulse. The impulse current was generated with a 1200 kV impulse voltage generator, which is shown in Figure 4. First, each stage capacitor of the impulse voltage generator was charged in parallel; then, the trigger device sent out an ignition, and the steep impulse current through the arrester can reach 10 kA. The next impulse current test was carried out after an interval of 60 s, with 15 shocks in each group and an interval of 300 s between the two adjacent groups.
2.4. Test Results and Analysis
2.4.1. Temperature Rise Analysis under Continuous Operating Voltage
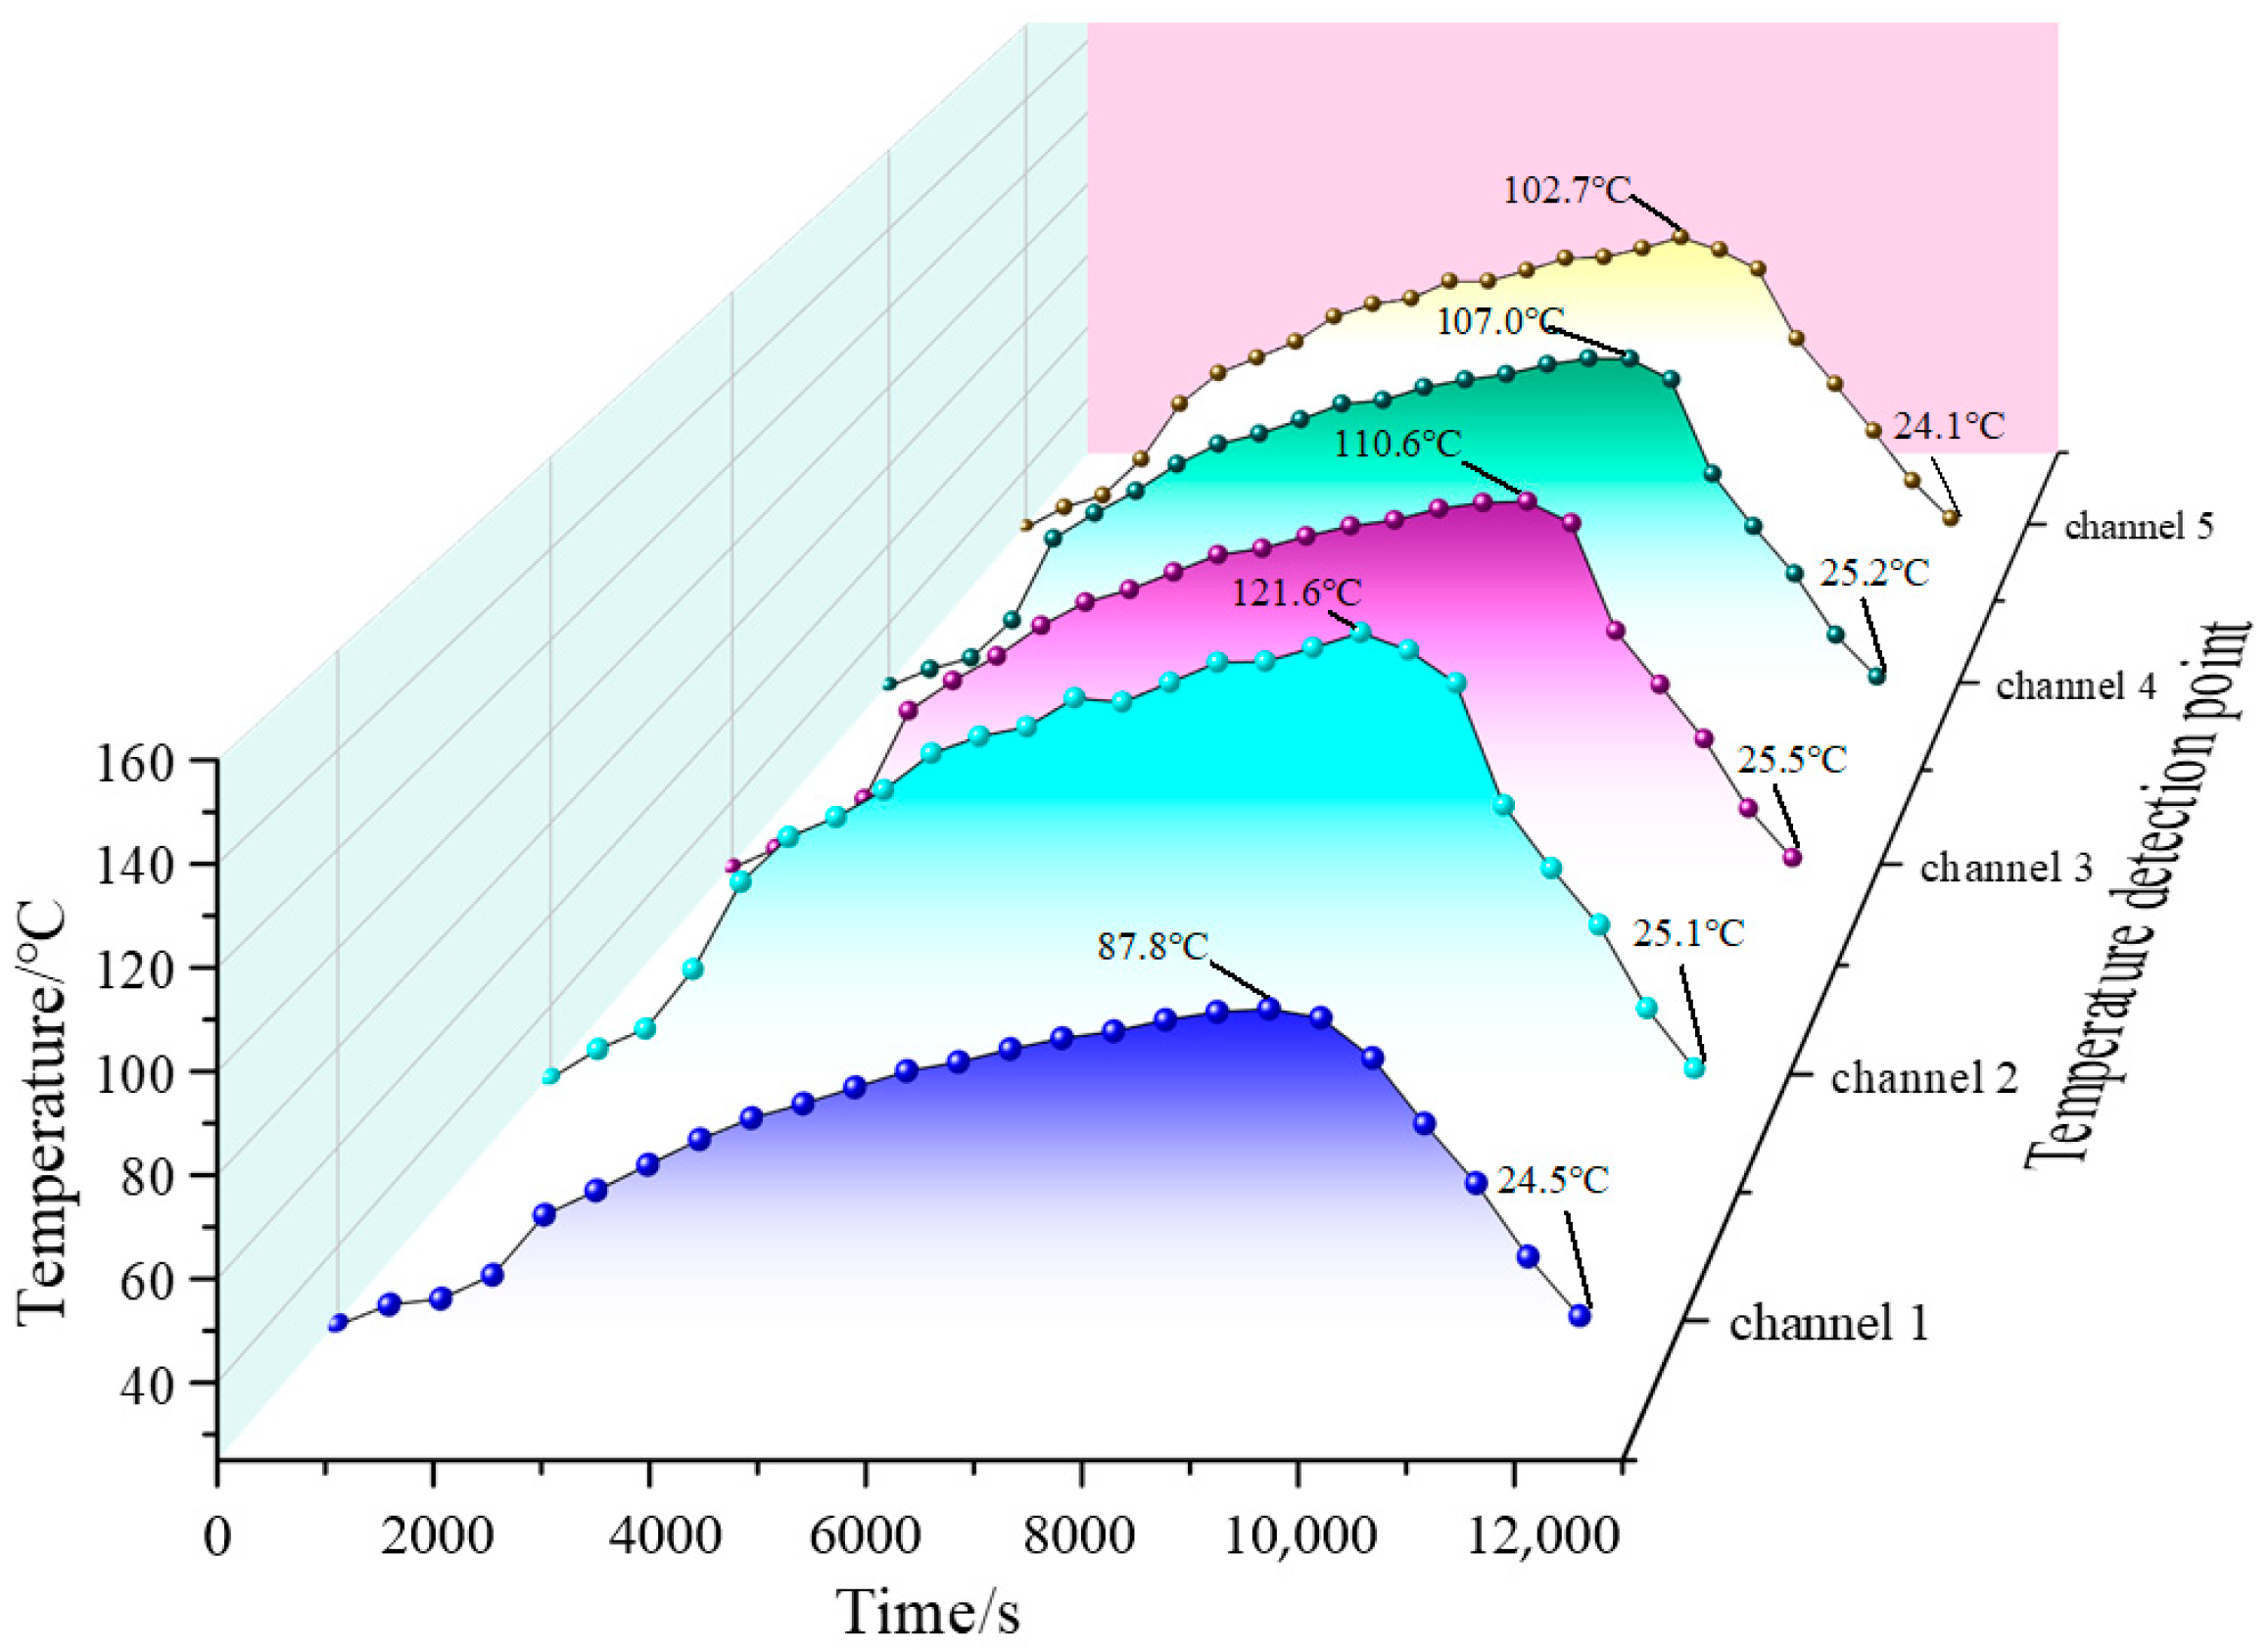
2.4.2. Temperature Rise Analysis under High-Current Impulse
3. Field Overvoltage Waveform Acquisition and Statistics
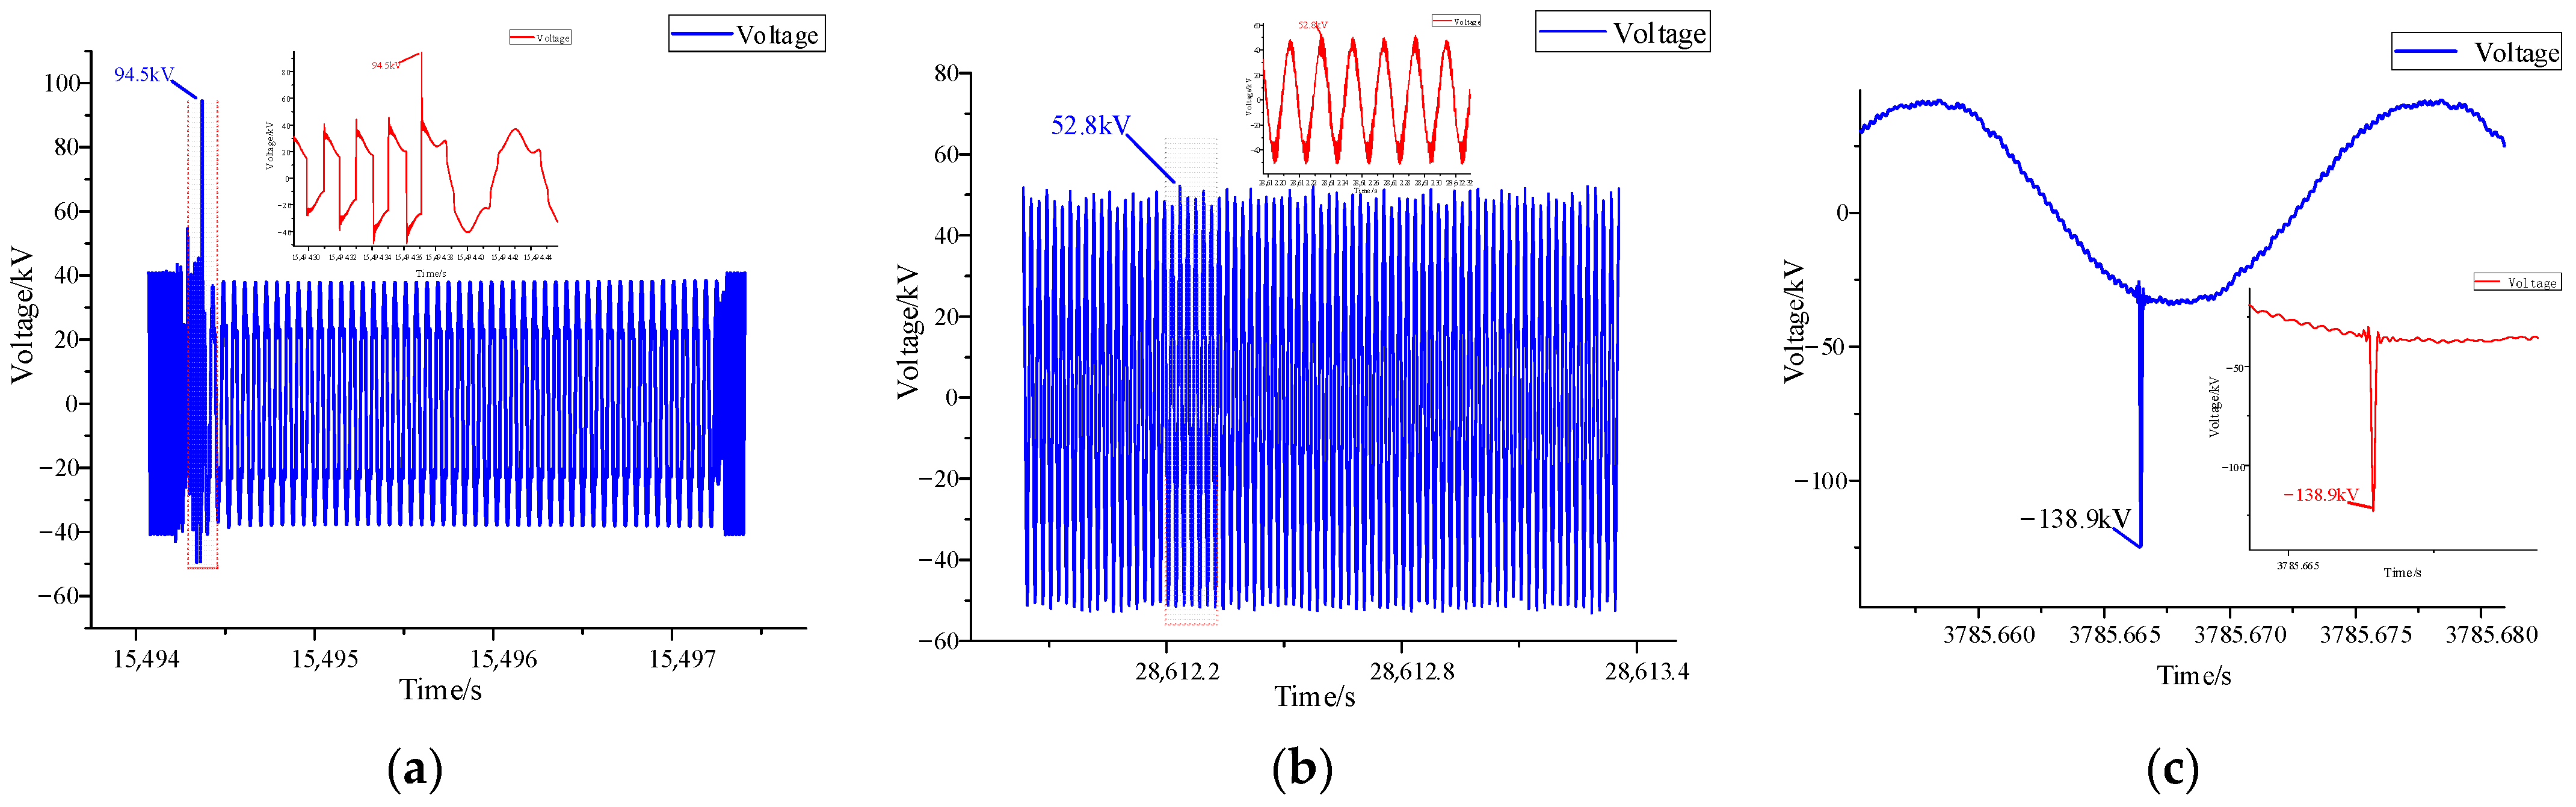
3.1. Field Overvoltage Waveform Acquisition
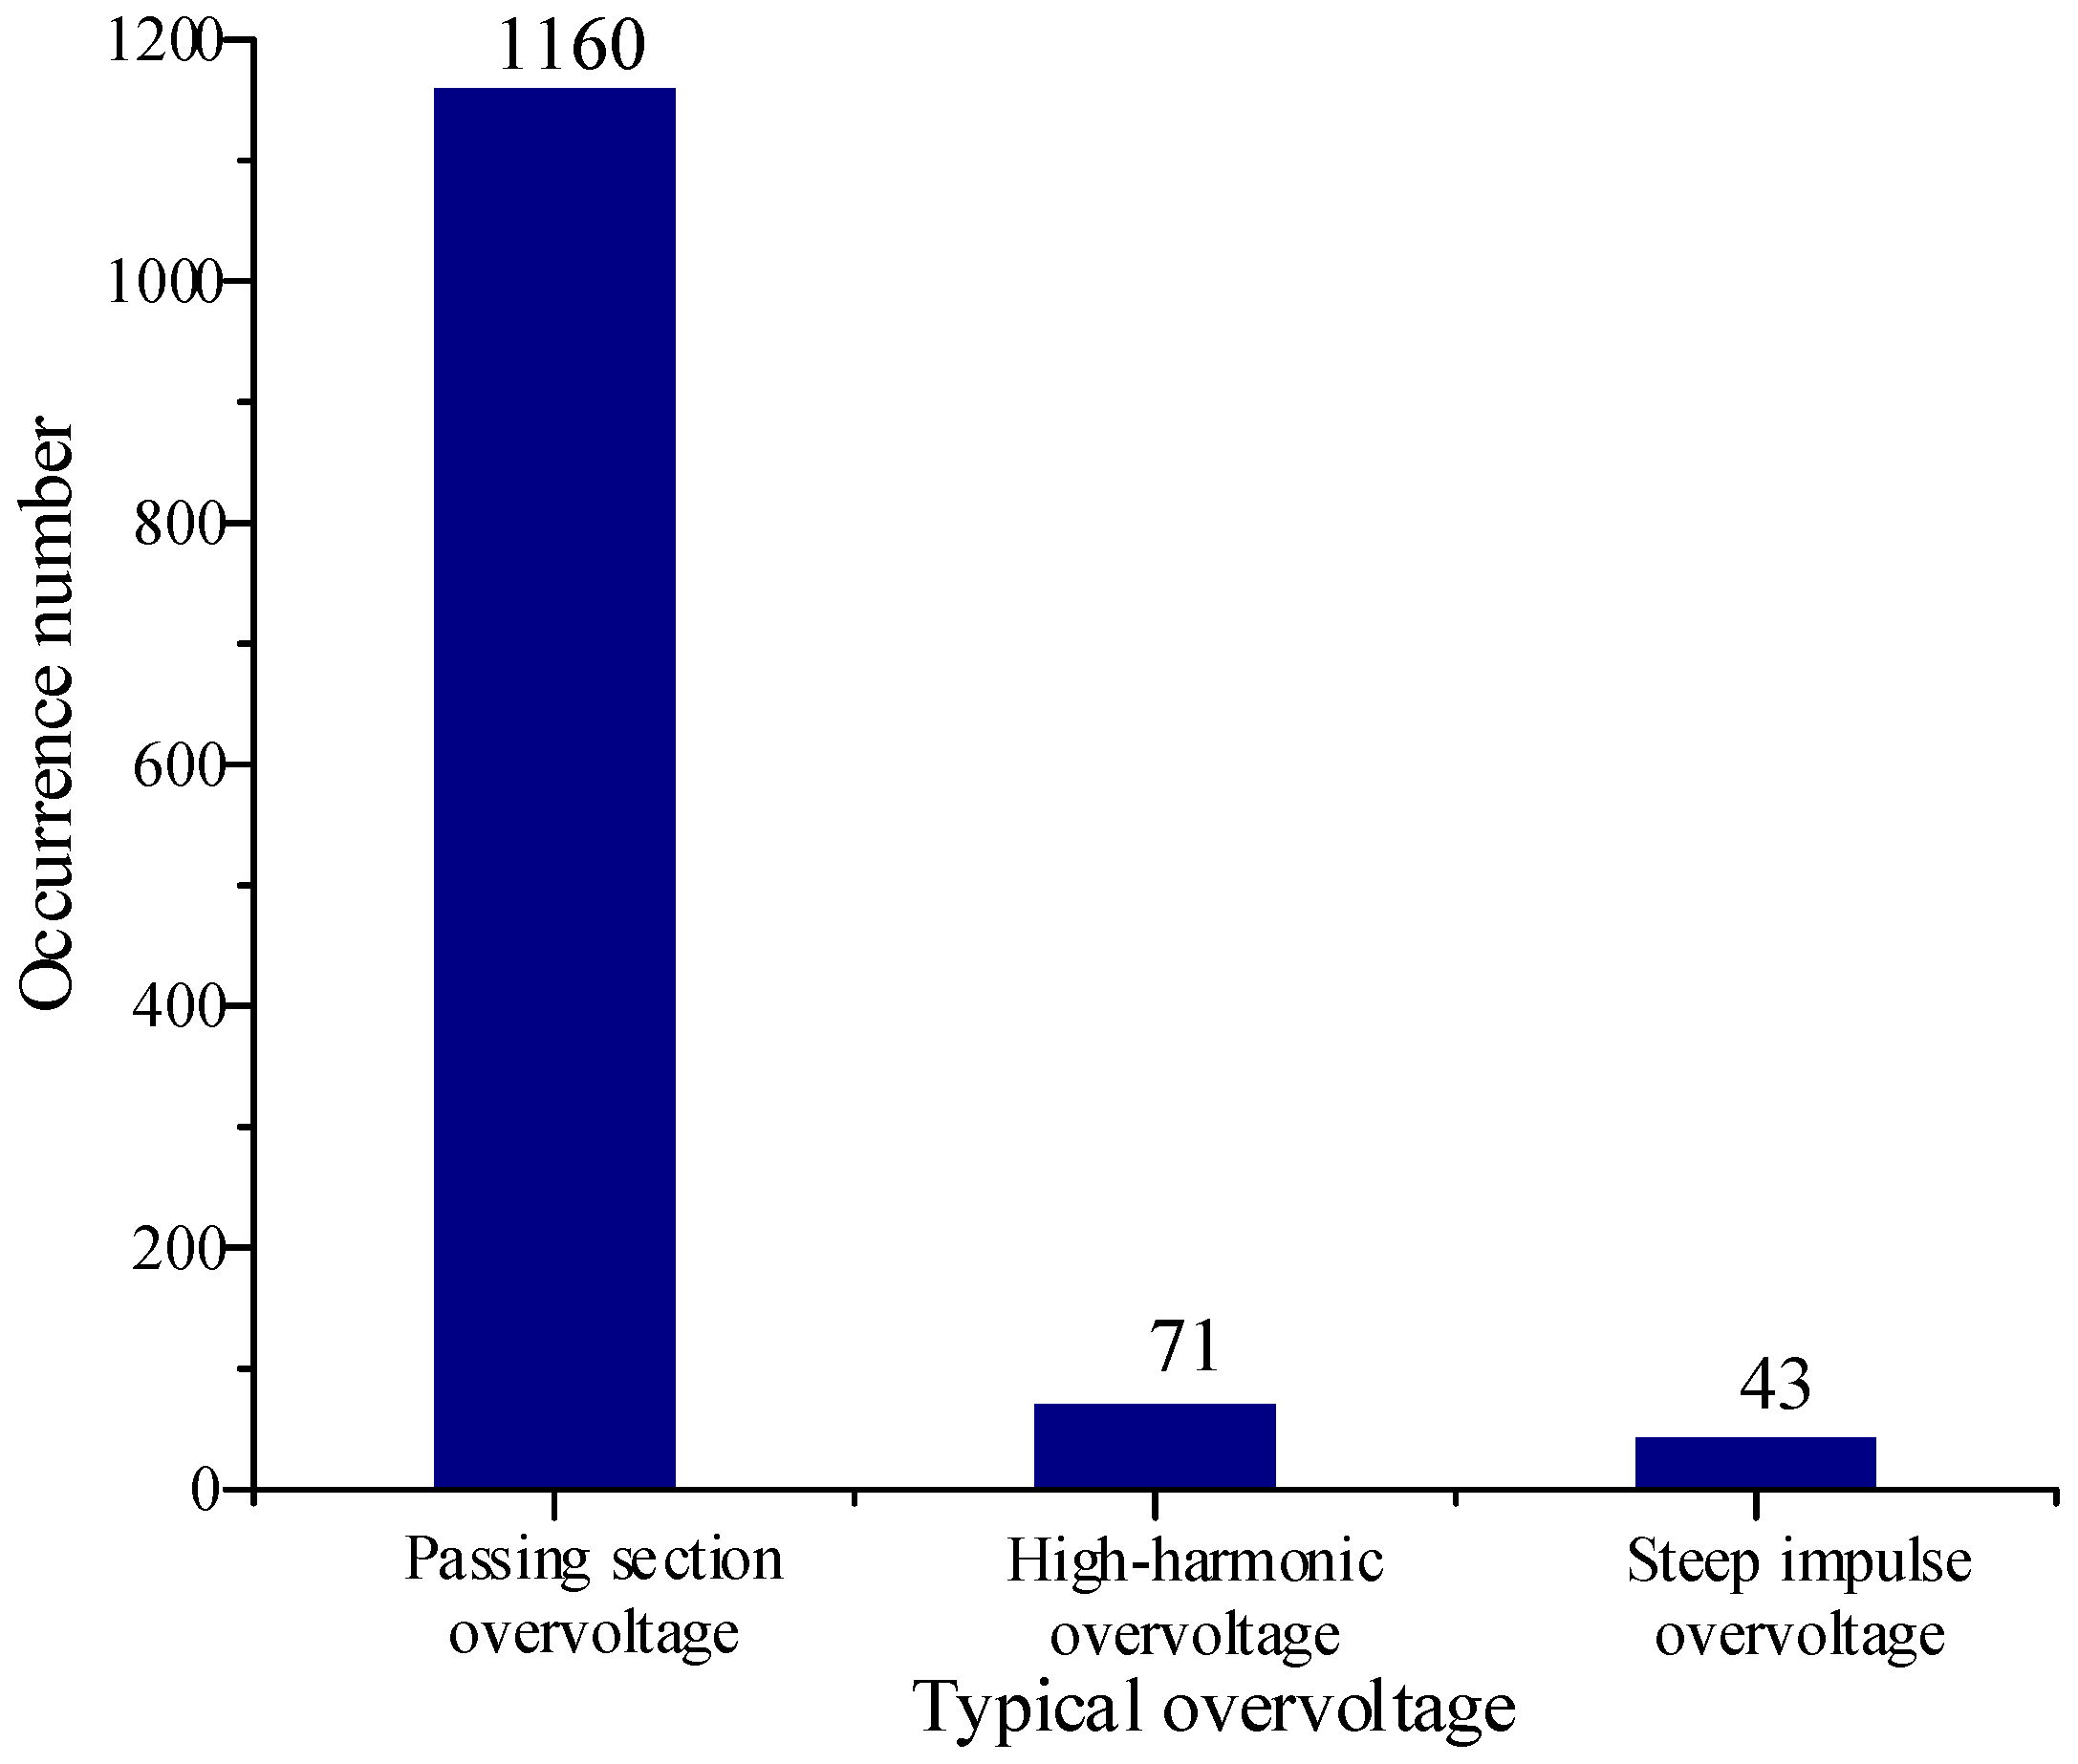
3.2. Statistical Analysis of the Overvoltage Waveform
4. Simulation Research on the Temperature Distribution of the Arrester
4.1. Simulation Model

| Model Composition | Material | Relative Dielectric Constant | Conductivity/(S·m−1) |
|---|---|---|---|
| Umbrella skirt, sheath | Silicone rubber | 2.3 | 1.0 × 10⁻⁸ |
| The internal air gap of the arrester | Air | 1.0 | 1.0 × 10⁻¹² |
| Flange | Iron | 1.0 × 10⁶ | 1.1 × 10⁷ |
| Spring locating block | Aluminum | 1.0 × 10⁶ | 3.8 × 10⁷ |
| Valve plate | Zinc oxide | 420 | As shown in Table 3 |
| Insulation cylinder | Epoxy resin | 4.0 | 1.0 × 10⁻⁸ |
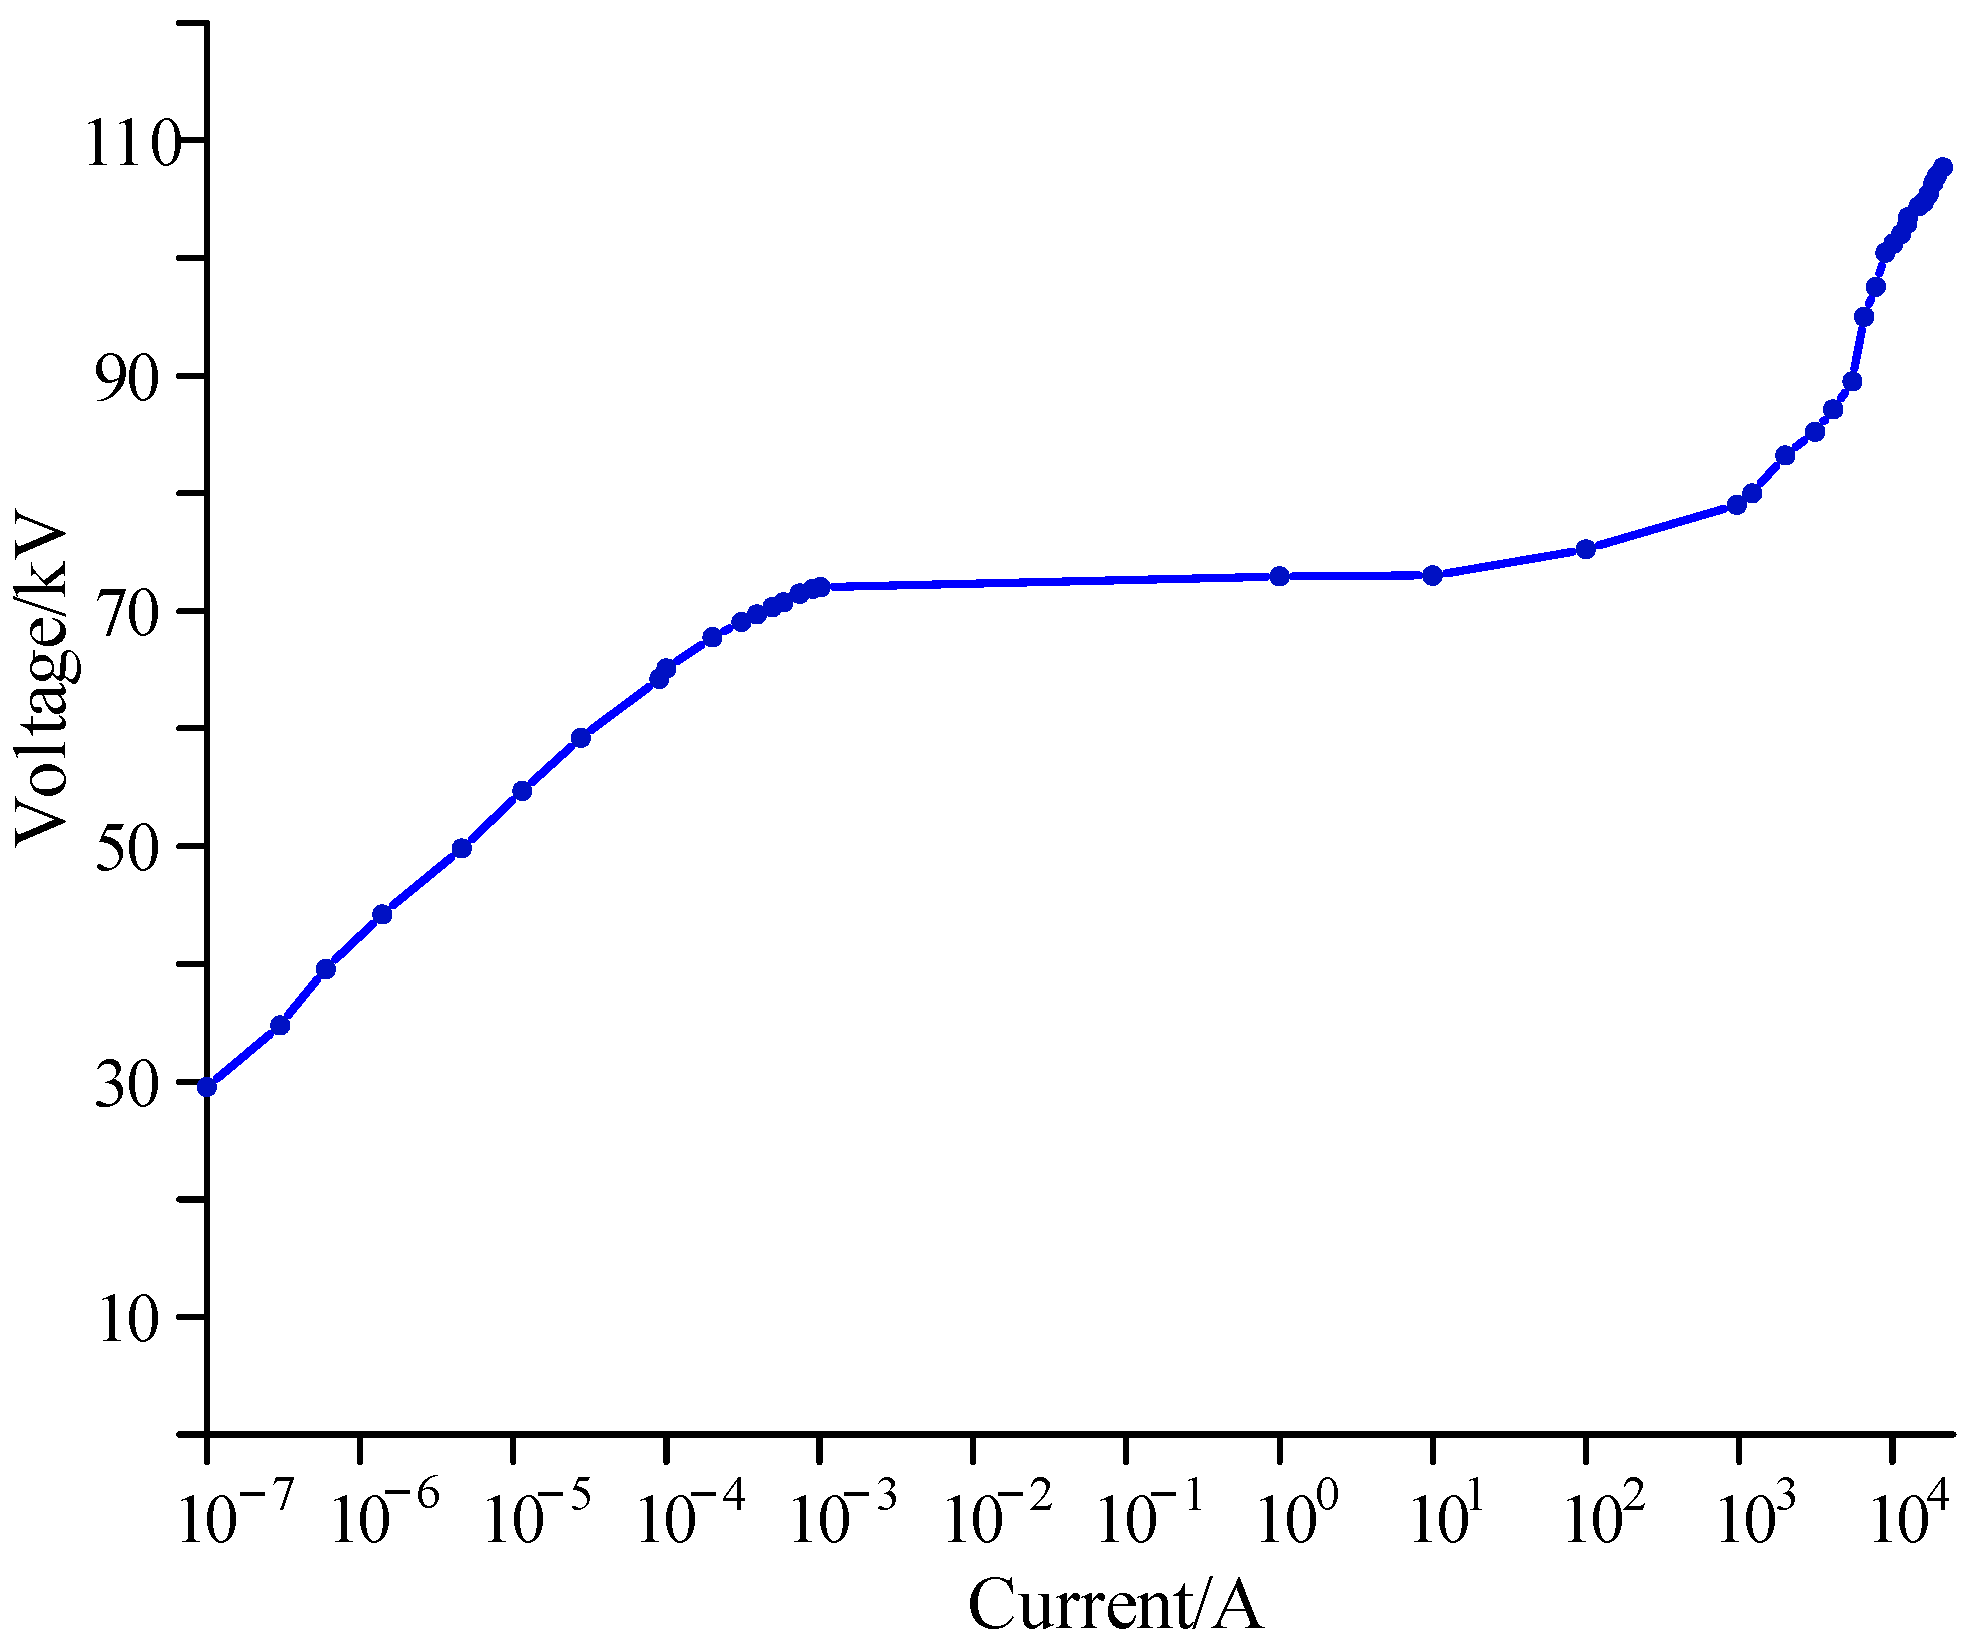
| Voltage/V | Current/A | Conductivity/(S·m−1) |
|---|---|---|
| 2.58 × 10⁴ | 3 × 10⁻⁷ | 1.6 × 10⁻⁹ |
| 4.08 × 10⁴ | 4.6 × 10⁻⁶ | 1.55 × 10⁻⁸ |
| 5.52 × 10⁴ | 9.01 × 10⁻⁵ | 1.25 × 10⁻⁷ |
| 6.25 × 10⁴ | 7.4 × 10⁻⁴ | 1.63 × 10⁻⁶ |
| 6.3 × 10⁴ | 1.01 × 10⁻³ | 2.21 × 10⁻⁶ |
| 8.39 × 10⁴ | 2.0 × 10³ | 3.28 |
| 1.01 × 10⁵ | 1.01 × 10⁴ | 32.46 |
4.2. Calculation of the Nonlinear Conductivity of Zinc Oxide
4.3. Electrothermal Coupling Calculation Method
4.3.1. Governing Equations and Boundary Conditions
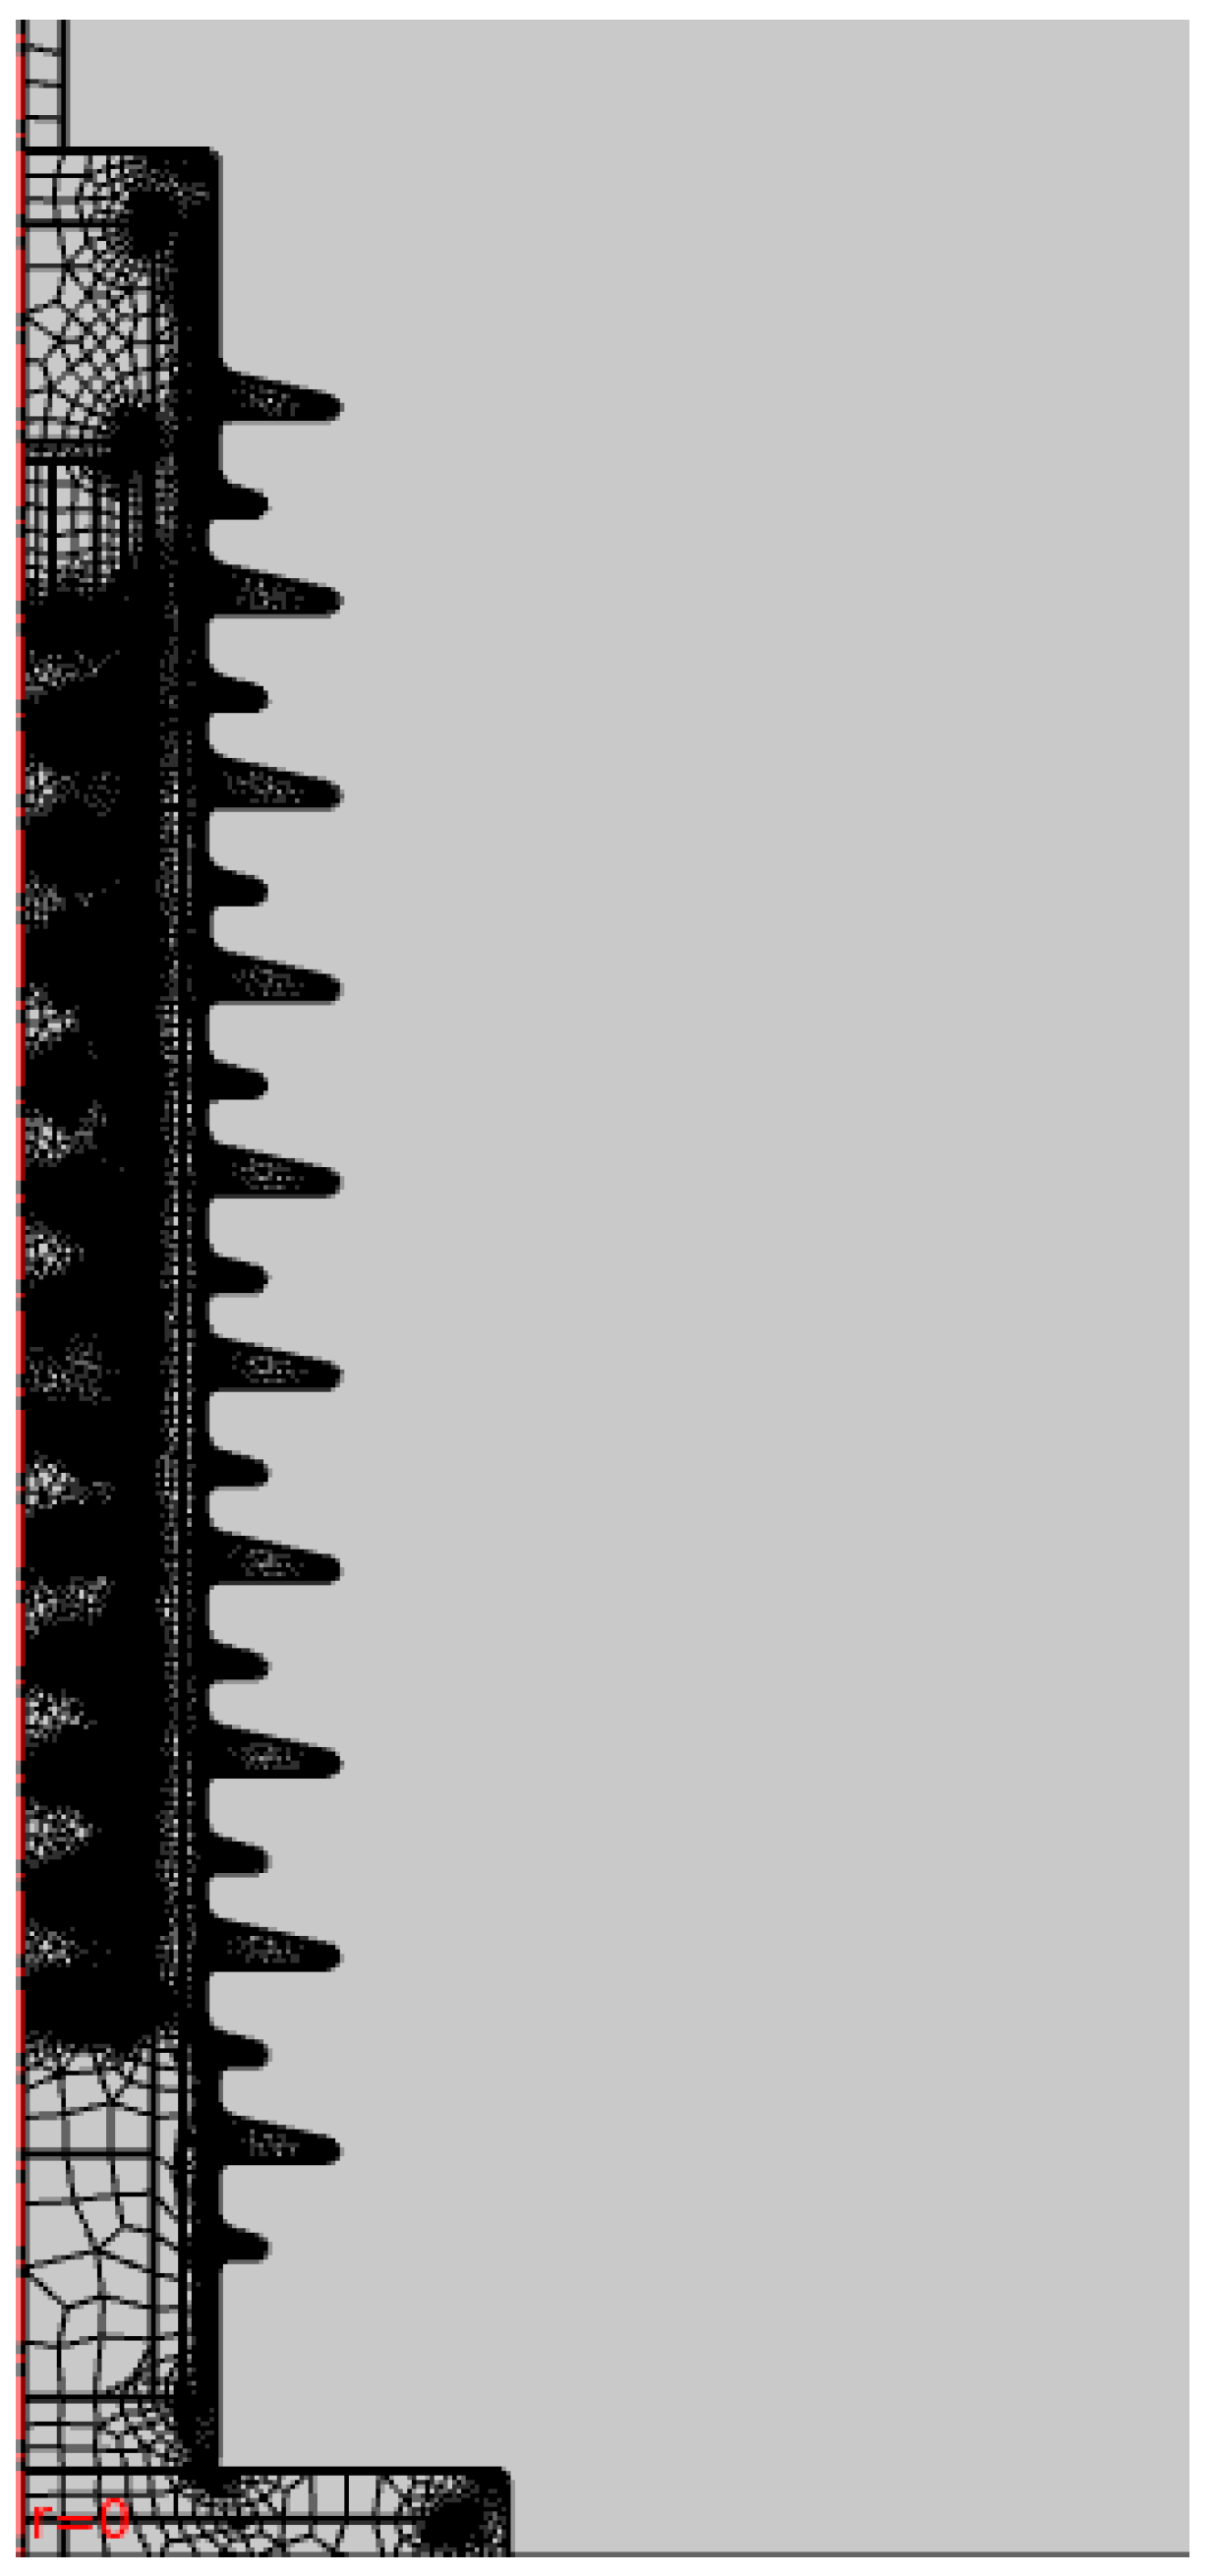
4.3.2. Meshing of the Simulation Model
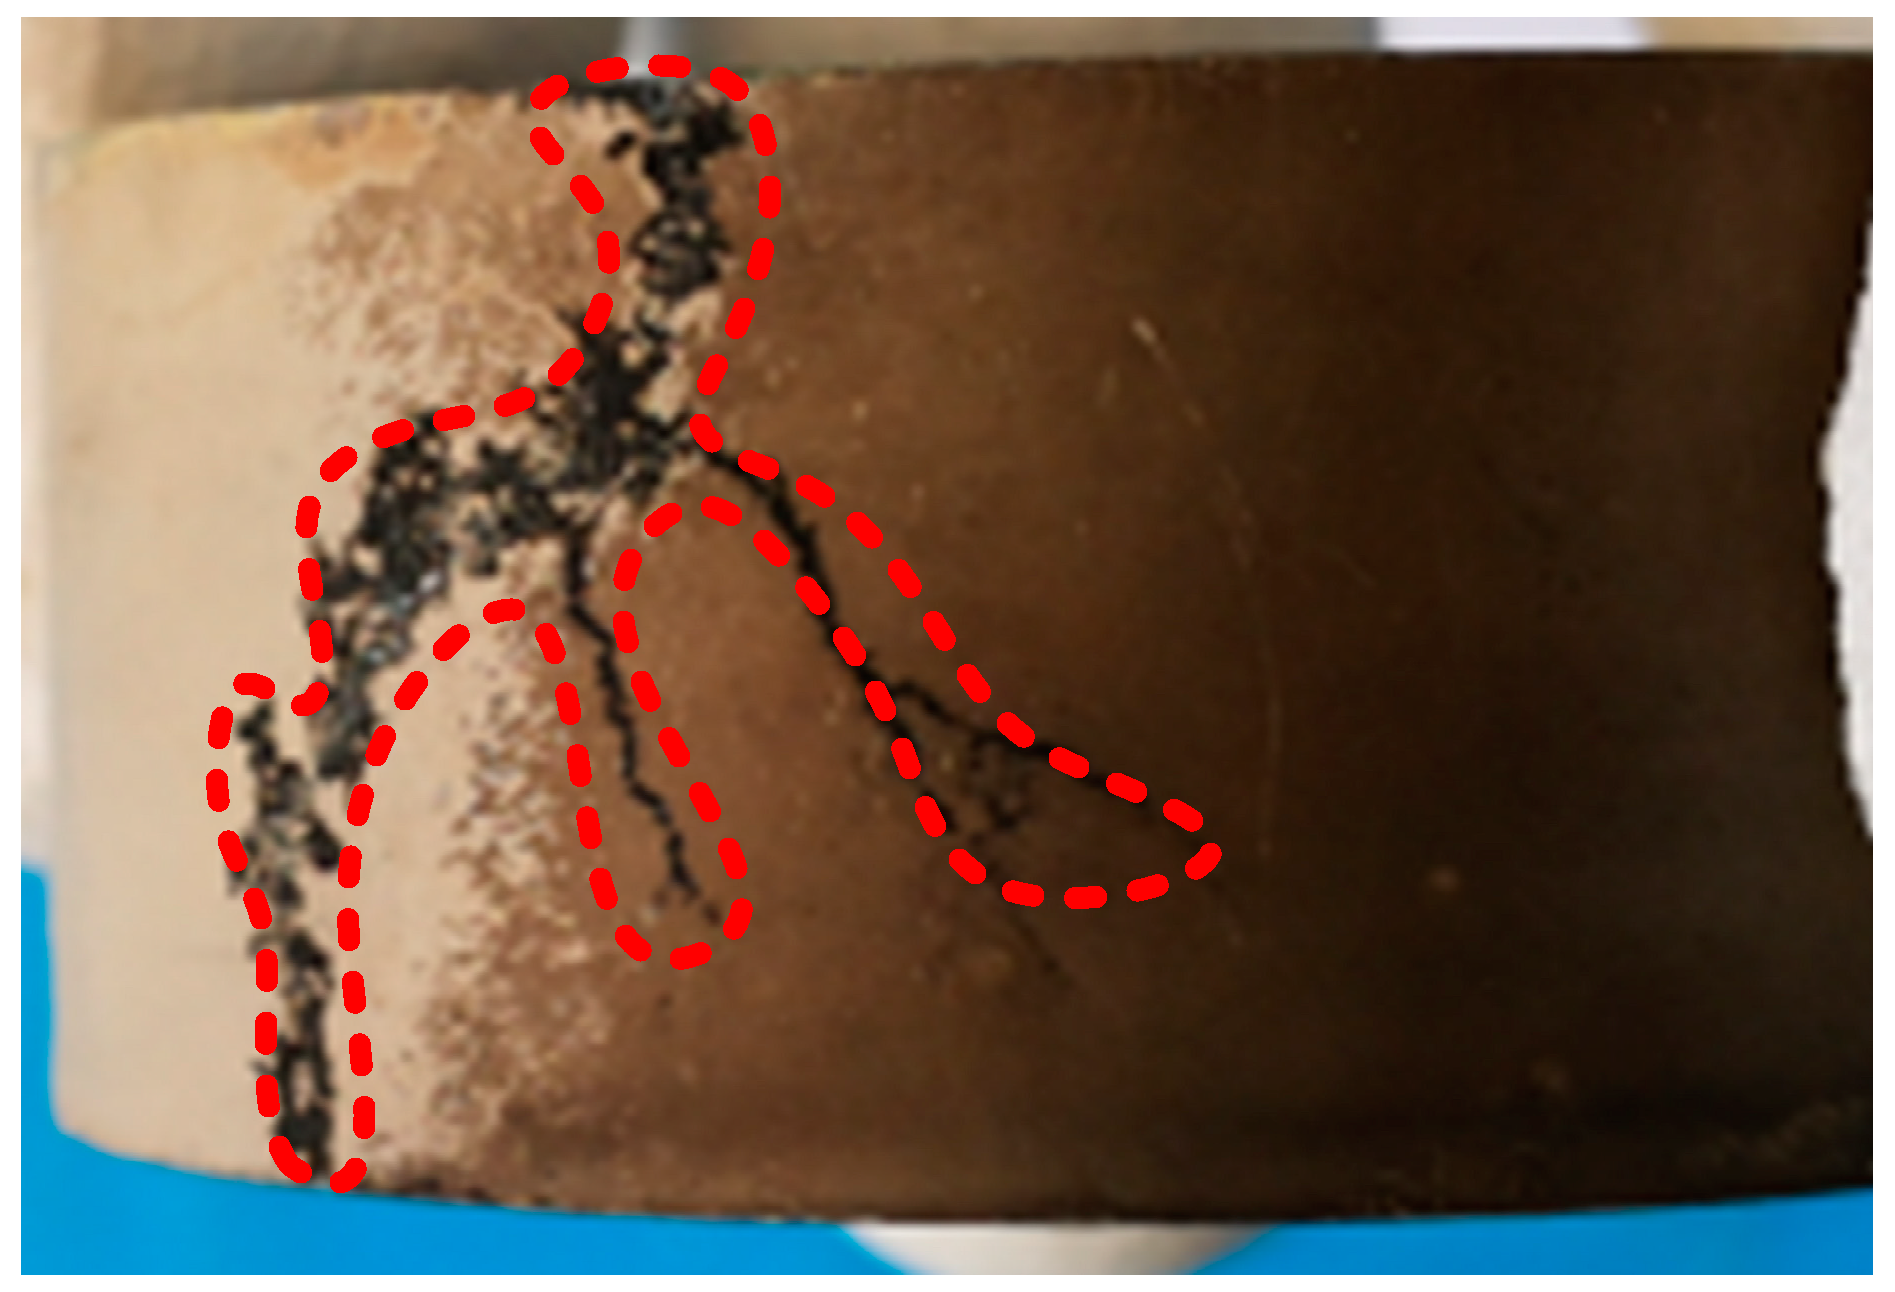
4.4. Electric Tree Defect Setting
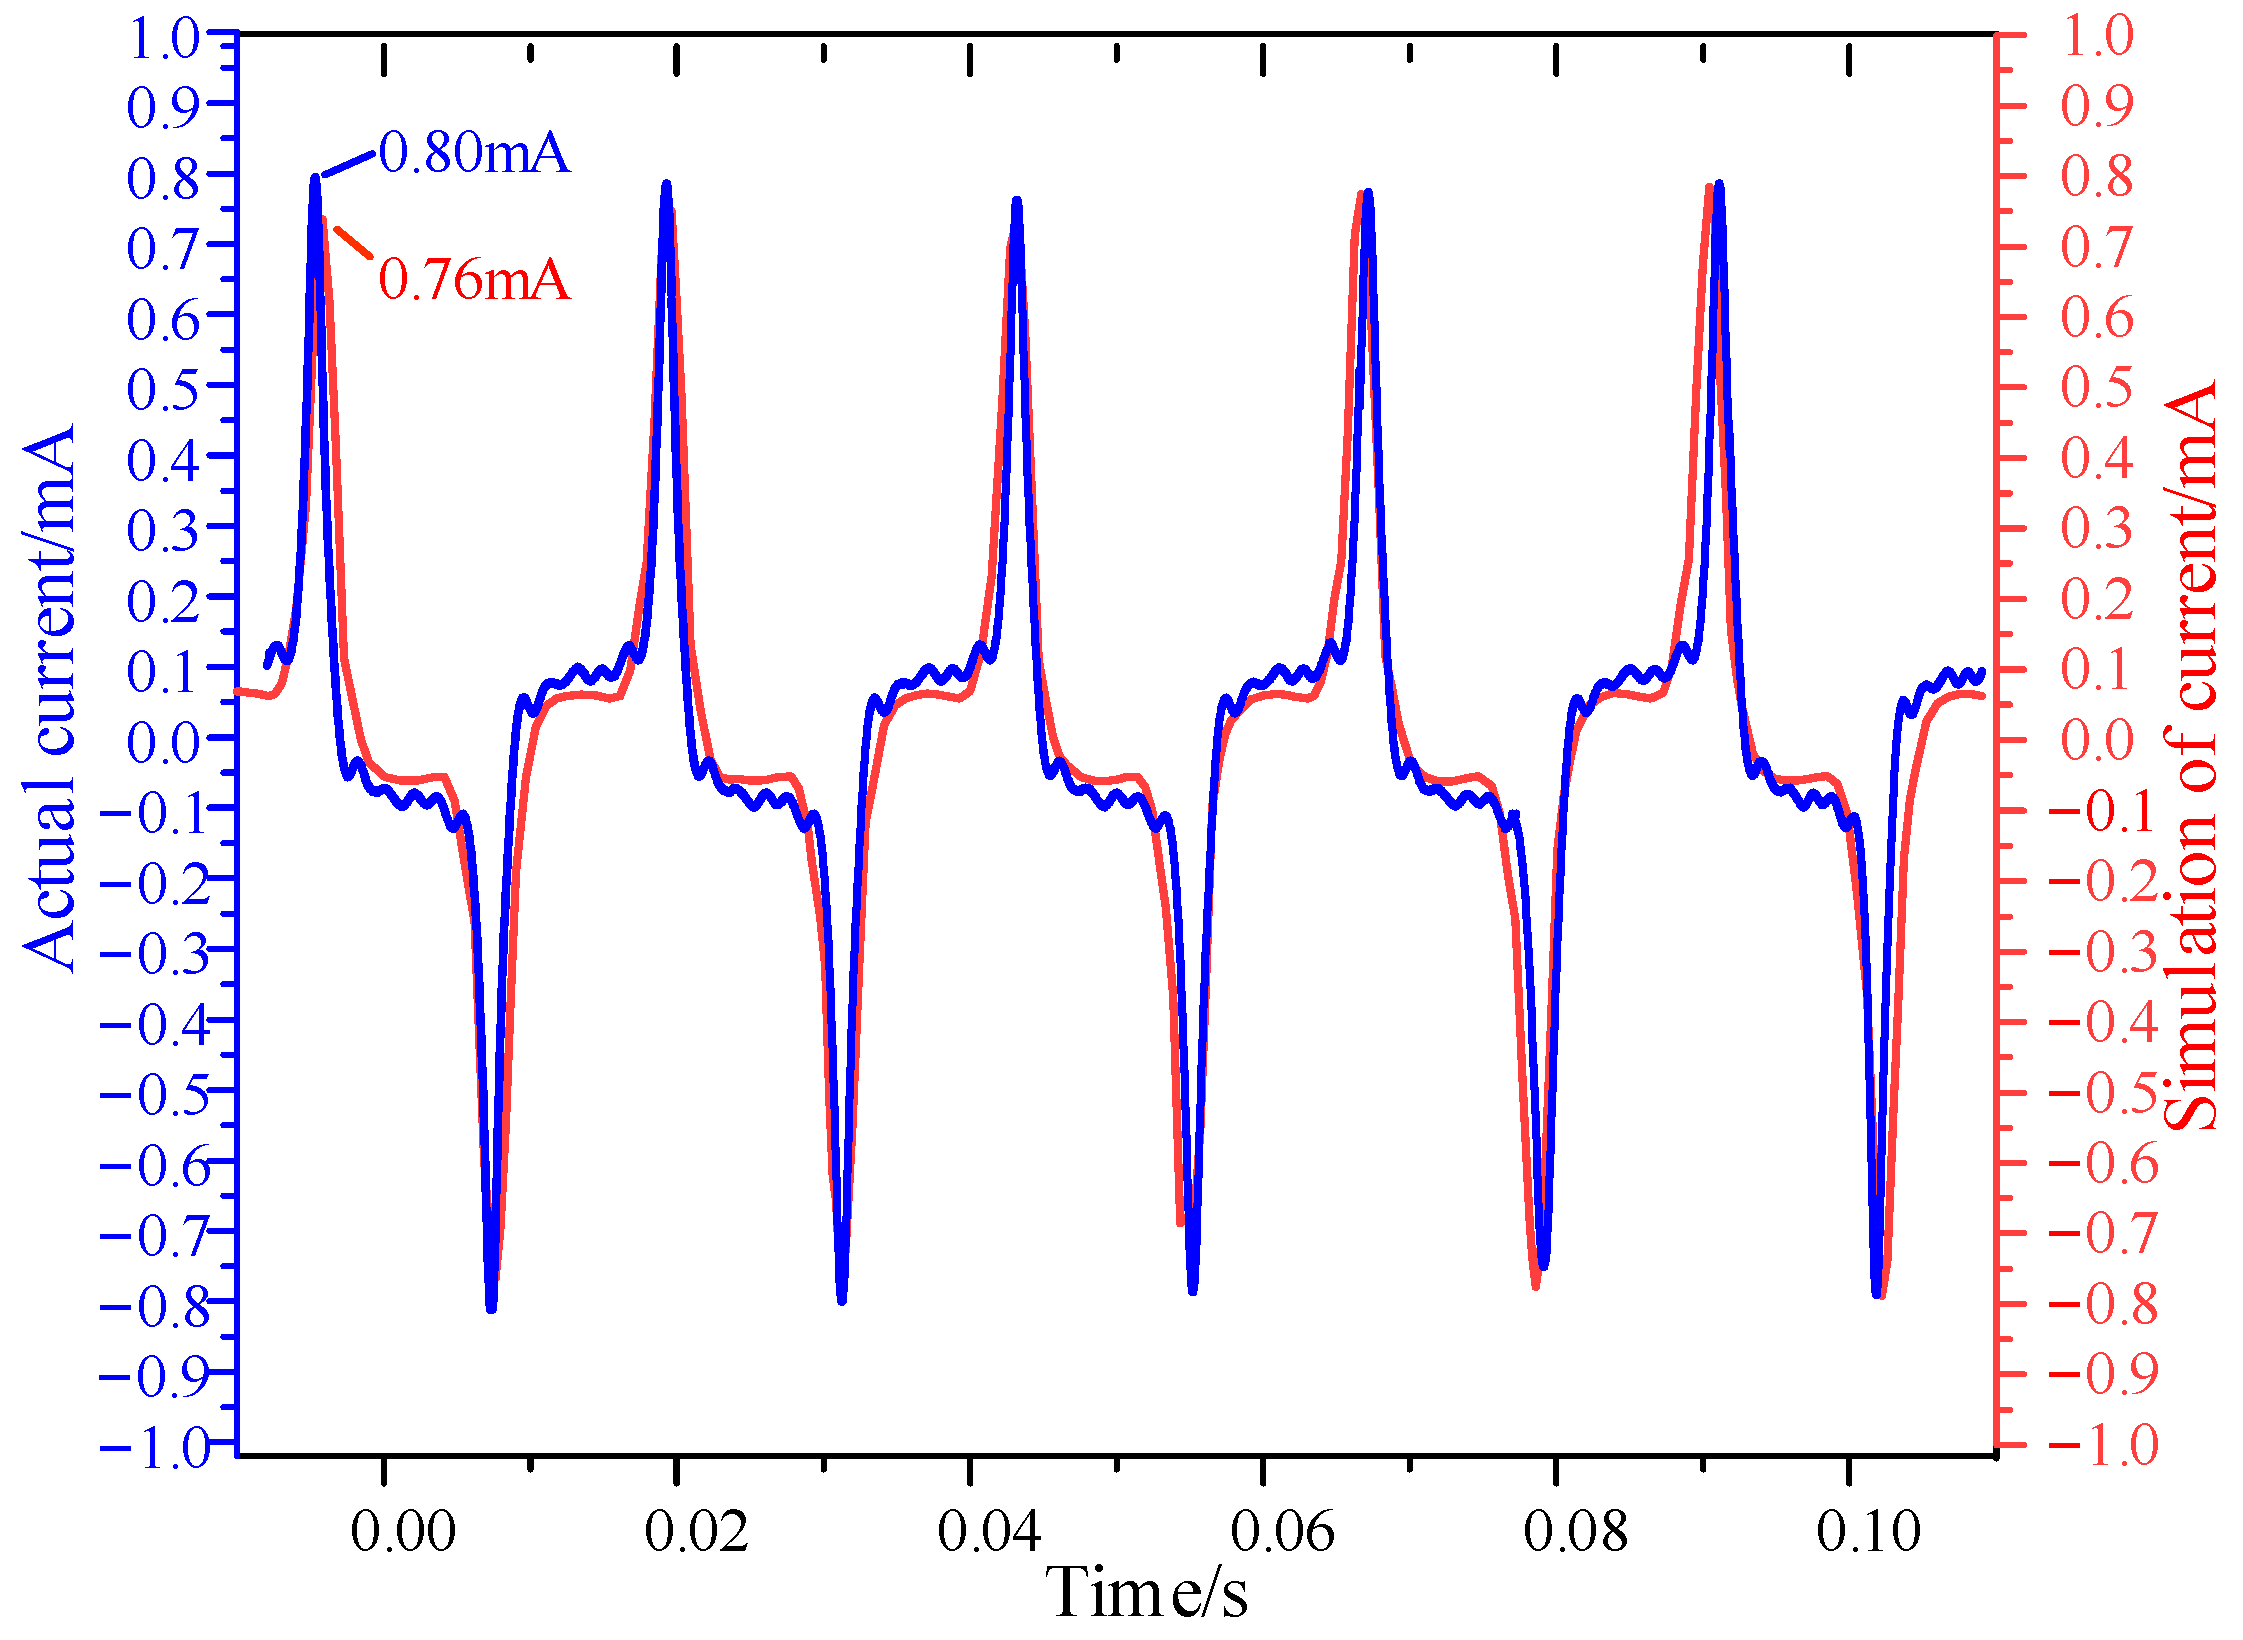
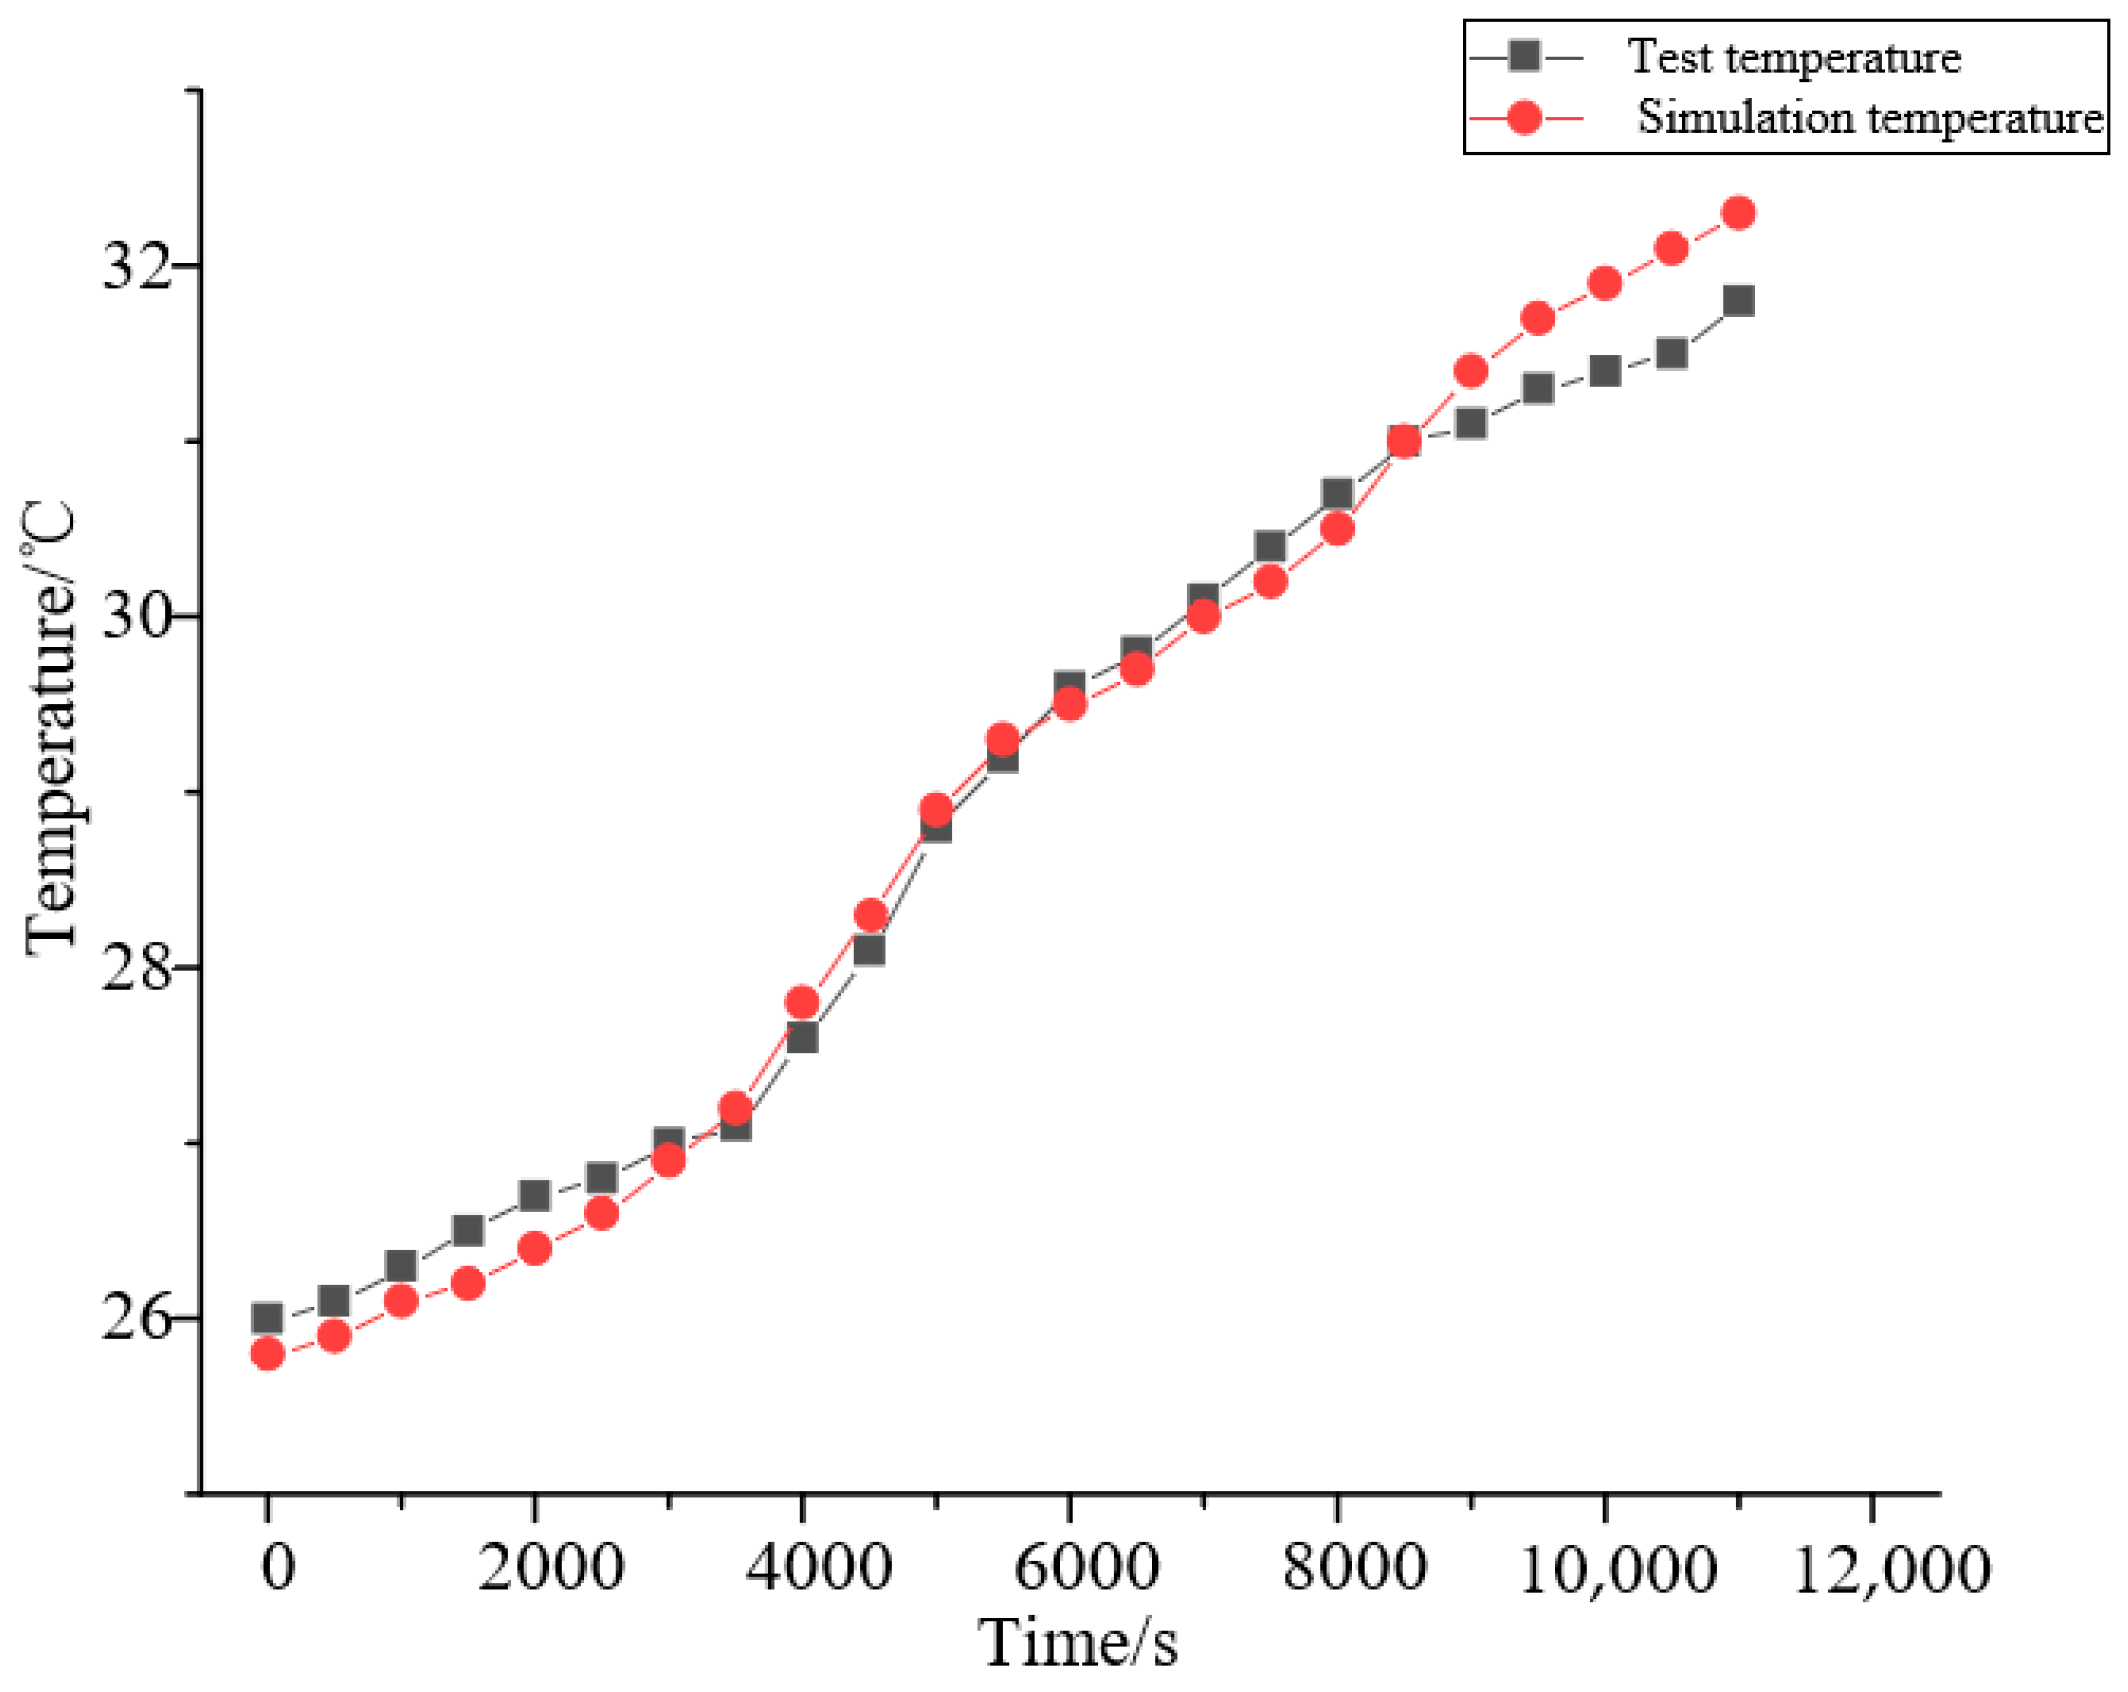
4.5. Validation of the Model
4.6. The Temperature Characteristics of the Arrester under Typical Overvoltage
4.6.1. Passing Section Overvoltage
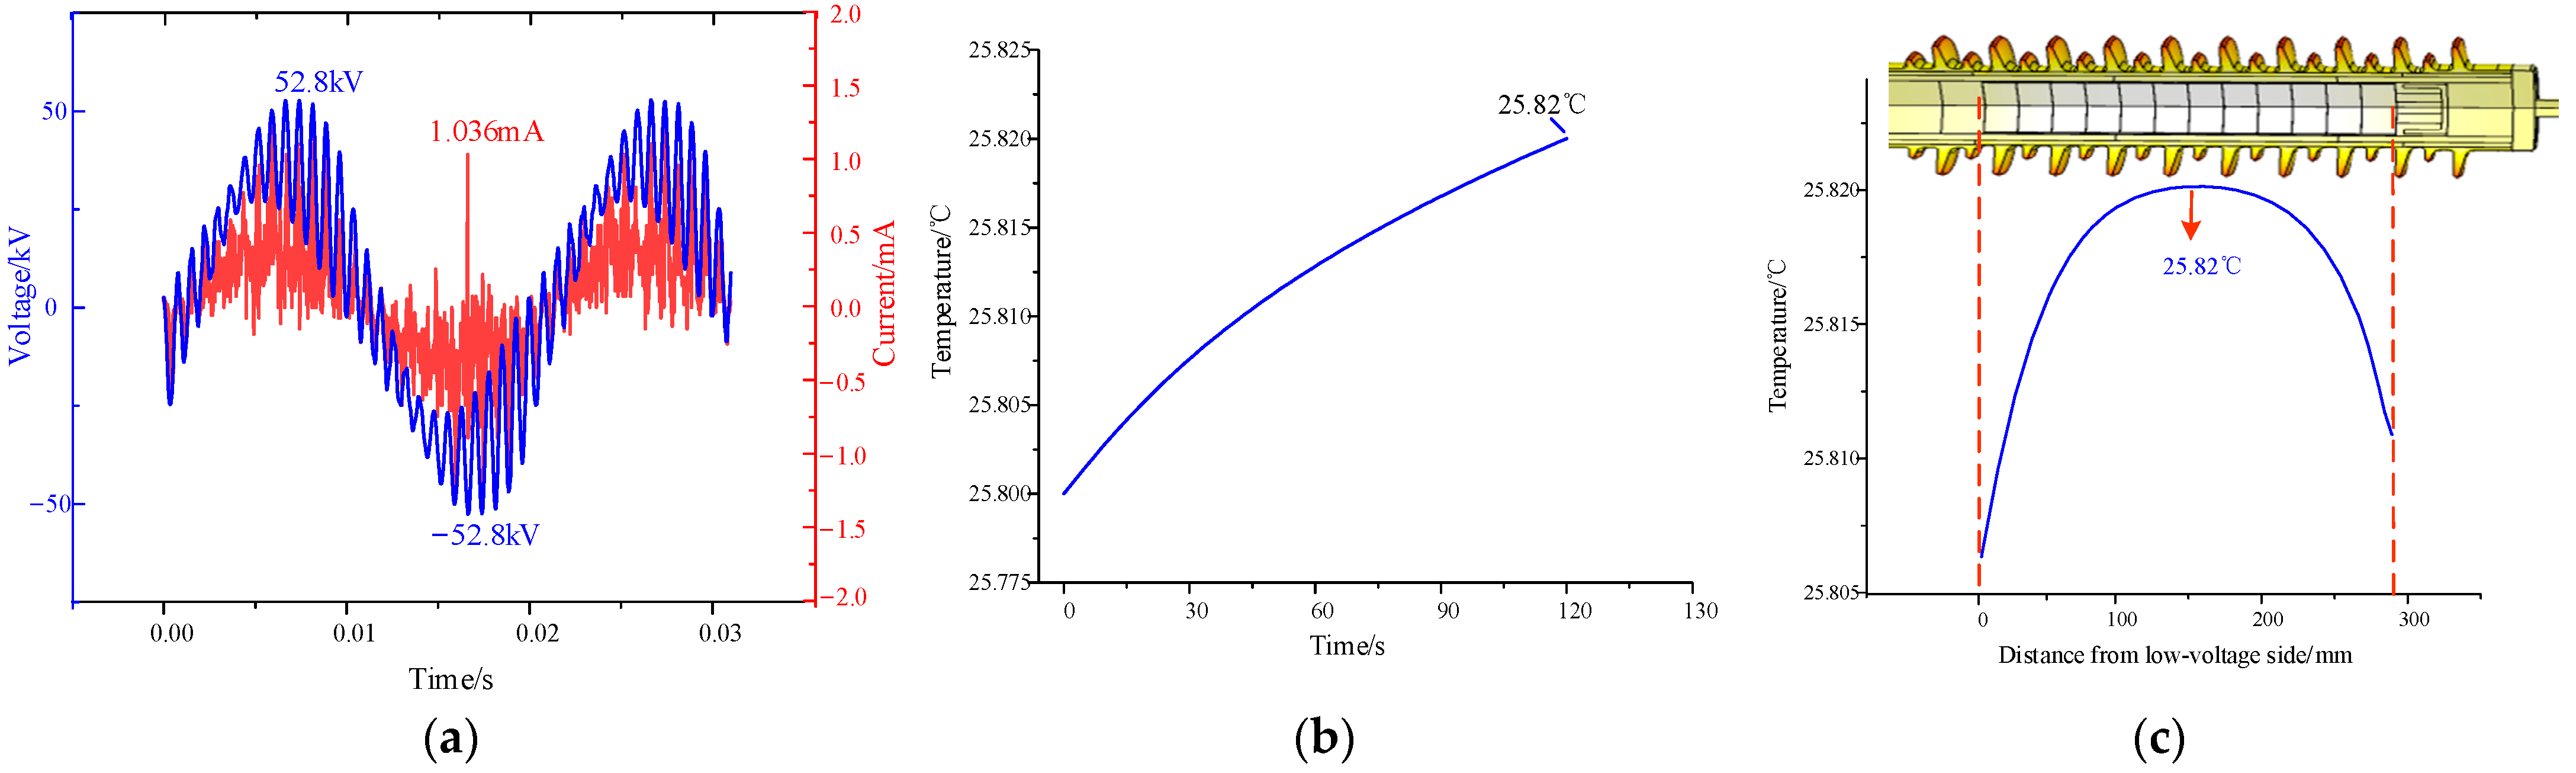
4.6.2. High-Harmonic Overvoltage
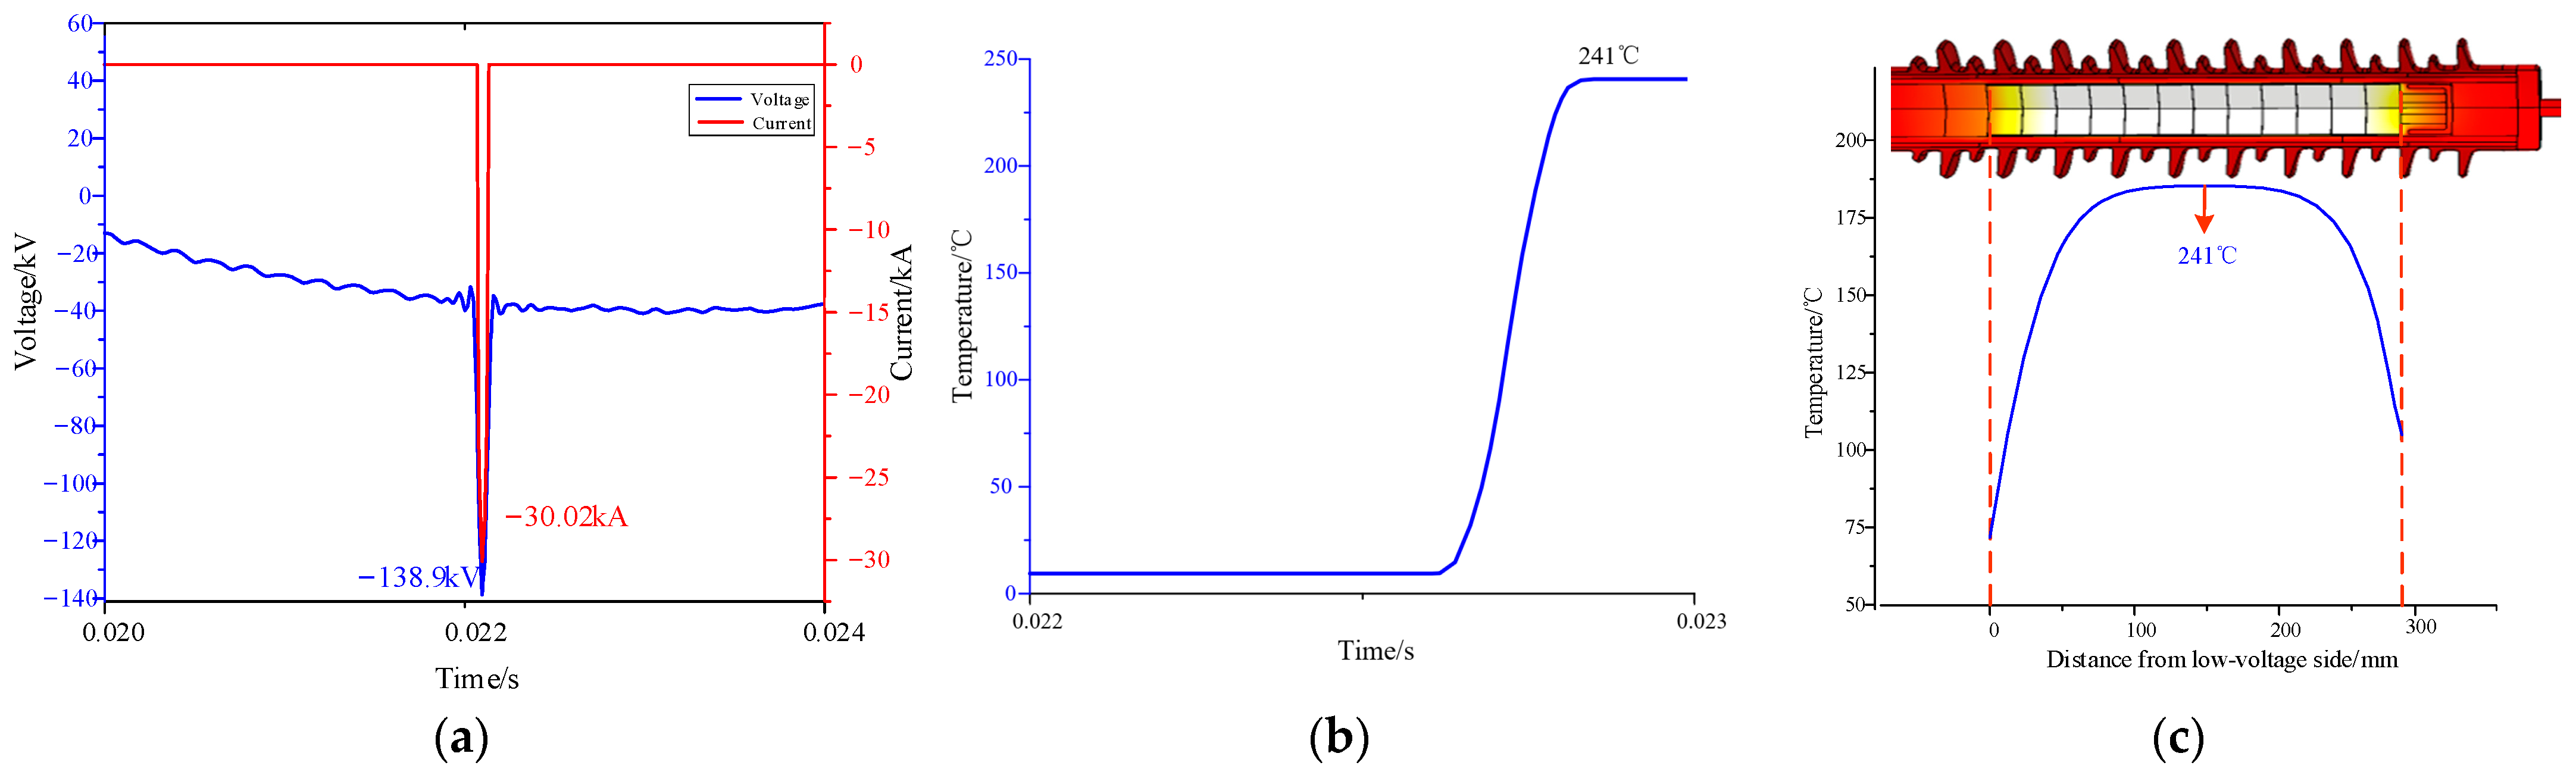
4.6.3. Steep Impulse Overvoltage
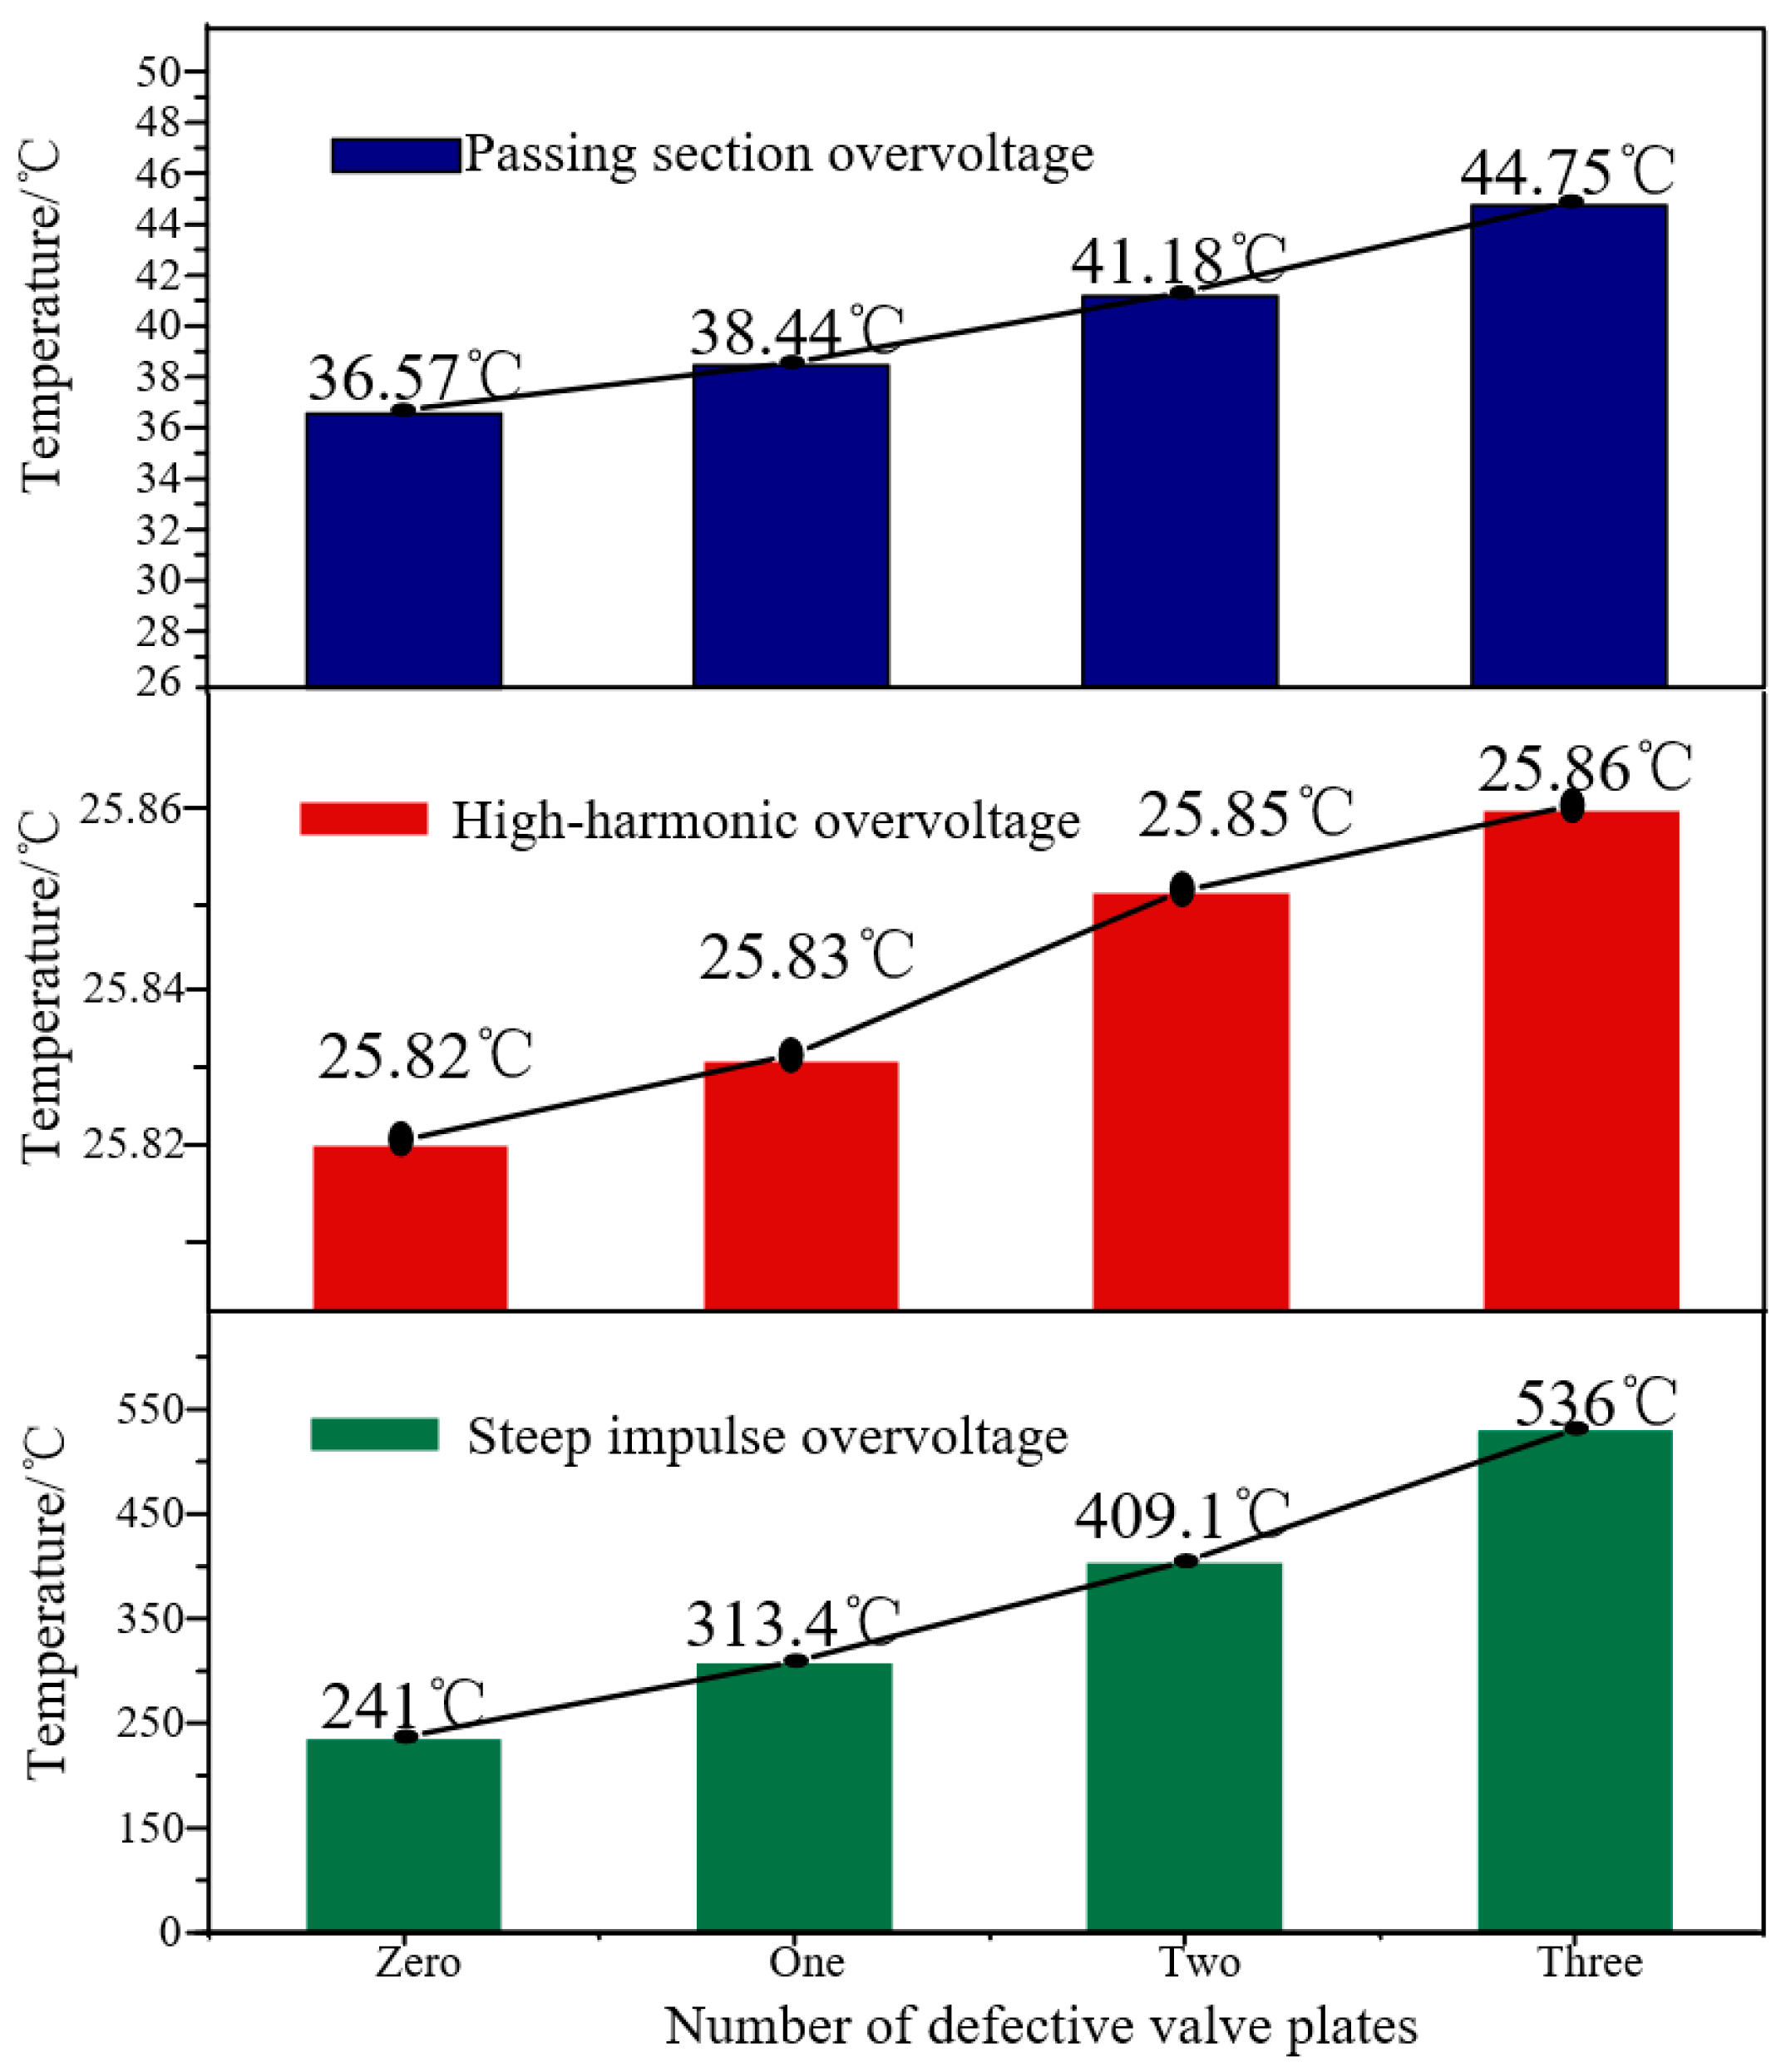
4.7. Influence of the Defective Valve Plate Number on the Temperature Distribution of the Arrester
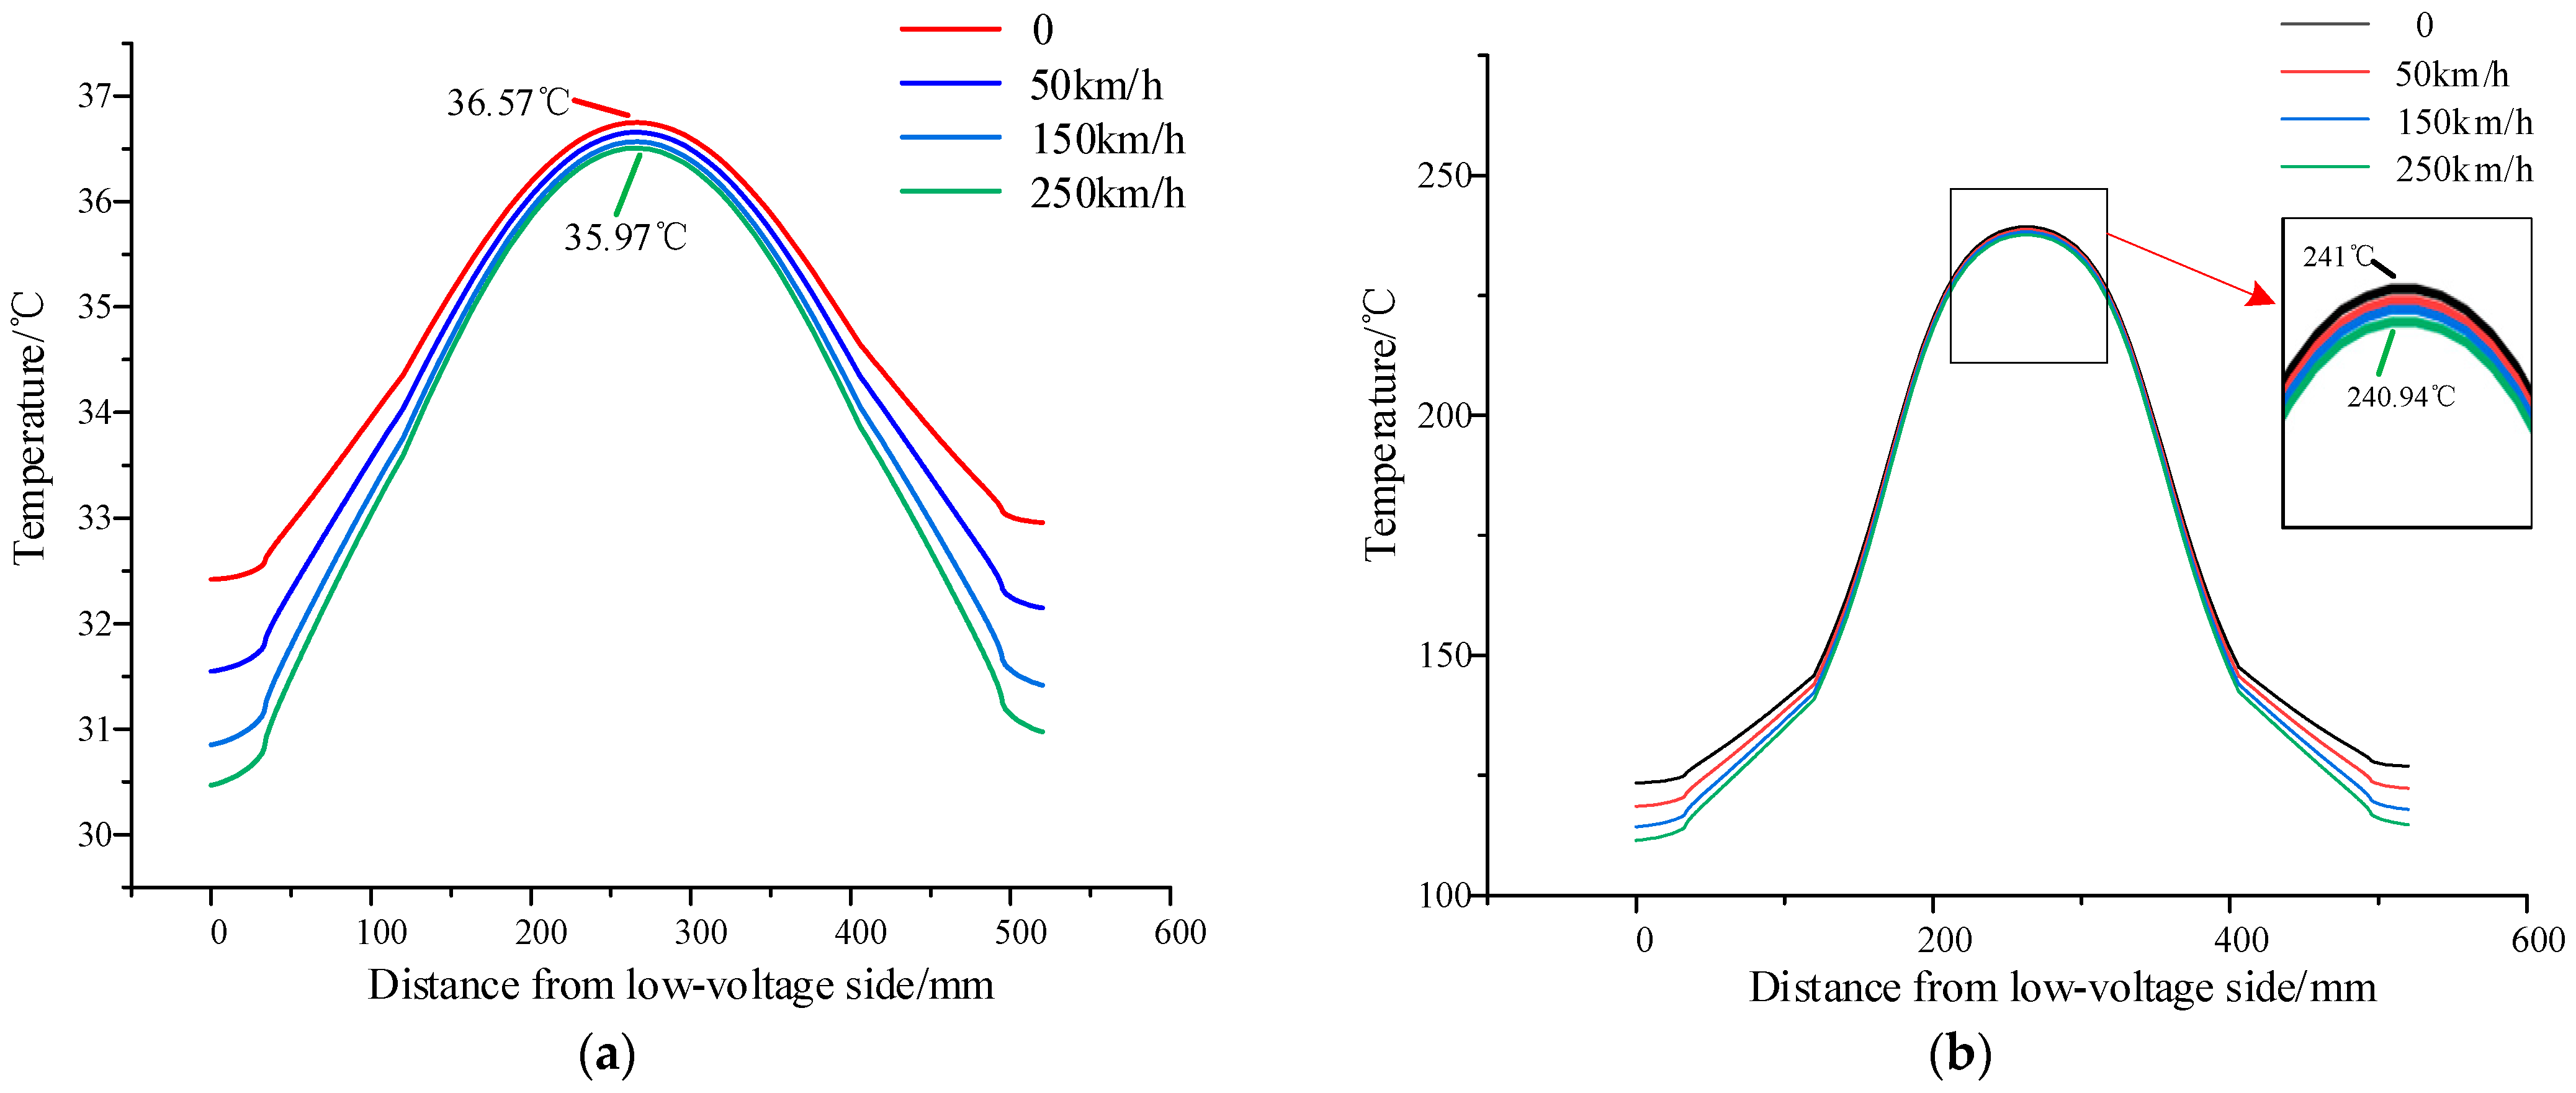
4.8. Influence of Air Velocity on the Temperature Distribution on the Arrester
5. Conclusions
- (1)
- After working at a continuous operating voltage for 3 h, the maximum temperature of the arrester valve plate increases by 5.2 °C. In the impulse current experiment, the maximum temperature of the arrester increases by 97.6 °C. The valve plates near the two sides of the arrester dissipate heat faster and have a lower temperature. Applying multiple large currents continuously may cause harm to the roof arrester.
- (2)
- The simulation results showed that, under the action of passing section overvoltage and steep impulse overvoltage, the internal temperature of the normal arrester reached 36.57 °C and 241 °C, respectively, in a short time. Under the action of high-harmonic overvoltage, the temperature rise was only 0.2 °C. This indicated that the high-amplitude overvoltage may be the main reason for the heat of the arrester.
- (3)
- When the valve plate had electric tree defects, the internal temperature rise of the arrester was small under the action of high-harmonic overvoltage. Under the action of passing section overvoltage and steep impulse overvoltage, the temperature increases obviously with the number of defective valve plates, and the maximum temperature reaches 536 °C when the number of defective valve plates is 3.
- (4)
- With the increase in air velocity, the internal temperature of the arrester decreased slightly under the passing section overvoltage and steep impulse overvoltage, so the EMU running at high speed has little influence on the internal temperature rise of the arrester under the action of overvoltage.
- (5)
- The internal simulation temperature of the normal arrester and the defective arrester under the action of the steep impulse overvoltage was 8 times and 18 times that of the internal temperature of the arrester under the action of the power frequency overvoltage, respectively, which indicated that the roof overvoltage will not only accelerate the performance deterioration of the arrester but even lead to thermal collapse. The passing section overvoltage and steep impulse overvoltage have high amplitudes and many occurrences, so the roof overvoltage of the EMU is an important reason for the arrester burst.
Author Contributions
Funding
Institutional Review Board Statement
Informed Consent Statement
Data Availability Statement
Conflicts of Interest
References
- Li, M.; Wen, Y.; Wang, G.; Zhang, D.; Zhang, J. A Network-Based Method to Analyze EMI Events of On-Board Signaling System in Railway. Appl. Sci. 2020, 10, 9059. [Google Scholar] [CrossRef]
- Wang, M.-H.; Lu, S.-D.; Hung, C.-C. Application of Deep Learning and Symmetrized Dot Pattern to Detect Surge Arrester Status. Appl. Sci. 2022, 12, 650. [Google Scholar] [CrossRef]
- Wu, J.; Lin, B.; Wang, J.; Liu, S. A Network-Based Method for the EMU Train High-Level Maintenance Planning Problem. Appl. Sci. 2018, 8, 2. [Google Scholar] [CrossRef] [Green Version]
- Midya, S.; Bormann, D.; Schutte, T.; Thottappillil, R. DC component from pantograph arcing in ac traction system-influencing parameters, impact, and mitigation techniques. IEEE Trans. Electromagn. Compat. 2011, 53, 18–27. [Google Scholar] [CrossRef]
- Tellini, B.; Macucci, M.; Giannetti, R.; Antonacci, G.A. Line-pantograph EMI in rail way systems. IEEE Instrum. Meas. Mag. 2001, 4, 10–13. [Google Scholar] [CrossRef]
- Araújo, M.A.; Spatti, D.H.; Liboni, L.H.; Pergentino, L.A.; Viana, F.E.; Flauzino, R.A. Decision-Making Support Method for the Preventive Substitution of Surge Arresters on Distribution Systems. J. Control Autom. Electr. Syst. 2019, 30, 391–401. [Google Scholar] [CrossRef]
- Lu, H.; Zhu, F.; Liu, Q.; Li, X.; Tang, Y.; Qiu, R. Suppression of Cable Overvoltage in a High-Speed Electric Multiple Units System. IEEE Trans. Electromagn. Compat. 2019, 61, 361–371. [Google Scholar] [CrossRef]
- Huang, K.; Liu, Z.; Li, X. Research on Electromagnetic Transient Processes of Long Marshalling High-Speed Train Passing Articulated Split-Phase Region. IEEE Access 2019, 7, 78597–78615. [Google Scholar] [CrossRef]
- Xia, X. Analysis and treatment of harmonic overvoltage in wati Railway traction network. Electr. Railw. 2021, 32, 118–121. [Google Scholar] [CrossRef]
- Abdul-Malek, Z. Electrical and temperature correlation to monitor fault condition of ZnO surge arrester. In Proceedings of the 2016 3rd International Conference on Information Technology, Computer, and Electrical Engineering (ICITACEE), Semarang, Indonesia, 18–20 October 2016; pp. 182–186. [Google Scholar] [CrossRef]
- Latiff, N.A.A.; Illias, H.A.; Bakar, A.H.A. Condition monitoring of discharged ZnO surge arrester on temperature distribution under various design conditions. In Proceedings of the 2016 International Conference on Condition Monitoring and Diagnosis (CMD), Xi’an, China, 25–28 September 2016; pp. 562–565. [Google Scholar] [CrossRef]
- Zhang, B.; Li, G.; Zhang, C.; Song, J.; Chen, L.; Su, N. Internal Temperature Rise of MOA Under Pollution Condition. High Volt. Eng. 2011, 37, 2065–2072. [Google Scholar] [CrossRef]
- Zhao, L.; Huang, X.; Zhao, Y.; Zhu, Y. On-line Monitoring Technology for Arrester Considering Affection of Filth on Their External Surface. Electr. Autom. 2019, 41, 112–114+118. [Google Scholar] [CrossRef]
- Meng, P.; Yuan, C.; Xu, H.; Wan, S.; Xie, Q.; He, J.; Zhao, H.; Hu, J.; He, J. Improving the protective effect of surge arresters by optimizing the electrical property of ZnO varistors. Electr. Power Syst. Res. 2020, 178, 106041. [Google Scholar] [CrossRef]
- Seyyedbarzegar, S.M.; Mirzaie, M. Application of finite element method for electro-thermal modeling of metal oxide surge arrester. Comput. Appl. Eng. Educ. 2015, 23, 910–920. [Google Scholar] [CrossRef]
- Heinrich, C.; Hinrichsen, V. Diagnostics and monitoring of metal-oxide surge arresters in high-voltage networks-comparison of existing and newly developed procedures. IEEE Trans. Power Deliv. 2001, 16, 138–143. [Google Scholar] [CrossRef]
- Pan, Y. Treatment and Analysis for a Lightning Arrester Heating Defect. Electr. Switchg. 2021, 59, 83–86. [Google Scholar]
- Andrade, A.F.; Costa, E.G.; Fernandes, J.M.; Alves, H.M.; Amorim Filho, C.R. Thermal behaviour analysis in a porcelain-housed ZnO surge arrester by computer simulations and thermography. In Proceedings of the 2018 IEEE International Conference on High Voltage Engineering and Application (ICHVE 2018), Athens, Greece, 10–13 September 2018; pp. 173–177. [Google Scholar] [CrossRef]
- Zhou, X. Research on voltage-current temperature characteristics of metal oxide arrester for AC line. China Meas. Test 2021, 47, 154–160. [Google Scholar]
- Yang, Y.; Deng, W.; Luo, R.; Shi, Z.; Wei, S. Analysis of Temperature for 500 kV ZnO Surge Arrester Based on Thermal-Electric Coupling. Insulators Surge Arresters 2019, 3, 98–104. [Google Scholar] [CrossRef]
- Liu, W.; Xiao, J.; Jin, S.; Yang, S.; Gao, M.; Zhang, Y. Analysison Damp Defect of 500 kV Zinc Oxide Arrester Based on Field-Circuit Coupling. Insulators Surge Arresters 2022, 1, 118–125. [Google Scholar] [CrossRef]
- Imai, T.; Udagawa, T.; Ando, H.; Tanno, Y.; Kayano, Y.; Kan, M. Development of high gradient zinc oxide nonlinear resistors and their application to surge arresters. IEEE Trans. Power Deliv. 1998, 13, 1182–1187. [Google Scholar] [CrossRef]
- Olariu, A.F.; Frigura-Iliasa, F.M.; Balcu, F.I.; Frigura-Iliasa, M.; Dolga, L.; Filipescu, H.E. Computer Aided Model for a Low Voltage Varistor with Increased Thermal Stability. In Proceedings of the 2018 5th International Conference on Electrical Engineering, Computer Science and Informatics (EECSI), Malang, Indonesia, 16–18 October 2018; pp. 226–230. [Google Scholar] [CrossRef]
- Späck-Leigsnering, Y.; Ruppert, M.G.; Gjonaj, E.; De Gersem, H.; Hinrichsen, V. Simulation Analysis of Critical Parameters for Thermal Stability of Surge Arresters. IEEE Trans. Power Deliv. 2022, 37, 871–879. [Google Scholar] [CrossRef]
- Yang, S.; Tao, W. Heat Transfer; Higher Education Press: Beijing, China, 2006. [Google Scholar]
- Zeng, G.; Wang, X.; Liu, S.; Liu, B.; Zhang, S.; Liu, B.; Wei, Z.; Wang, Z.; Li, S. Simulation Analysis of Temperature Rise Distribution Characteristics of Damp Arrester. Hubei Electr. Power 2020, 44, 34–41. [Google Scholar] [CrossRef]
- Fang, Z.; Wu, X.; Guo, J.; Xie, P.; Hu, J.; Li, C. Heat Dissipation Model of Arrester Under Transient Time-varying Load. High Volt. Eng. 2020, 46, 34–41. [Google Scholar] [CrossRef]
- He, J.; Hu, J.; Lin, Y. ZnO varistors with high voltage gradient and low leakage current by doping rare-earth oxide. Technol. Sci. 2008, 51, 693–701. [Google Scholar] [CrossRef]
- Zhu, R. Investigation on the Lighting Protection and Ageing Properties of 10 kV ZnO Arrestor in Distribution Network. Master’s Thesis, Beijing Jiaotong University, Beijing, China, 2017. [Google Scholar]
- Yang, Z. Study on Thermal Runaway of 110 kV Metal Oxide Arrester. Master’s Thesis, Xiamen University of Technology, Xiamen, China, 2020. [Google Scholar] [CrossRef]
- Wu, T.; Wang, X.; Xu, G. Engineering Heat Transfer, 2nd ed.; Huazhong University of Science & Technology Press: Wuhan, China, 2011. [Google Scholar]


| Type | Overvoltage Amplitude Range (kV) | ||||
|---|---|---|---|---|---|
| 50–60 | 60–70 | 70–80 | 80–90 | >90 | |
| Passing section overvoltage | 819 | 235 | 89 | 15 | 2 |
| High-harmonic overvoltage | 71 | 0 | 0 | 0 | 0 |
| Steep impulse overvoltage | 6 | 13 | 11 | 8 | 5 |
| Condition | C | n | m | Simplified Formula |
|---|---|---|---|---|
| 5 < Re < 103 | 0.5 | 0.5 | 0.38 | |
| 103 < Re < 2 × 10⁵ | 0.26 | 0.6 | 0.38 | |
| 2 × 10⁵ < Re < 2 × 10⁶ | 0.023 | 0.8 | 0.37 |
| The Air Velocity (km/h) | Re | h (W/(m2·K)) |
|---|---|---|
| 50 | 1.1 × 10⁵ | 50.3 |
| 150 | 3.3 × 10⁵ | 112.2 |
| 250 | 5.5 × 10⁵ | 168.8 |
Publisher’s Note: MDPI stays neutral with regard to jurisdictional claims in published maps and institutional affiliations. |
© 2022 by the authors. Licensee MDPI, Basel, Switzerland. This article is an open access article distributed under the terms and conditions of the Creative Commons Attribution (CC BY) license (https://creativecommons.org/licenses/by/4.0/).
Share and Cite
Wang, S.; Ou, Q.; Lei, S.; Liu, H.; Mao, S.; Zhang, Q.; Liu, J.; Lv, F. Study on the Measurement of the On-Site Overvoltage and Internal Temperature Rise Simulation of the EMU Arrester. Appl. Sci. 2022, 12, 7925. https://doi.org/10.3390/app12157925
Wang S, Ou Q, Lei S, Liu H, Mao S, Zhang Q, Liu J, Lv F. Study on the Measurement of the On-Site Overvoltage and Internal Temperature Rise Simulation of the EMU Arrester. Applied Sciences. 2022; 12(15):7925. https://doi.org/10.3390/app12157925
Chicago/Turabian StyleWang, Shenghui, Qi Ou, Shengfeng Lei, Huaqi Liu, Shuaitao Mao, Qizhe Zhang, Jian Liu, and Fangcheng Lv. 2022. "Study on the Measurement of the On-Site Overvoltage and Internal Temperature Rise Simulation of the EMU Arrester" Applied Sciences 12, no. 15: 7925. https://doi.org/10.3390/app12157925