
Wavelet Energy Evolution Characteristics of Acoustic Emission Signal under True-Triaxial Loading during the Rockburst Test

1
Faculty of Engineering, China University of Geosciences (Wuhan), No. 388, Lumo Road, Hongshan District, Wuhan 430074, China
2
Faculty of Earth Resources, China University of Geosciences (Wuhan), No. 388, Lumo Road, Hongshan District, Wuhan 430074, China
*
Author to whom correspondence should be addressed.
Appl. Sci. 2022, 12(15), 7786; https://doi.org/10.3390/app12157786
Submission received: 2 July 2022
/
Revised: 30 July 2022
/
Accepted: 30 July 2022
/
Published: 2 August 2022
(This article belongs to the Topic New Trends in Rock Materials Mechanics and Engineering Geology)
Abstract
:The rockburst simulation test is conducted by utilizing a mineral-containing marble specimen. The loading condition is set to the three directions, each loading on five surfaces except for a single free surface. The whole test procedure is monitored in real time by using a PCI-II acoustic emission monitoring system and a high-speed camera. According to the test outcomes, rockburst is a process in which energy is rapidly released from the free surface. Rock block and rock plate are buckled and ejected from the free surface and a severe rockburst process is accompanied by spray rock powder. An explosion sound can be heard during the process, which can be analyzed by signal processing techniques. The failure mode of the specimen is a splitting-shearing composite failure, and the free surface becomes a rockburst destruction surface. A V-type rockburst pit is formed in the ejection area. The effective acoustic emission signal of the whole test process is decomposed and reconstructed using five-layer wavelets to produce six frequency band sub-signals. In addition, the wavelet energy and its energy distribution coefficients are assessed for various frequency bands, and the proportion of each dominant frequency band within each period is computed. Finally, it was found that the dominant frequency band is 125~250 kHz, while the suboptimal frequency band is 250~500 kHz. The succeeding features are noticed to be used as predicted features for the rockburst disaster. Namely, acoustic emission signals arise in large numbers and the energy distribution coefficient of the dominant frequency band concentrates above 0.4. The proportion of dominant frequency band appears in continuous valley type and keeps below 80%, while the proportion of suboptimal frequency band appears in continuous peak type and keeps above 20%.
1. Introduction
The rockburst disaster is a kind of process in the underground engineering system in which the surrounding rock body is suddenly destroyed, which releases the accumulated elastic potential energy in the rock body. Scholars suggest that the rockburst can occur unexpectedly, the rock body could be severely damaged in the process, and the rock plate may speed away, causing grave consequences such as roof collapse, deformation, and spalling in the underworkings [1]. It can also cause serious disasters, equipment damage, and casualties. Different degrees of rockburst disasters have occurred in many countries, such as South Africa, China, US, Russia, Chile, Japan, Germany, Canada, Norway, Sweden, etc. It can also occur in different fields, such as geological engineering, underground mining engineering, water conservancy, hydropower, etc. [2,3,4]. Geological weaknesses could play a larger role at shallower sites where mining-induced fractures are not important [5]. A rockburst disasters is actually a dynamic fracture of rock cracks under complex stress fields [6,7,8,9], for example, the model of a coupling analysis was established to investigate the influence of fractured rock mass and seepage-damage effect [10,11]. In the field of mine, rockburst disaster is closely related to buried deep and surrounding rock nature. The probability of the occurrence is enhanced by the deep-buried high-stress areas and hard rock. However, the rock dynamic disasters of the monitoring and early warning technology, such as rockburst, are still a key scientific and technical problem that the rock mechanics community must be committed to solving [12,13,14].
The laboratory rockburst simulation test plays a significant role in understanding rockburst mechanisms, analyzing the rockburst phenomenon, and establishing the rockburst warning model. The high-stress environment of rock was a necessary condition for the rockburst disaster. Thus, in order to successfully simulate the occurrence of the rockburst, it is very significant to control the load of a rock. Some scholars identified the maximum principal stress as the main factor inducing rockburst, and they conducted the way of the uniaxial loading and unloading to simulate stress concentration during the test. From example, Si et al. [15] analyzed a cylindrical phyllite specimen’s rockburst proneness by uniaxial compression tests. Li et al. [16] used sandstone samples in a uniaxial compression test to observe rockburst precursor information. Zhou et al. [17] analyzed the mechanism of rockburst induced by spalling damage with similar materials uniaxial compression tests. Uniaxial compression tests were conducted using cylindrical samples to investigate the process of rockburst induced by spalling [18]. Other scholars have concluded that the combined action of maximum principal stress and intermediate principal stress could better simulate the stress condition when a rockburst disaster occurs. For example, biaxial compression tests were performed on granite specimens to investigate the rockburst mechanism [19]. Zhao et al. [20] conducted biaxial compression experiments on sandstone specimens with three different lateral stresses to study the impact of the in situ stress on the rockburst process and failure characteristics. Zhang et al. [21] applied biaxial compression tests on granite samples with the prefabricated hole to investigate the rockburst process under horizontal stress conditions. Nonetheless, principal stress and intermediate stress cannot disclose the internal stress state of rock mass when a rockburst occurs. The triaxial stress state where the maximum principal stress exceeds the critical value was recognized by scholars as the external factor leading to the rockburst disaster.
Rockburst disasters are difficult to predict accurately. The prediction measure of rockburst disasters can be divided into long-term trend prediction and short-term warning. Compared with the trend prediction of the rockburst based on the physical and mechanical properties of rock [22,23], the short-term warning technology was the foreword research and hotspot discussion of rockburst disaster prevention and control, such as Acoustic Emission (AE), Microseismic (MS), and Electromagnetic Radiation (EMR) [24,25,26]. The accumulation of cracking can be observed and the occurrence trend of rockburst disasters can be assessed by acoustic emission monitoring technology [27,28,29]. The AE is a kind of phenomenon where the local damage inside material is caused by an external load and the accumulated energy in the form of elastic waves is swiftly released [30,31]. In the 1930s, Obert and Duvall first discovered that rock-like materials produced acoustic emission phenomena under external loads [32,33]. Since then, researchers have launched a large amount of research and discussion on the correspondence between the rock mechanical properties and acoustic emission characteristic parameters.
In engineering applications, acoustic emission monitoring will generate a huge amount of data, and the processing of acoustic emission monitoring data is the current main research direction. The acoustic emission parameter method was one of the fundamental analysis methods which was widely promoted in engineering practice. For example, Colombo et al. [34] predicted the concrete beam’s ultimate bending capacity by the energy value of the acoustic emission signal, which was further extended to bridge tests. Du et al. [35] established the early warning system based on AE cumulative counts and AE energy value variation characteristics of gas-bearing coal-rock at different deformation and failure stages. The acoustic emission event was used for tomographic calculation, Zhu et al. [36] studied rockburst in coal test specimens under over-stress conditions and true-triaxial unloading. Chu et al. [37] investigated the relationship between the mechanisms causing damage and acoustic emission ring counts of coal samples for different freezing conditions. Acoustic emission parameter data were calculated based on the part of signals that exceeds the threshold value. Compared to the acoustic emission parameter analysis, acoustic emission waveform analysis by preserving the complete original signal was able to reflect more truly the evolution process of failure in a comprehensive and detailed way. Therefore, there are a growing number of scholars who have begun to use acoustic emission waveform analysis to study the cracking and failure of rock materials. Zhang and Deng [38] found that the ratio of tensile and shear crack was related to dominant frequency characteristics of acoustic emission waveform. Li et al. [39] used the high-frequency band of the AE signal to monitor the granite failure process under uniaxial compression. Through AE signal frequency-amplitude distribution, Zhao et al. [40] proposed an assessment method of rock-salt destruction under the test condition of multilevel cyclic loading. Olena et al. [41] identified fracture mechanisms of cementitious composites by using the wavelet transform of AE signals. The peak frequency of acoustic emission signals after wavelet transform as a parameter exhibited good stress memory capabilities for the Kaiser effect [42].
To simulate the stress conditions of a rockburst, the indoor true-triaxial test system was adopted by loading on five surfaces in three directions, except for a single free surface. Meanwhile, the entire test process can be monitored by acoustic emission monitoring technology, as well as the high-speed camera being able to record the occurrence phenomenon of experimental rockburst. The mechanism of rockburst was researched more accurately by waveform analysis, which conducted the wavelet decomposition and reconstruction to the effective acoustic emission signal. In consideration of the lack of literature on the topic, our findings provide a detailed evaluation of the current problem.
2. Specimen and Methods
2.1. Specimen
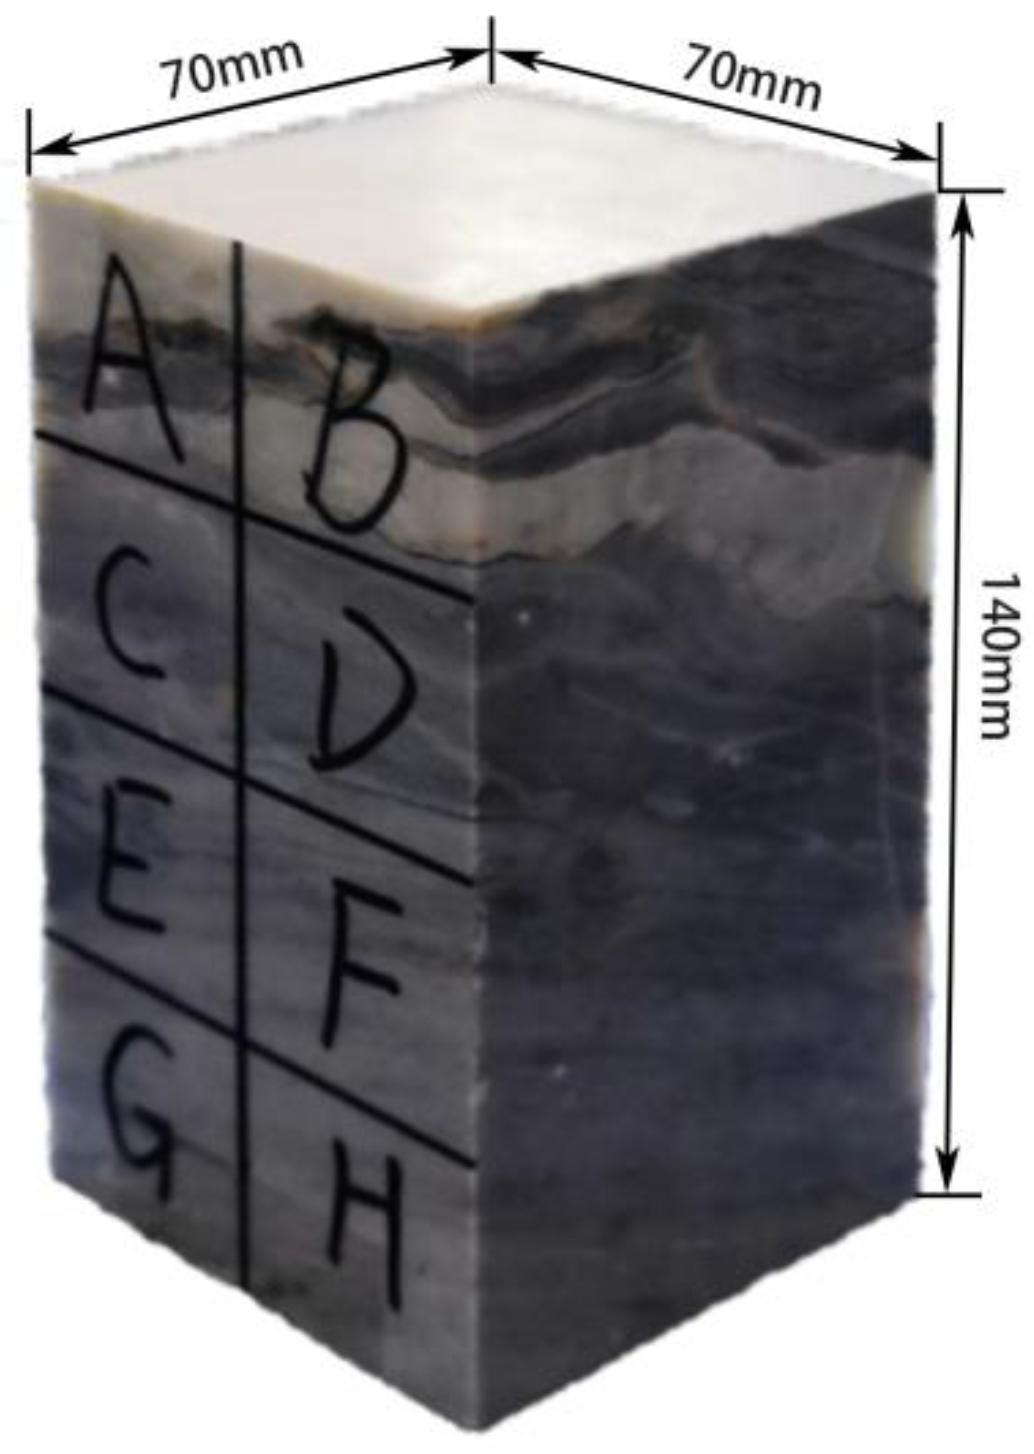
The mineral-containing Marble specimen for rockburst simulation tests was selected from a deep metal mine in Daye City, Hubei Province, China. Rock blocks were cut and polished into 70 × 70 × 140 mm standard rectangular test specimens. The surface processing flatness was conducted according to the test standard to avoid local stress concentration. To make it easier to observe the test phenomenon, the free surface of the test specimen was pre-marked with letters, as shown in Figure 1.
2.2. Methods
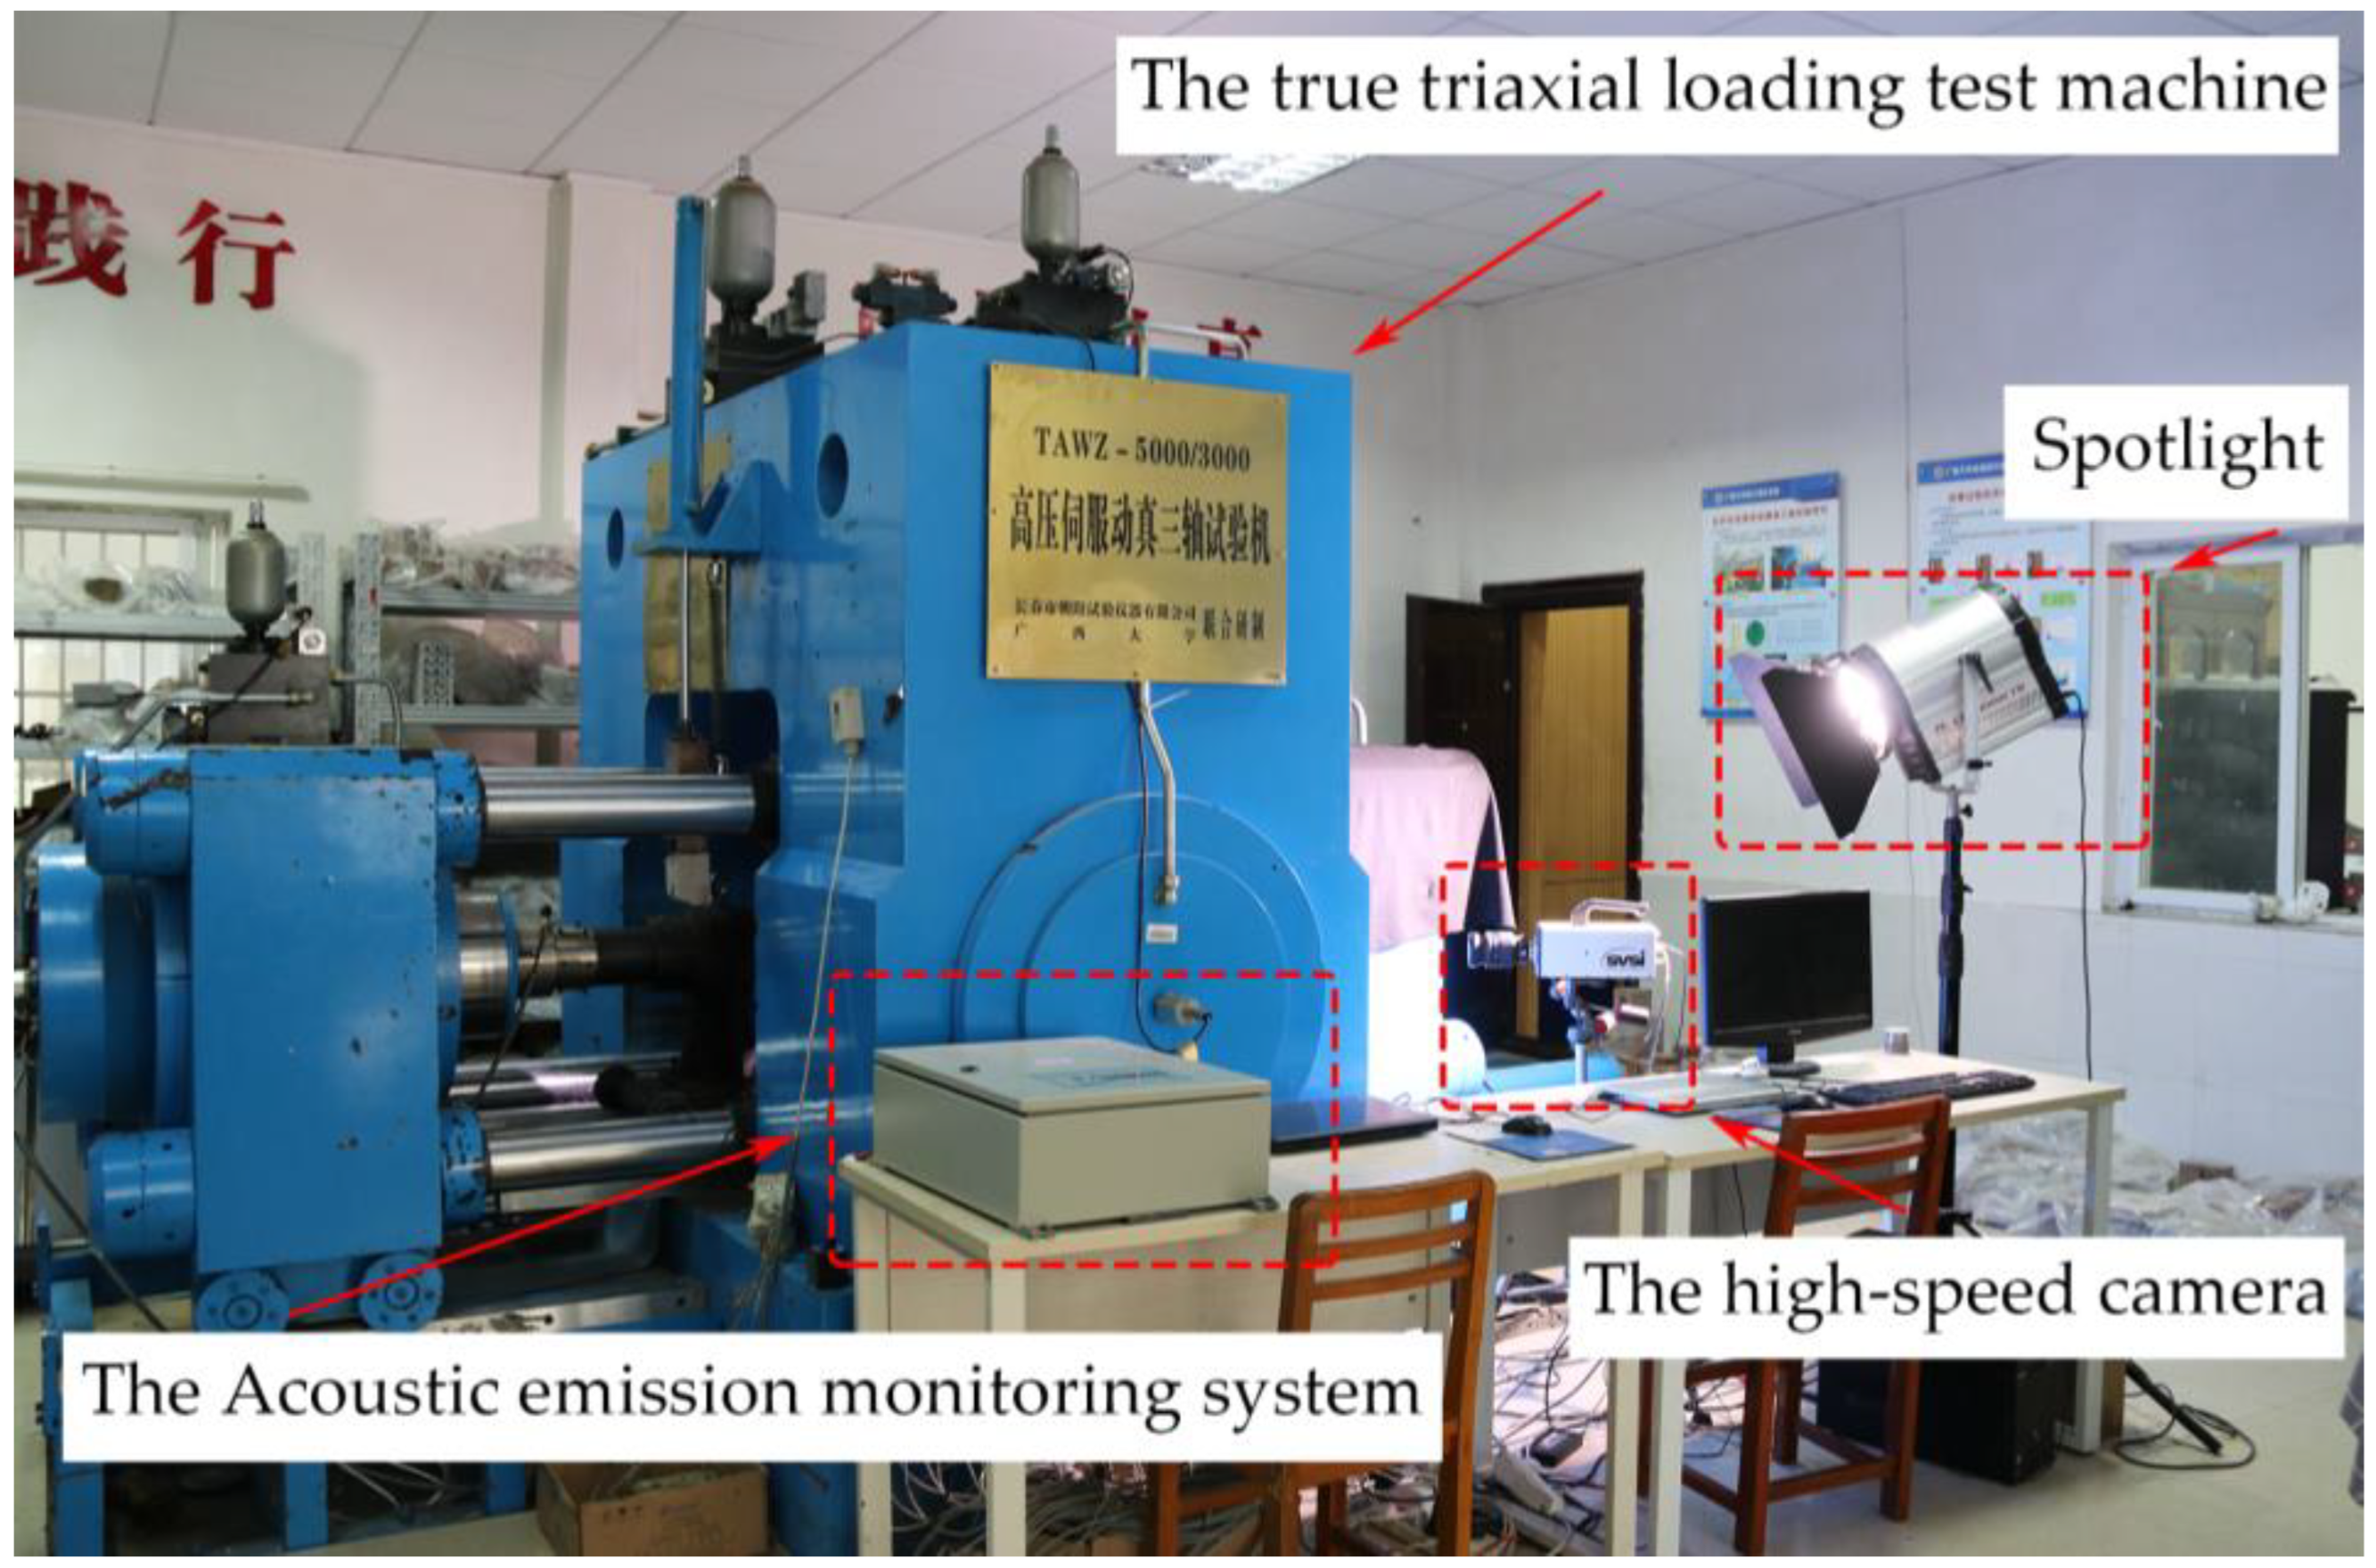
The rockburst simulation test adopts a high-stress servo true triaxial loading and unloading test system, independently developed by Guangxi University, for real-time monitoring with the US PCI-II acoustic emission monitoring system. The experimental phenomenon was observed and recorded through the GigaView high-speed camera in SVSI, UK. Figure 2 demonstrates the test equipment. The characteristics of the propagation and development in microcracks and the features of energy dispersal were obtained by the AE monitoring instrument during the rockburst process.
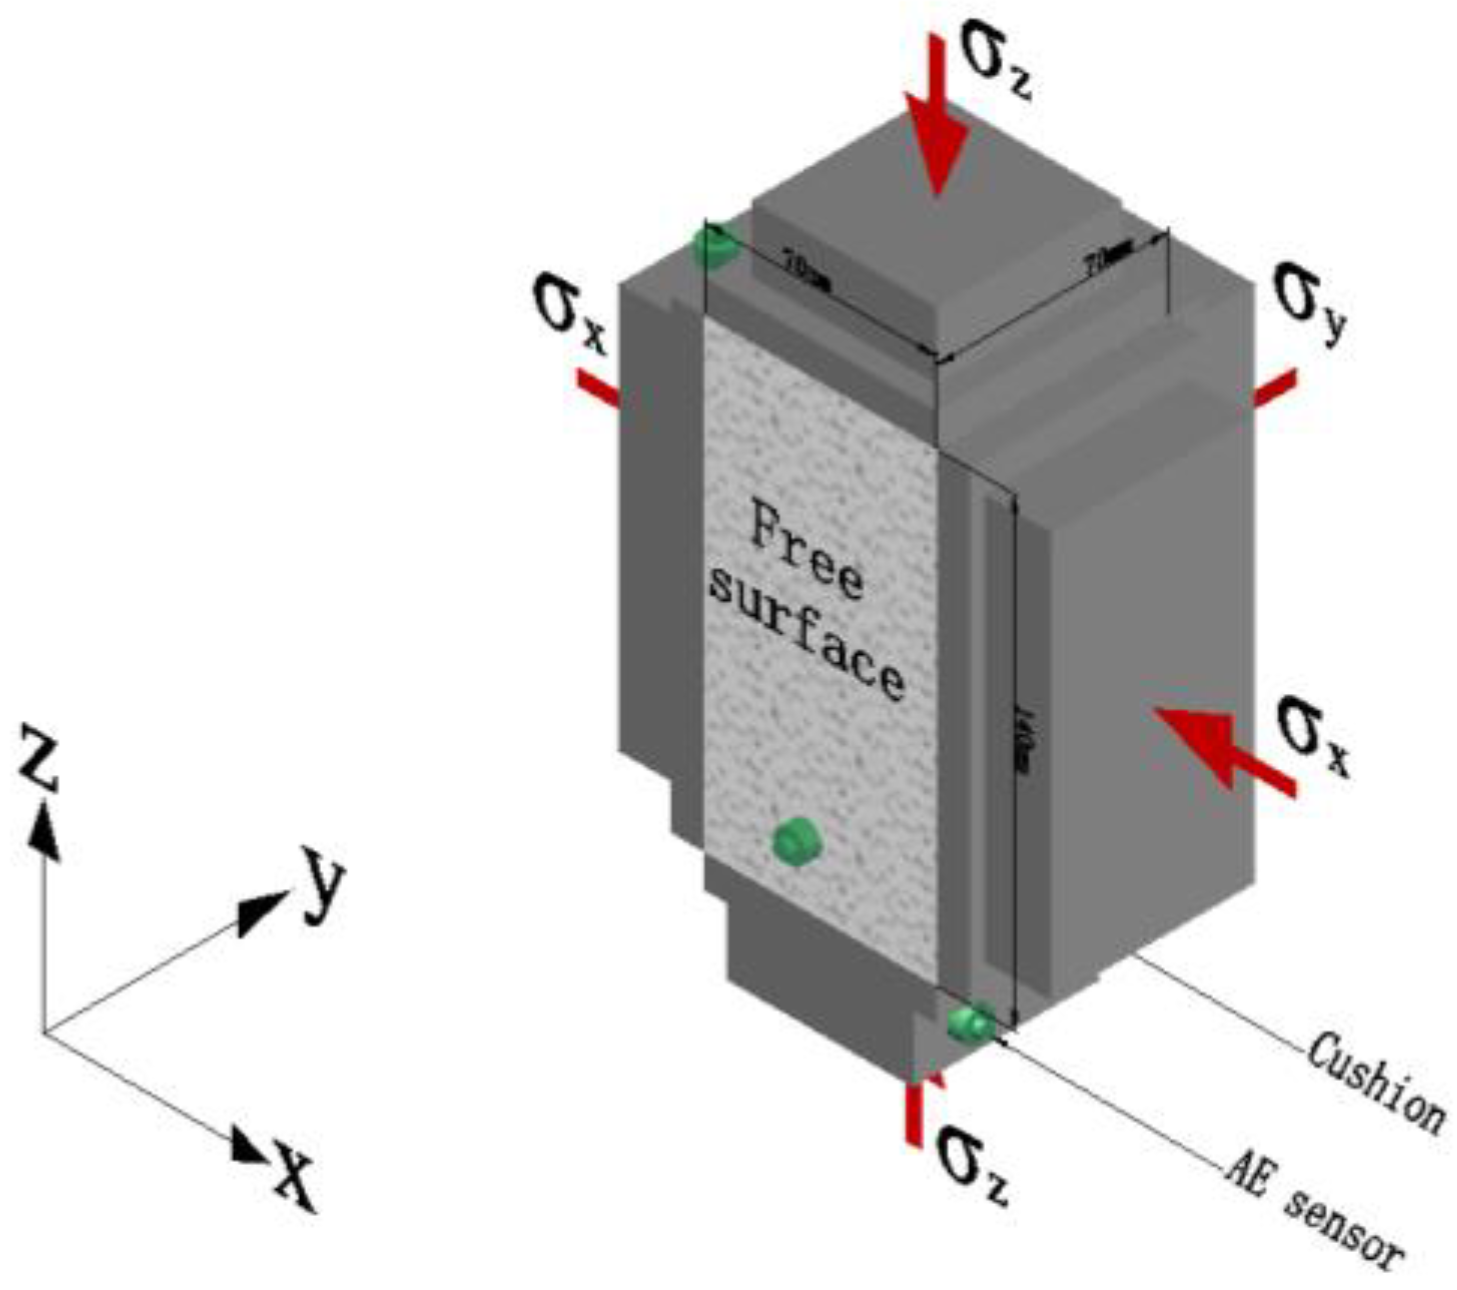
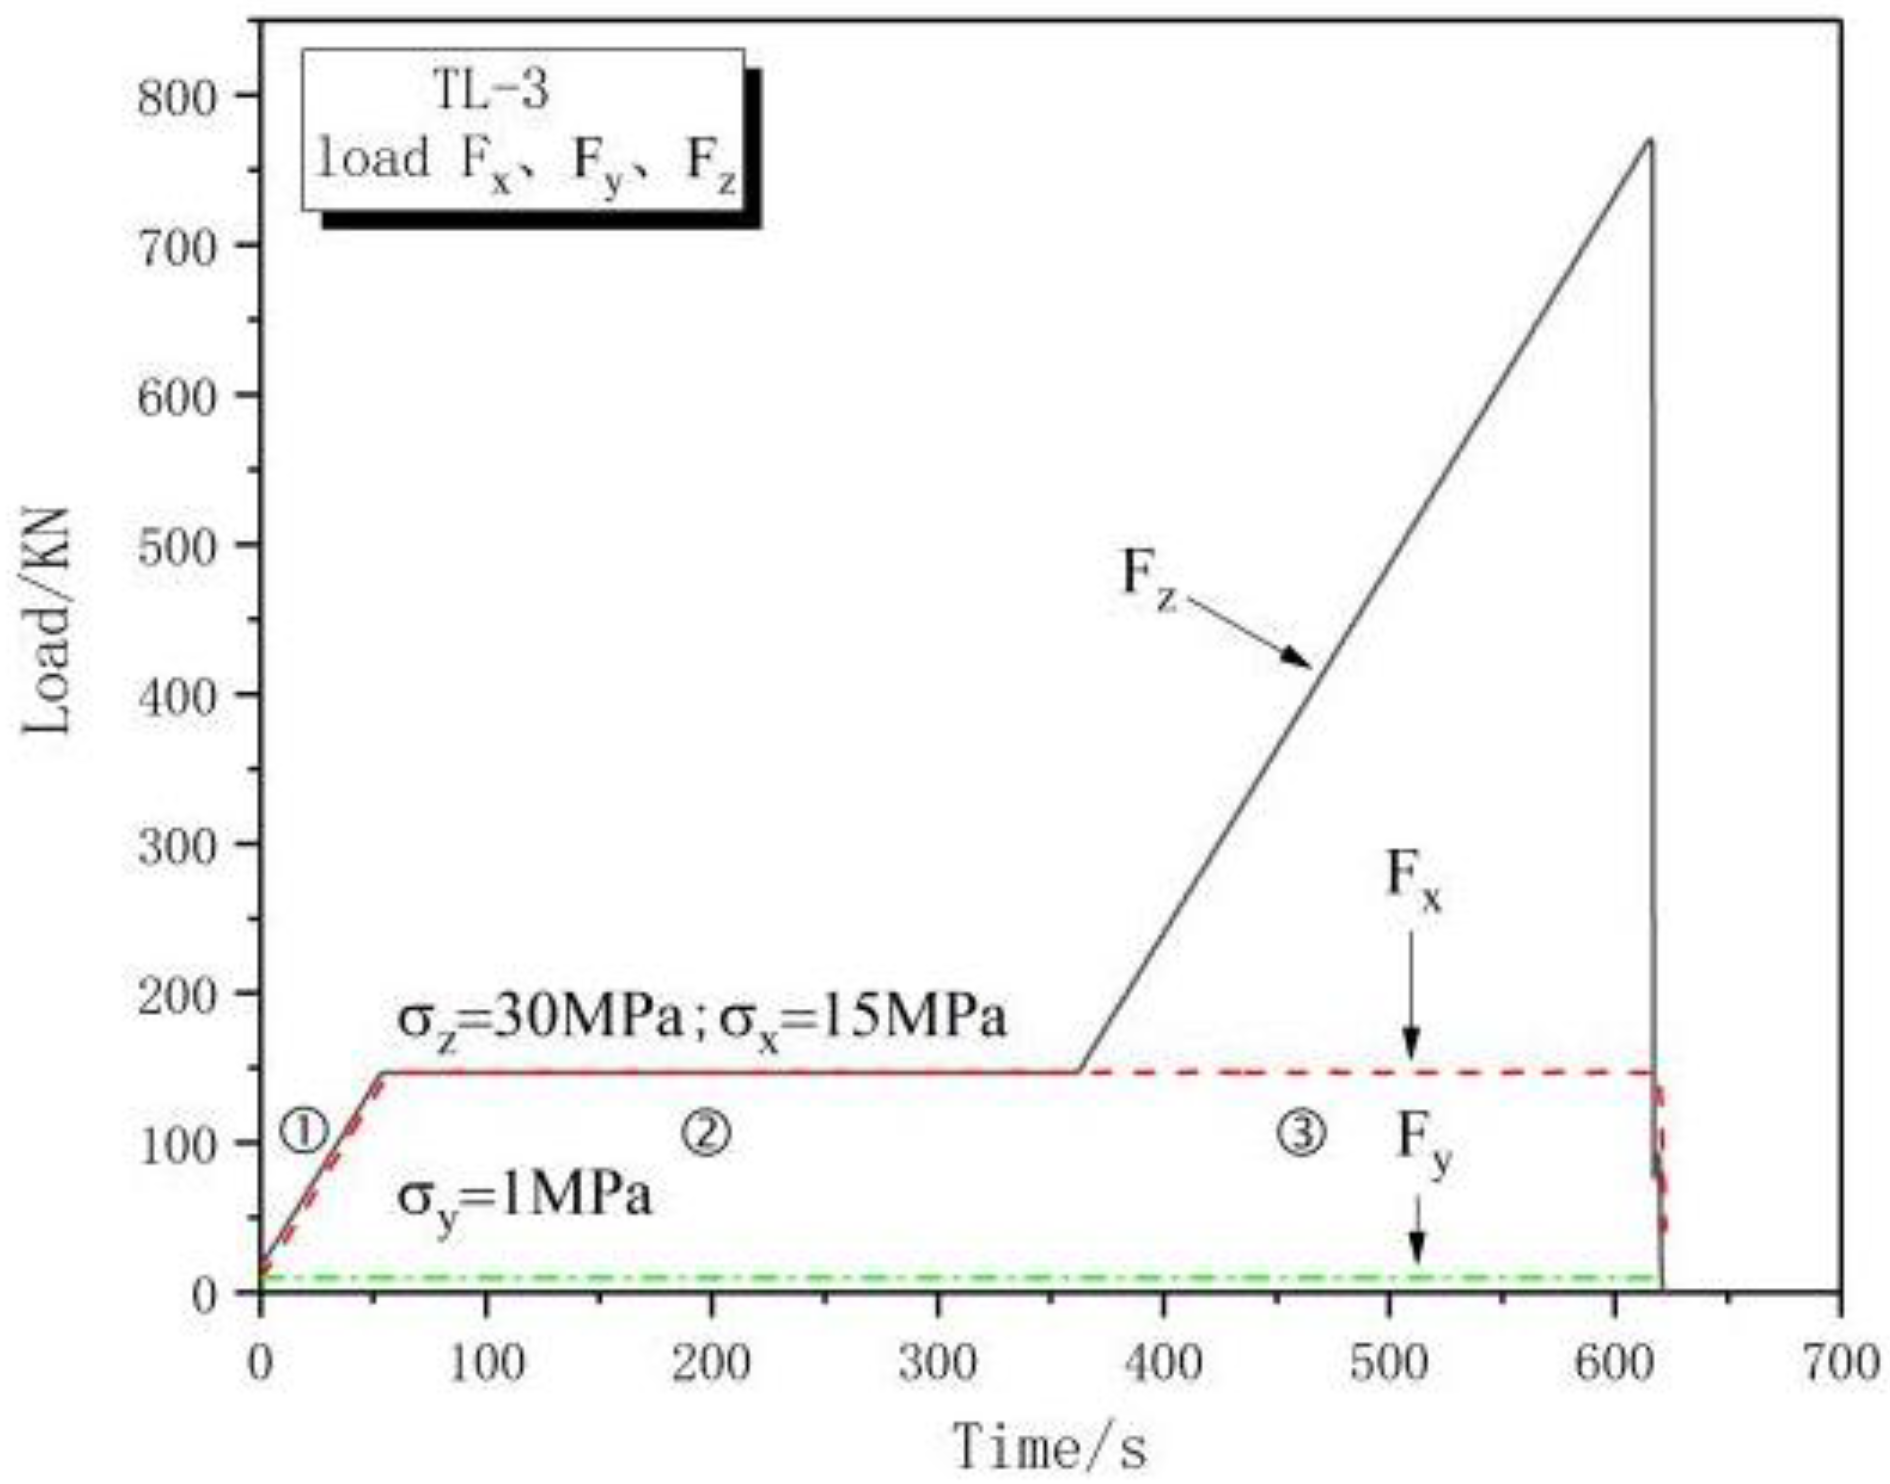
Five surfaces of the test sample were loaded under the true-triaxial stress condition, except for a single free surface, to simulate the strain-rockburst disasters induced by stress redistribution after excavation. The test specimen was loaded under stress control. The loading scheme was set to σx, σy, and σz, which were simultaneously loaded at a rate of 2.5 KN/s, and the horizontal stress σy was applied with a binding force of 9.8 KN (about 1 MPa). The stress σx and σz were loaded to 147 KN (σx was 15 MPa, σz was 30 MPa), for simulating the original ground stress state of the rock mass in the deep-buried underworkings. The loading state was maintained for 5 min, then stopped loading to simulate the situation of stress redistribution after excavation. The vertical stress σz was then loaded at a certain rate of 2.5 KN/s until the rockburst happened. Figure 3 indicates the sample loading way, while Figure 4 represents the test loading path.
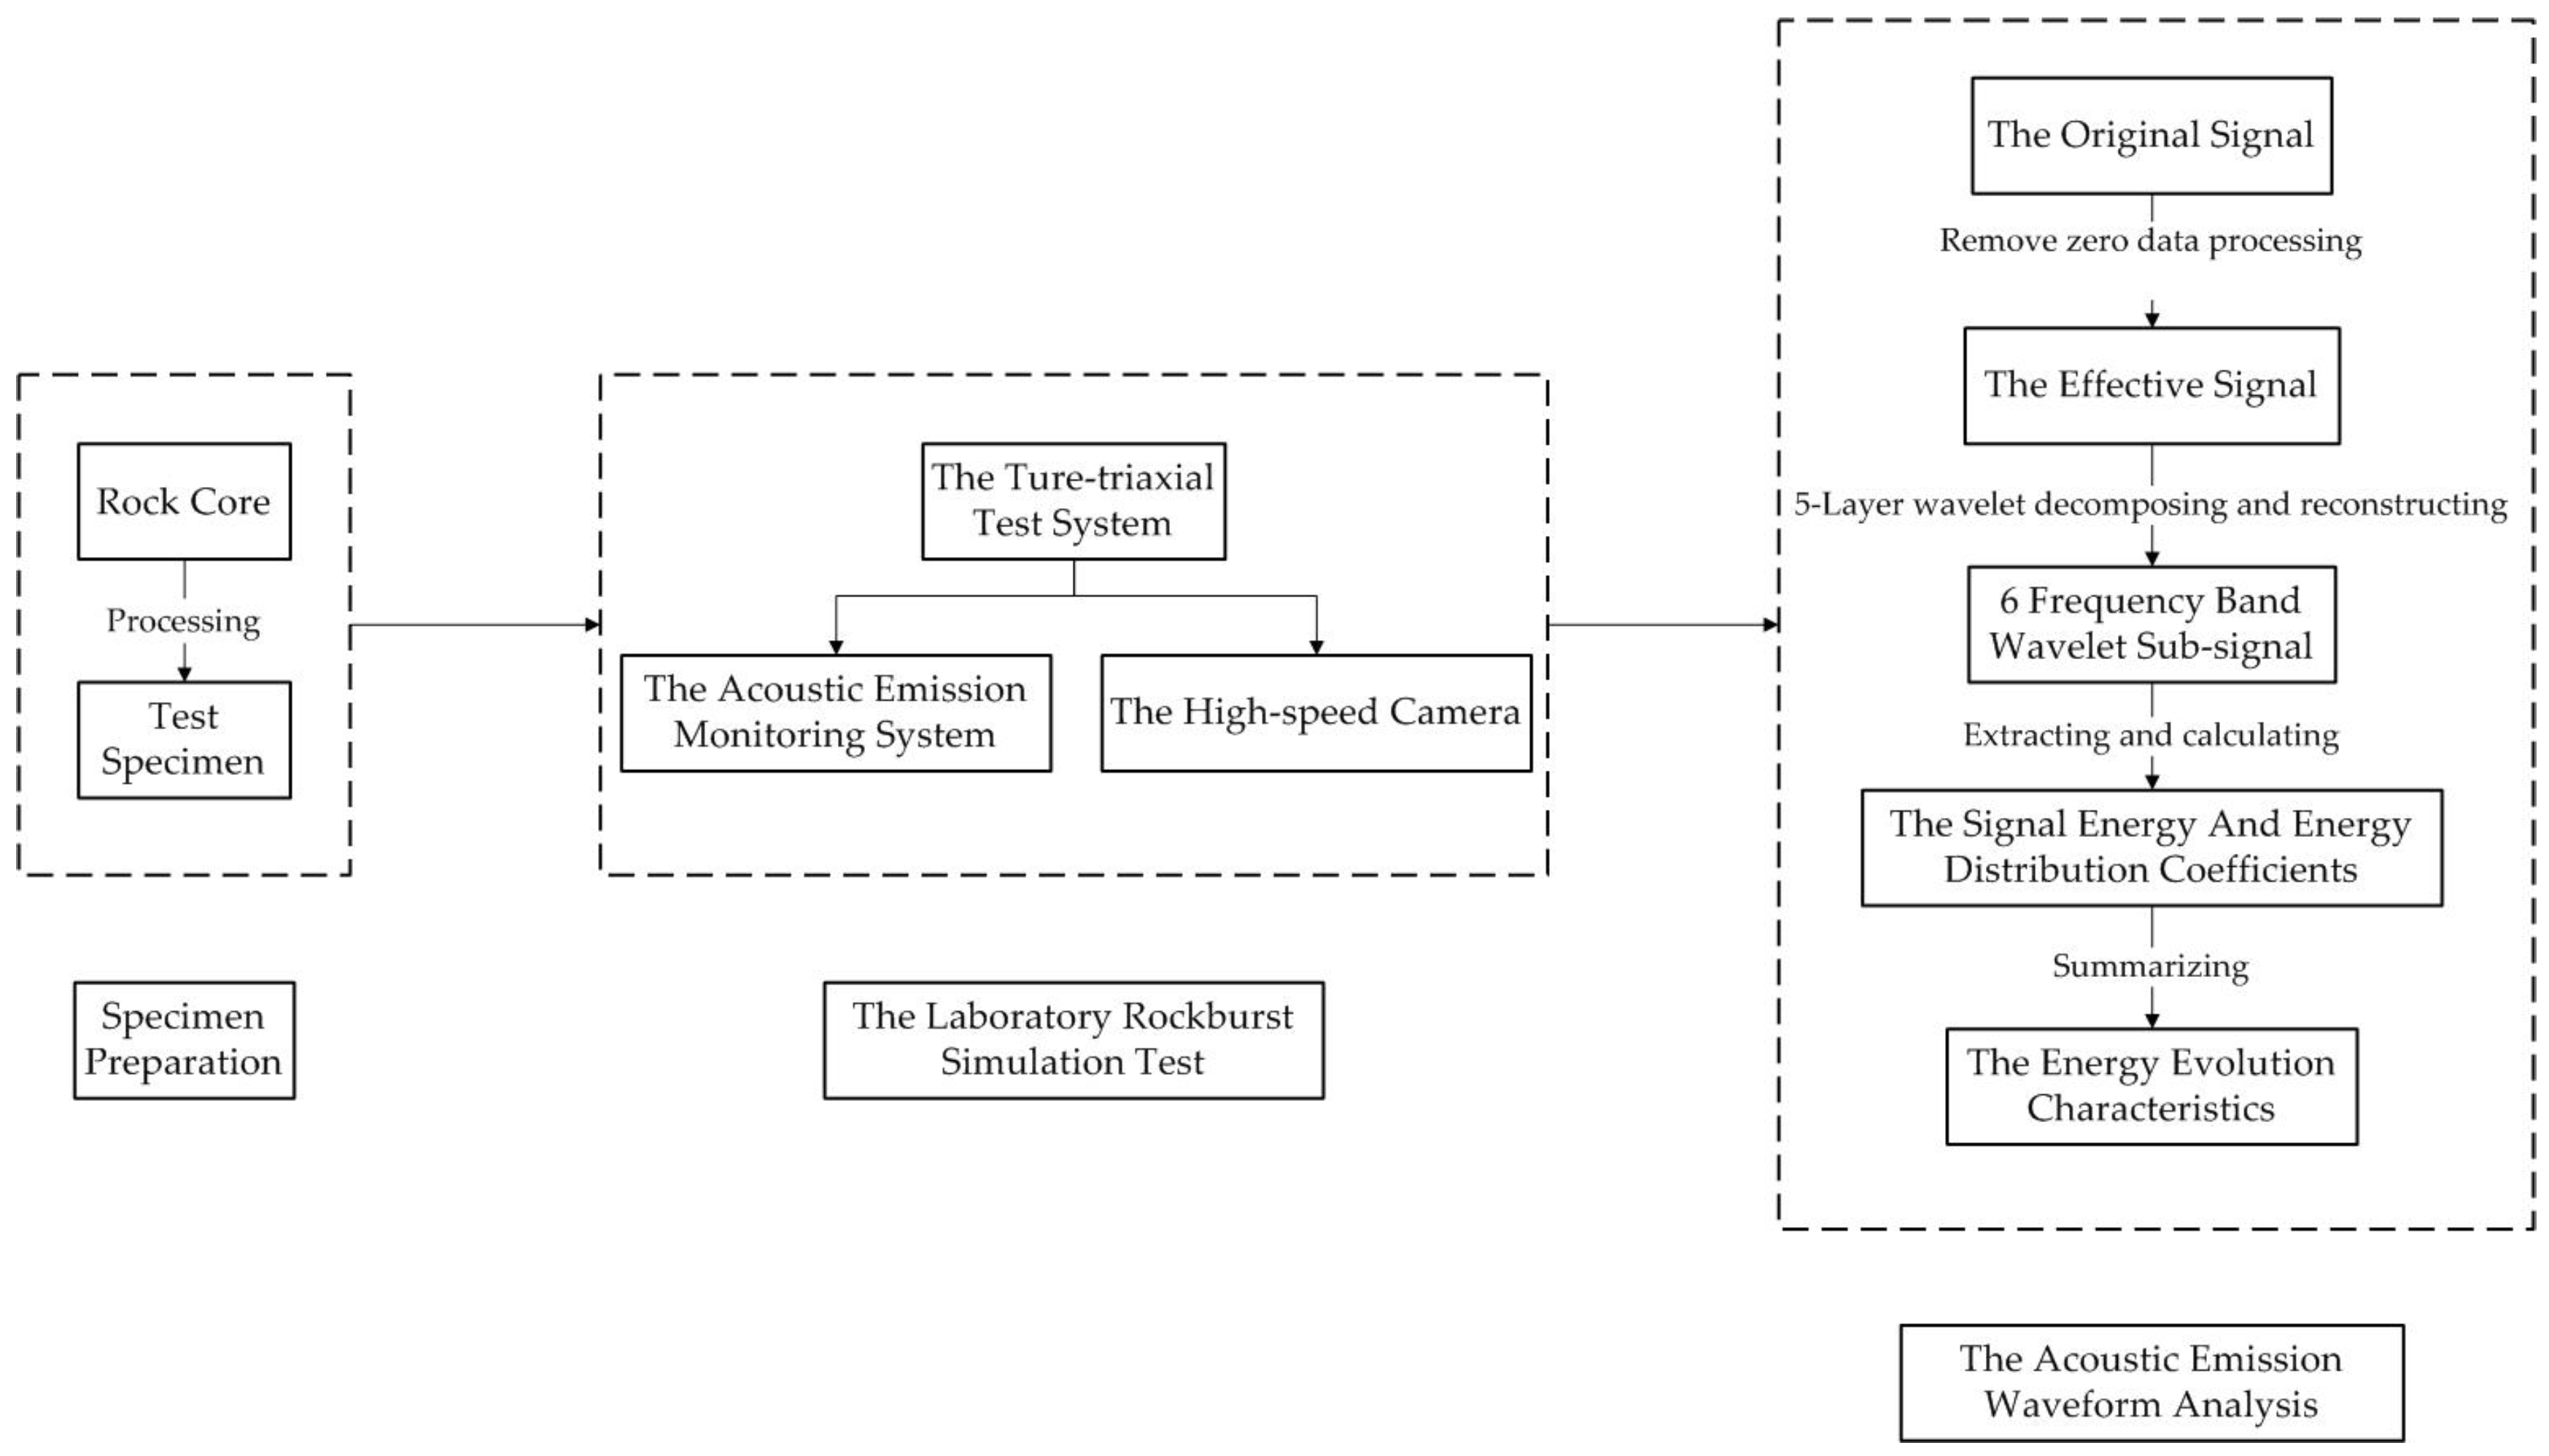
The research was divided into three steps: specimen preparation, the laboratory rockburst simulation test and the acoustic emission signal waveform analysis, while Figure 5 represents the flow chart.
3. Phenomenon and Results
3.1. Phenomenon
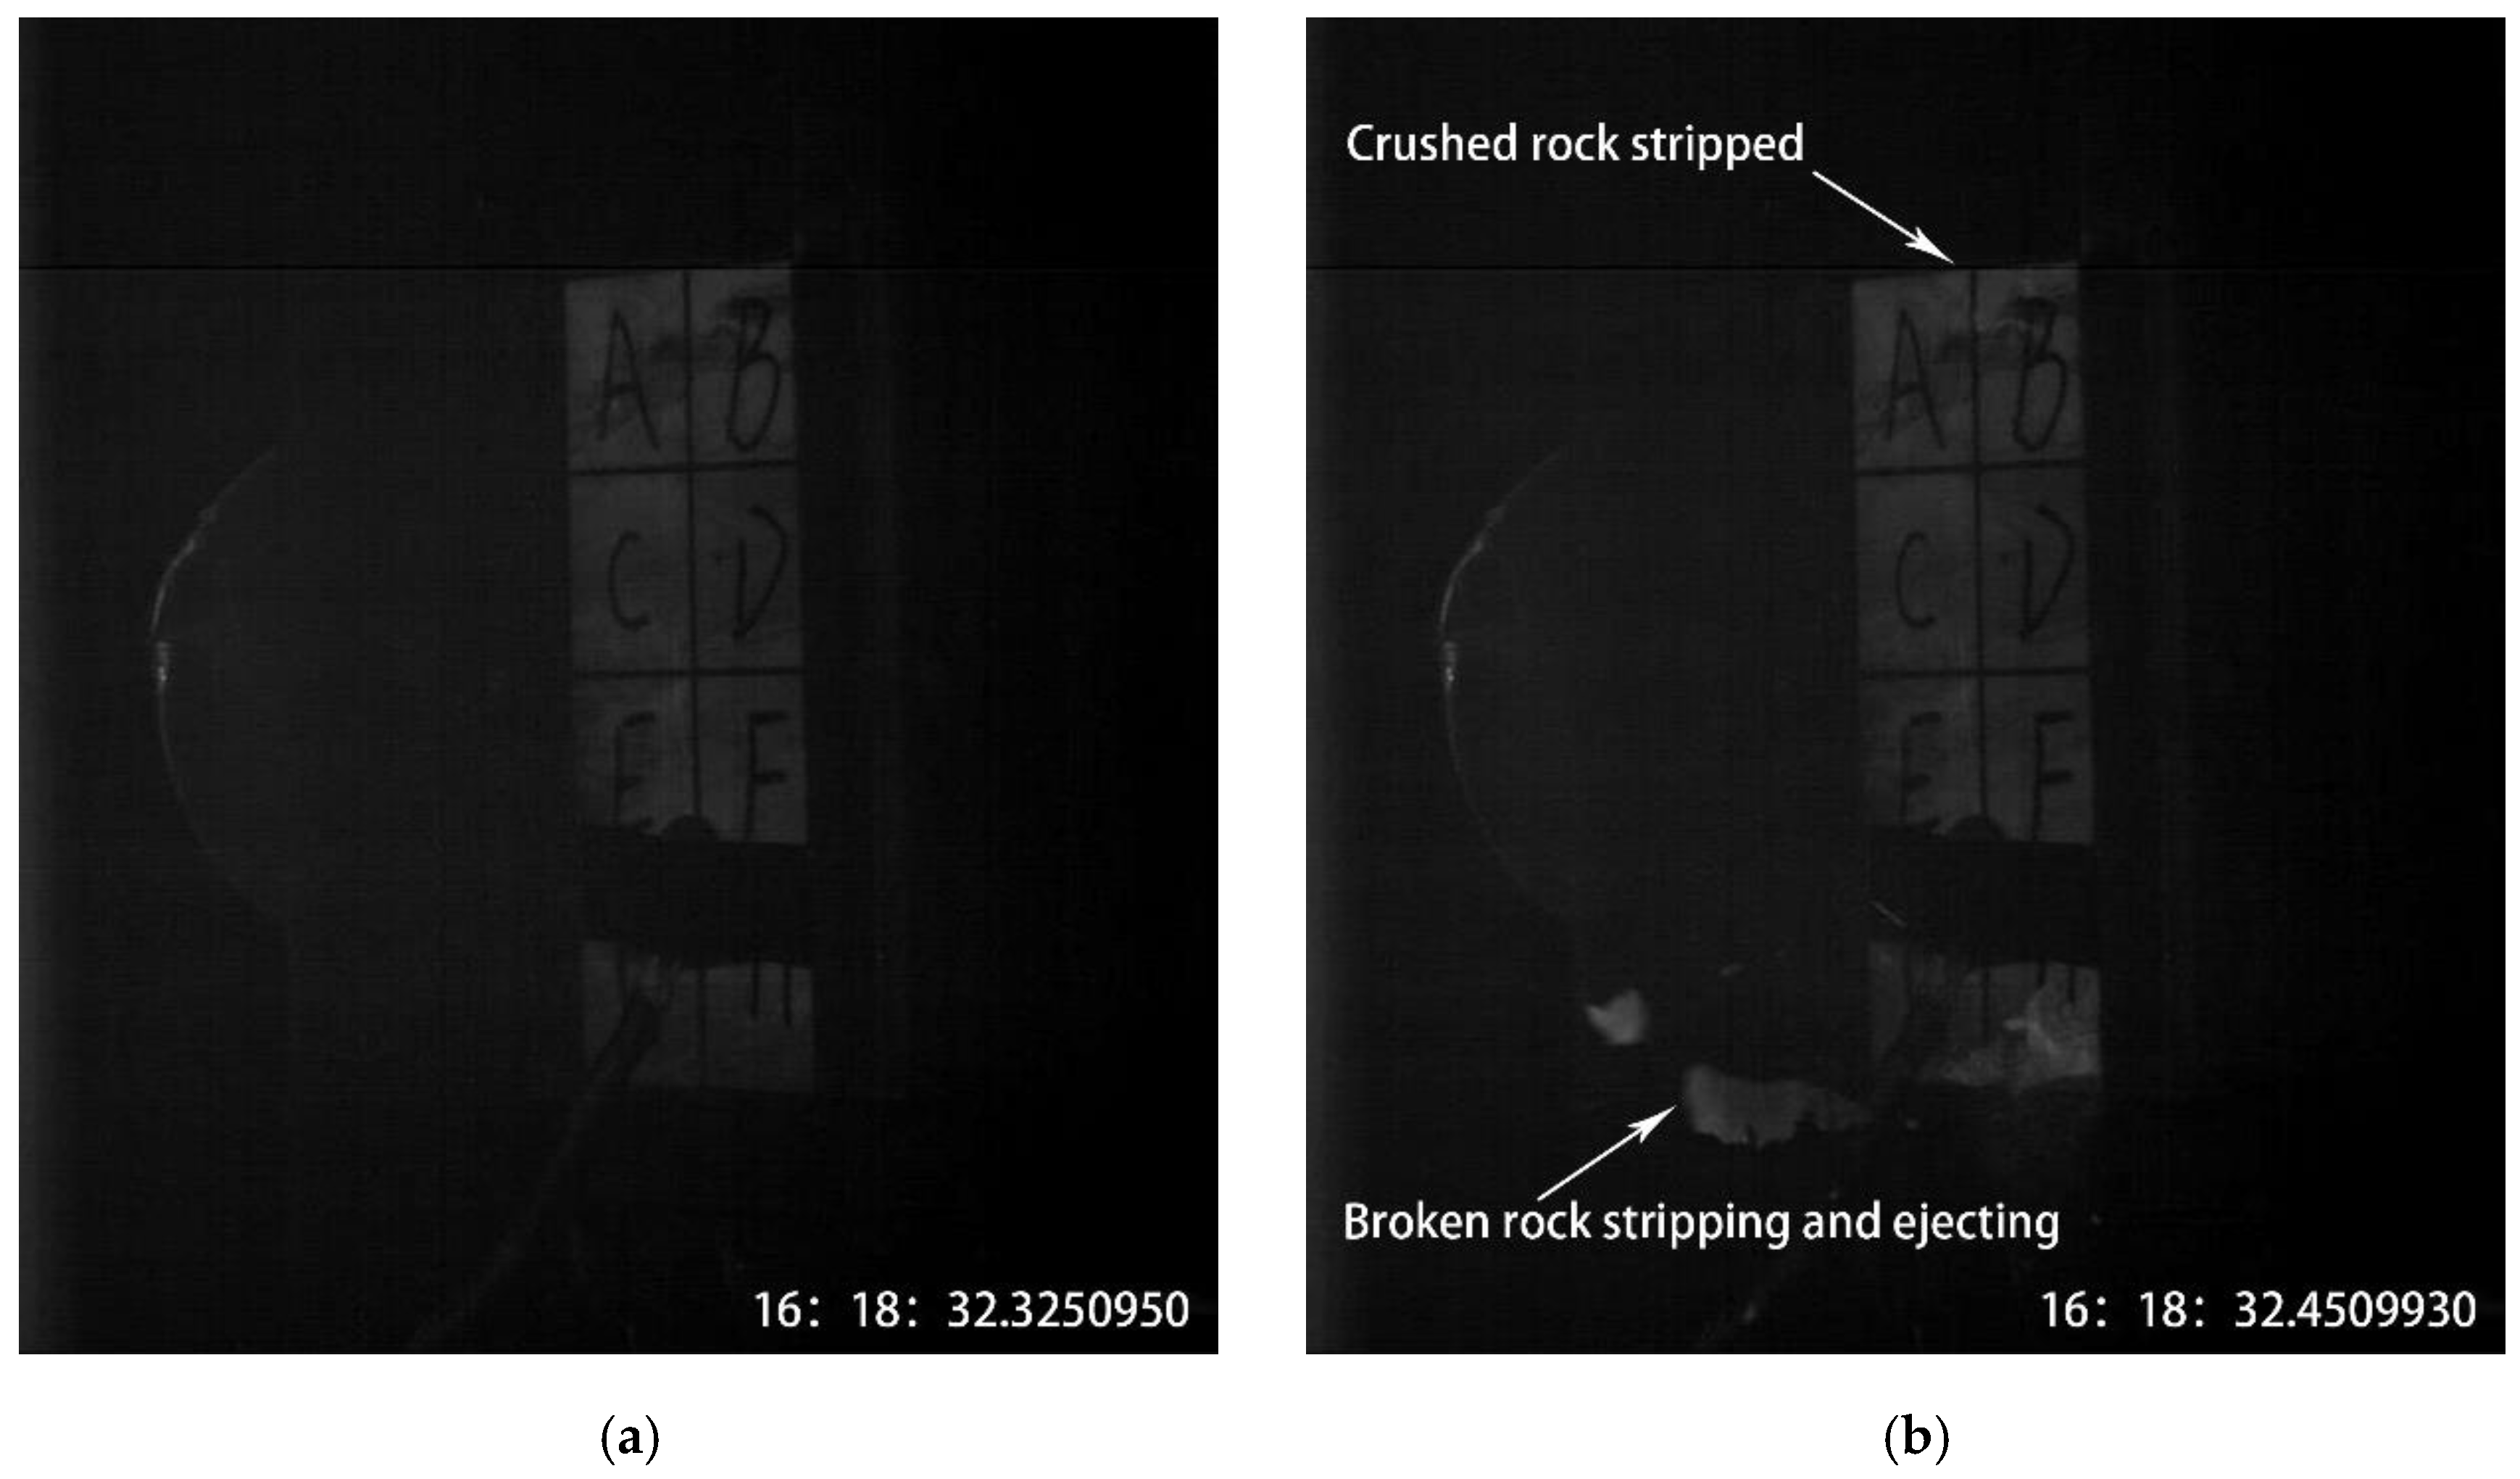
The high-speed camera was used to record a TL-3 test specimen with a typical rockburst phenomenon of severe failure on the free surface. The rockburst test phenomenon is illustrated in Figure 6. The numbers representing duration (h: min: s) are displayed at the bottom of the figures.
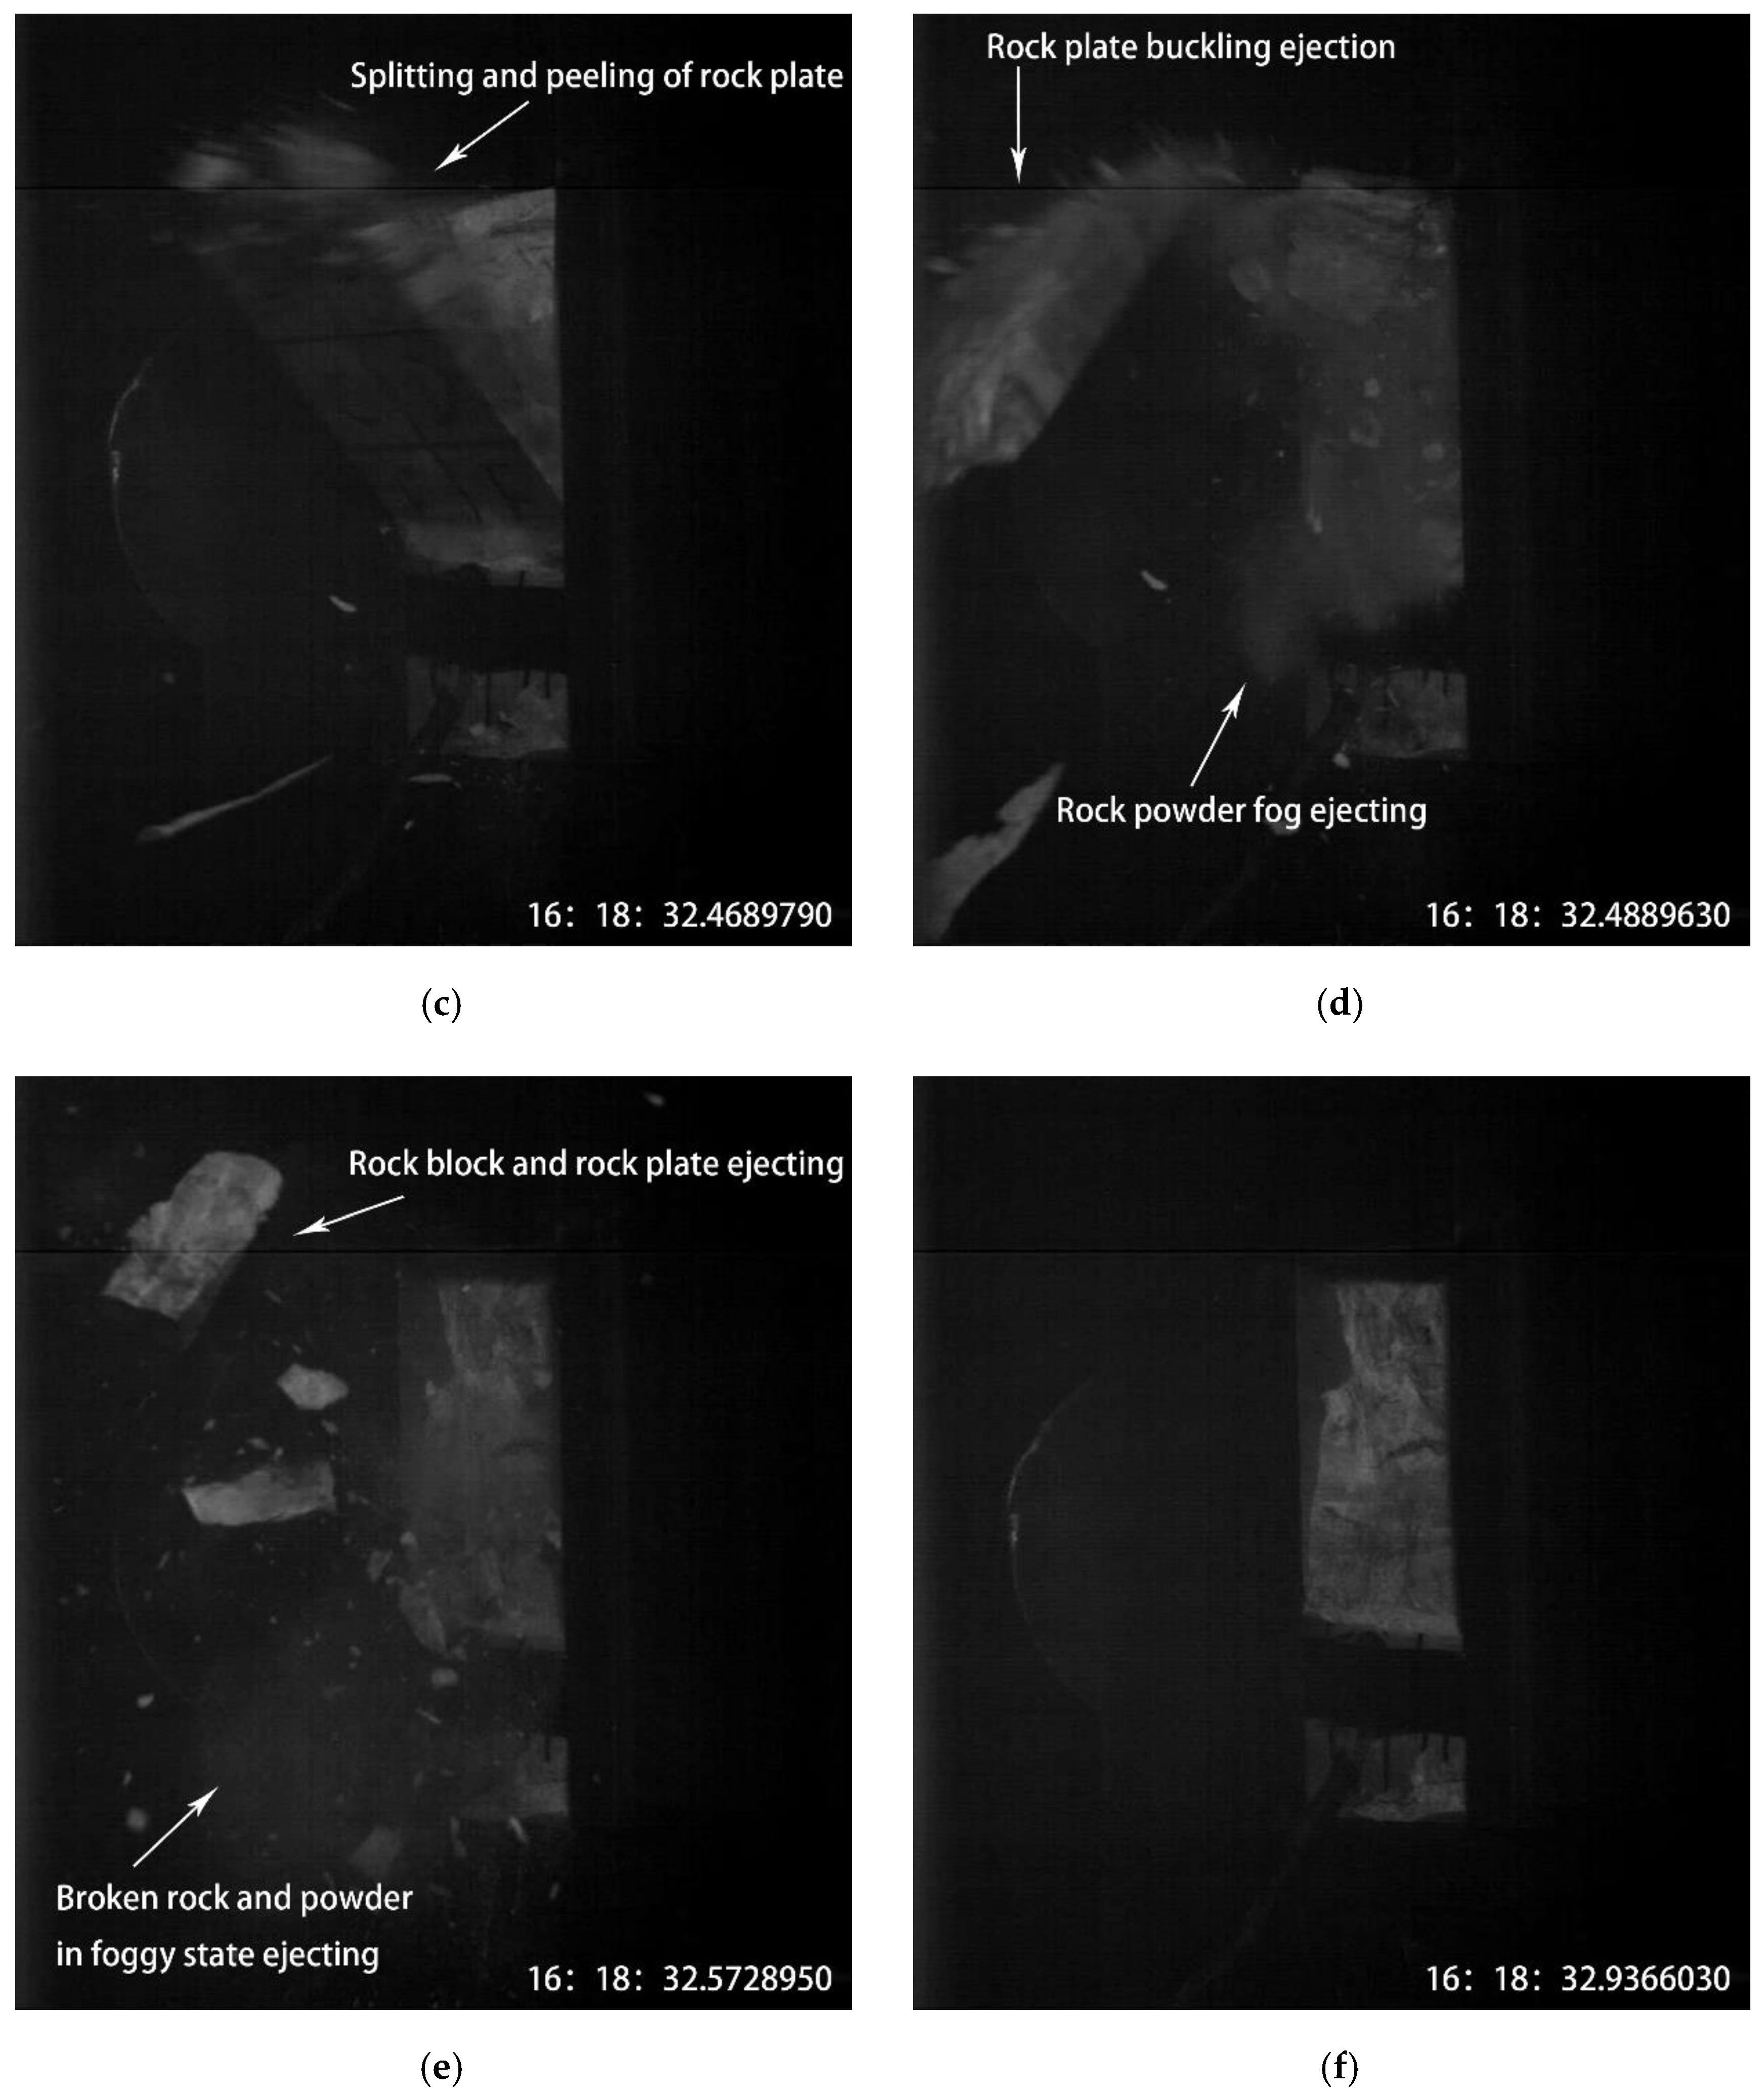
The surface of a sample before the rockburst is shown in Figure 6a, the exposed surface was intact and smooth. It was observed that: (i) 0.1 s later, the ejection phenomenon of some clastic rocks occurred on the free surface and the ejection of broken rocks from the bottom regions of the H is shown in Figure 6b; (ii) about 0.018 s later, when the rockburst occurred, a large area plate of the rock was split and peeled from exposed surface in covered regions of A to F, then a rock plate buckling ejection phenomenon was captured (Figure 6c,d); (iii) 0.084 s later, when the rockburst phenomenon became violent, a lot of rock fragments and powders in a foggy state ejected from the free surface were observed (Figure 6e,f), accompanied by a strong explosion noise. The violent failure formation on the free surface of a sample can be defined as the occurrence of a strong rockburst, and the entire violent rockburst phenomenon lasted for about 0.6 s.
3.2. Results
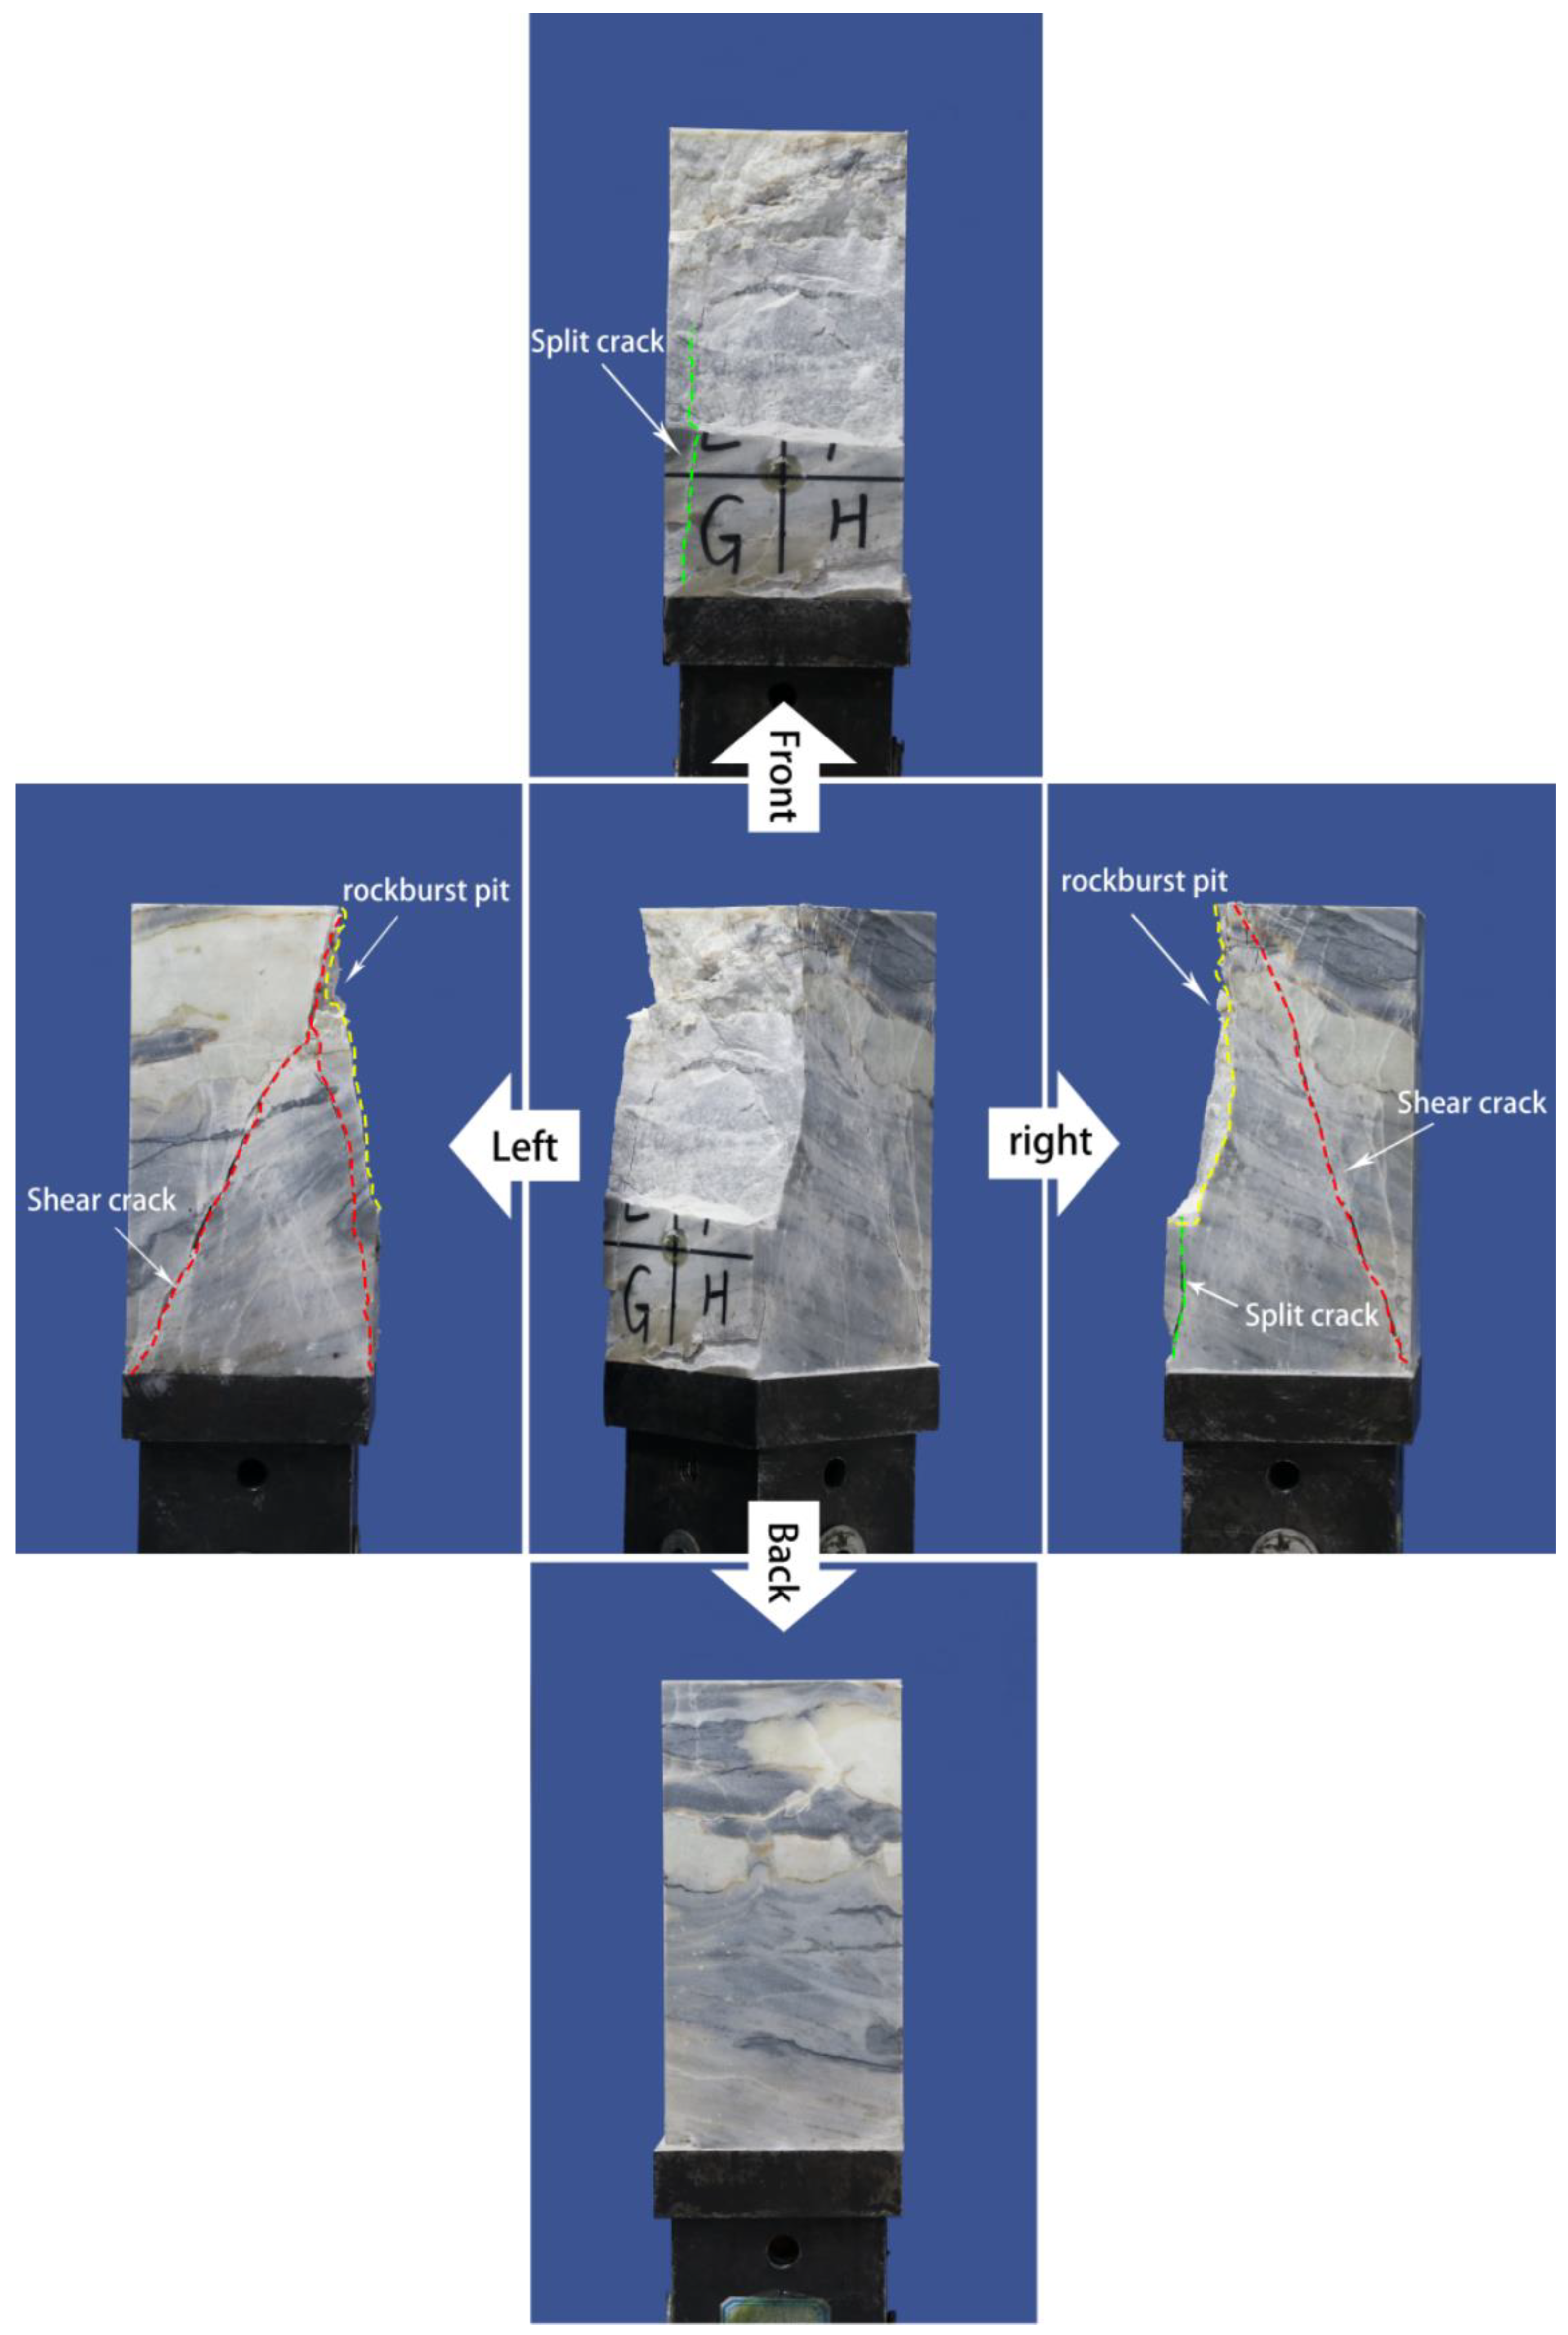
Figure 7 demonstrates the test results, which indicate that the surface of the specimen has split cracks parallel to the free surface and shear cracks penetrating diagonally. The unconstrained free surface became the rockburst failure surface. On the contrary, the other side of the additional constraint was still intact and smooth. The destruction mode can be divided into tensile and shear failure. Multiple split cracks stripped out the rock plate under tensile action and one or more shear cracks penetrated forming rock blocks under shear action. Ultimately, accumulated energy in the form of kinetic energy was released in a very short time, which caused the ejecting of rock block and rock plate and formed a typical V-type rockburst pit.
4. Wavelet Energy Evolution Characteristics
4.1. Wavelet Transform
The complex frequency component of acoustic emission signals represents multiple fracture modes simultaneously [43]. Different frequency components can reveal the internal damage process within the rock. The high-frequency component is correlated with the strength of the activity of the microscopic pores inside the rock, while the low-frequency component indicates that the rock either remains relatively stable or has large macroscopic cracks. The acoustic emission signals released during the trial belong to the typical non-stationary and discrete signals. For the non-stationary signals, the Fourier transform has a certain limitation, it is impossible to perform frequency domain analysis on the time axis [44]. However, the wavelet transform is a localization process of time-frequency, and the scaling translation operations allow it to gradually multi-scale refine the signal. The wavelet transform can meet the demand of time-frequency signal analysis by the time segmenting at high frequency and frequency segmenting at low frequency, which is more applicable to the analysis of non-stationary processes [45,46,47,48].
The function space L2(R) contains several functions. One of the functions or signal Ψ(x) is the wavelet that satisfies the following conditions:
The wavelet is a function or signal Ψ(x) in the function space L2(R) that satisfies the following conditions:
where R* = R-{0} expresses all the real numbers, except zero, is the Fourier transform of Ψ(x) and Ψ(x) is called the mother wavelet.
For the real number pairs (a, b), the parameter a is a non-zero real number and the function Ψ(a, b)(x) is called a continuous wavelet function dependent on the parameter (a, b) generated by the mother wavelet Ψ(x), or wavelet, and its formula is:
where b is called the translation factor, and a is called the scaling factor.
The signal f(x) can implement the continuous wavelet transform by the following:
Its inverse transformation (reconstructed signal) can be calculated as:
The signal f(x) can accomplish discrete wavelet transform by the following:
Its inverse transformation (reconstructed signal) can be defined as:
where C is a signal-independent constant.
The wavelet functions are diverse and the appropriate wavelet functions need to be chosen according to the criteria of support length, symmetry, and regularity. Thus, to obtain the reconstructed sub-signals of different frequency bands, the original signal employed was a wavelet transform to decompose and reconstruct. The dominant frequency band was defined by quantifying the energy value of each frequency segment of the reconstructed sub-signals in this article. Furthermore, the different frequency bands’ evolution characteristics of the AE energy proportions were analyzed, revealing the internal damage law of the rock during the rockburst simulation test.
4.2. Remove Zero Data Processing
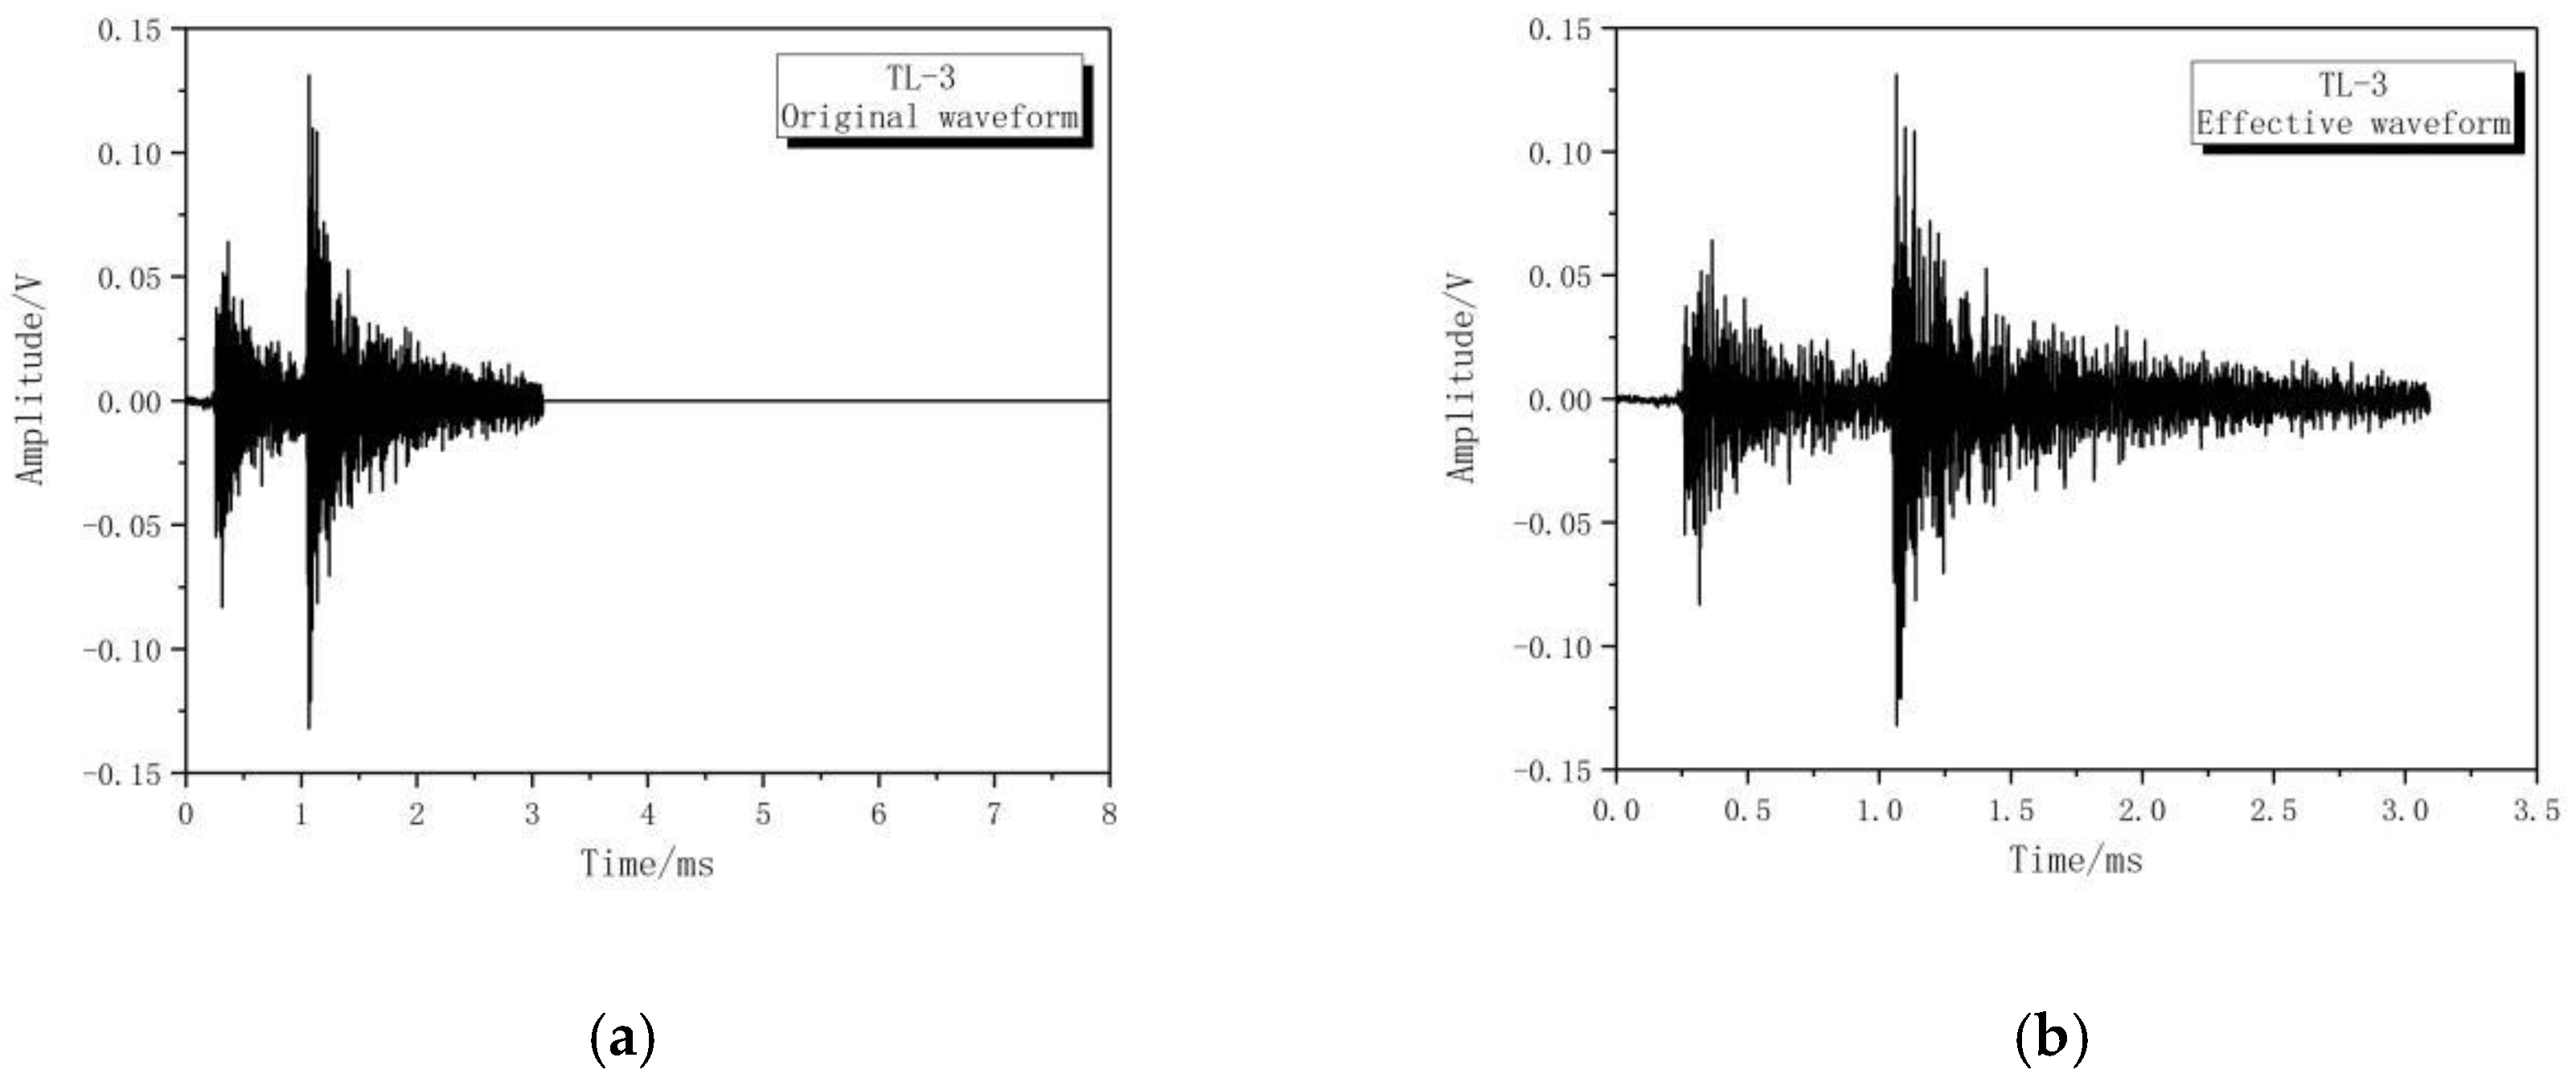
The acoustic emission signal is a burst signal. In this test, each waveform file contains 8192 lines of data. The duration of a single signal is 8.192 ms, during this process, a large amount of null data exists at the tail end of the waveform signal. The original waveform needs to de-zero and extract the effective waveform component to improve the computational efficiency. The result of removing zero processing was shown in Figure 8.
4.3. Wavelet Energy Analysis
Wavelet decomposition was performed by using the tree algorithm. During the first-layer decomposition, to obtain a set of low-frequency coefficients and high-frequency coefficients, the original signal needs to be fed into a hybrid filter (including a low-pass filter and high-pass filter). The low-frequency coefficients are then used as a signal input filter in the second layer of decomposition, yielding the next set of low-frequency and high-frequency coefficients. In this way, computing halts when the specified grading level is reached. The mathematical expression can be shown as:
where G represents the low-pass filter, and H represents the high-pass filter. The matrix is used to represent them. The original signal can be regarded as level 0 for the low-frequency coefficient a0 = (f0, f1, …, fn).
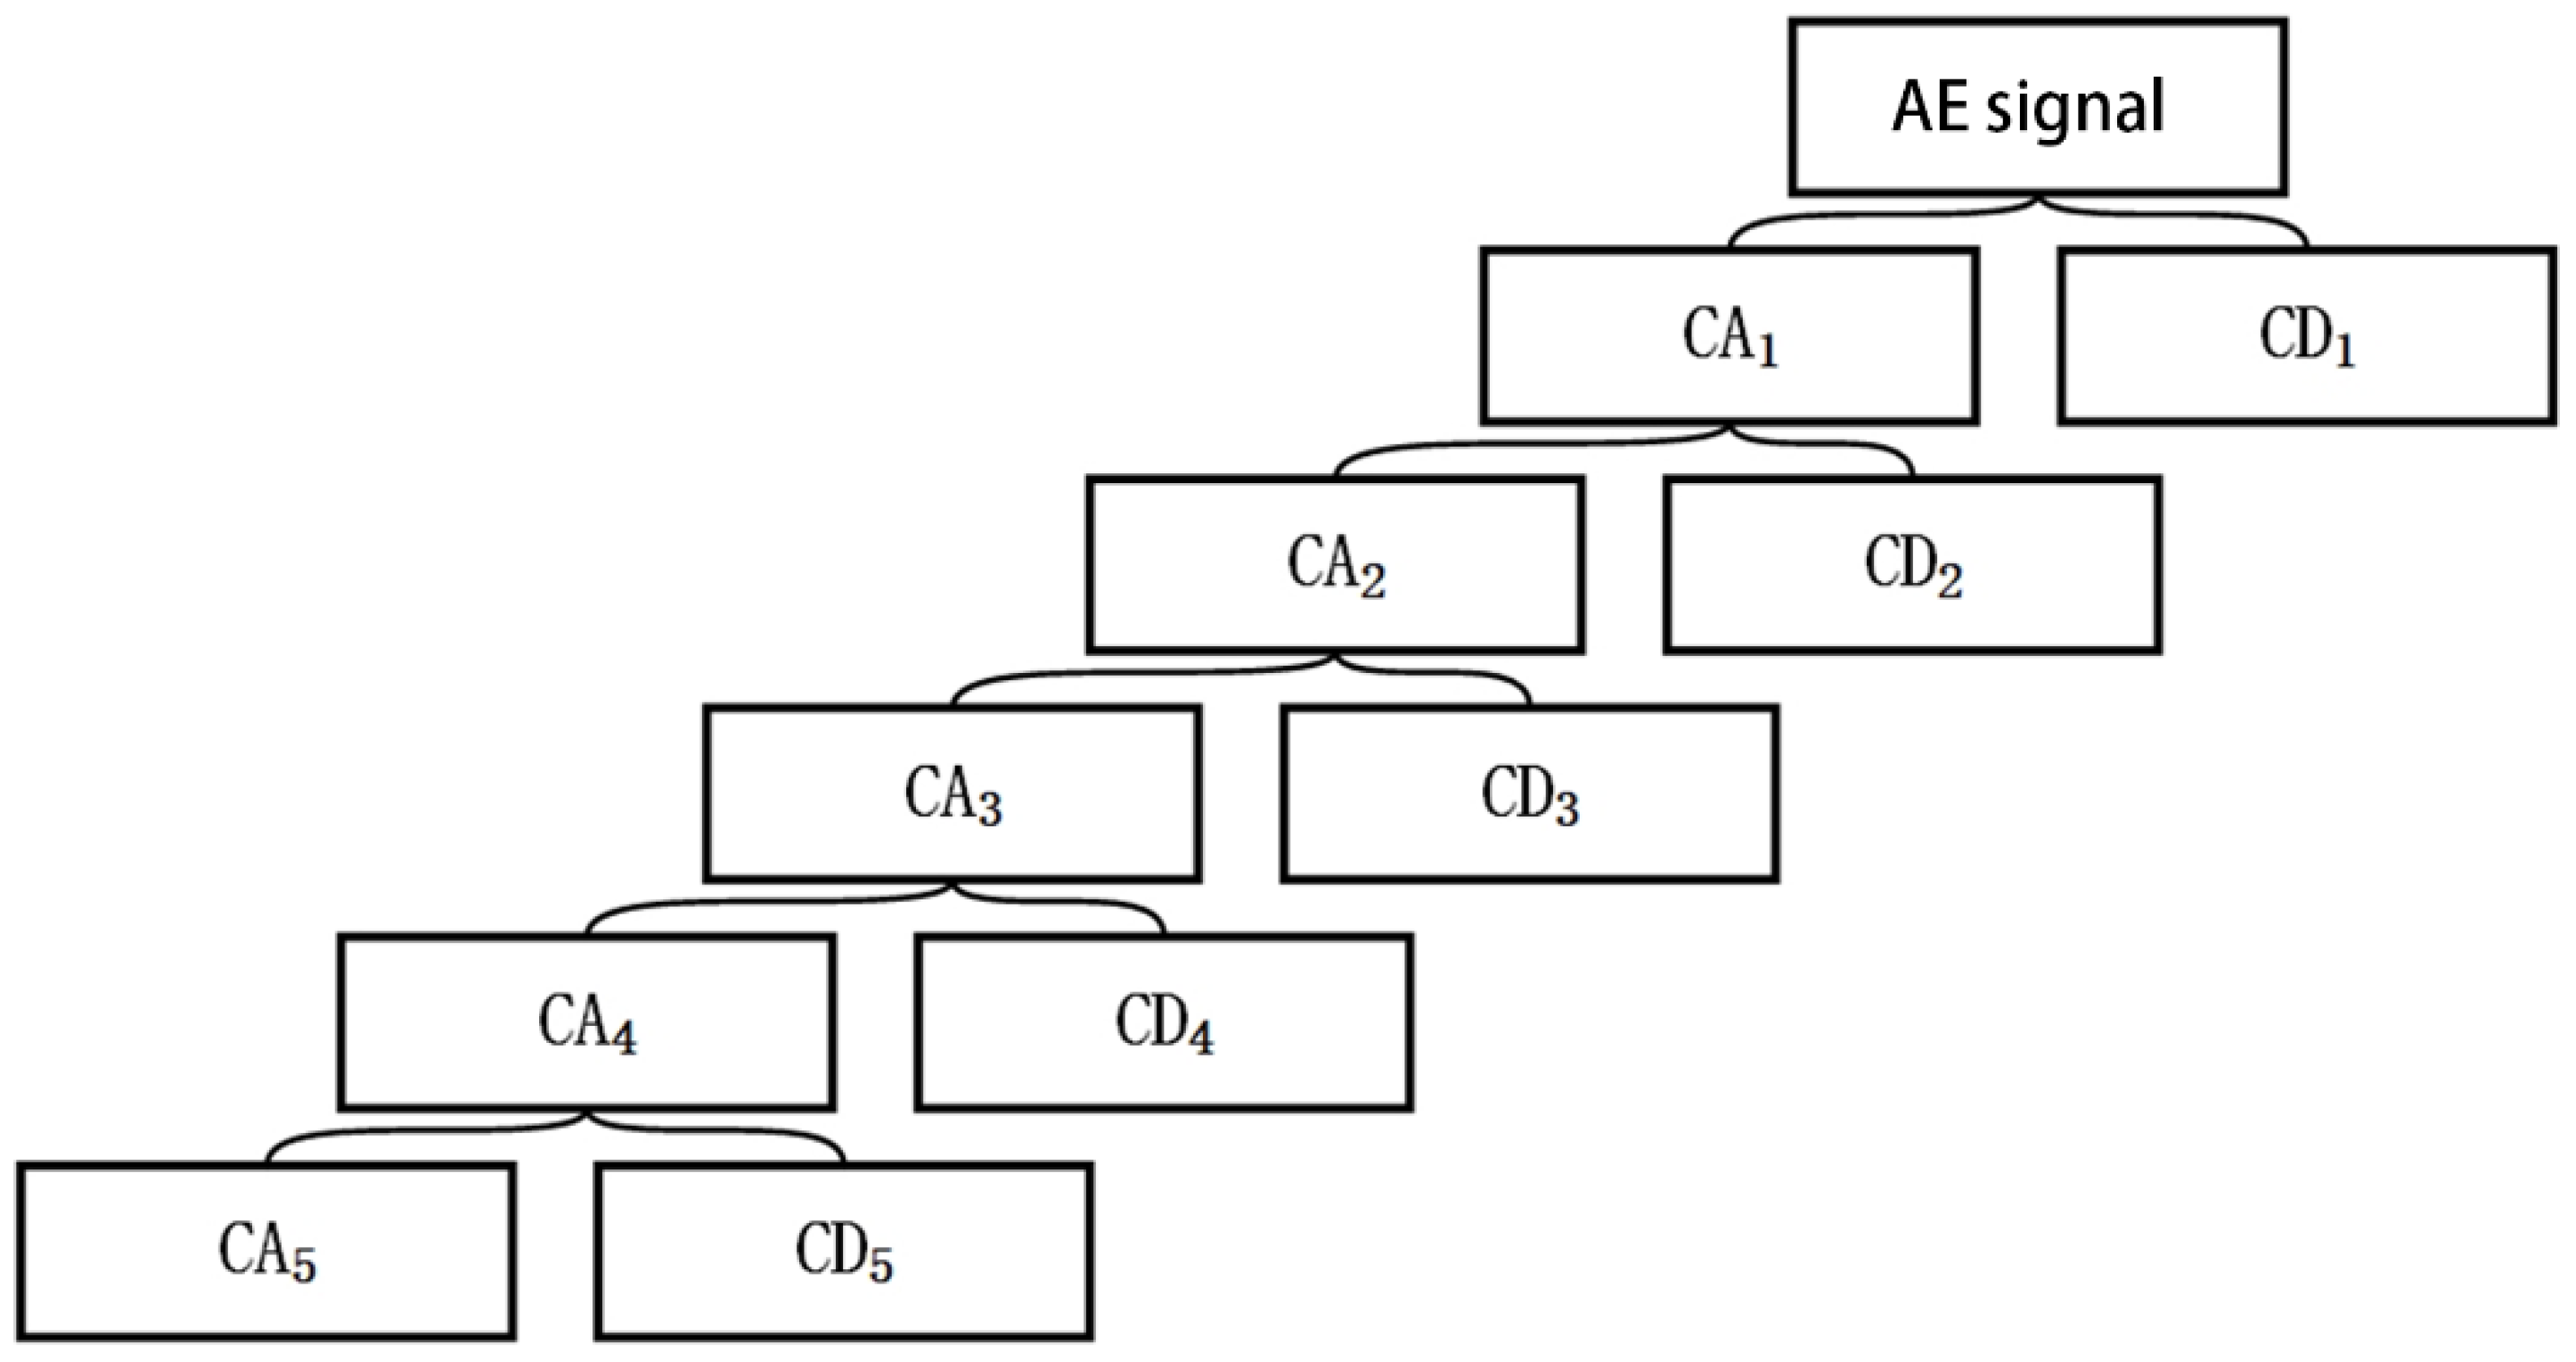
In this test, the effective AE signals in the frequency spectrum of 0~500 kHz were subjected to a five-layer wavelet decomposition operation and obtained six frequency band sub-signals (the frequency range is shown in Table 1). The wavelet basis function adopts the symmetric wavelet sym2. The wavelet decomposition structure tree is shown in Figure 9. Therein, CA is the low-frequency sub-signal of wavelet decomposition, and CD is the high-frequency sub-signal. Numbers 1 to 5 are the numbers of decomposition layers. For example, CA5 represents the low-frequency sub-signal of wavelet decomposition in layer 5, and CD5 represents the high-frequency sub-signal of wavelet decomposition in layer 5.
The wavelet decomposition coefficients were reconstructed to obtain the optimized signal Si with different frequency ranges. The energy values of the reconstructed signal were quantified as per Formula (8) and the signal energy distribution coefficients were calculated for each frequency band. Meanwhile, the dominant frequency band was defined.
where i = 1, 2, 3, 4, 5, 6. Here, Sik is the amplitude of the k sampling point of the layer i signal; m is the number of the signal discrete sampling points; Ei is the corresponding energy of Si; Ki is the AE signal energy distribution coefficients of each frequency band and the dominant frequency band is established as the highest energy distribution coefficient’s frequency band.
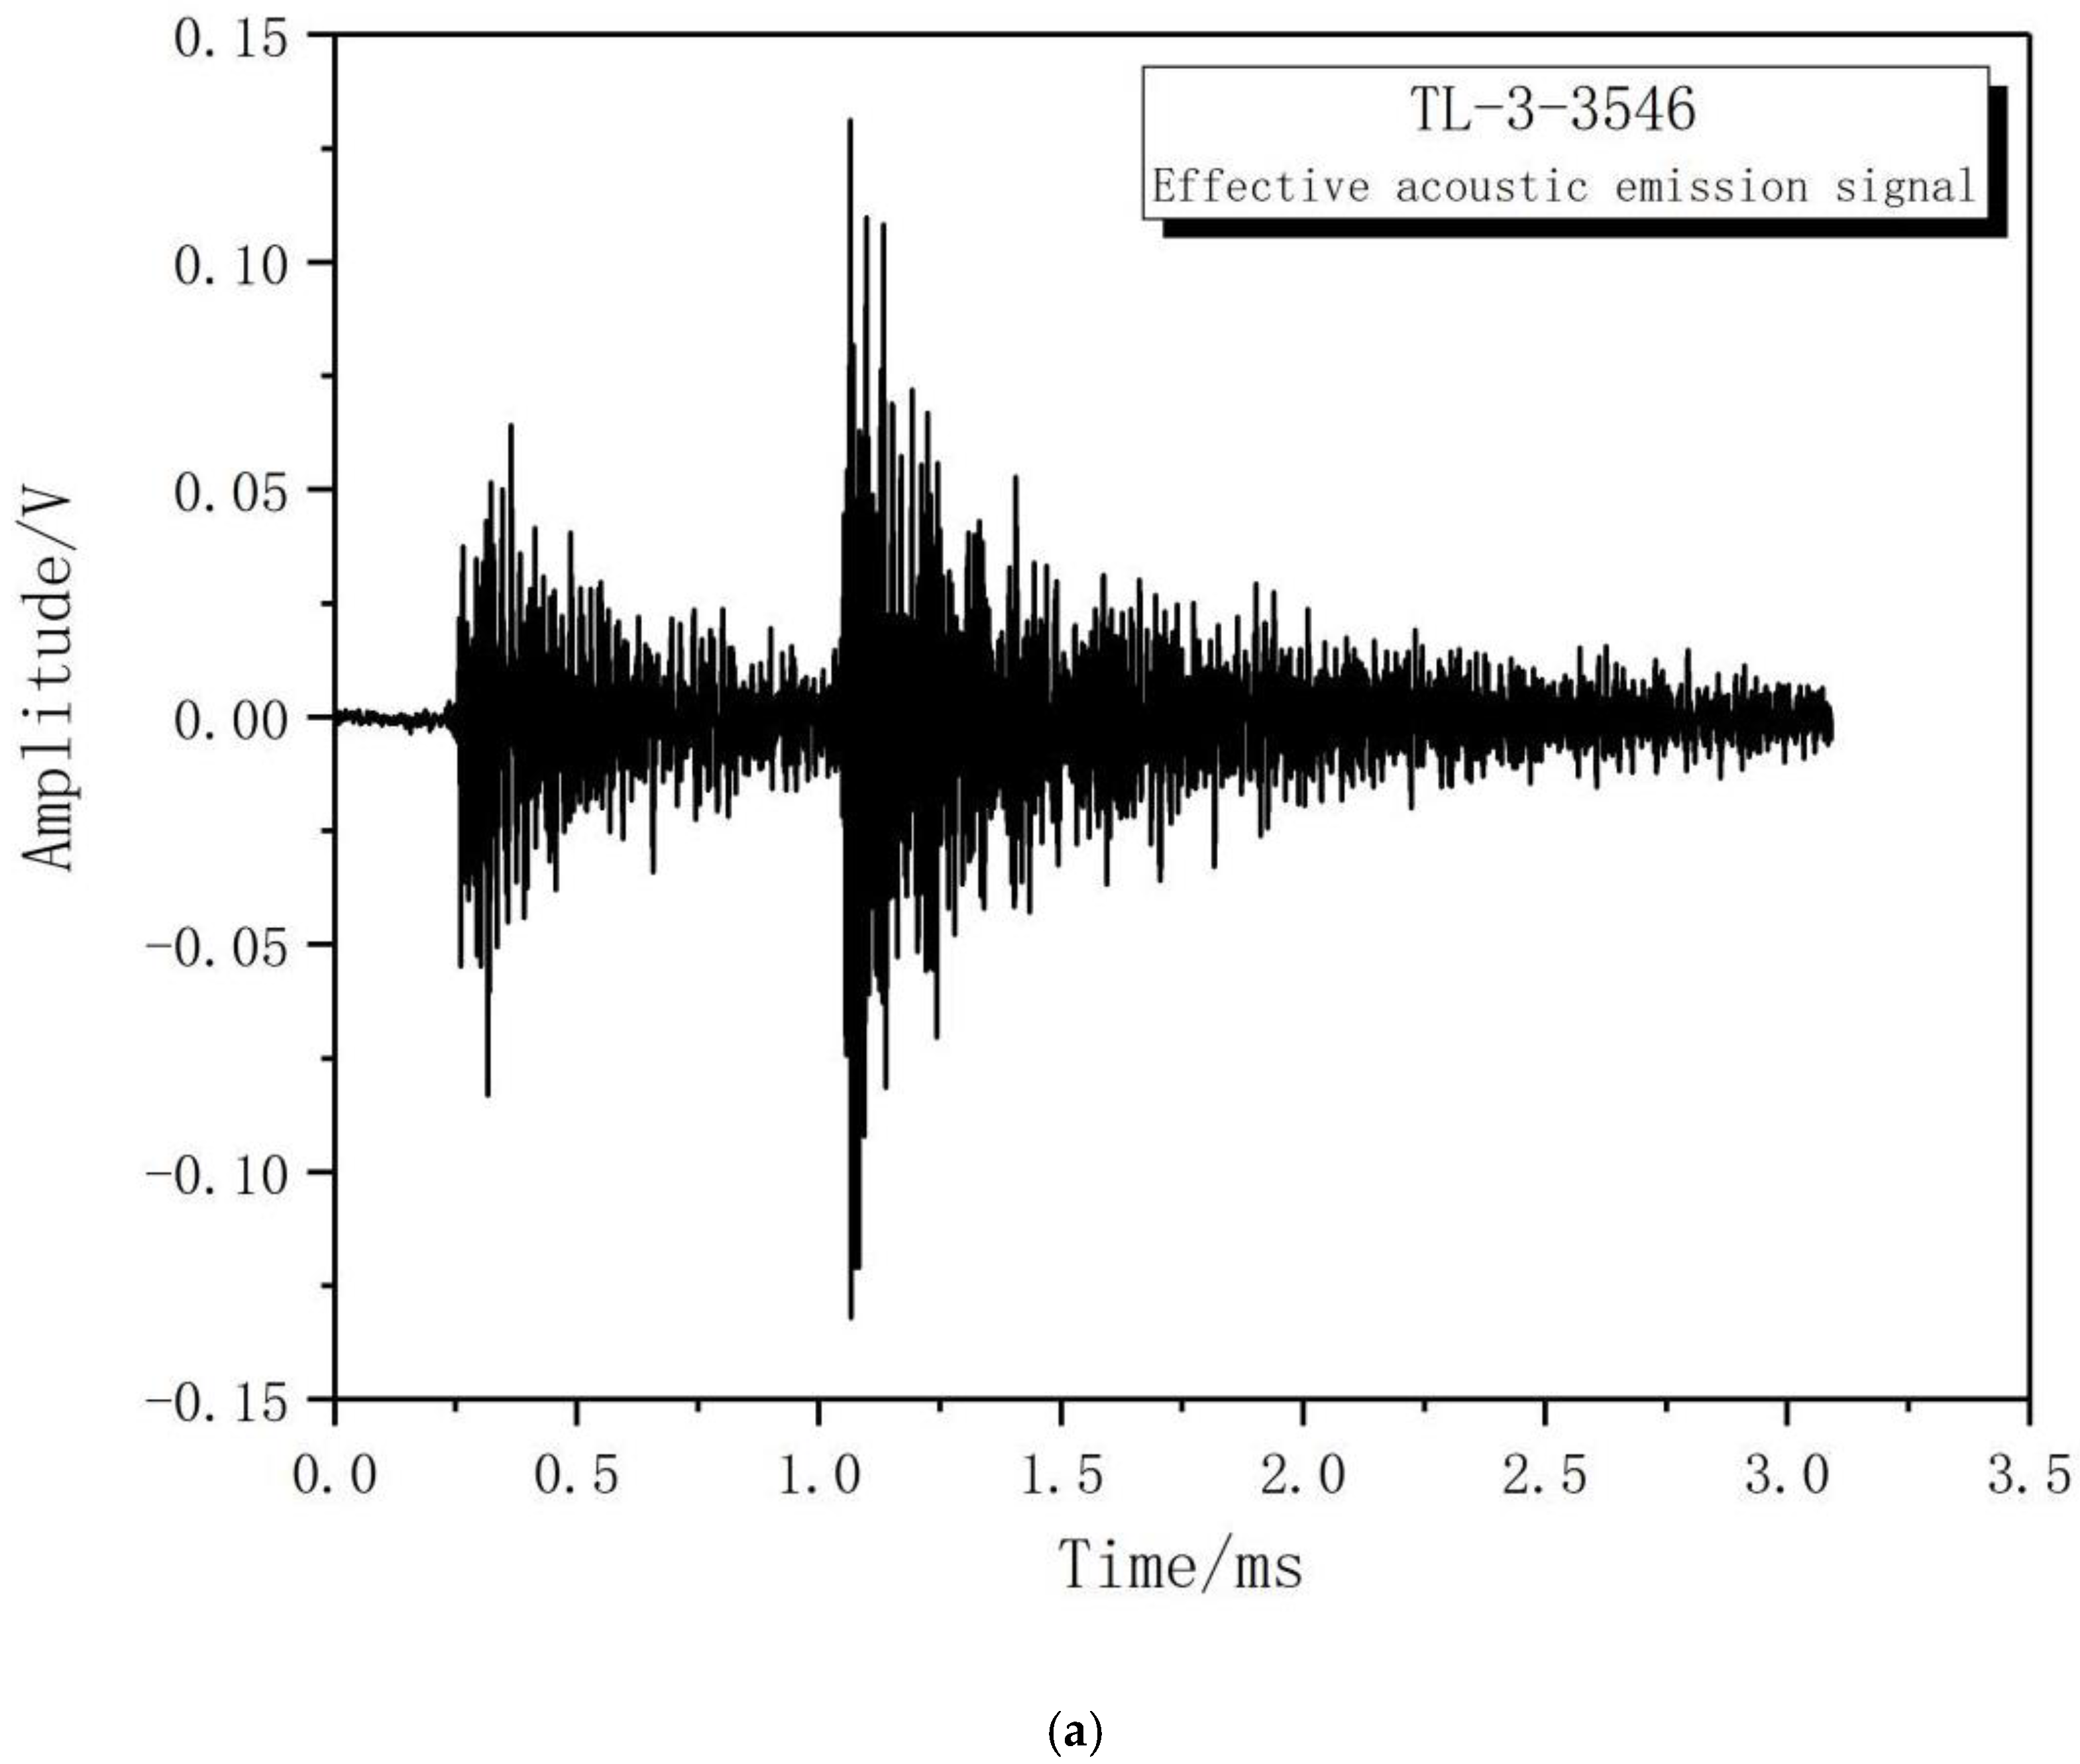
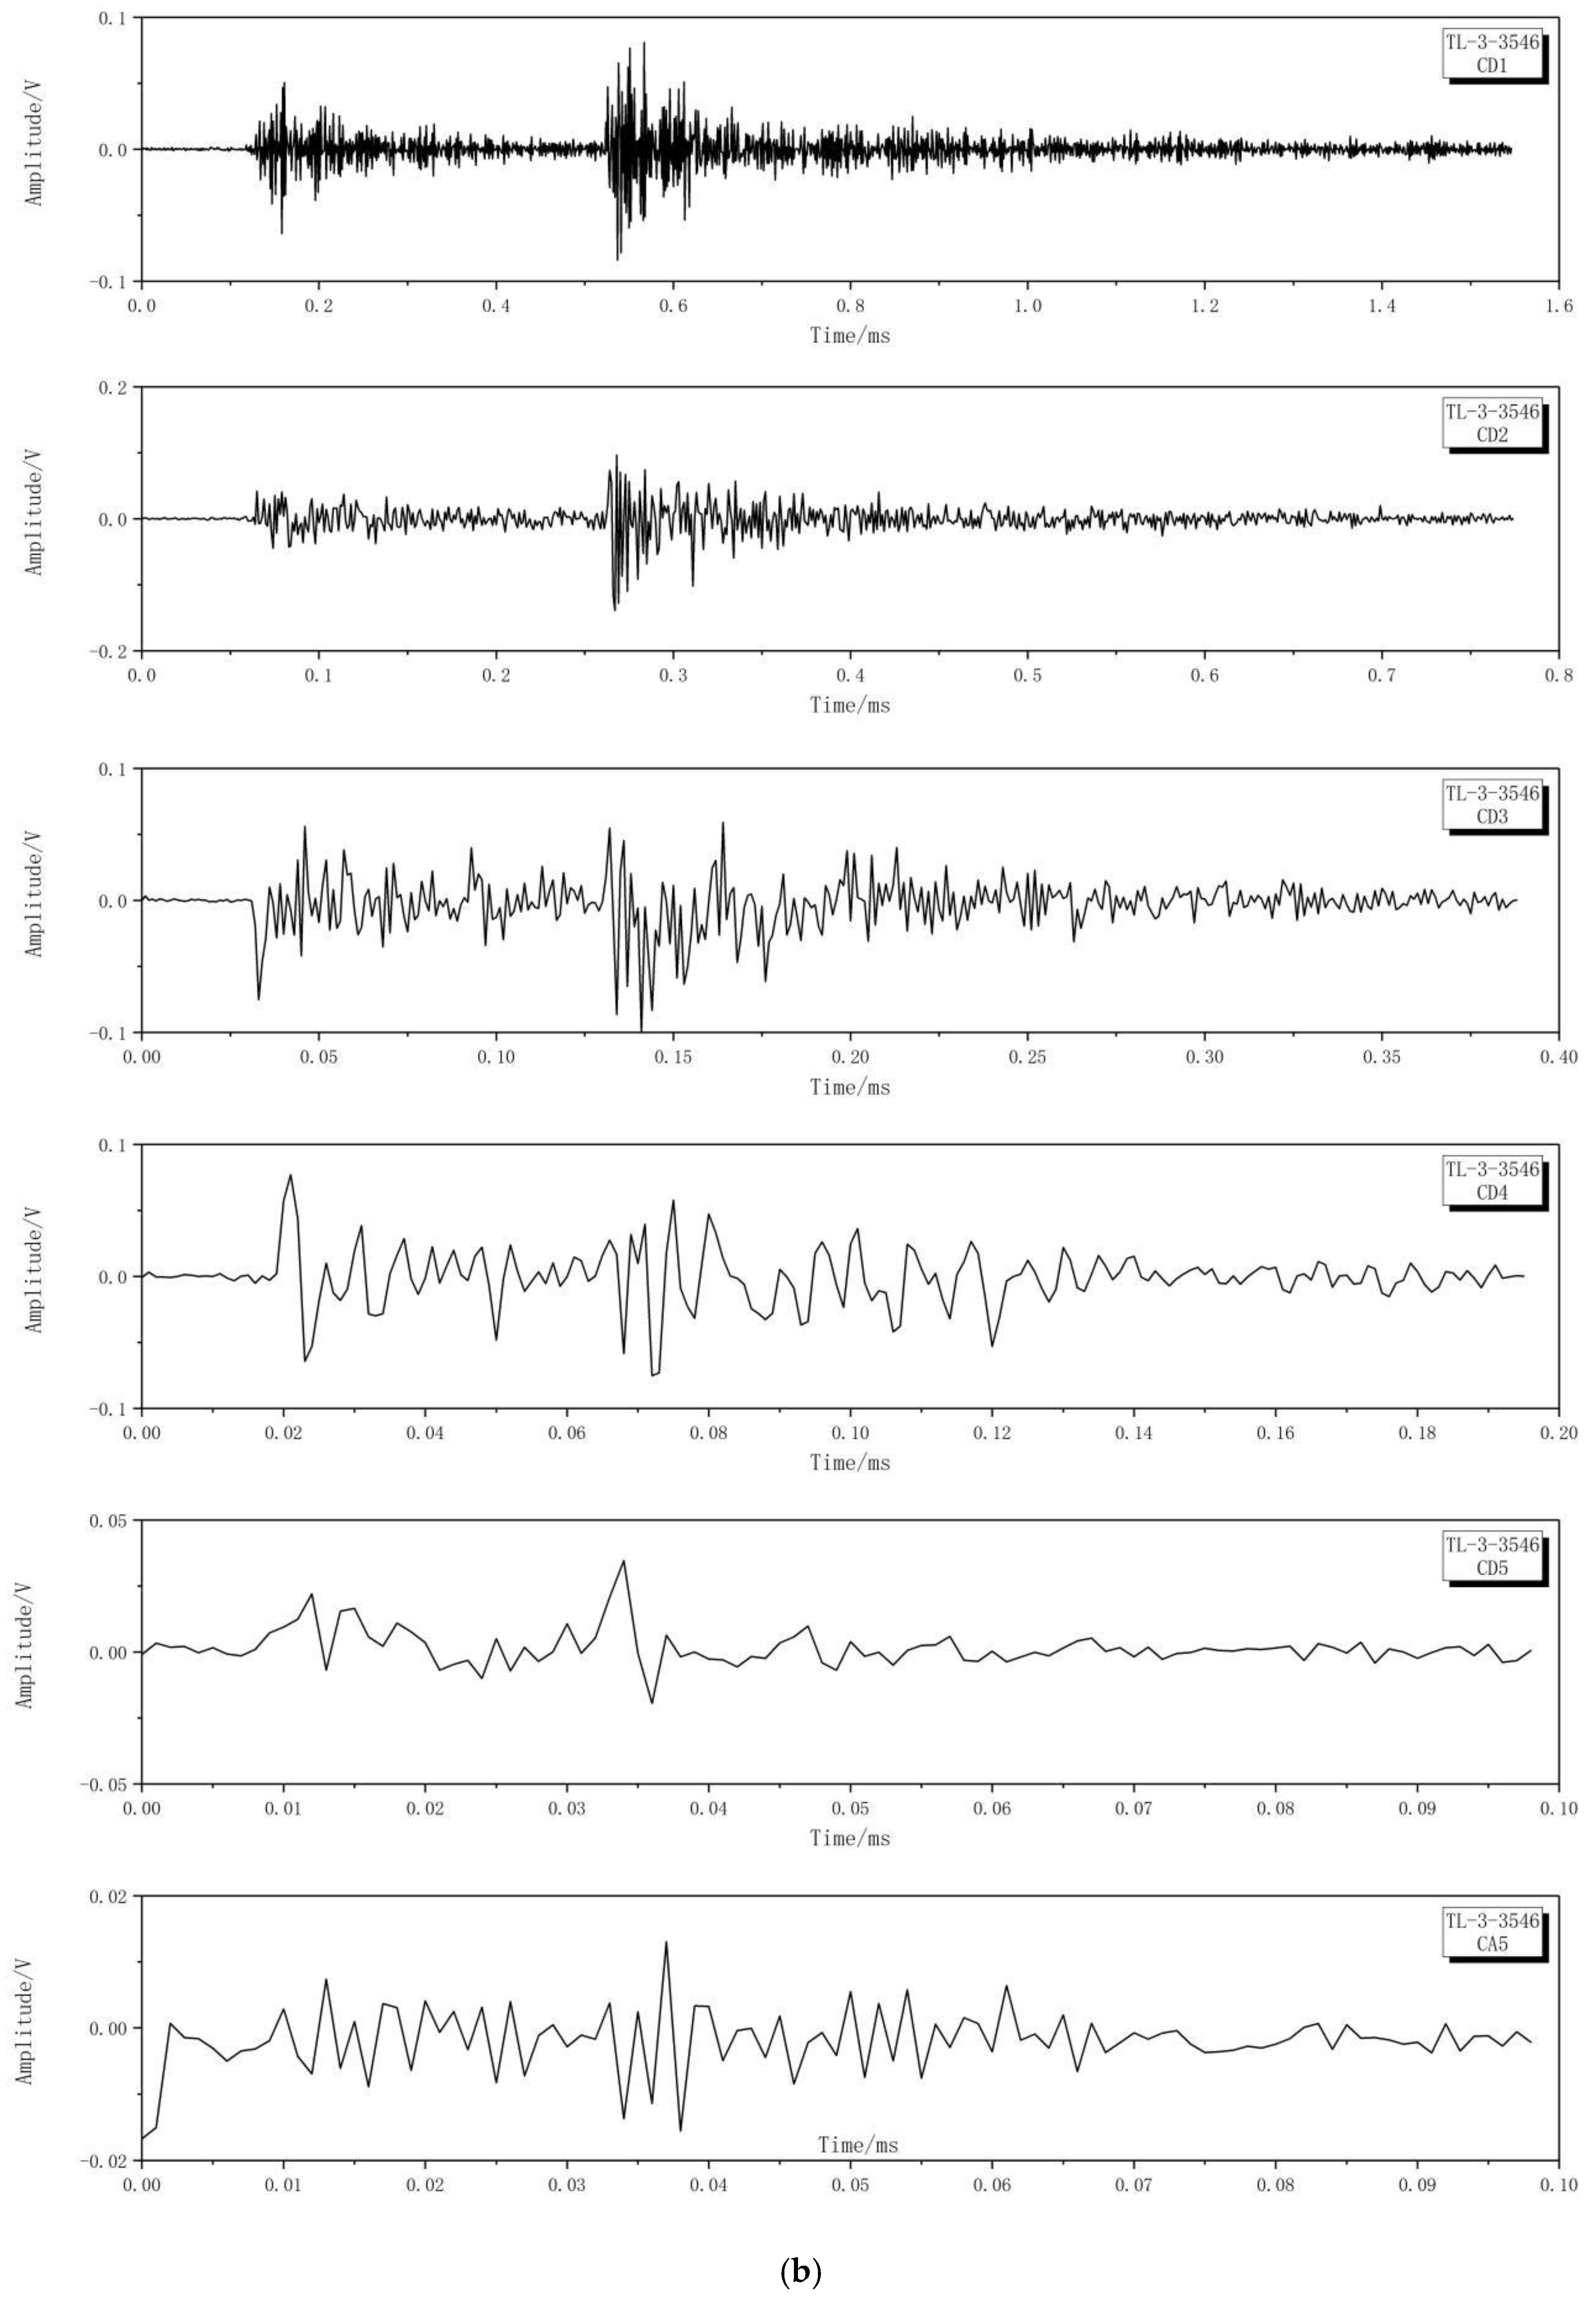
Accordingly, the 3546th effective acoustic emission signal was extracted during the whole test (see Figure 10a) and the signal was carried out as a five-layer wavelet decomposed and reconstructed (see Figure 10b). The reconstructed signal of each frequency band and its energy distribution coefficient was calculated as shown in Table 2.
As shown in Table 2, the dominant frequency band of the TL-3-3546th acoustic emission signal is CD2 (125~250 kHz) and its energy value is 0.2812. The energy distribution coefficient is 0.3990, which accounts for the largest proportion.
4.4. Characteristics of the Wavelet Energy Evolution
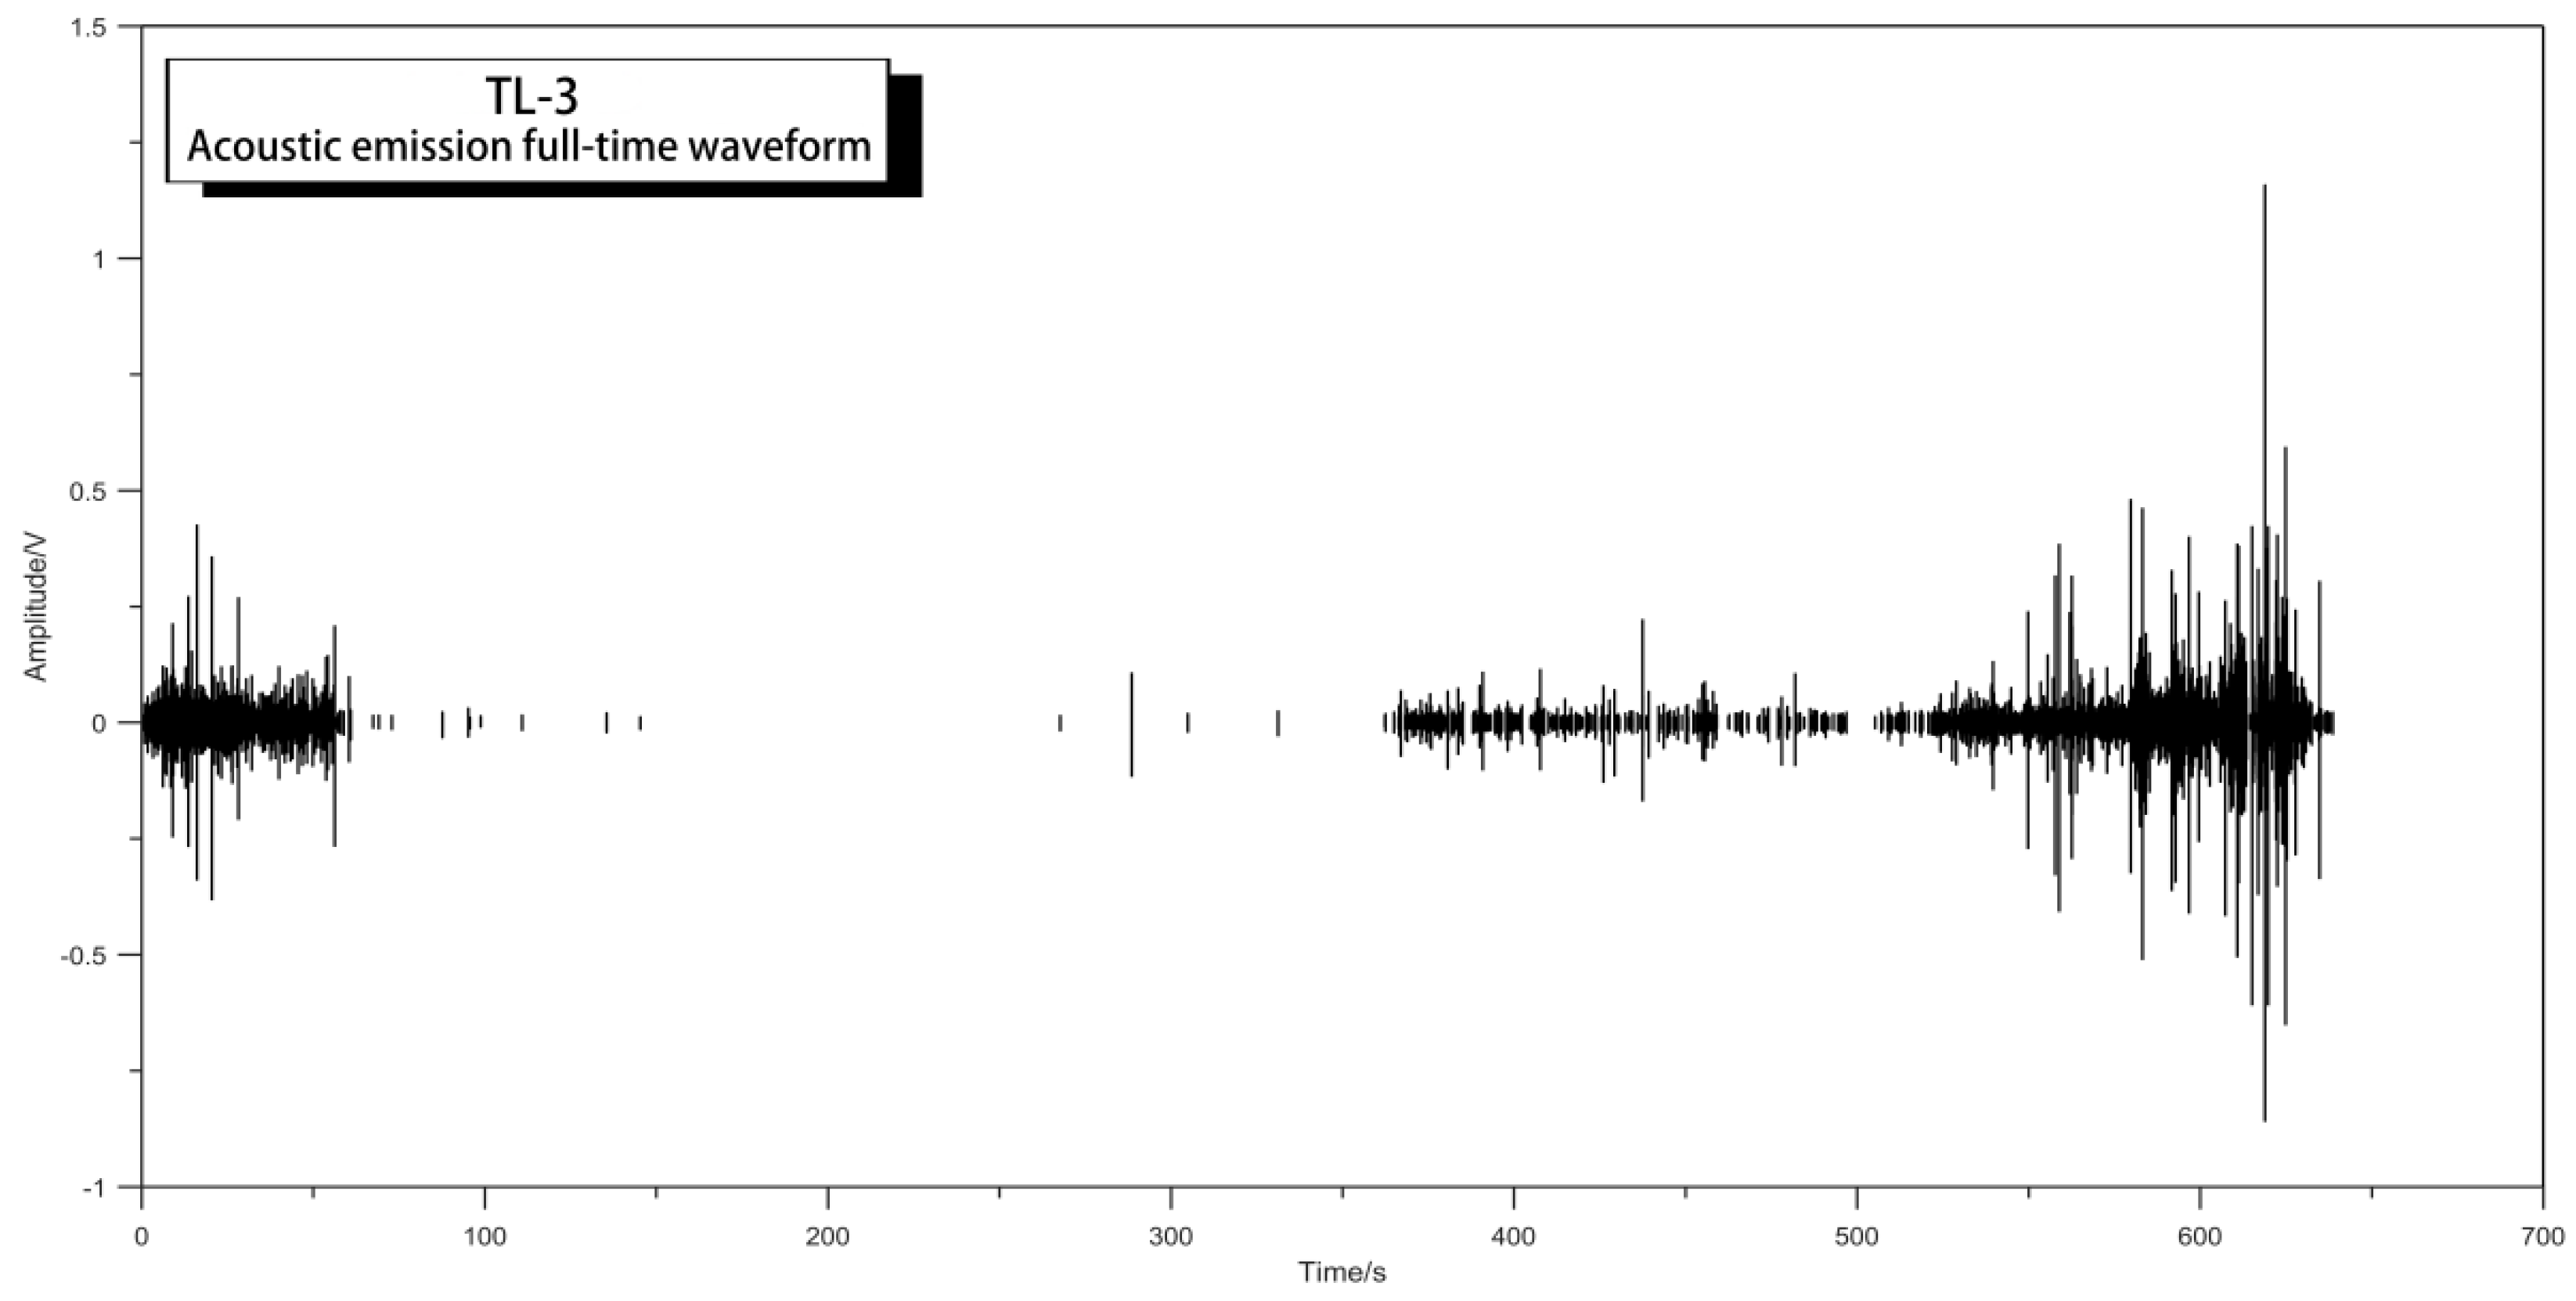
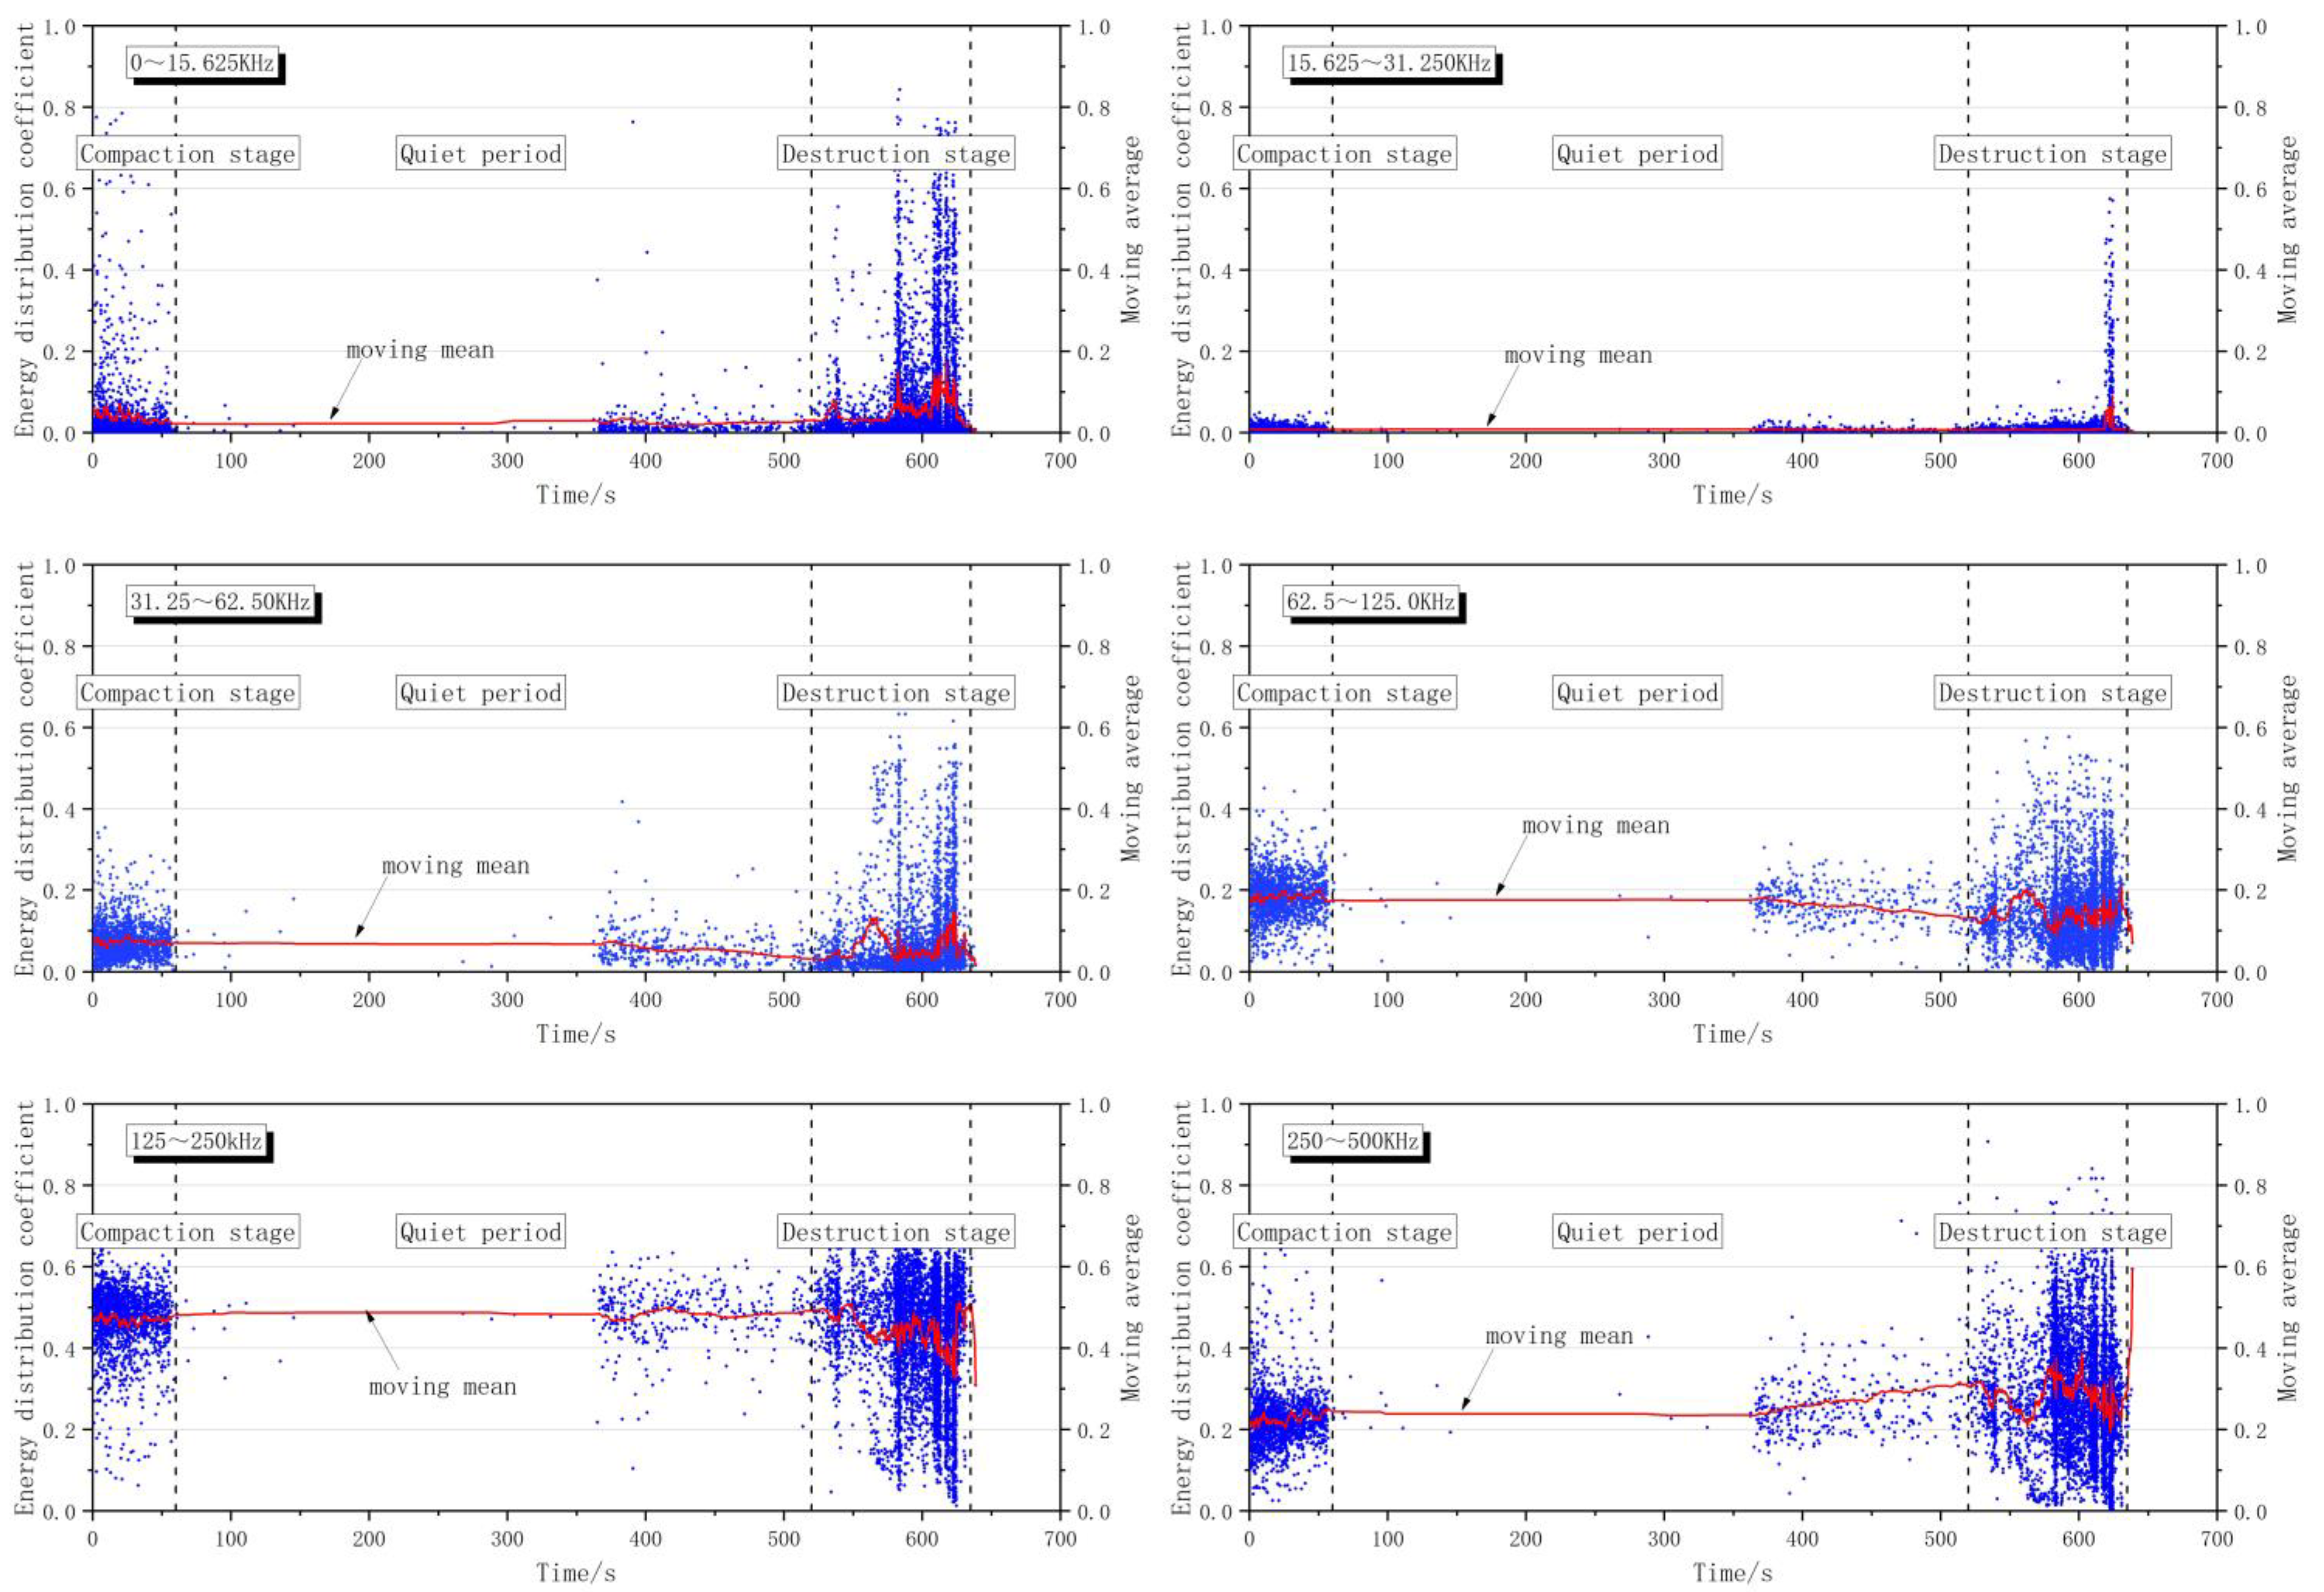
During the entire rockburst test, the wavelet energy evolution characteristics of the TL3 specimen’s AE signals were analyzed. Firstly, all the effective acoustic emission signals were extracted, and the full-time waveform was plotted, which is shown in Figure 11. Then, the acoustic emission signals were subjected to a five-layer wavelet decomposed and reconstructed to obtain six frequency band sub-signals. Finally, the wavelet energy and its energy distribution coefficients of different frequency band reconstructed signals were calculated, and the energy distribution coefficient evolution process of each frequency band was plotted. As shown in Figure 12, the moving average, marked by the red line, is to eliminate the randomness of the data and obtain a relatively smooth trend line.
Three distinct phases can be distinguished in the test process by combining the test phenomenon and the evolution law of the energy distribution coefficients to each frequency band. The three stages are the compaction stage (0~60 s), the quiet period (60~520 s), and the destruction stage (520~635 s).
According to Figure 12, for the frequency band of 0~15.625 kHz, the energy distribution coefficients are mainly concentrated below 0.2 and its moving average has multiple peaks in the destruction stage (up to 0.173). For the frequency band of 15.625~31.250 kHz, the energy distribution coefficients are largely concentrated below 0.1 and its moving average has a single peak in the destruction stage (up to 0.090). For the frequency band of 31.25~62.50 kHz, the energy distribution coefficients are principally concentrated around 0.07, its moving average decreases slowly (from 0.066 to 0.036) during the quiet period and shows peak type during the destruction phase (peak values are 0.131 and 0.146 respectively). For the frequency band of 62.5~125.0 kHz, the energy distribution coefficients are mainly concentrated around 0.18 and its moving average declines steadily at first (from 0.180 to 0.138) in the quiet period, and then rises. There are two peaks in the destruction stage (peak values are 0.202 and 0.208, respectively). For the frequency band of 125~250 kHz, the energy distribution coefficients are mostly concentrated around 0.47 and its moving average appears valley-type (valley value is 0.386 and 0.324, respectively) in the destruction stage. For the frequency band of 250~500 kHz, the energy distribution coefficients are largely concentrated around 0.23 and its moving average rises slowly (from 0.237 to 0.306) during the quiet period. The moving average changed from the valley type (valley value 0.208) to the peak type (peak value 0.388) during the destruction phase.
In terms of the density of the energy distribution coefficients, each frequency band appeared intensively in the compaction and destruction stages. From the perspective of the moving average, the energy distribution coefficients of each frequency band are different in the destruction stage, particularly, the trend in the 125~250 kHz frequency band shows a significant valley-type. In the whole process of the experiment, the energy distribution coefficients of the 125~250 kHz frequency band had a more obvious advantage than other frequency bands.
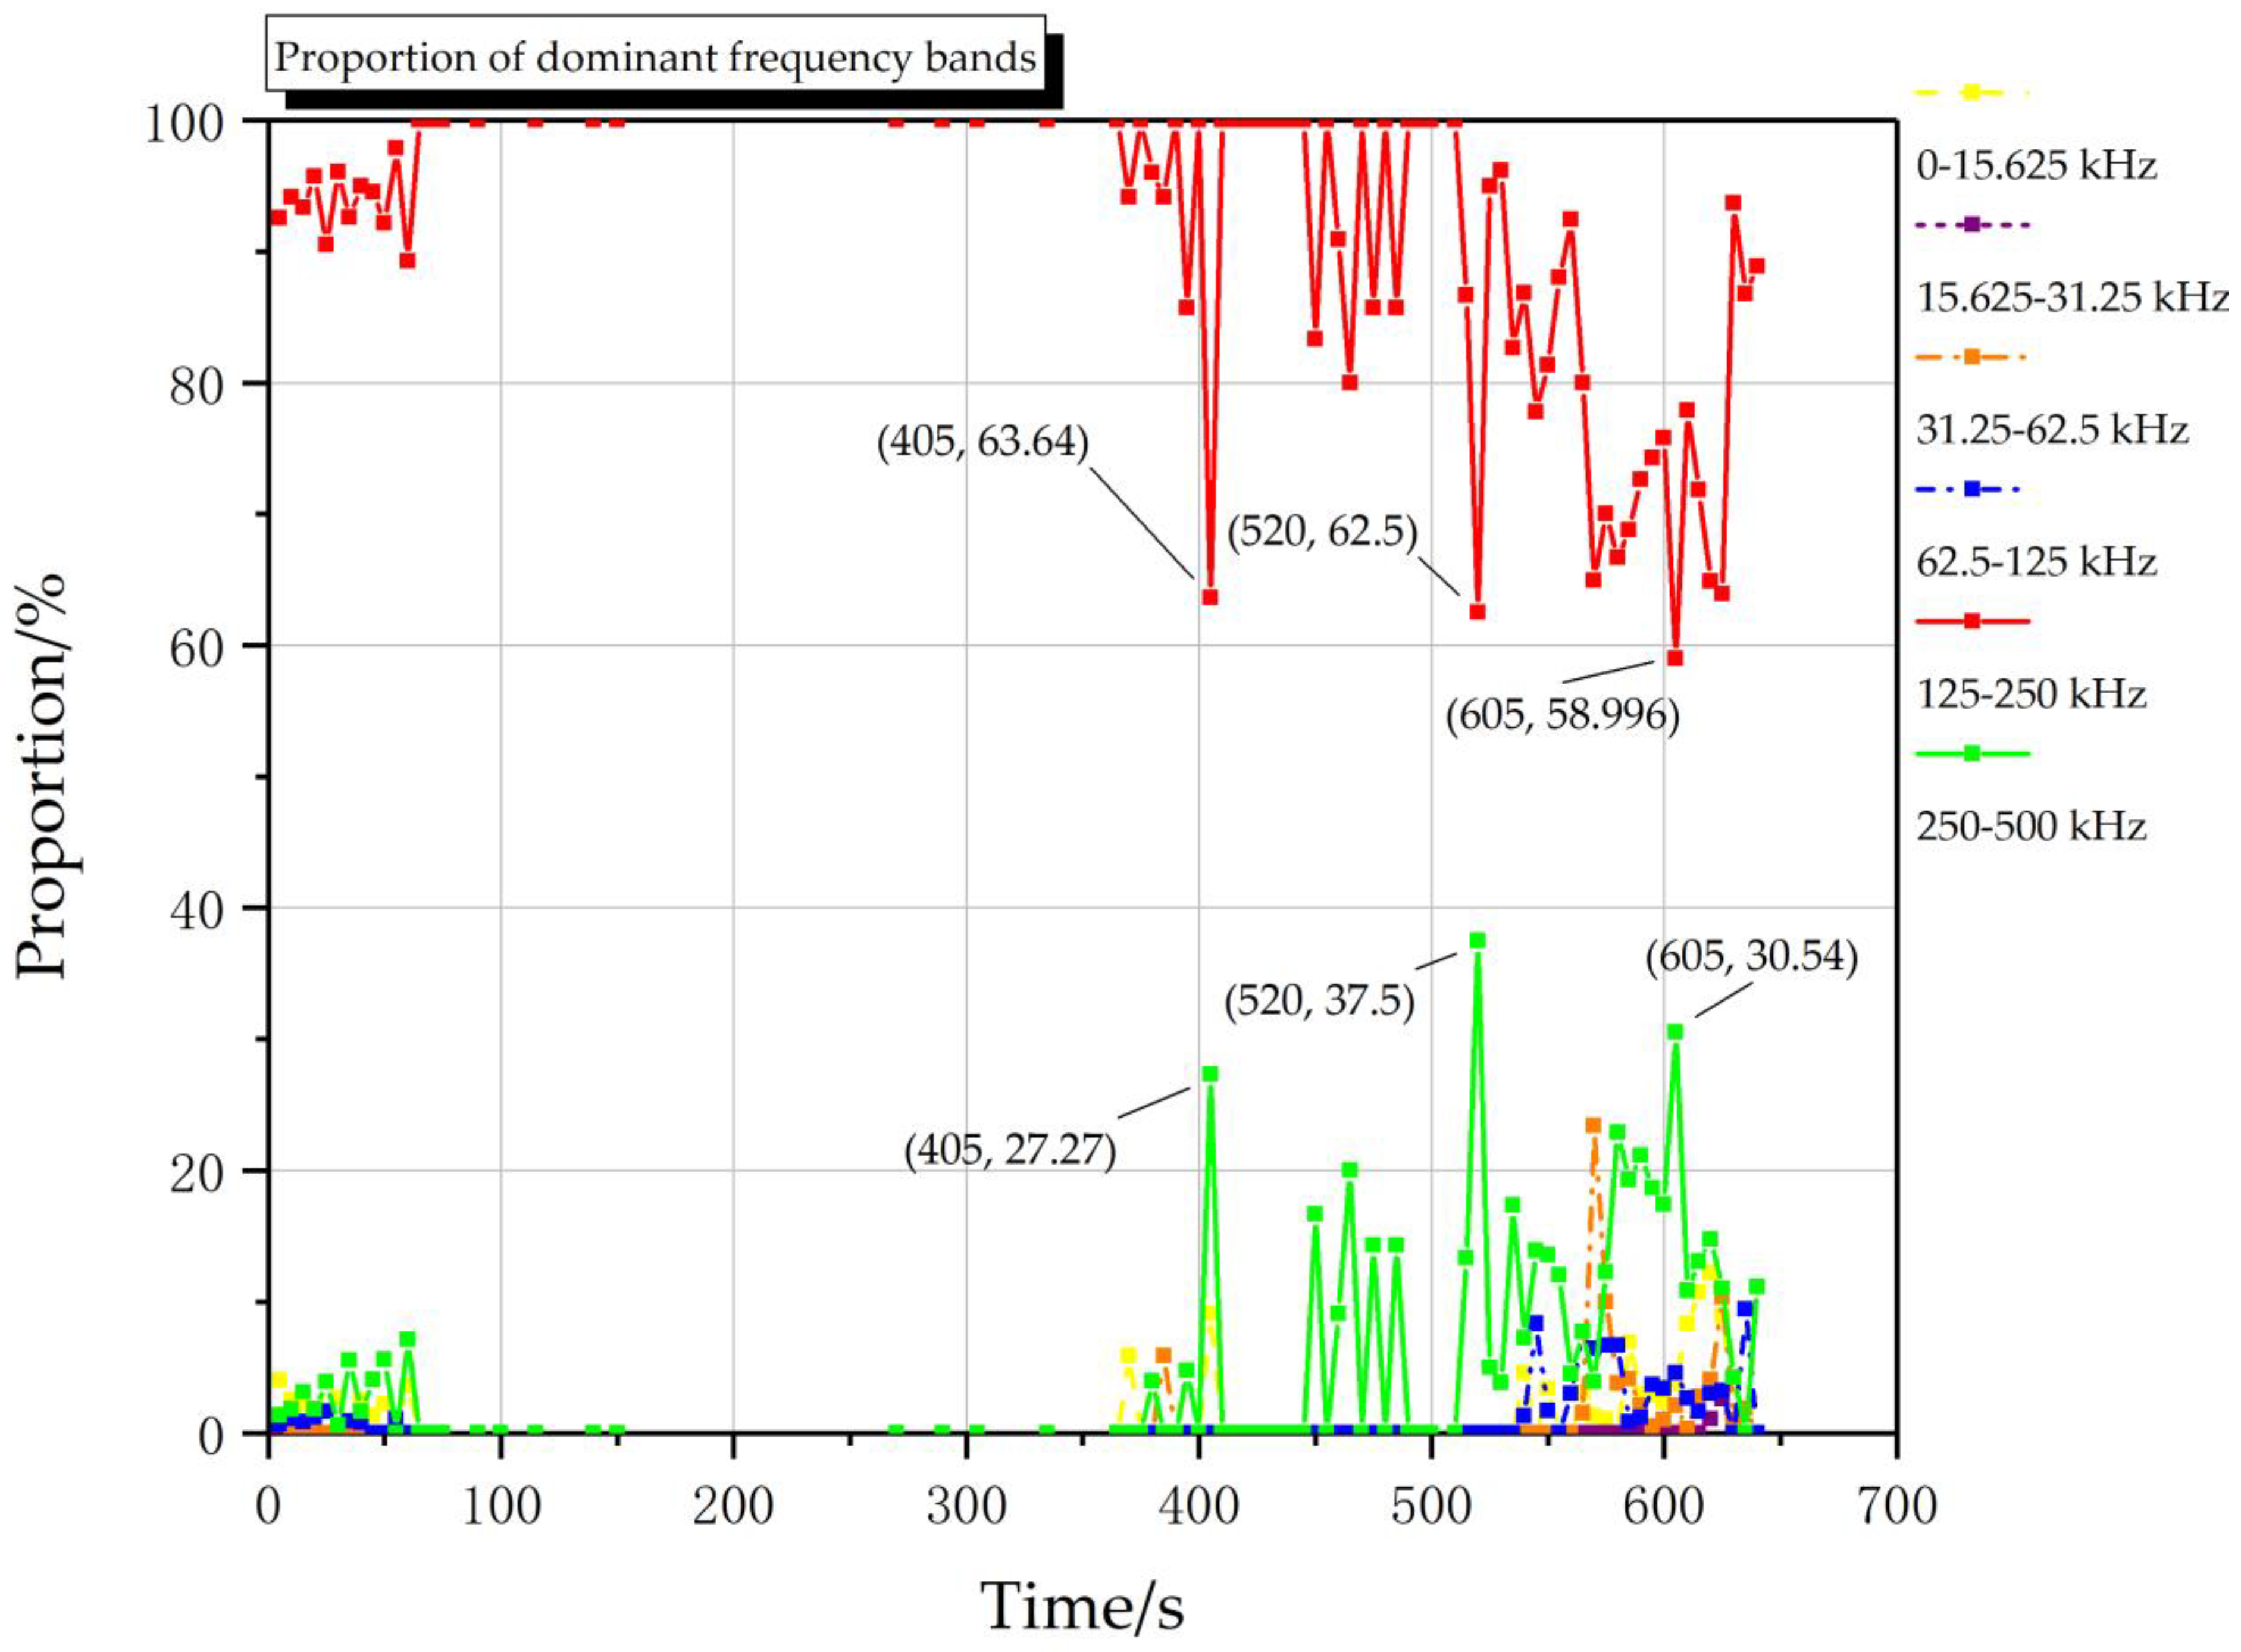
Taking 5 s as a period, the entire test process is divided into several periods and the proportions of different dominant frequency bands (Ati) are counted in each period.
where Bti is the number of dominant frequency bands of the i-type frequency band sub-signal in the t-the period; l is the total number of divided periods, and t is the number of 1 to l.
According to this method, Figure 13 presents the proportion of the dominant frequency band. In the whole process of the test, the frequency band’s proportion of 125~250 kHz advantage is prominent, which can be determined as the dominant frequency band. The trend of the frequency band’s proportion of 250~500 kHz is opposite to the dominant frequency band and the proportion of this frequency band has an obvious advantage in the destruction stage. Therefore, this frequency band can be defined as a suboptimal frequency band. As the loading increases, there are three valley values in the proportion of dominant frequency bands (reduced to 63.6%, 62.5%, and 59.0% at 405 s, 520 s, and 605 s, respectively) and there are three peak values in the proportion of suboptimal frequency bands (increased to 27.3%, 37.5%, 30.5% at 405 s, 520 s, 605 s, respectively).
To illustrate the characteristics of the acoustic emission wavelet energy evolution, the results of the loading process and the evolution process of the dominant frequency band are presented (Figure 14).
In the destruction stage, the dominant frequency band signals emerged in large numbers and the energy distribution coefficients are mainly concentrated around 0.47. The higher energy is released in the destruction process. When a rockburst was approaching, the dominant frequency band signals dropped suddenly and they are displayed as the valley-type. The trend remains at a relatively low level (below 80%) before and after the rockburst. Meanwhile, the suboptimal frequency band signals increase abruptly and are shown as the peak type. The trend remains at a relatively high level (above 20%).
5. Discussion and Conclusions
The free surface is intact and smooth before the rockburst. The phenomenon of small particles rock ejecting occurred to the free surface in the process of a slight rockburst. During the violent rockburst, the rock block was fiercely ejected from the free surface, accompanied by spray rock powders, and an explosion sound can be heard. After the destruction of the rockburst, the specimen’s surface left multiple split cracks and penetrating sheared cracks. The free surface became a rockburst destruction surface and a typical rockburst pit was shaped as a V type in the ejection area. However, the surface with additional binding force remained intact and smooth.
The effective acoustic emission signals of the whole test process were decomposed and reconstructed by five-layer wavelet processing. The energy distribution coefficients of each frequency band were concentrated in the compaction and destruction phases. The energy distribution coefficient’s tendency in the frequency band of 125~250 kHz shows a valley-type in the destruction stage. The energy distribution coefficients of the frequency band of 125~250 kHz had more obvious advantages than other frequency bands over the whole experiment process. This frequency range was consistent with the results of Gowd’s research [51], in which the acoustic emission frequency band was predominantly distributed at 100~300 kHz during the complete deformation. The wavelet transforms energy analysis can establish more accurately the characteristic frequency.
The frequency band of 125~250 kHz can be defined as the dominant frequency band and the frequency band of 250~500 kHz as the suboptimal frequency band by the evolution process of the frequency band’s proportion. These results were similar to those of Sun et al. [52], where the main frequency ranges of AE were 220~280 kHz in the elastic stage and the average value was 123 kHz in the plastic stage, and they also pointed out that the main frequency decreased during the rockburst stage. The following results could have promising applications: Acoustic emission signals emerge in large numbers and the energy distribution coefficients of the dominant frequency band are concentrated above 0.4. The tendency in the proportion of dominant frequency band appears in continuous valley type and is maintained below 80%. The tendency to the proportion of suboptimal frequency band is continuous peak type and maintained above 20%. These results can be used as predicted features for the rockburst disaster in engineering fields.
Due to the limitation of the experiment conditions, only the marble specimen was considered as the test object in this article. The experimental subjects will be extended in future research work, and the applicable conditions of wavelet energy evolution characteristics of acoustic emission signal will be further discussed, which will be considered for use in the field of rockburst disaster warning.
Author Contributions
Conceptualization, F.M.; Formal analysis, C.H.; Project administration, F.M.; Resources, F.M.; Software, C.H.; Writing—original draft, C.H.; Writing—review and editing, W.H. All authors have read and agreed to the published version of the manuscript.
Funding
This research was funded by China University of Geosciences (Wuhan), grant number KH186619 and SKJ2017127.
Institutional Review Board Statement
Not applicable.
Informed Consent Statement
Not applicable.
Data Availability Statement
Not applicable.
Acknowledgments
The authors would like to thank Guangxi University College of Civil Engineering and Architecture Su Guoshao’s team and Wenlong Zhang for their support.
Conflicts of Interest
The authors declare no conflict of interest.
References
- Mutke, G.; Dubiński, J.; Lurka, A. New Criteria to Assess Seismic and Rock Burst Hazard in Coal Mines/Nowe Kryteria Dla Oceny Zagrożenia Sejsmicznego I Tąpaniami W Kopalniach Węgla Kamiennego. Arch. Min. Sci. 2015, 60, 743–760. [Google Scholar] [CrossRef] [Green Version]
- Li, X.; Wang, E.; Li, Z.; Liu, Z.; Song, D.; Qiu, L. Rock Burst Monitoring by Integrated Microseismic and Electromagnetic Radiation Methods. Rock Mech. Rock Eng. 2016, 49, 4393–4406. [Google Scholar] [CrossRef]
- Gong, Q.M.; Yin, L.J.; Wu, S.Y.; Zhao, J.; Ting, Y. Rock burst and slabbing failure and its influence on TBM excavation at headrace tunnels in Jinping II hydropower station. Eng. Geol. 2012, 124, 98–108. [Google Scholar] [CrossRef]
- Keneti, A.; Sainsbury, B. Review of published rockburst events and their contributing factors. Eng. Geol. 2018, 246, 361–373. [Google Scholar] [CrossRef]
- Reddy, N.S.S.M. The influence of geology on a simulated rockburst. J. S. Afr. Inst. Min. Metall. 2001, 101, 267–272. [Google Scholar]
- Zhao, Y.; Zhang, L.; Liao, J.; Wang, W.; Liu, Q.; Tang, L. Experimental Study of Fracture Toughness and Subcritical Crack Growth of Three Rocks under Different Environments. Int. J. Geomech. 2020, 20, 4020128. [Google Scholar] [CrossRef]
- Zhao, Y.; Zhang, C.; Wang, Y.; Lin, H. Shear-related roughness classification and strength model of natural rock joint based on fuzzy comprehensive evaluation. Int. J. Rock Mech. Min. 2021, 137, 104550. [Google Scholar] [CrossRef]
- Zhao, Y.; Wang, Y.; Wang, W.; Tang, L.; Liu, Q.; Cheng, G. Modeling of rheological fracture behavior of rock cracks subjected to hydraulic pressure and far field stresses. Theor. Appl. Fract. Mech. 2019, 101, 59–66. [Google Scholar] [CrossRef]
- Lin, H.; Yang, H.; Wang, Y.; Zhao, Y.; Cao, R. Determination of the stress field and crack initiation angle of an open flaw tip under uniaxial compression. Theor. Appl. Fract. Mech. 2019, 104, 102358. [Google Scholar] [CrossRef]
- Liu, Q.; Zhao, Y.; Tang, L.; Liao, J.; Wang, X.; Tan, T.; Chang, L.; Luo, S.; Wang, M. Mechanical characteristics of single cracked limestone in compression-shear fracture under hydro-mechanical coupling. Theor. Appl. Fract. Mech. 2022, 119, 103371. [Google Scholar] [CrossRef]
- Zhao, Y.; Liu, Q.; Zhang, C.; Liao, J.; Lin, H.; Wang, Y. Coupled seepage-damage effect in fractured rock masses: Model development and a case study. Int. J. Rock Mech. Min. 2021, 144, 104822. [Google Scholar] [CrossRef]
- Zhang, C.; Canbulat, I.; Hebblewhite, B.; Ward, C.R. Assessing coal burst phenomena in mining and insights into directions for future research. Int. J. Coal Geol. 2017, 179, 28–44. [Google Scholar] [CrossRef]
- Zhao, T.; Guo, W.; Tan, Y.; Yin, Y.; Cai, L.; Pan, J. Case Studies of Rock Bursts Under Complicated Geological Conditions During Multi-seam Mining at a Depth of 800 m. Rock Mech. Rock Eng. 2018, 51, 1539–1564. [Google Scholar] [CrossRef]
- Ghorbani, M.; Shahriar, K.; Sharifzadeh, M.; Masoudi, R. A critical review on the developments of rock support systems in high stress ground conditions. Int. J. Min. Sci. Technol. 2020, 30, 555–572. [Google Scholar] [CrossRef]
- Si, X.; Huang, L.; Li, X.; Gong, F.; Liu, X. Mechanical properties and rockburst proneness of phyllite under uniaxial compression. Trans. Nonferrous Met. Soc. China 2021, 31, 3862–3878. [Google Scholar] [CrossRef]
- Li, H.; Qiao, Y.; Shen, R.; He, M. Electromagnetic radiation signal monitoring and multi-fractal analysis during uniaxial compression of water-bearing sandstone. Measurement 2022, 196, 111245. [Google Scholar] [CrossRef]
- Hui, Z.; Jing-Jing, L.U.; Rong-Chao, X.U.; Chuan-Qing, Z.; Fan-Zhen, M. Critical problems of study of slabbing failure of surrounding rock in deep hard rock tunnel and research progress. Rock Soil Mech. 2015, 36, 2737–2749. [Google Scholar]
- Gong, F.; Luo, Y.; Li, X.; Si, X.; Tao, M. Experimental simulation investigation on rockburst induced by spalling failure in deep circular tunnels. Tunn. Undergr. Space Technol. 2018, 81, 413–427. [Google Scholar] [CrossRef]
- Si, X.; Gong, F. Strength-weakening effect and shear-tension failure mode transformation mechanism of rockburst for fine-grained granite under triaxial unloading compression. Int. J. Rock Mech. Min. 2020, 131, 104347. [Google Scholar] [CrossRef]
- Zhao, H.; Liu, C.; Huang, G.; Yu, B.; Liu, Y.; Song, Z. Experimental investigation on rockburst process and failure characteristics in trapezoidal tunnel under different lateral stresses. Constr. Build. Mater. 2020, 259, 119530. [Google Scholar] [CrossRef]
- Zhang, Y.B.; Liang, P.; Liu, X.X.; Liu, S.J.; Tian, B.Z. An experimental study of predicting rockburst in granitic roadway based on multiparameter normalization. Rock Soil Mech. 2016, 37, 96–104. [Google Scholar]
- He, S.; Lai, J.; Zhong, Y.; Wang, K.; Xu, W.; Wang, L.; Liu, T.; Zhang, C. Damage behaviors, prediction methods and prevention methods of rockburst in 13 deep traffic tunnels in China. Eng. Fail. Anal. 2021, 121, 105178. [Google Scholar] [CrossRef]
- Xu, J.; Jiang, J.; Xu, N.; Liu, Q.; Gao, Y. A new energy index for evaluating the tendency of rockburst and its engineering application. Eng. Geol. 2017, 230, 46–54. [Google Scholar] [CrossRef]
- Liu, F.; Tang, C.; Zhang, Y.; Ma, T. Rockburst and microseismicity characteristics in the Qinling water conveyance tunnel of the Hanjiang-to-Weihe River Diversion Project. Int. J. Rock Mech. Min. 2021, 148, 104973. [Google Scholar] [CrossRef]
- Li, X.; Chen, S.; Wang, E.; Li, Z. Rockburst mechanism in coal rock with structural surface and the microseismic (MS) and electromagnetic radiation (EMR) response. Eng. Fail. Anal. 2021, 124, 105396. [Google Scholar] [CrossRef]
- Liu, X.; Liang, Z.; Zhang, Y.; Liang, P.; Tian, B. Experimental study on the monitoring of rockburst in tunnels under dry and saturated conditions using AE and infrared monitoring. Tunn. Undergr. Space Technol. 2018, 82, 517–528. [Google Scholar] [CrossRef]
- Tang, S.; Tong, M.; Hu, J.; He, X. Characteristics of acoustic emission signals in damp cracking coal rocks. Min. Sci. Technol. (Xuzhou China) 2010, 20, 143–147. [Google Scholar] [CrossRef]
- Wang, J.; Zeng, X.; Zhou, J. Practices on rockburst prevention and control in headrace tunnels of Jinping II hydropower station. J. Rock Mech. Geotech. Eng. 2012, 4, 258–268. [Google Scholar] [CrossRef] [Green Version]
- He, M.; E Sousa, L.R.; Miranda, T.; Zhu, G. Rockburst laboratory tests database—Application of data mining techniques. Eng. Geol. 2015, 185, 116–130. [Google Scholar] [CrossRef]
- Shiotani, T.; Ohtsu, M.; Ikeda, K. Detection and evaluation of AE waves due to rock deformation. Constr. Build. Mater. 2001, 15, 235–246. [Google Scholar] [CrossRef]
- Labuz, J.F.; Cattaneo, S.; Chen, L.H. Acoustic emission at failure in quasi-brittle materials. Constr. Build. Mater. 2001, 15, 225–233. [Google Scholar] [CrossRef]
- Ohnaka, M.; Mogi, K. Frequency-characteristics of acoustic-emission in rocks under uniaxial compression and its relation to the fracturing process to failure. J. Geophys. Res. 1982, 87, 3873–3884. [Google Scholar] [CrossRef]
- Ohnaka, M. Acoustic-emission during creep of brittle rock. Int. J. Rock Mech. Min. 1983, 20, 121–134. [Google Scholar] [CrossRef]
- Colombo, S.; Forde, M.C.; Main, I.G.; Shigeishi, M. Predicting the ultimate bending capacity of concrete beams from the “relaxation ratio” analysis of AE signals. Constr. Build. Mater. 2005, 19, 746–754. [Google Scholar] [CrossRef]
- Du, F.; Wang, K.; Wang, G.; Jiang, Y.; Xin, C.; Zhang, X. Investigation of the acoustic emission characteristics during deformation and failure of gas-bearing coal-rock combined bodies. J. Loss Prevent. Proc. 2018, 55, 253–266. [Google Scholar] [CrossRef]
- Zhu, G.; Dou, L.; Wang, C.; Ding, Z.; Feng, Z.; Xue, F. Experimental study of rock burst in coal samples under overstress and true-triaxial unloading through passive velocity tomography. Saf. Sci. 2019, 117, 388–403. [Google Scholar] [CrossRef]
- Chu, Y.; Zhang, D.; Liu, H.; Wu, X.; Zhai, P.; Sheng, T. Experimental study on mechanical properties, acoustic emission characteristics and energy evolution of coal samples after freezing with liquid nitrogen. Fuel 2022, 321, 123955. [Google Scholar] [CrossRef]
- Zhang, Z.; Deng, J. A new method for determining the crack classification criterion in acoustic emission parameter analysis. Int. J. Rock Mech. Min. 2020, 130, 104323. [Google Scholar] [CrossRef]
- Li, H.; Zhou, L.; Lu, Y.; Yan, F.; Zhou, J.; Tang, J. Influence of supercritical CO2 saturation on the failure process of hot dry rock with acoustic emission monitoring. Powder Technol. 2020, 374, 241–249. [Google Scholar] [CrossRef]
- Zhao, K.; Ma, H.; Liang, X.; Li, X.; Liu, Y.; Cai, R.; Ye, L.; Yang, C. Damage evaluation of rock salt under multilevel cyclic loading with constant stress intervals using AE monitoring and CT scanning. J. Petrol. Sci. Eng. 2022, 208, 109517. [Google Scholar] [CrossRef]
- Stankevych, O.; Skalskyi, V.; Klym, B.; Velykyi, P. Identification of fracture mechanisms in cementitious composites using wavelet transform of acoustic emission signals. Procedia Struct. Integr. 2022, 36, 114–121. [Google Scholar] [CrossRef]
- Dinmohammadpour, M.; Nikkhah, M.; Goshtasbi, K.; Ahangari, K. Application of wavelet transform in evaluating the Kaiser effect of rocks in acoustic emission test. Measurement 2022, 192, 110887. [Google Scholar] [CrossRef]
- Wei, J.; Wang, H.; Lin, B.; Sui, T.; Zhao, F.; Fang, S. Acoustic emission signal of fiber-reinforced composite grinding: Frequency components and damage pattern recognition. Int. J. Adv. Manuf. Technol. 2019, 103, 1391–1401. [Google Scholar] [CrossRef]
- Li, L.; Cai, H.; Han, H.; Jiang, Q.; Ji, H. Adaptive short-time Fourier transform and synchrosqueezing transform for non-stationary signal separation. Signal Processing 2020, 166, 107231. [Google Scholar] [CrossRef]
- Liu, W.; Cao, S.; Chen, Y. Seismic Time—Frequency Analysis via Empirical Wavelet Transform. IEEE Geosci. Remote Sens. Lett. 2016, 13, 28–32. [Google Scholar] [CrossRef]
- Knigge, B.; Talke, F.E. Slider vibration analysis at contact using time-frequency analysis and wavelet transforms. J. Tribol. ASME 2001, 123, 548–554. [Google Scholar] [CrossRef]
- Lee, S.W.; Park, K.H.; Lee, J.G. Blast-Induced Damage Identification of Rock Mass using Wavelet Transform Analysis. Procedia Eng. 2011, 14, 3142–3146. [Google Scholar] [CrossRef] [Green Version]
- Lee, I.; Han, S.; Kim, H.; Yu, J.; Min, B.; Lee, J. Evaluation of rock bolt integrity using Fourier and wavelet transforms. Tunn. Undergr. Space Technol. 2012, 28, 304–314. [Google Scholar] [CrossRef]
- Chen, J.; Li, Z.; Pan, J.; Chen, G.; Zi, Y.; Yuan, J.; Chen, B.; He, Z. Wavelet transform based on inner product in fault diagnosis of rotating machinery: A review. Mech. Syst. Signal Processing 2016, 70–71, 1–35. [Google Scholar] [CrossRef]
- Feng, Z.; Liang, M.; Chu, F. Recent advances in time–frequency analysis methods for machinery fault diagnosis: A review with application examples. Mech. Syst. Signal Processing 2013, 38, 165–205. [Google Scholar] [CrossRef]
- Gowd, T.N. Factors Affecting the Acoustic Emission Response of Triaxially Compressed Rock. Int. J. Rock Mech. Min. 1980, 4, 219–223. [Google Scholar] [CrossRef]
- Sun, X.; Xu, H.; He, M.; Zhang, F. Experimental investigation of the occurrence of rockburst in a rock specimen through infrared thermography and acoustic emission. Int. J. Rock Mech. Min. 2017, 93, 250–259. [Google Scholar] [CrossRef]
Figure 1.
Test specimen.

Figure 2.
Test equipment.

Figure 3.
Test specimen loading way.

Figure 4.
Test loading path.

Figure 5.
Flow chart.

Figure 6.
Rockburst test phenomenon. (a) Before rockburst; (b) Small rock fragments ejecting; (c) Rock plate splitting and peeling; (d) Rock plate buckling ejection; (e) Rockburst violence occurring; (f) After rockburst.
Figure 6.
Rockburst test phenomenon. (a) Before rockburst; (b) Small rock fragments ejecting; (c) Rock plate splitting and peeling; (d) Rock plate buckling ejection; (e) Rockburst violence occurring; (f) After rockburst.


Figure 7.
Results of the rockburst test.

Figure 8.
Removing zero processing to the original waveform. (a) Before processing; (b) After processing.
Figure 8.
Removing zero processing to the original waveform. (a) Before processing; (b) After processing.

Figure 9.
Five-layer wavelet decomposition structure tree.

Figure 10.
The 3546th effective acoustic emission signal. (a) The original AE signal waveform; (b) AE signal reconstructed waveform of each frequency band.
Figure 10.
The 3546th effective acoustic emission signal. (a) The original AE signal waveform; (b) AE signal reconstructed waveform of each frequency band.


Figure 11.
Acoustic emission full-time waveform.

Figure 12.
Evolution process of the energy distribution coefficients.

Figure 13.
Evolution process of the dominant frequency bands’ proportions.

Figure 14.
Characteristics of the AE wavelet energy evolution.


Table 1.
Frequency range of the wavelet sub-signal.
| Number i | Wavelet Sub-Signal | Frequency Range/kHz |
|---|---|---|
| 1 | CA5 | 0~15.625 |
| 2 | CD5 | 15.625~31.250 |
| 3 | CD4 | 31.25~62.50 |
| 4 | CD3 | 62.5~125.0 |
| 5 | CD2 | 125~250 |
| 6 | CD1 | 250~500 |
Table 2.
Reconstructed signal energy and distribution coefficient.
| CD1 | CD2 | CD3 | CD4 | CD5 | CA5 | |
|---|---|---|---|---|---|---|
| E | 0.1983 | 0.2812 | 0.1352 | 0.0830 | 0.0046 | 0.0025 |
| K | 0.2813 | 0.3990 | 0.1918 | 0.1177 | 0.0066 | 0.0036 |
Publisher’s Note: MDPI stays neutral with regard to jurisdictional claims in published maps and institutional affiliations. |
© 2022 by the authors. Licensee MDPI, Basel, Switzerland. This article is an open access article distributed under the terms and conditions of the Creative Commons Attribution (CC BY) license (https://creativecommons.org/licenses/by/4.0/).
Share and Cite
MDPI and ACS Style
Hu, C.; Mei, F.; Hussain, W. Wavelet Energy Evolution Characteristics of Acoustic Emission Signal under True-Triaxial Loading during the Rockburst Test. Appl. Sci. 2022, 12, 7786. https://doi.org/10.3390/app12157786
AMA Style
Hu C, Mei F, Hussain W. Wavelet Energy Evolution Characteristics of Acoustic Emission Signal under True-Triaxial Loading during the Rockburst Test. Applied Sciences. 2022; 12(15):7786. https://doi.org/10.3390/app12157786
Chicago/Turabian StyleHu, Chuanyu, Fuding Mei, and Wakeel Hussain. 2022. "Wavelet Energy Evolution Characteristics of Acoustic Emission Signal under True-Triaxial Loading during the Rockburst Test" Applied Sciences 12, no. 15: 7786. https://doi.org/10.3390/app12157786
Note that from the first issue of 2016, this journal uses article numbers instead of page numbers. See further details here.