Article

Test–Retest Reliability in Automated Emotional Facial Expression Analysis: Exploring FaceReader 8.0 on Data from Typically Developing Children and Children with Autism

1
Doctoral School of Psychology, ELTE Eötvös Loránd University, 1053 Budapest, Hungary
2
Institute of Psychology, ELTE Eötvös Loránd University, 1053 Budapest, Hungary
3
Institute for the Psychology of Special Needs, ELTE Eötvös Loránd University, 1053 Budapest, Hungary
4
HAS-ELTE ‘Autism in Education’ Research Group, 1053 Budapest, Hungary
5
Institute of Special Needs Education for People with Atypical Behavior and Cognition, ELTE Eötvös Loránd University, 1053 Budapest, Hungary
*
Author to whom correspondence should be addressed.
Appl. Sci. 2022, 12(15), 7759; https://doi.org/10.3390/app12157759
Submission received: 15 June 2022 / Revised: 16 July 2022 / Accepted: 25 July 2022 / Published: 1 August 2022

Abstract

:

Featured Application

The results of this study can potentially contribute to the further development of automated emotional facial expression analysis systems, to their usage in developing screening/diagnostic systems, and to the refinement of methodological practices of their usage in both applied and basic research in general.

Abstract

Automated emotional facial expression analysis (AEFEA) is used widely in applied research, including the development of screening/diagnostic systems for atypical human neurodevelopmental conditions. The validity of AEFEA systems has been systematically studied, but their test–retest reliability has not been researched thus far. We explored the test–retest reliability of a specific AEFEA software, Noldus FaceReader 8.0 (FR8; by Noldus Information Technology). We collected intensity estimates for 8 repeated emotions through FR8 from facial video recordings of 60 children: 31 typically developing children and 29 children with autism spectrum disorder. Test–retest reliability was imperfect in 20% of cases, affecting a substantial proportion of data points; however, the test–retest differences were small. This shows that the test–retest reliability of FR8 is high but not perfect. A proportion of cases which initially failed to show perfect test–retest reliability reached it in a subsequent analysis by FR8. This suggests that repeated analyses by FR8 can, in some cases, lead to the “stabilization” of emotion intensity datasets. Under ANOVA, the test–retest differences did not influence the pattern of cross-emotion and cross-group effects and interactions. Our study does not question the validity of previous results gained by AEFEA technology, but it shows that further exploration of the test–retest reliability of AEFEA systems is desirable.

1. Introduction

Automated emotional facial expression analysis (AEFEA) technologies are aimed at processing digitized images of human faces in order to generate estimates of the intensities of emotional states displayed on the face. It is expected that these systems can complete this process faster and more cost-effectively than human agents [1,2,3,4], with higher reliability and with at least comparable validity [5]. Although there is an ongoing discussion about AEFEA systems’ potentially intrinsic limitations—arising from estimating emotional content without taking into account the context in which the facial expression arises [6,7]—there is a rapidly growing interest in them. Beyond their use in academic research, there have been numerous attempts to utilize AEFEA technologies in applied fields, such as researching consumer behavior, user experience, and marketing [5,8] and in diagnostic technologies in psychiatry [6,9,10]. While their validity has been widely investigated, no study has been published on their test–retest reliability; the latter is an equally important property of any tool for collecting data on human behavior. Thus, the present study empirically explored the test–retest reliability of a specific AEFEA system. As AEFEA technology seems to have great potential in screening and diagnostic technologies for neurodevelopmental conditions, we used data from typically developing children and children with autism spectrum disorder (ASD). Our study suggests that the test–retest reliability of Noldus FaceReader 8.0 (FR8; by Noldus Information Technology; Wageningen, The Netherlands) is very high but not perfect. Our findings do not question the validity of previous results gained by AEFEA technology, but they demonstrate that further exploration is needed to gain a better understanding of this key characteristic of AEFEA systems. Test–retest reliability showed highly similar patterns in the groups of children with ASD and with neurotypical development.
Ekman’s Facial Action Coding System (FACS) [11] is a widely used framework for identifying emotional facial expressions (EFEs) and assessing their intensities by human coders based on the anatomical features of the face. It also serves as the foundation for making emotion estimations in several AEFEA technologies [12], as it is highly valid and reliable when used by human coders [13,14]. It can be elaborated precisely enough to be implemented in computational algorithms [7,15]. It defines action units (AUs) anatomically, that is, through different muscle movements of the face, to identify specific EFEs as constituted by their specific combinations. Intensity estimations for any emotional expression are derived from the intensities of their component AUs, that is, from the amplitudes of the relevant muscle movements.
At present, a few commercially available versions of AEFEA technology exist, based on the FACS, including the AFFDEX (developed by Affectiva, Boston, MA, USA, distributed by Affectiva and iMotions, Copenhagen, Denmark) [16,17,18]; the FACET (developed by Emotient, San Diego, CA, USA, distributed by iMotions, Copenhagen, Denmark) [19]; and the Noldus FaceReader (developed by VicarVision, Amsterdam, The Netherlands, distributed by Noldus Information Technology) [20]. See Dupré, Krumhuber, Küster, and McKeown’s review [21] for others. Although all of these are based on FACS, they use various computational algorithms for face and feature (AU) detection [21]. There is intense simultaneous development in this area, which stretches beyond classical emotion theories and FACS. Analysis of facial expressions has been supplemented by the processing of a broader set of social signals [22]. Emotion identification has been extended beyond basic or primary emotions (fear, disgust, anger, surprise, happiness, sadness, and contempt, according to Ekman’s 1978 framework) to include secondary emotions (e.g., boredom, interest, and confusion) [23]. Facial expressions have also been decomposed into sequences of distinct phases, and their symmetry and micro-expressions, and the dynamic patterns of differences between morphologically similar facial expressions, have been analyzed [4]. Input data from laboratory settings are increasingly replaced with data from “in-the-wild” scenarios [2,4,22,24]. In this study, we focus on FACS-based AEFEA systems, and, more specifically, on FaceReader 8.0.
Although the number of AEFEA algorithms has increased in recent years, only a few studies on their validity and reliability have been published in peer-reviewed journals, e.g., [3,5,21,25]. More studies are available in conference presentations and proceedings [15,26,27,28,29].
Validation of AEFEA systems is conducted on controlled, publicly available reference datasets of images of human faces with EFEs and corresponding emotion intensities, as judged by trained human coders. Of the algorithms based on Ekman’s FACS, FaceReader, AFFDEX, and FACET have been best documented to reach high validity [3,5,20,25,30].
In regard to the FaceReader system specifically, three different versions of FaceReader have been validated on four different validated datasets of human expressions of basic emotions in total, three of which are publicly available. FaceReader 1.0 exhibited an 89% match with the reference emotion labels from the Karolinska Directed Emotional Faces (KDEF) dataset [20,30,31]. FaceReader 6.0 reached an 88% overall hit rate [5] when validated on the Warsaw Set of Emotional Facial Expression Pictures (WSEFEP) [32] and the Amsterdam Dynamic Facial Expression Set (ADFES) [33]. Human emotion recognition performance for these two datasets was 85% in the same study. For some action units, FaceReader did not reach the 0.7 level of agreement required for the FACS certificate for human coders; however, for other AUs, FaceReader showed high accuracy. It remarkably surpassed human coders in identifying neutral faces [34]. FaceReader 7 was validated [35] on the Standardized and Motivated Facial Expression of Emotion (SMoFEE) dataset [36], and its performance was compared with that of FaceReader 6.0 and of human coders found in earlier studies. Overall, FaceReader 7 performed well, as it correctly classified 79% and 80% of EFEs (in noncalibrated and calibrated conditions, respectively); however, it showed somewhat uneven performance across emotions and underperformed FaceReader 6.0 in some respects.
FaceReader is under continuous development; its most recent release is version 9.
There have been considerable efforts to study both the inter-rater reliability and the test–retest reliability of human facial emotion analysis in the FACS framework. Inter-observer agreement was studied in various ways, such as using spontaneous vs. posed facial images and focusing on all AUs vs. specific AUs [1,37]. The most-cited study on human–human inter-rater reliability within the FACS framework using spontaneous facial expressions in three independent laboratory studies is that of Sayette et al. [14], which reported good–excellent reliability measures.
While both the inter-rater reliability and the test–retest reliability of human emotion analysis within the FACS framework have been explored, in the case of FACS-based AEFEA systems, perfect test–retest reliability was tacitly taken for granted (see below) and, instead, inter-system reliability studies were published. In most of these, the systems’ performances were evaluated individually and sequentially against reference datasets, and then compared. In other studies, agreement between the different systems was directly assessed. Study outcomes are not easy to compare, because diverse kits of stimulus datasets and statistics were used. This is true of human–computer inter-system comparisons [3,5,10,34,35,38,39]. A smaller number of inter-system comparison studies have employed more sophisticated methods, where aspects of emotion dynamics, such as onsets, peaks, and offsets of emotions, or changes in action unit intensities, were also compared [1,20]. Overall, the results indicate that AEFEA performs almost equally to, or occasionally better than, the reference human coders. An important exception is the study by Dupré et al. [21], where human coders outperformed all eight of the AEFEA systems, including FaceReader (version 7), in analyzing both posed and spontaneous EFEs.
Electromyography (EMG)/AEFEA comparison studies found that the two types of systems yielded highly correlated output data; however, compared with EMG, AEFEA systems are much easier to use [25,38,40].
In the case of human rating, test–retest reliability is perceived as an important methodological issue concerning EFEs as well as other aspects of human behavior. However, we found no study exploring the test–retest reliability of any AEFEA system. Most research reports seem to assume, either explicitly or implicitly, that AEFEA systems are based on fully deterministic algorithms, thus taking their perfect test–retest reliability for granted and implying that the stability of their input–output mappings is not an interesting question for research [41].
To fill this gap in our knowledge on the characteristics of AEFEA systems, the present study aimed to explore the test–retest reliability of a specific AEFEA engine, FaceReader 8.0 (henceforth referred to as FR8).
We explored the test–retest reliability of FR8 in a group of subjects with atypical neurocognitive development, namely children with ASD, in addition to a sample of neurotypical children. The quality and quantity of EFEs have diagnostic significance in several conditions, including ASD [9,42]. This makes AEFEA technology an important candidate research tool in studying these groups and in developing technology-aided screening and diagnostic systems.
In studying EFEs in atypical populations (including both individuals with developmental disorders and those with other psychiatric conditions), three aspects of emotional display seem especially relevant. These may potentially influence the validity and/or reliability of EFE recognition methodologies (both human and automated ratings) in these groups. The three aspects are as follows: (1) the congruence of facial emotions, i.e., the adequacy of an EFE in a specific context [9,43]; (2) the match between the emotion subjectively experienced and the corresponding facial expression [44]; (3) facial morphology [45,46].
Autism spectrum disorders are neurocognitive developmental conditions, and atypical communication of emotions is among their diagnostic markers [47]. Although findings on EFEs in ASD are diverse, studies suggest that all three anomalies mentioned are present in ASD: atypical craniofacial features and development [48,49,50,51,52]; incongruent emotions and mismatch between the expressed and experienced emotions [53,54,55,56]. It was also found that some individuals with ASD tend to use EFEs intentionally instead of spontaneously in social contexts, in order to “camouflage” their condition [57]. Therefore, individuals with ASD form a candidate group for exploring whether the test–retest reliability of AEFEA systems is influenced by atypical emotional expression patterns accompanied by atypical craniofacial features.
The present study is part of a research-and-development project with the long-term aim of developing and validating the concept and prototype of a social serious-game-based digital system for the screening of high-functioning cases of ASD among children at kindergarten age [58,59,60,61]. A partial prototype of the screening system is under validation and further development; the data analyzed in the present study were collected with this prototype. It records three kinds of behavioral data from the player while they play the game: mouse position and action, gaze focus position, and EFE data (estimates of displayed emotional content, provided by AEFEA on the basis of a video recording of the player’s face). The intended output of the system is a three-level risk estimation, based on a combination of the three kinds of collected data. The present study focuses on EFE data.

2. Materials and Methods

2.1. Study Aims

Given the exploratory nature of the study, we formulated research questions—not specific hypotheses—as follows:
  • What level and pattern of test–retest reliability does a specific version of AEFEA technology, FR8, provide in a group of typically developing children of kindergarten age, and in a matched group of children with autism spectrum disorder (ASD)?
  • Does test–retest reliability, if found imperfect, influence the overall pattern of results, especially between-group and between-emotion differences in detected EFE intensities? If so, how?

2.2. Participants

A total of 60 children, either with neurotypical development (in this paper, we use the terms “neurotypical” and “typically developing” interchangeably, referring to individuals (children) without any known neurological or psychiatric conditions) (n = 31) or with an ASD diagnosis (n = 29), were recruited in Hungary to participate in the study. They were recruited via their parents, directly (explicitly), either into the neurotypical (NT) or into the ASD (autism) group, using web advertisements (email circulars and social media). They were all white/Caucasian and without facial artifacts (glasses, etc.). Before collecting EFE data from them, all applicants went through a clinical and psychometric assessment in order to ensure their correct placement into the ASD vs. NT groups and their intellectual abilities, being in the IQ > 85 region, and to collect clinical, demographic, and other background data. Autism-related symptoms were first assessed by the SCQ (Social Communication Questionnaire) [62], and then by the ADOS (Autism Diagnostic Observation Schedule) [63] and the ADI-R (Autism Diagnostic Interview—Revised) [64]. The latter two are internationally accepted standard tools for autism diagnosis. Intelligence was assessed by the Leiter-R Brief scale [65] and the level of receptive language (grammar) was assessed by the TROG-H (Test for the Reception of Grammar) [66]—the Hungarian adaptation [67]. As the recording of facial expressions was accompanied by eye tracking (although these data were not analyzed in the present study), a questionnaire was used to collect information on any potential eye or visual anomaly. General inclusion criteria comprised the following: age between 36 and 72 months, unimpaired intelligence, and receptive language (grammar). Further inclusion criteria for the NT group comprised the following: SCQ total score < 4; all ADOS and ADI-R scores below the diagnostic cutoff values. Further inclusion criteria for the ASD group comprised the following: all ADOS and ADI-R scores above the diagnostic cutoff values; a clinical diagnosis of ASD from an established diagnostic institution. Exclusion criteria were ophthalmological and neurological conditions interfering with eye tracking; any neurodevelopmental condition, except ASD in the ASD group; significant delay in language, intellectual, or motor development; being on medication influencing the central nervous system; first language being a language other than Hungarian; and any acute or chronic medical condition which might influence the relevant behaviors.
From the total of 97 children who entered the recruitment process, 23 were excluded for not meeting some of the inclusion criteria above or meeting some of the exclusion criteria. Of the 74 children who went on to the EFE-data-collection phase, 14 were excluded from further analysis, due to either failure to collect enough data from them for analysis, or for any emerging doubt concerning the correctness of their diagnostic status (e.g., close to or above the cutoff score in ADOS or ADI-R).
The final sample thus comprised 60 children, 31 being (neurocognitively) typically developing and 29 having an ASD diagnosis. The two groups are well-matched with respect to IQ, receptive grammar, and their performance in the game (as indicated by number of correct (overt) mouse responses). In line with the diagnostic difference between the groups, they showed a significant difference and no overlap in their SCQ scores. There emerged a slightly significant difference in age, with small–moderate effect size; the mean age of the ASD group being higher than that of the NT group. Table 1 shows their key demographic and psychometric characteristics, and matching statistics.

2.3. Stimuli

EFE data were collected while children played with the prototype of the computer game. The game content was designed on the basis of empirical studies that revealed differences in EFEs, visual scanning patterns, or overt intended behavioral responses between neurotypical children and children with ASD of the relevant age. The main theme of the game was based on the story scripts used in an experimental developmental psychology study by Sodian and Frith [69], which compared neurotypical vs. autistic children’s ability to understand agents’ cooperative or competitive intentions, and to manipulate their behaviors by means of sabotage and deception. Accordingly, our game script centered around controlling the behaviors of social agents (cartoon figures) by sabotage vs. deception, in cooperative and competitive contexts. It consisted of eight such scenes, plus an opening scene to elicit potential group-specific attentional biases, two instruction scenes, and a closing scene.
The game presented predominantly visual stimuli, accompanied occasionally by sounds, such as bird tweets, characters’ speech, and various physical noises related to the events shown. Table 2 outlines the scene structure of the game. This section may be divided by subheadings. It should provide a concise and precise description of the experimental results, their interpretation, and the experimental conclusions that can be drawn.
As progress in a game session depended on some of the player’s responses, total play time varied across individuals. Longer response latency resulted in longer game time, and so did erroneous responses, as these resulted in repeating the given trial (up to 3 expositions). The mean total play time was 1482.123 s (SD 88.009, range 1360.933–1688.733). In the ASD group, it was 1502.442 s (SD 102.453, range 1367.233–1688.733); in the NT group it was 1464.426 s (SD 68.387, range 1360.933–1606.933). (Means were calculated only on those subjects who played to the end of the game). The two group means did not differ significantly (independent samples t-test, 2-tailed, with different variations).

2.4. Setting and Equipment

Recording EFE data from the game took place individually, in standard lab circumstances (lighting held constant, environmental noise reduced to minimal), in the presence of the subject and the experimenter. Parents/caretakers were offered the choice to stay in the lab or to follow the measurement from the neighboring room via a one-way mirror; all chose the latter. Subjects were sitting at a desk in a comfortable fixed chair with adjustable height. Initial viewing distance to the monitor was controlled according to the feedback from the eye-tracking system and was kept at approximately 72 cm. Head and body movements were not constrained, but children were asked to remain seated, and they all did so.
The game was controlled by using the Unity game engine (Unity Technologies) and was running on a desktop-mounted eye-tracking PC (EyeFollower 2, by LC Technologies; Dresden, Germany). Visual elements of the game were presented on a 24-inch LCD monitor (Benq V2410 ECO 24, Costa Mesa, CA, USA); sounds via a pair of commercial computer loudspeakers. Children could control the game by a computer mouse, designed specifically for young children. A webcam (Logitech®, Newark, CA, USA, C600, 2 MP, 1280 × 720 pixels, max. 30 fps) mounted below the PC monitor made video recordings of the player’s face. For 52 subjects, the recording rate was 15 fps (with negligible variability), the video image resolution was 1280 × 720. For the remaining 8 subjects, the recording rate was somewhat higher (between 25.00 and 29.97 fps), and the resolution was lower (between 720 × 480 and 800 × 504). To gain AEFEA data, these recordings were analyzed offline by FR8. These analyses were run on a Lenovo ThinkStation P320, Beijing, China, desktop PC, with key parameters exceeding the configuration recommended by Noldus for running FR8 (in our case: XEON E3 1240v6 3.7 Ghz processor, 16 GB RAM, 256 GB SSD Quadro P600 hard drive) and exceeding the minimum required configuration.
Data processing and analysis were performed using custom-made algorithms in JAVA (Oracle Technology Network, Redwood Shores, CA, USA) and SPSS v25 and v26 (IBM Inc., Armonk, NY, USA).

2.5. Procedure

Data collection took place in 3 sessions, individually, for each subject. At the beginning of session 1, children and their parents received detailed information on the purpose and procedure of the study and were asked for their explicit consent. After they provided it, children played with a simple computer game to practice using the one-button computer mouse. After reaching a pre-set criterion, they received brief instruction and then played with the stimulus game, while facial expression data (facial videos) were recorded. In the remaining part of session 1 and in session 2, clinical and psychometric data were collected from the children (Leiter-R, TROG-H, ADOS). In session 3, the ADI-R interview was administered with the parents/caretakers. All these measurements were administered individually by a psychologist trained in the use of these psychometric tools.

2.6. Data Processing and Analysis

The input for AEFEA and further analyses were 60 facial video recordings, with a mean length of 1455.862 s (SD = 167.831 s; range: 508.535–1688.733 s) (the mean length of the video recordings was somewhat lower than that of total play times presented above (and the range and SD were greater); this was due to one video recording stopping earlier than the end of the game). These were analyzed by FR8 for gaining EFE intensity data. No preprocessing was performed on the recordings before FR8 analyses. FR8 provides expression intensity values between 0 and 1 on 8 emotions: neutral, happy, sad, angry, surprised, scared, disgusted, and (optionally) contempt. FR8 attempts to assign such intensity values to each frame of the video recording. If it is unable to find the face in any given frame, it logs a “FIND_FAILED” entry for the frame, for each emotion. If it is able to find the face, but unable to fit the face model onto it, it creates a “FIT_FAILED” entry for all emotions for the frame. These data were exported with their time stamps and served as raw data for further analyses.
FR8 provides several settings options to customize EFE analysis. Appendix A Table A1 presents and explains the settings used in this study.
For test–retest reliability analysis, each recorded facial video was analyzed by FR8, repeatedly, a maximum of three times. If the first two subsequent analyses yielded exactly the same EFE intensity values, then no further analysis was run on that specific recording. If, however, no complete agreement was found, then a third analysis was performed.
This repeated analysis was performed by repeatedly sweeping along the set of video recordings in the same order. That is, firstly, all recordings were analyzed once, from subject #1′s recording to subject #60′s recording, and then the second analysis was carried out in the same order. After checking the level of match between corresponding individual data series, only those recordings were analyzed again (in the same order) where total test–retest identity was not reached with the second sweep. Those with perfect test–retest identity were omitted from reanalysis. One dataset (file) was gained from each analysis of each recording, and these datasets served as input for further analyses on test–retest reliability. See Results, Section 3, for descriptive data on the repeated analyses and their outcomes.

3. Results

3.1. Test–Retest Reliability

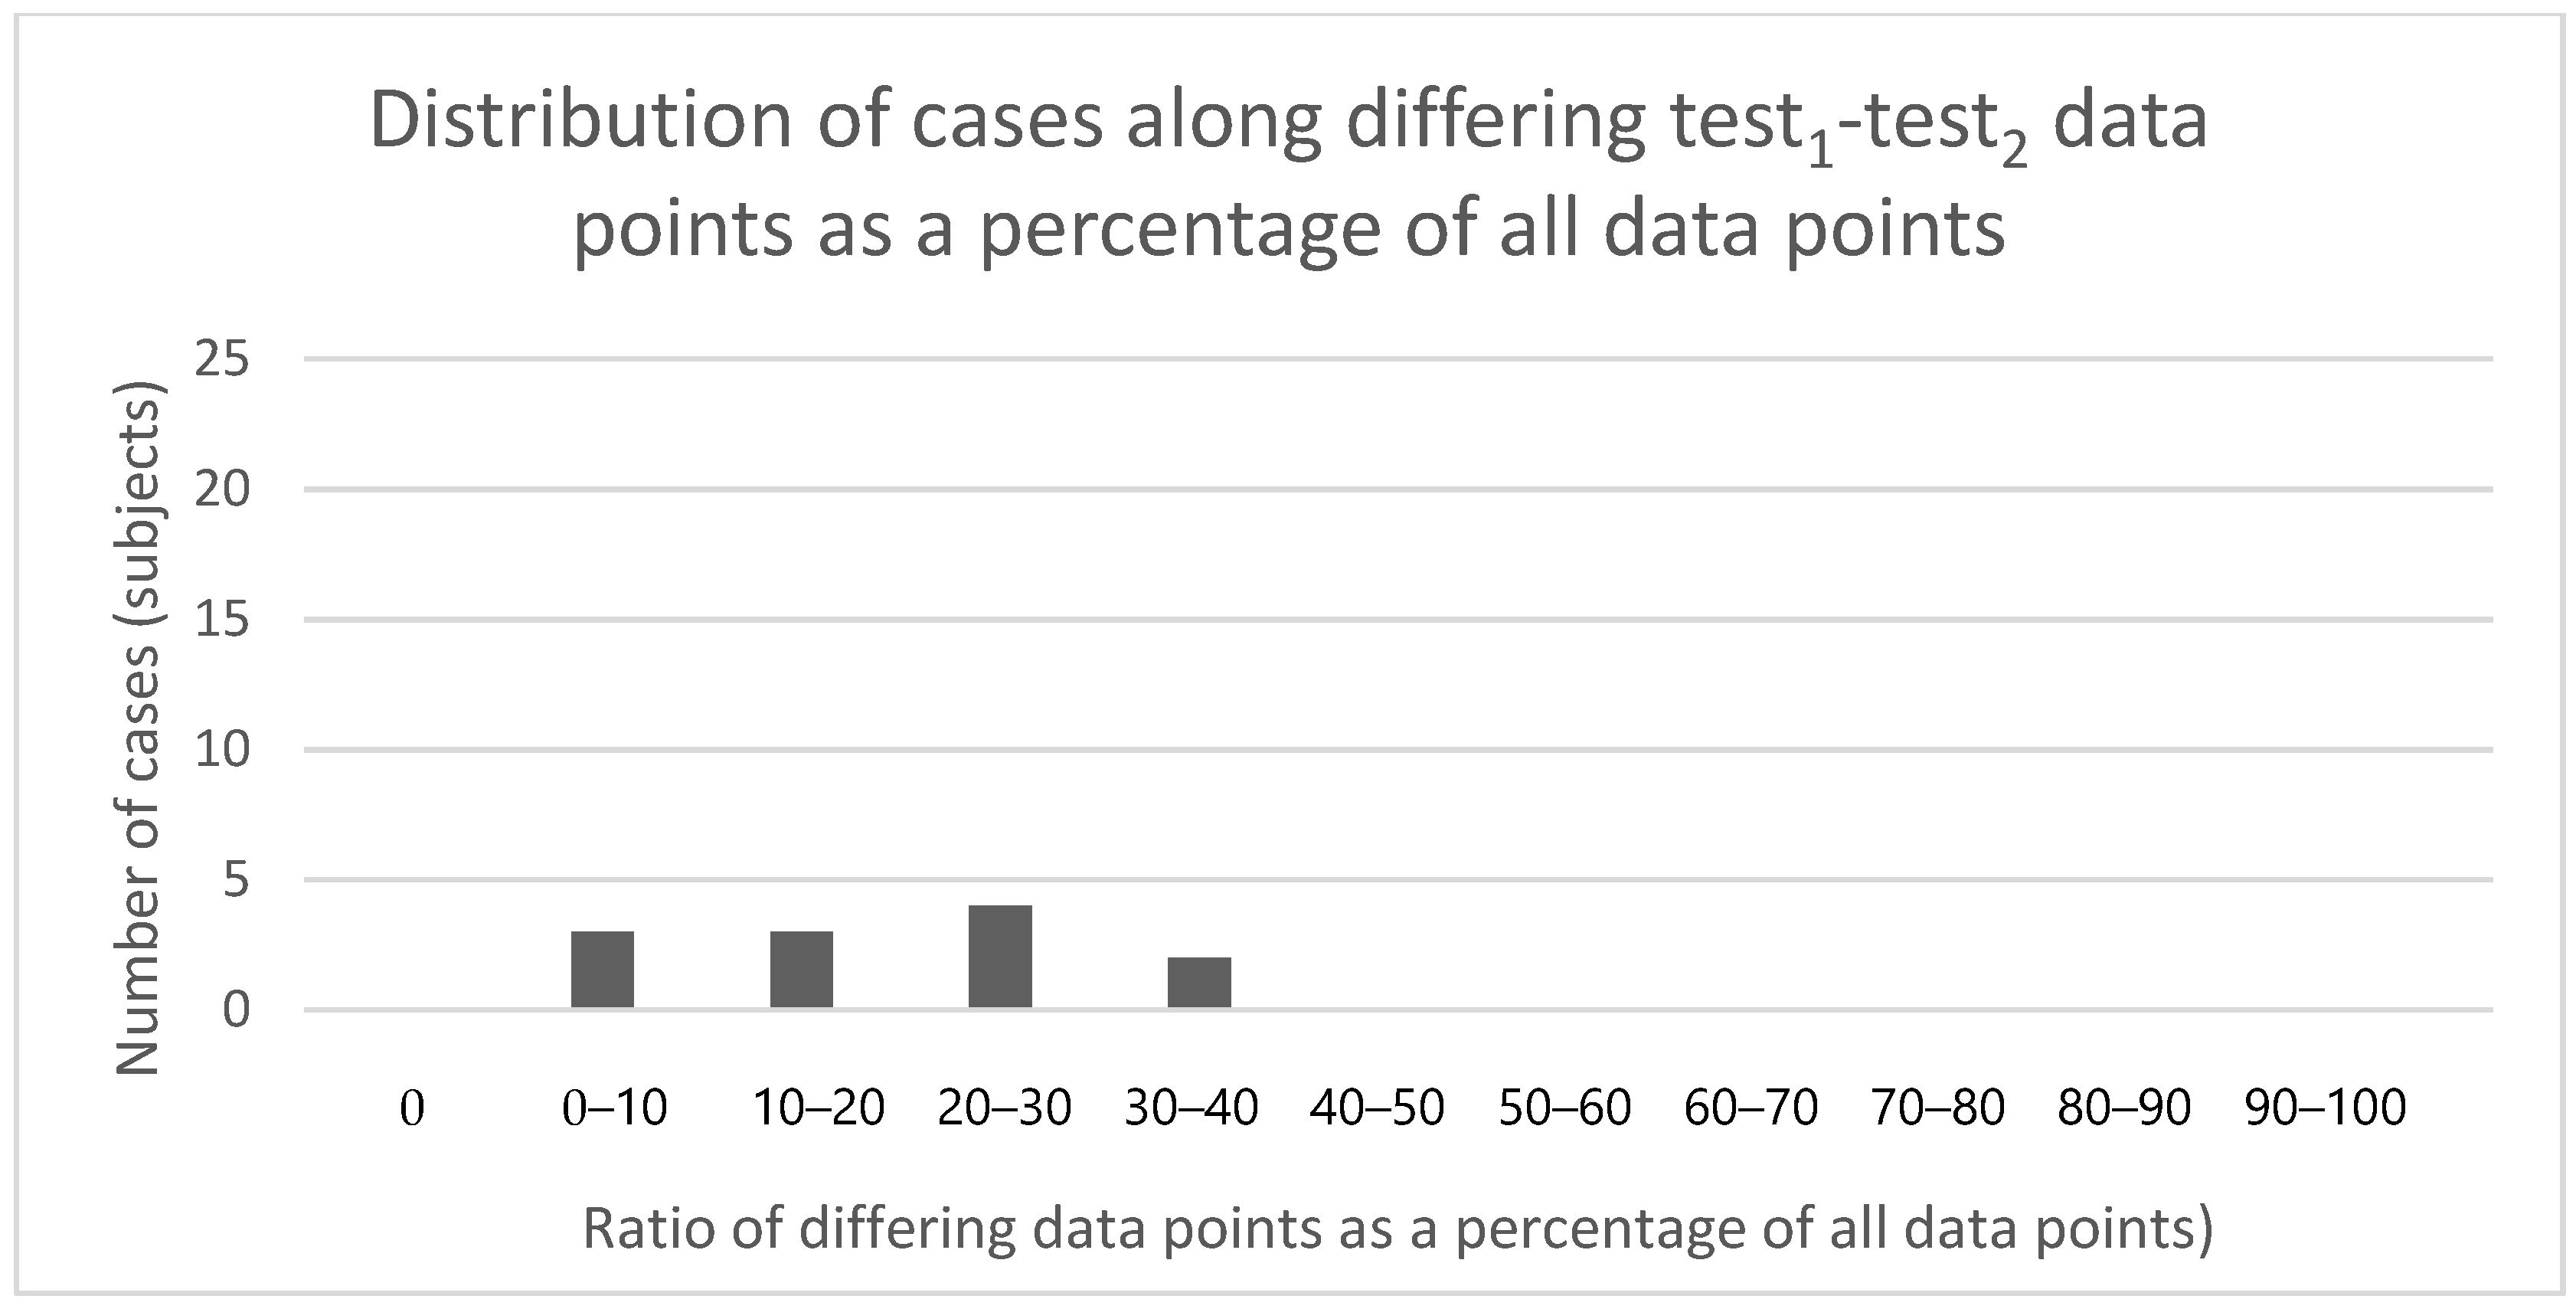
3.1.1. Test–Retest Differences between First and Second Test Data Series

As a first approach to analyzing test–retest reliability, we compared data pairwise from the first (test1) and second (test2) EFE FR8 analyses of the same videorecording for each subject. Since the recordings differed in length, the number of data points generated by EFE analyses also differed between subjects. For any given subject, we had < length in seconds > times < frames/second > times < emotions: 8 > data points for both test1 and test2. In contrast with the widespread belief reflected by the literature that algorithmic AEFEA has total test–retest reliability, in 12 of 60 of our cases (subjects), the data series gained from test1 and test2 were nonidentical. In these cases, test–retest differences affected a considerable proportion of data points. We calculated the ratio of differing data points between test1 and test2 outputs for each subject; Figure 1 shows the resulting distribution.
For exploratory purposes, we calculated the mean differences for each subject and emotion, based on individual test1–test2 difference distributions, and then calculated group-level descriptive statistics on each set of individual means; see Appendix A Table A2. Overall, the means of the individual test1–test2 differences were very small, on the order of magnitude of 10−3–10−7 for the eight emotions. The SD values were on a similar order of magnitude—10−3–10−6.
To explore the individual patterns of the magnitudes of differences between the test1 and test2 output data series, for each subject with nonidentical test1–test2 datasets and for each emotion, we calculated the individual distributions of these different magnitudes. A total of 12 (subjects) × 8 (emotions) = 96 frequency distributions were thus obtained. For illustration, such difference distributions are shown for two subjects in Appendix A Table A3 and Table A4. In these two cases, similarly to other subjects showing test1-test2 differences, the means of the individual emotion difference distributions were low.
For the 12 subjects with nonidentical test1–test2 results, we checked the number of FIND_FAILED (for the failure of finding the face on a video frame) and FIT_FAILED (for the failure of fitting the face model onto the face on a video frame) error signals in the two subsequent test runs. Importantly, these error signals—and consequently the number of valid data points—are always fully correlated across the eight emotion dimensions in any dataset.
On the subsequent runs (tests), these error indices were almost totally stable for each of the 12 subjects. The differences in their absolute frequencies were not above 3 in any of the 12 cases (cf. the mean total number of data points = 26,139). The FIND_FAILED index was more stable than the FIT_FAILED index (showing difference only in one case in the twelve-case cohort, and only in one data point). This clearly shows that imperfect test–retest reliability did not arise from different distributions of these error signals in the corresponding datasets.
Clearly, these error signals were perfectly stable for each of the 48 subjects with identical test1–test2 datasets.

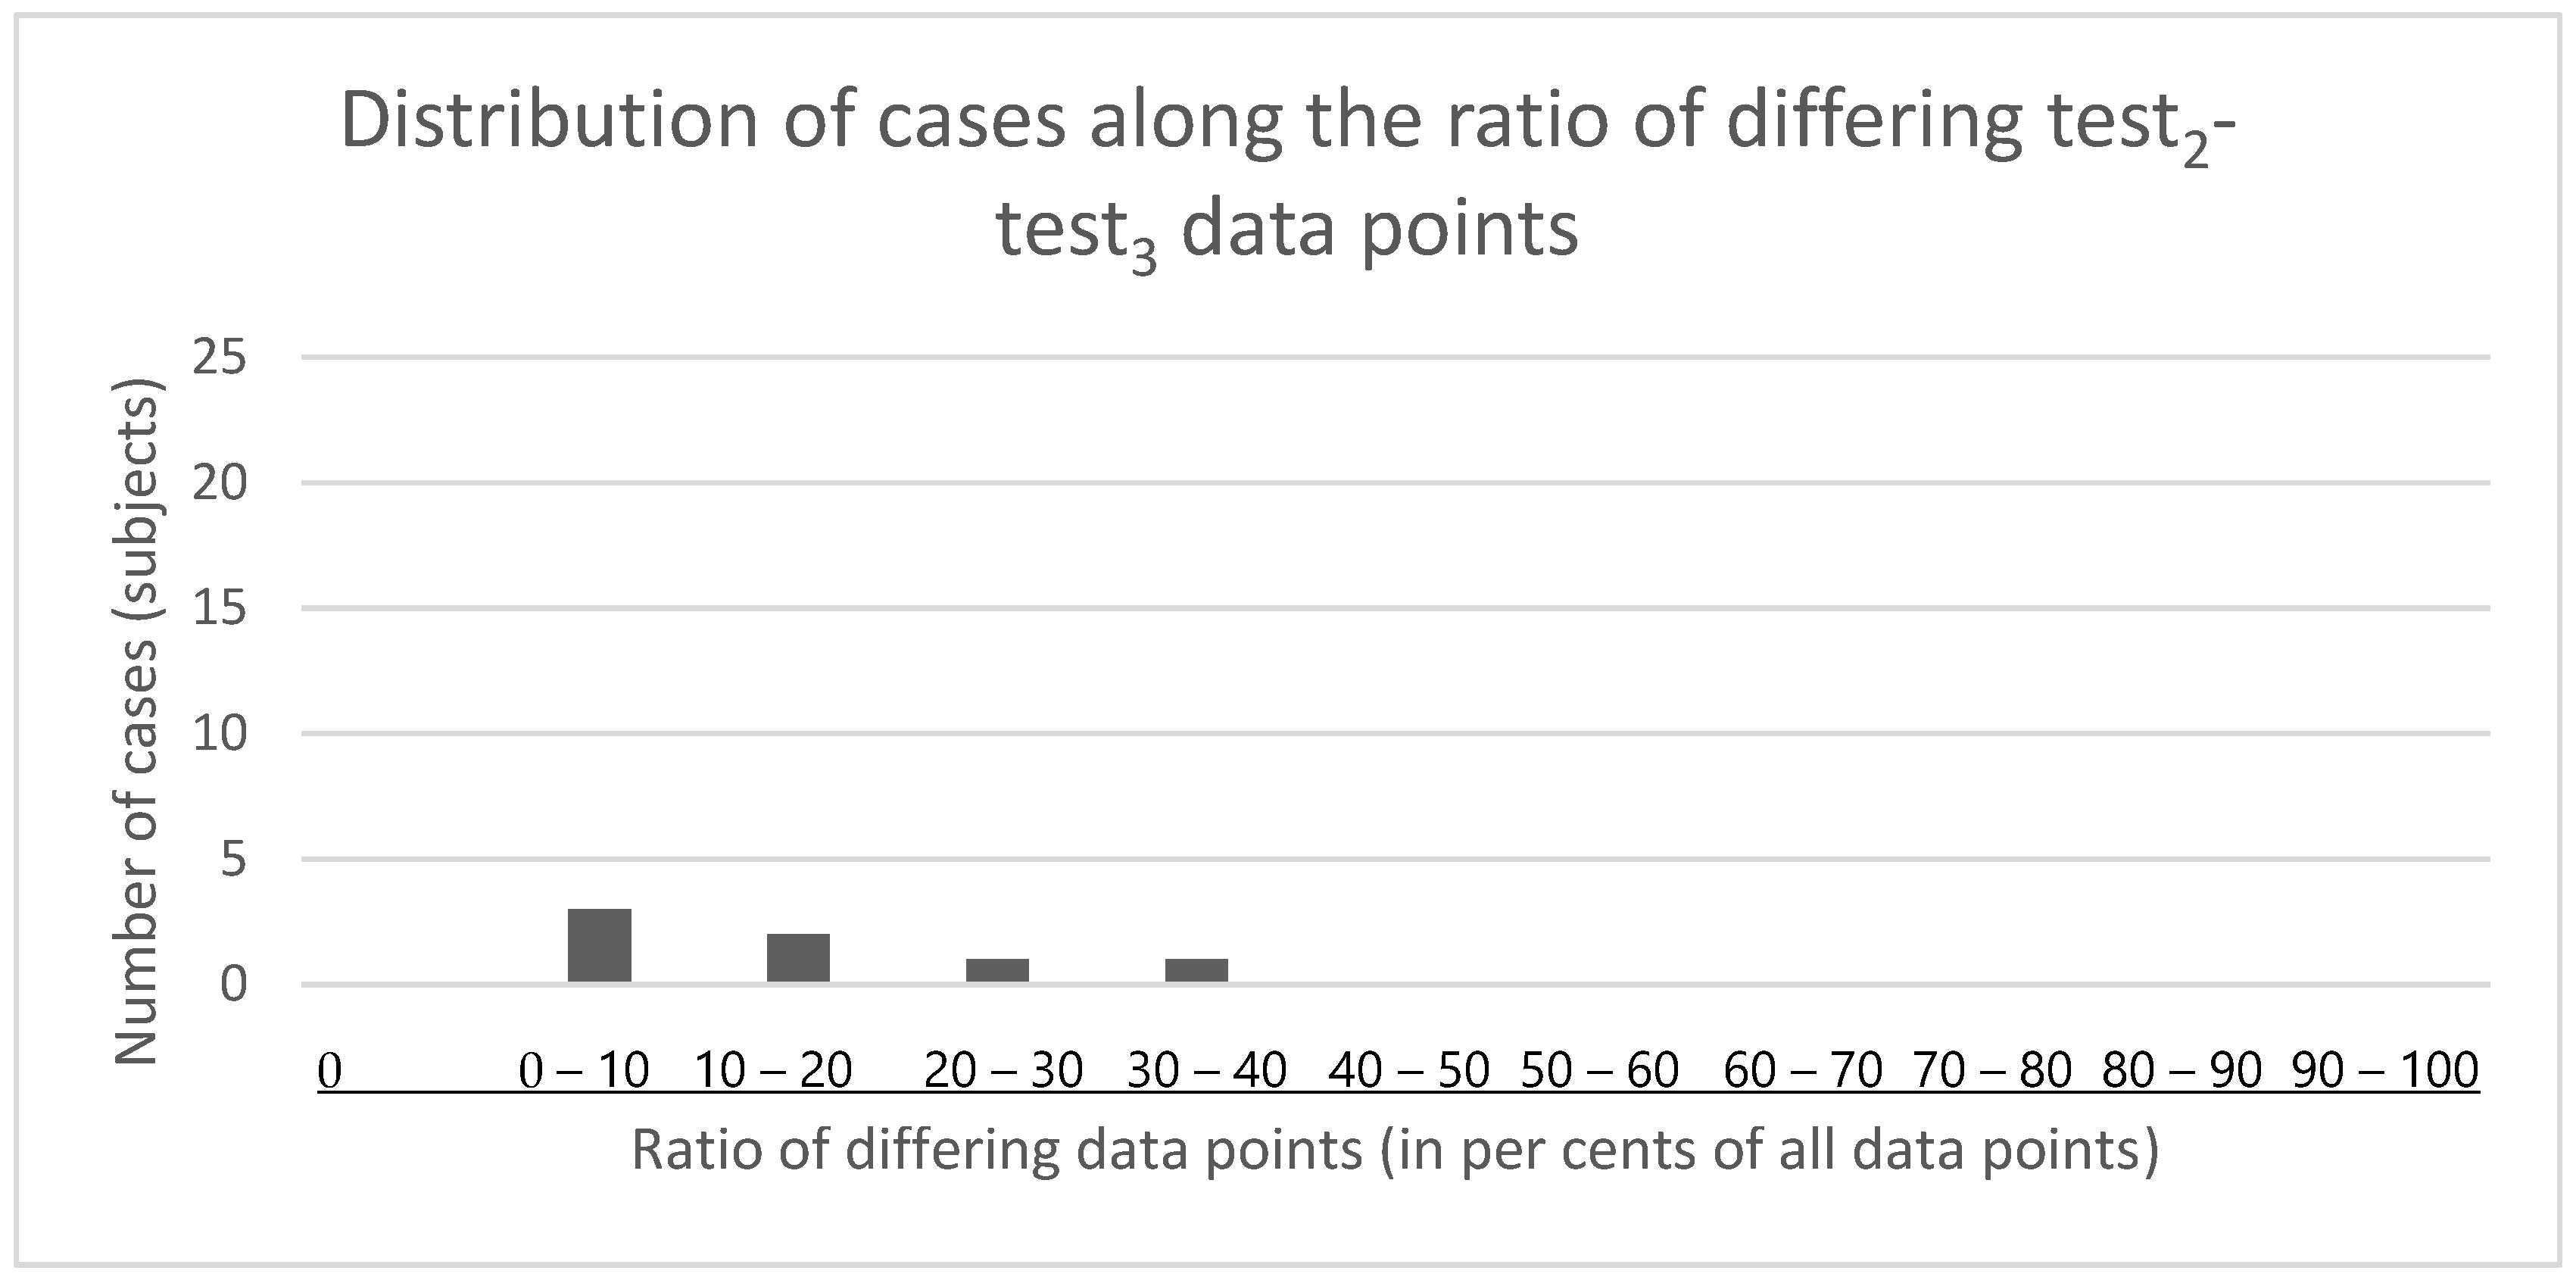
3.1.2. Test–Retest Differences between Second and Third Test Data Series

After finding differences between test1 and test2 data series in one-fifth of the cases in our sample, we explored whether better or perfect test–retest reliability can be reached by further analyses in these cases. This was motivated partly by the fact that, for the majority of the cases, the test1 and test2 datasets were identical. Following the procedure described in the Section 2, we ran another EFE analysis (test3) on each of the 12 recordings and conducted test2–test3 comparisons. From the 12 cases, 5 (3 in the ASD, and 2 in the NT group) showed identical test2 and test3 datasets—these were “stabilized” for test3. In 7 cases, test2–test3 comparisons still revealed differences. Table 3 summarizes the case flow for repeated AEFEAs.
Of the 7 individual dataset pairs with remaining differences in test2–test3 comparisons, 6 showed the same ratios of differing data points in test2–test3 as in test1–test2 contrasts. In one case (subject #65; see Appendix A Table A4 and Table A5) there were more mismatching data points in the test2–test3 comparison than in the test1–test2 comparison. The absolute values of the test–retest differences between the corresponding data points were again low, in the [−0.1; 0.1] range. All the 7 (subjects) × 8 (emotions) residual difference means remained below 0.001. The final distribution of percentages of differing data points in test2–test3 contrasts is shown in Figure 2 (analogously to the test1–test2 differences previously shown in Figure 1).
We explored the residual differences for these 7 subjects; see data for individuals in Appendix A Table A6. All the remaining differences are small, with the single highest value being 0.069 (subject #94, Happy). Although this is close to a 7% difference on a 0–1 scale, this is a single outlier difference value in the total dataset including data points in the order of magnitude of roughly 11.5 million (i.e., 72 contrasts × ~20,000 intensity data points × 8 emotions).
By observing various characteristics of the 7 cases, we attempted to identify any factor that could potentially underlie the lack of “stabilization” (such as group, age, gender, position in the list of data series, video sampling rate, etc.). We failed to identify any such potential factor. In addition, we ran group comparisons along several of these case variables, comparing subject groups corresponding to their stabilized vs. non-stabilized data series. Neither comparing a group of 48 cases to another group of 12 cases (with identical vs. nonidentical data series pairs in test1–test2), nor comparing a 53-case group to a 7-case group (identical vs. nonidentical data series pairs in test2–test3) revealed any significant cross-group differences. Additionally, as shown in Table 3, the two groups were very balanced in terms of ratios of identical/nonidentical data series pairs.

3.2. Data Robustness (Completeness)

As a background for examining emotion intensities, we briefly explored data robustness (completeness) on the “stabilized” (teststable) data series (n = 53), together with the 7 non-stabilized data series from test3. Data robustness or completeness in the present context means the ratio of successfully extracted emotion data within the total data series, as a specific (simple) measure of data quality. As explained above, at any data point, the FR8 system’s failure to assigning emotion intensity values may be either due to the failure to find the face in a video frame (FIND_FAILED logged for all emotions), or due to the failure to fit a face model onto the face found (FIT_FAILED logged for all emotions). Thus, data robustness, as a proportion of numerical emotion intensity data logged within all data points (all frames), can be assessed equivalently from any single emotion dimension.
The mean data robustness ratio for all subjects was 0.861 (SD: 0.134; min: 0.436; max: 0.998). The average frequency of face finding failure was 0.0566 (SD: 0.065; min: 0.0001; max: 0.240); the average frequency of face model fitting failure was 0.082 (SD: 0.084; min: 0.002; max: 0.417). This level of data completeness is fairly good, as compared with other recent AEFEA studies [12]. As noted in Section 3.1.1, FIT_FAILED and FIND_FAILED data points remained remarkably stable across tests and comparisons. Importantly for further analyses below, data robustness did not differ between the groups (two-tailed independent samples t-test with different variations; ns).

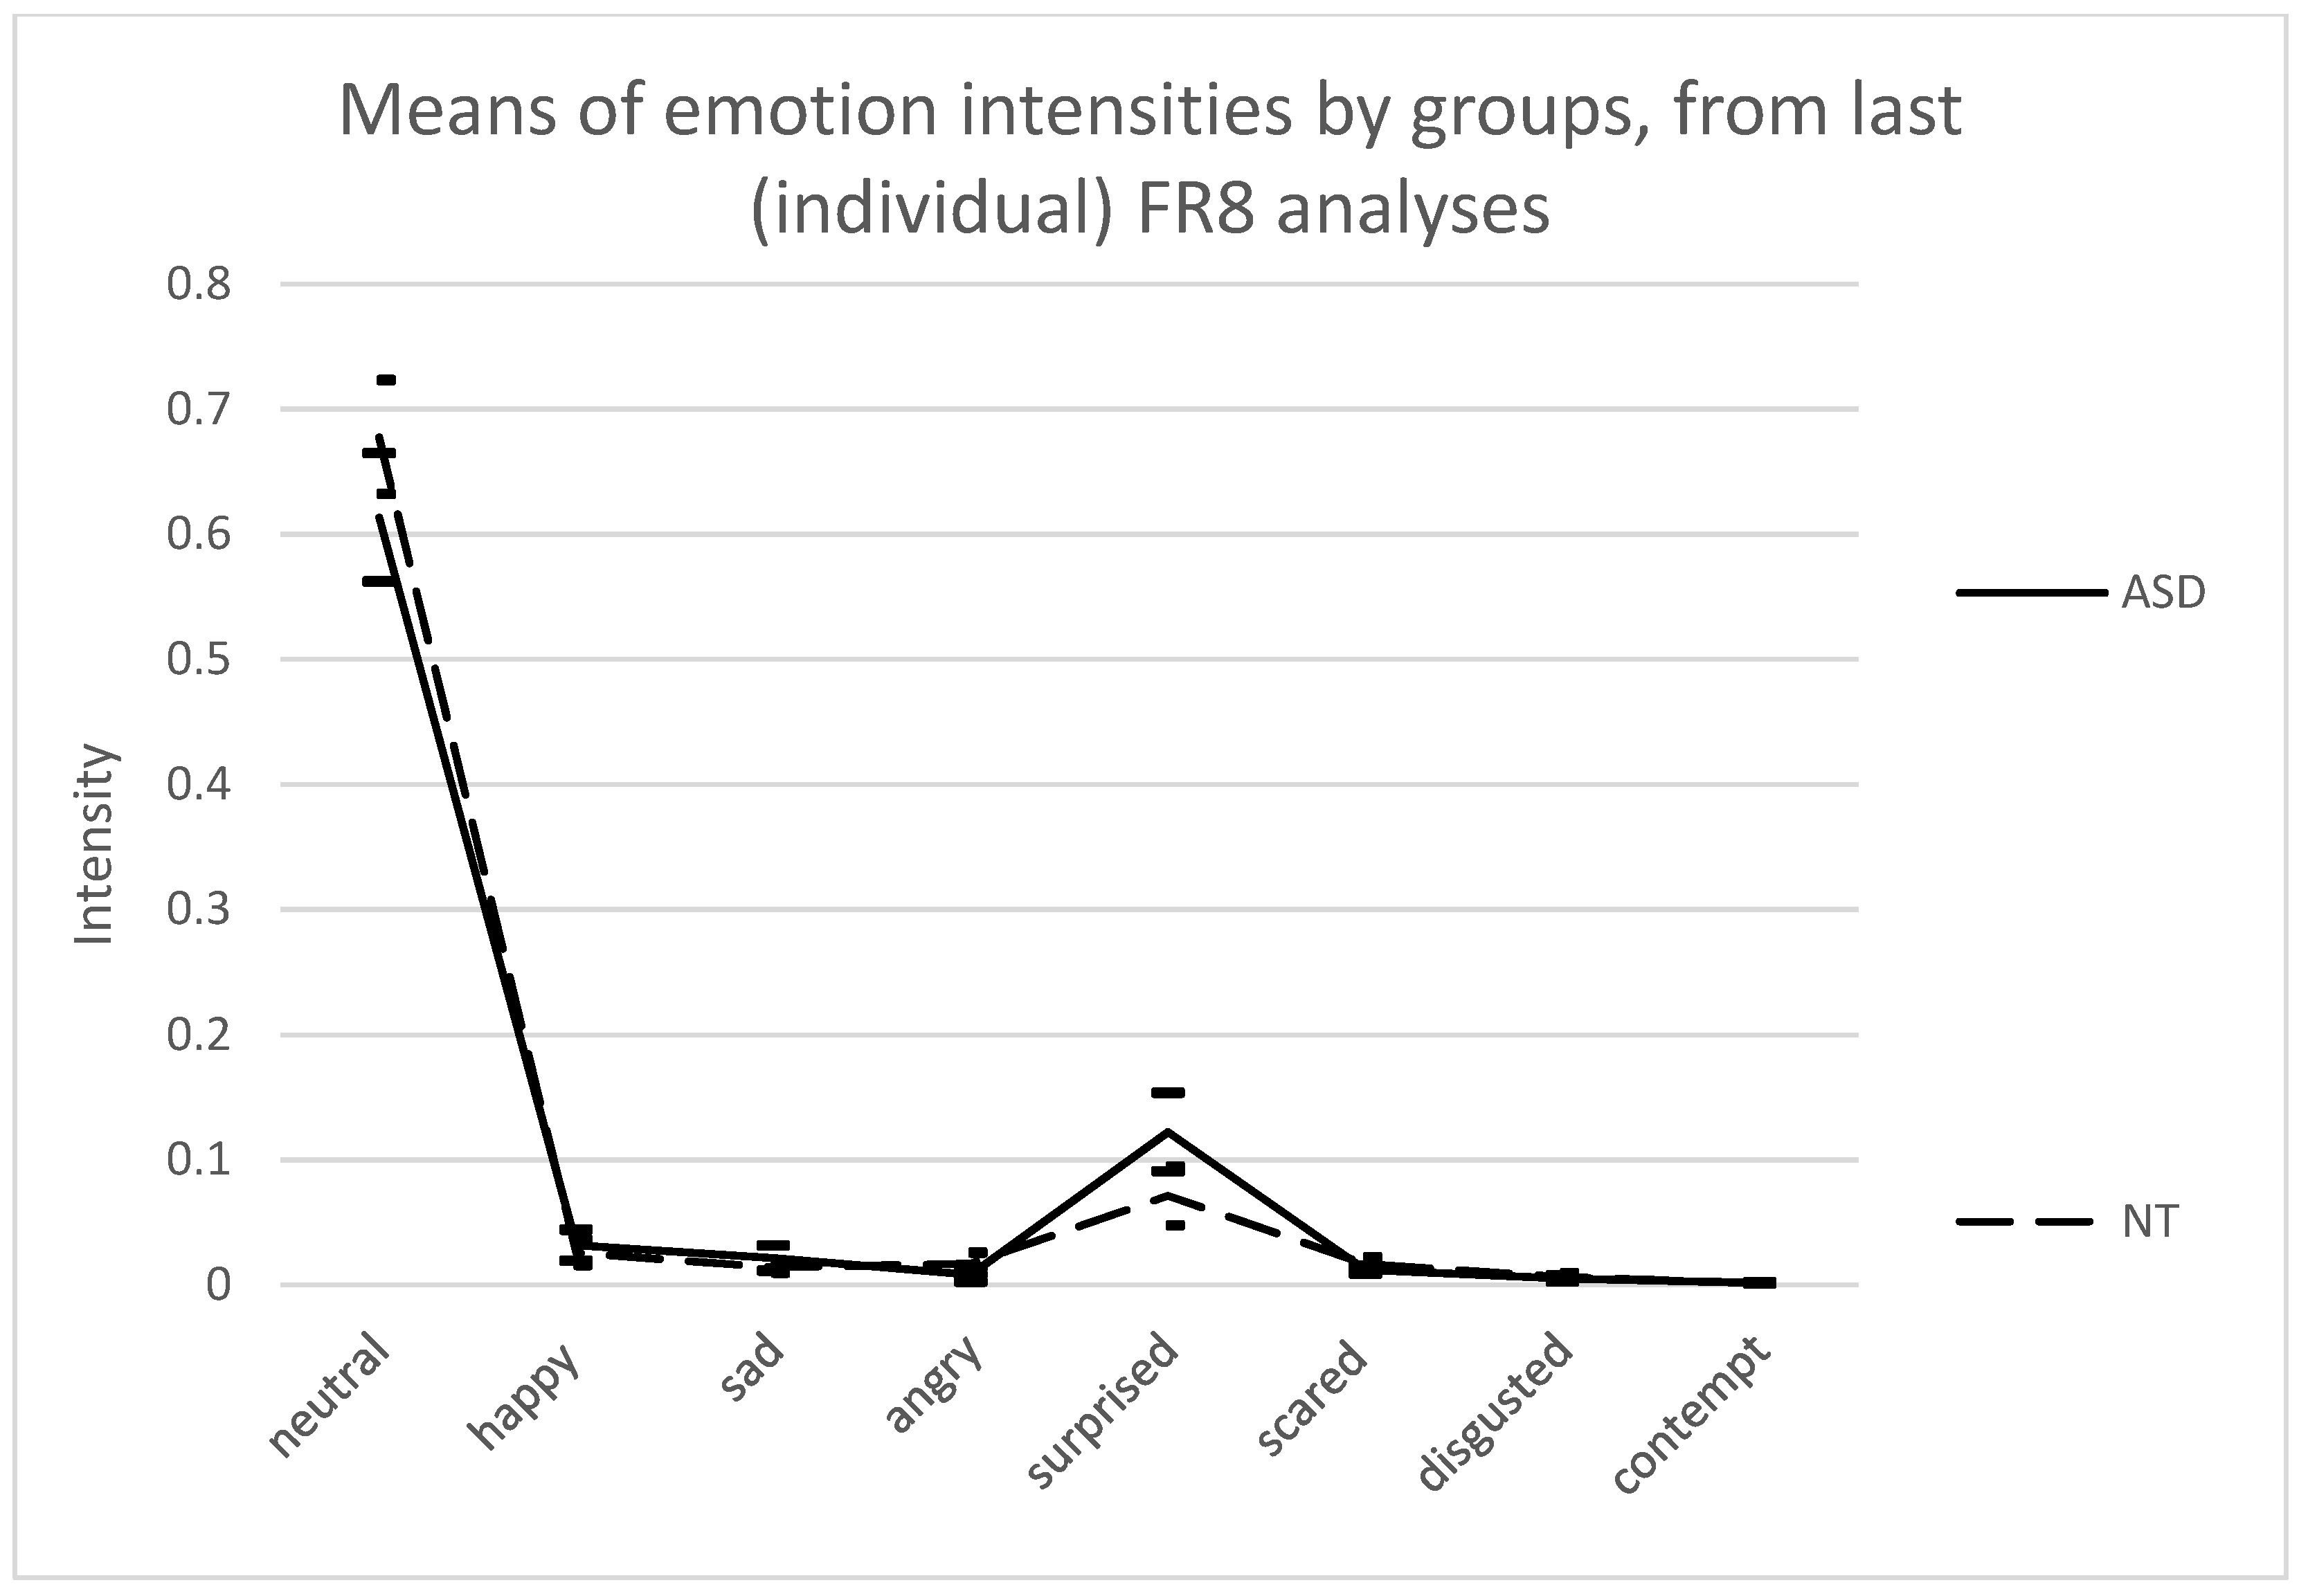
3.3. Between-Emotion and Between-Group Differences in Emotion Intensities

Finally, we explored the pattern of differences in EFE intensities across the eight emotions and between the two groups and examined whether the not-perfect test–retest reliability of AEFEA using FR8 influences this pattern. First, we calculated the emotion intensity means for each subject and each emotion dimension, using their individual data series from their last analysis (test). Accordingly, n = 53 of included individual data series showed total test–retest identity (teststable), while n = 7 individual data series came from test3, still not showing total identity to test2 data. Figure 3 shows these means for the groups.
A two-way mixed ANOVA (two groups × eight emotions; repeated measures) returned a main effect of emotion (Geisser–Greenhouse: F(1.566, 90.801) = 826.832; p < 0.001; η2partial = 0.934, ω2 = 0.930). There was no main effect of diagnosis; the interaction was marginally significant (Geisser–Greenhouse: F(1.00, 58.00) = 3.684, p = 0.0599, η2partial = 0.060, ω2 = 0.042). Repeating the same analysis without data on Neutral left the main effect of emotion significant (Geisser–Greenhouse: F(1.665, 96.589) = 51.492; p < 0.001, η2partial = 0.470, ω2 = 0.428); there emerged a main effect of diagnosis—as the equalizing effect of Neutral was suppressed, the remaining emotions showed a different overall level in the two groups, with a modest effect size (Welch’s test: F(1, 55.4) = 5.055, p = 0.0286, η2partial = 0.081, ω2 = 0.064). The diagnosis–emotion interaction was also significant, but the effect size was small (Geisser–Greenhouse: F(1.665, 96.589) = 4.456; p = 0.0391; η2partial = 0.071, ω2 = 0.049). When Surprised was also removed, the remaining six emotions still produced a significant main effect of emotion (Geisser–Greenhouse: F(2.525, 146.452) = 14.98; p < 0.001; η2partial = 0.205, ω2 = 0.165) but neither a main effect of diagnosis nor an interaction remained. The main effect of emotion in this case was due to a number of between-level differences, as indicated by Tukey’s test (Happy > [Angry, Scared, Disgusted, Contempt]; Sad > [Disgusted, Contempt]; Scared > Contempt; only those differences are listed for which p < 0.01). However, all six of these emotion means were very low in both groups (total group means: ASD: 0.0133; NT: 0.0135). The level of Neutral differed only marginally significantly between groups (W(56.6) = −1.751; p = 0.0854; Cohen’s d: −0.454; mean difference: −0.062, CI95: [−0.131; 0.009]); while the level of Surprised differed significantly in the two groups (Welch test: W(52.8) = 2.36; p = 0.022; Cohen’s d = 0.615, mean difference: 0.0469; CI95: [0.0071, 0.0876]); however, these differences would obviously not survive a type I error correction for eight emotions.
To explore if the differences between the initial (test1) dataset and the final dataset influence the results above, the same ANOVA was repeated using the test1 data of each subject. All results were very similar, so much so that the overall emotion intensity means plot was not noticeably different from Figure 3—therefore, we will not present it here.
The two-way mixed ANOVA (2 groups X 8 emotions) returned a main effect of emotion, here, too (Geisser–Greenhouse: F(1.0, 58.0) = 827.835; p < 0.001; η2partial = 0.931, ω2= 0.935). There was no main effect of diagnosis; the interaction was, again, marginally significant (Geisser–Greenhouse: F(1.00, 58.00) = 3.664, p = 0.0605, η2partial = 0.059, ω2 = 0.041). Repeating the same analysis without data on Neutral left the main effect of emotion significant (Geisser–Greenhouse: F(1.0, 58.0) = 51.387; p < 0.001, η2partial = 0.470, ω2 = 0.427), and there emerged a main effect of diagnosis; as the equalizing effect of Neutral was, again, suppressed, the remaining emotions showed a different pattern in the two groups, with a modest effect size (Welch’s test: F(1; 55.4) = 5.011, p = 0.029, η2partial = 0.080, ω2 = 0.063). The interaction was again significant, with a small effect size (Geisser–Greenhouse: F(1.0, 58.0) = 4.416; p = 0.0400; η2partial = 0.071, ω2 = 0.049). When Surprised was also removed, the remaining six emotions still produced a significant main effect of emotion (Geisser–Greenhouse: F(1.0, 58.0) = 14.955; p < 0.001; η2partial = 0.205, ω2 = 0.165) but neither a main effect of diagnosis nor an interaction remained. The post hoc comparisons between levels of emotion returned the following differences at p < 0.01: Happy > [Angry, Sad, Disgusted, Contempt]; Sad > [Disgusted, Contempt]; Scared > Contempt. Once again, all six of these emotion means were at very low intensities in both groups (total group means: ASD: 0.0133; NT: 0.0135). The level of Neutral differed, again, only marginally significantly between groups (Welch test: d(56.6) = −1.748; p = 0.0859; Cohen’s d: −0.453; mean difference: −0.061; CI95: [−0.131; 0.009]); the level of Surprised differed significantly in the two groups (Welch test: d(52.9) = 2.350; p = 0.0226; Cohen’s d = 0.612, mean difference: 0.0469; CI95: [0.0069, 0.0873].
In sum, test1 vs. the “final” differences in data series did not lead to any significant difference in the pattern of overall emotion intensity means among the different emotions and the groups.

4. Discussion

Our most important finding is that the test–retest reliability of a specific version of AEFEA technology, the FR8, is very high; however, it is not perfect. Having analyzed the same set of facial video recordings by FR8 twice (test1 and test2), we found that in 12 of the 60 cases, test1–test2 differences arose. These differences appeared in all eight of the emotion dimensions, in up to 40% of the data points altogether, but were very small in their absolute values. This suggests a remarkably high test–retest reliability as compared with human coders [14], but lags behind a perfect test–retest reliability, which is often explicitly or implicitly expected from algorithmic AEFEA technologies [41].
Another set of analyses (test3) of those facial video recordings which did not initially show total test1–test2 identity led to further test–retest convergence or stabilization in five cases. In the seven remaining cases, however, there were both test1–test2 and test2–test3 differences between the individual data series.
From the perspective of utilizing AEFEA technology in screening, diagnosis, and other health technologies, it is of special importance that our analyses did not reveal any cross-group difference in test–retest reliability. Data series from neurotypical children and from children with ASD were very similarly prone to imperfect test–retest reliability and showed very similar stabilization tendency in proportional cases. Additionally, a similar proportion of cases in both groups was left non-stabilized after three analyses. The pattern we found in the cross-group and cross-emotion differences in emotion intensities fits well with the series of previous findings on emotional display in ASD [53,56,70]. To the best of our knowledge, the test–retest reliability of AEFEA techniques has not been explored so far; therefore, these findings are unprecedented in the literature.
We address four questions: (1) Is it possible that the findings on imperfect test–retest reliability are artefacts? (2) If they are not artefacts, what may cause the imperfect test–retest reliability? (3) What factor(s) may determine which cases or data series are affected by it? (4) Does imperfect test–retest reliability influence the fundamental results?
In our view, it is crucial to consider the issue of whether the above findings may be artefacts. We see two factors that could potentially lead to the emergence of spurious results. Firstly, non-sufficient hardware performance in the course of FR8 analyses might—as pilot analyses we ran suggested—lead to noise in the emotion intensity data that could deteriorate test–retest reliability. However, the hardware configuration we used considerably surpassed that recommended by Noldus for using FR8. In addition, the partial test–retest convergence of subsequent data series could not be explained by such a factor.
Software updates of FR8, arriving between subsequent analyses and changing the input/output mapping of the system, represent another candidate. These could explain both test–retest differences and their later partial decrease (assuming subsequent updates converge towards a stable mapping). Updates, however, were turned off for FR8 during and between analyses. A “software update effect”, moreover, could not explain why some data series converged in subsequent analyses while some failed to stabilize within two subsequent comparisons.
Finally, we note that data completeness in our data series was fairly good, as compared with other recent studies [12]. Even if it were lower than usual, it would be surprising and methodologically significant if the sparsity of data could lead to imperfect test–retest reliability.
The following question arises: which feature of FR8 explains its imperfect test–retest reliability? In this study, we treated the FR8 system as a black box. We refrained from reverse-engineering it and from speculating about possible specific causes. Nevertheless, we briefly raise three possibilities. One is that artificial neural network (ANN) technology, which is a feature of FR8, may underlie our findings. ANNs “naturally” respond differently to repeated stimuli in the learning phase, and they also tend to converge onto more stable input/output mappings. In the case of such an ANN learning effect, the methodological consequences of imperfect initial test–retest reliability are still to be considered. Secondly, the “continuous calibration” feature of FaceReader arises as a candidate for changing analysis characteristics. In our understanding, continuous calibration does modulate emotion estimation output: it adjusts facial intensity values in an ongoing analysis continuously, as a function of previous intensity values in that analysis. However, FaceReader uses a fixed formula for this process—that is, if the detected raw intensities are stable across analyses, then continuous calibration in itself could not add “noise” to these. Thirdly, another, more “profane” possibility—suggested by our informal experimentation with this factor—is that hardware requirements for running FR8 might be underestimated by its producer, and insufficient hardware resources lead to unstable performance. However, this explanation would go against the fact that most data series showed either test–retest stability or stabilizing tendency across the subsequent re-analyses.
In this study, 20% of our cases/initial data series were affected by nonperfect test–retest reliability. Empirical research using AEFEA could benefit from understanding which cases/data series are more prone to this than others. Although we examined several candidate subject- or data-related factors, we failed to identify any that could determine which subsets of cases showed perfect/imperfect test–retest reliability.
The question of whether imperfect test–retest reliability of AEFEA technology substantially influences results is of crucial importance in a field of research where this issue has been ignored so far. We analyzed the patterns of cross-emotion and cross-group differences, both in the first and the last (mostly stabilized) tests’ data series, to see whether there were fundamental differences in the two sets of results. The overall patterns of emotion intensity differences remained closely similar. That is, the less-than-perfect test–retest reliability did not substantially influence these results in either group.
Two cautionary notes must be made, however. Here, we used relatively long video recordings as input for AEFEA, resulting in relatively big emotion intensity data series. Other studies have used much shorter recordings, and therefore obtained smaller data series [41,71]. We did not explore the distribution of test–retest differences along the data series, leaving it possible that potential “locally high” test–retest differences, especially in shorter data series, may have a greater effect on the patterns of the results. The overall pattern of emotion intensities itself may also affect the test–retest differences. Data from different emotions may be differently affected by the test–retest differences. Exploring this possibility was beyond the scope of this study.
Finally, we wish to point to the fact that the validity of the data gained repeatedly by FR8 was not addressed or examined in this study. Therefore, we cannot know whether the initial or the final (“stabilized”) data series were more valid. (Although small test–retest differences generally suggest little, if any, potential difference in their validity.) Accordingly, we cannot provide any insight into which should be preferred in further analyses and in reaching study conclusions, where the validity of emotion intensity data is essential.

5. Conclusions

Our study demonstrated the high but imperfect test–retest reliability of a specific AEFEA system—FR8. As the second main finding, we demonstrated that repeated analyses by FR8 can, in some cases, lead to the “stabilization” of datasets. Thirdly, the test–retest differences did not influence the patterns of cross-emotion and cross-group effects and interactions. Thus, our study does not question the validity of previous results gained by AEFEA technology. Finally, no specific pattern of test–retest reliability emerged in the group of children with ASD.
As a first exploration of the issue, our study leaves several key questions open about generalizing our results across AEFEA systems, subject groups, emotions, and emotion intensity patterns. Therefore, there are questions to be explored: whether imperfect test–retest reliability and the occasional “stabilization” effect are specific to FR8, or whether other AEFEA systems also show them; whether these phenomena are specific to our white/Caucasian child-aged sample(s) or not; and whether they arise on inputs with other emotions and/or emotion intensity patterns significantly different from those used in this study.
Although the test–retest emotion intensity differences were small, and the imperfect test–retest reliability did not have an essential effect on group-level emotion intensity differences, it may have methodological significance when shorter (sections of) data series are analyzed, and when overall intensity patterns of emotions are different from those found in this study.
It also remains to be determined whether first-test data series are less or more valid than subsequent ones, and whether gaining “stabilized” datasets (i.e., reaching perfect test–retest validity by repeated analyses) increases the validity.
Our results do not question the validity of previous results using AEFEA technology. Instead, they suggest that it is necessary to further explore and understand this key characteristic of AEFEA systems.
Finally, we ask the following question: which aspects of the functioning of FR8 account for the high but imperfect test–retest reliability and may be significant for the further development of AEFEA technologies?

Author Contributions

Conceptualization, M.G., Z.B. and K.S.; methodology, M.G., Z.B. and K.S.; software, M.G. and Z.J.; validation, M.G., Z.B. and K.S.; formal analysis, M.G., Z.J., Z.B. and K.S.; data curation, M.G., Z.J., Z.B. and B.B.; writing—original draft preparation, M.G., Z.B., Z.J. and K.S.; writing—review and editing, M.G., Z.B., Z.J. and K.S.; visualization, Z.J.; supervision, K.S.; project administration, B.B.; funding acquisition, M.G. All authors have read and agreed to the published version of the manuscript.

Funding

Various aspects of the present study and the underlying R&D project have been funded by a grant within the EIT ICT Labs Hungarian Node (PI: András Lőrincz, ELTE Eötvös Loránd University); a TÁMOP grant co-financed by the European Union and the government of Hungary (TÁMOP 4.2.1./B-09/KMR—2010-0003); the ELTE University Thematic Excellence Program 2020, supported by the National Research—Development and Innovation Office—TKP2020-IKA-05; the Social Innovation Laboratory (TINLAB) Project at ELTE University; and a fundraising campaign by the IndaGaléria (Budapest). The first, third, and fifth authors were supported via a research grant from the Hungarian Academy of Sciences, within its Content Pedagogy Research Program (2016–2021 period). The Foundation for the Development of Special Education (GYFA; Budapest) contributed to the funding of the research at several points.

Institutional Review Board Statement

The study was conducted in accordance with the Declaration of Helsinki, and approved by the Institutional Research Ethics Committee of the Bárczi Gusztáv Faculty of Special Needs Education, ELTE Eötvös Loránd University (protocol code KEB/2016/001 and date of approval: 3 February 2016).

Informed Consent Statement

Informed consent was obtained from all subjects involved in the study. All participant children were explicitly informed about the aims and circumstances of the measurements and on their right to withdraw from participation at any time, before each session. They gave oral confirmation of their understanding and consent. The caregiver (parent) of each child received both oral and written information about the aims and circumstances of the measurements, the processing and handling of the data gained, as well as on their relevant rights. They gave written consent on their own and their child’s behalf. At the beginning of each session, they were reminded of their relevant rights and confirmed their written consent orally.

Data Availability Statement

The data presented in this study are openly available at OSF.io at DOI 10.17605/OSF.IO/27EQD. The authors kindly encourage anyone to explore the data but also ask to contact us prior to any reproduction and/or further sharing of the data and/or making public any result from their analysis by any means.

Acknowledgments

Authors thank all participating children and their parents/caretakers.

Conflicts of Interest

The authors declare no conflict of interest. The funders had no role in the design of the study; in the collection, analyses, or interpretation of data; in the writing of the manuscript, or in the decision to publish the results.

Appendix A

Table A1. Relevant FR8 analysis settings and their rationale.
Analysis ParameterApplied SettingRationale
Face modelChildrenIn accordance with subjects’ age
CalibrationContinuous calibrationAims to correct for person-specific biases in facial expressions, thus not requiring an initial input of a neutral face of each subject
ClassificationSmoothen classificationRaw classification data are smoothened in relation to between-frame time gap (default setting)
Image rotationNoAll faces were recorded in upright position
Video sample rateEvery frameNo recorded frame to be skipped
ContemptTreat contempt as an emotional stateTo gain intensity values for “contempt”
Preset for face-finding functionFind all faces (slow)The most robust setting in terms of size of potential target face on the frame (minimum face fraction = 0.08)
Preset for face-modeling functionMaximum accuracy (slow)Robust setting in terms of the maximum number of iterations per frame to find face (12)
EngineUse deep face engineSlower but more accurate analysis which attempts to model the face even from partial information
Maximum face model error0.6Measure of error for estimating if face model is valid
Size of interest, maximum face fraction1Maximum value, allows the face surface to be the same as the entire image
Size of interest, face size scaling factor1.1The default factor value for increasing face size within minimum and maximum, for the analysis
Table A2. Descriptive statistics of test1–test2 emotion intensity differences averaged over total play time (all data points), separately for each emotion. Group means were calculated from individual means. Cases with identical test1–test2 data series are not included. Case numbers are too low for normality test. Notation: *: p < 0.05; **: p < 0.01.
GroupEmotionIndividual Test1–Test2 Emotion Intensity Differences
MeanSDMedianMinimumMaximumSkewnessKurtosis
ASD
(n = 6)
Neutral0.001230.003744−0.0001−0.00090.00882.387 *5.767 **
Happy−0.000890.0018780−0.00470.0002−2.286 *5.303 **
Sad0.0001030.000201000.00052.328 *5.535 **
Angry−7.3 × 10−50.0001970−0.00050.0001−2.280 *5.347 **
Surprised−0.003220.0079110−0.01940.0001−2.449 *6.000 **
Scared0.0010270.002513000.00622.449 *5.998 **
Disgusted−0.000220.000389−0.0001−0.0010.0001−2.139 *4.839 *
Contempt−5.9 × 10−50.0001470−0.00040−2.448 *5.996 **
NT
(n = 6)
Neutral2.85 × 10−60.0003270−0.00040.00060.8892.828
Happy−0.000170.0003150−0.00080−2.211 *4.956 *
Sad2.02 × 10−55.2 × 10−5000.000100
Angry0.0002550.000641000.00162.447 *5.991 **
Surprised−3.2 × 10−66.15 × 10−50−0.00010.000100
Scared0.0002640.000681000.00172.446 *5.987 **
Disgusted−2.3 × 10−50.0002520−0.00040.0004−0.0652.171
Contempt−5.8 × 10−71.39 × 10−600000
Table A3. Example distributions of test1–test2 differences, with corresponding means, separately for the 8 emotions: subject #2 (ASD). Test2–test3 data for subject #2 were identical. Frequency distributions include only data points with intensity values assigned in both test1 and test2 (therefore numerical difference could be calculated); however, matching data points with zero difference were omitted. Nonzero percent row shows the relative frequencies of mismatching data points for each emotion. As emotion intensities are scaled from 0 to 1 by FR8, the difference between two corresponding data points ranges between −1 and 1; in absolute value between 0 and 1.
Magnitude RangeNeutralHappySadAngrySurprisedScaredDisgustedContempt
diff = −100000000
−1 < diff ≤ −0.900000000
−0.9 <diff ≤ −0.800000000
−0.8 < diff ≤ −0.700000000
−0.7 < diff ≤ −0.600000000
−0.6 < diff ≤ −0.500000000
−0.5 < diff ≤ −0.400000000
−0.4 < diff ≤ −0.300000000
−0.3 < diff ≤ −0.200000000
−0.2 < diff ≤ −0.10000168000
−0.1 < diff ≤ 056387493592010,405973639795939680
0 < diff ≤ 0.111,661511911315566111,32216761
0.1 < diff ≤ 0.20000242000
0.2 < diff ≤ 0.300000000
0.3 < diff ≤ 0.400000000
0.4 < diff ≤ 0.500000000
0.5 < diff ≤ 0.600000000
0.6 < diff ≤ 0.700000000
0.7 < diff ≤ 0.800000000
0.8 < diff ≤ 0.900000000
0.9 < diff ≤ 100000000
Mean0.008829−0.004660.000509−0.00047−0.019370.006156−0.0002−0.00036
Nonzero percent0.3953330.1829150.3435490.2381280.3612370.2678140.257530.22124
Total frames43,758
Table A4. Example distributions of test1–test2 differences, with corresponding means, separately for the 8 emotions: subject #65 (ASD). Frequency distributions include only data points with intensity values assigned in both test1 and test2 (therefore numerical difference could be calculated); however, matching data points with zero difference were omitted. Nonzero percent row shows the relative frequencies of mismatching data points for each emotion. As emotion intensities are scaled from 0 to 1 by FR8, the difference between two corresponding data points ranges between −1 and 1; in absolute value between 0 and 1.
Magnitude RangeNeutralHappySadAngrySurprisedScaredDisgustedContempt
diff = −100000000
−1 < diff ≤ −0.900000000
−0.9 < diff ≤ −0.800000000
−0.8 < diff ≤ −0.700000000
−0.7 < diff ≤ −0.600000000
−0.6 < diff ≤ −0.510000000
−0.5 < diff ≤ −0.400000000
−0.4 < diff ≤ −0.300000000
−0.3 < diff ≤ −0.200000010
−0.2 < diff ≤ −0.100000000
−0.1 < diff ≤ 020516353124794483516
0 < diff ≤ 0.153526207202812680
0.1 < diff ≤ 0.200000000
0.2 < diff ≤ 0.300000000
0.3 < diff ≤ 0.400000000
0.4 < diff ≤ 0.500000000
0.5 < diff ≤ 0.600000000
0.6 < diff ≤ 0.700000000
0.7 < diff ≤ 0.800000000
0.8 < diff ≤ 0.900000000
0.9 < diff ≤ 100000000
Mean−0.00092−4.1 × 10⁻⁵−8.8 × 10−62.23 × 10−5−2.5 × 10⁻⁶−3.2 × 10⁻⁵−0.00099−6.19 × 10⁻⁸
Nonzero percent0.0319930.0113550.0274170.016580.0206810.0140320.0151980.022279
Total frames23,161
Table A5. Distributions of emotion intensity differences for Subject #65 (ASD) from test2–test3 comparison. Subject #65 was the only participant whose number of differing data points increased from test1–test2 to test2–test3 comparison. Still, the corresponding distribution means are quite low in both comparisons (cf. Appendix A Table A4).
Magnitude RangeNeutralHappySadAngrySurprisedScaredDisgustedContempt
diff = −100000000
−1 < diff ≤ −0.900000000
−0.9 < diff ≤ −0.800000000
−0.8 < diff ≤ −0.700000000
−0.7 < diff ≤ −0.600000000
−0.6 < diff ≤ −0.500000000
−0.5 < diff ≤ −0.400000000
−0.4 < diff ≤ −0.300000000
−0.3 < diff ≤ −0.200000000
−0.2 < diff ≤ −0.100000000
−0.1 < diff ≤ 0250656164271394648137804570
0 < diff ≤ 0.155881600304341328583506
0.1 < diff ≤ 0.200000000
0.2 < diff ≤ 0.300000010
0.3 < diff ≤ 0.400000000
0.4 < diff ≤ 0.500000000
0.5 < diff ≤ 0.610000000
0.6 < diff ≤ 0.700000000
0.7 < diff < = 0.800000000
0.8 < diff ≤ 0.900000000
0.9 < diff ≤ 100000000
Mean9 × 10−52 × 10−54 × 10−5−3 × 10⁻⁶−5.7 × 10−53 × 10−60.000403−2.29 × 10⁻⁸
Nonzero percent0.34950.02430.30340.13740.1803890.21150.0373040.2191615
Total frames:23,161
Table A6. Residual differences between test2 and test3 intensity data for the 7 cases which did not “stabilize” for the test2–test3 comparison. All maxima are absolute values. Frequencies of differing data points are shown relative to (i) the number of all data points: “rel. freq. in all data”, and to (ii) the number of “valid” data points with numerical intensity values (thus excluding data points with FIT_FAILED or FIND_FAILED error signals): “rel. freq. in valid data”.
Emotion Means, Maxima, and Relative Frequencies of Differing Data Points
SubjectNeutralHappySadAngrySurprisedScaredDisgustedContempt
#27Mean−2.3 × 10−63.37 × 10−61.2 × 10−67.29 × 10−7−2.4 × 10−51.13 × 10−64.27 × 10−54.46 × 10−8
maximum0.0014670.0019723.79 × 10−60.0001580.0113182.54 × 10−60.0072651.49 × 10−7
rel. freq. in all data0.0841170.0275270.0568290.0268080.082870.0459430.0259930.032611
rel. freq. in valid data0.102060.0333990.0689510.0325260.1005470.0557430.0315370.039567
#43Mean−6.7 × 10−69.14 × 10−88.03 × 10⁻⁶−6.7 × 10⁻⁷−1.1 × 10⁻⁶−4.1 × 10⁻⁷−4.6 × 10⁻⁸−2.4 × 10⁻⁸
maximum0.0052835.29 × 10−50.0020691.79 × 10−61.39 × 10−59.04 × 10−71.1 × 10−71 × 10−7
rel. freq. in all data0.2165520.1015490.1094820.1051680.1593520.1758210.0403140.166868
rel. freq. in valid data0.2630160.1233380.1329730.1277330.1935430.2135450.0489630.202671
#46Mean3.72 × 10−6−9 × 10⁻⁶−1.6 × 10⁻⁷−2.8 × 10⁻⁸−1.3 × 10−51.31 × 10−7−2.2 × 10−81.32 × 10−7
maximum0.0044410.0039936 × 10−71.32 × 10−70.0033313.86 × 10−51.67 × 10−65.37 × 10−7
rel. freq. in all data0.2973950.2152510.1335310.2182190.2614570.244360.1042810.203288
rel. freq. in valid data0.3106980.2248790.1395040.227980.2731520.255290.1089460.212381
#55Mean−1.5 × 10−54.36 × 10−7−1.6 × 10⁻⁶−0.0014−9.3 × 10⁻⁶−0.00147−0.00033−1.6 × 10⁻⁸
maximum0.0073175.29 × 10−54.08 × 10−60.1141741.99 × 10−50.1431540.0267984 × 10−8
rel. freq. in all data0.0592240.0333430.0319440.0337620.0520430.0352080.0295650.036794
rel. freq. in valid data0.0636020.0358070.0343050.0362580.0558890.037810.0317510.039513
#65Mean2.13 × 10−5−1.5 × 10−53.97 × 10−5−3.5 × 10⁻⁶−5.7 × 10−51.49 × 10−60.000171−2.3 × 10⁻⁸
maximum0.0129130.0013190.0302750.0036760.0246880.0011890.023022 × 10−7
rel. freq. in all data0.349510.0242650.3033980.1373430.1803460.2114760.0373040.219118
rel. freq. in valid data0.5003090.0347340.4343020.1966010.2581580.3027190.0533990.313659
#70Mean−3.8 × 10⁻⁶−1 × 10−68.16 × 10−6−1.2 × 10⁻⁷−7.7 × 10⁻⁷−1.7 × 10⁻⁸−6.7 × 10⁻⁸−9.5 × 10⁻⁸
maximum0.0037993.25 × 10−60.0076717.72 × 10−53.09 × 10−61 × 10−72 × 10−73.53 × 10−7
rel. freq. in all data0.086960.0200230.0889460.0731420.0388880.0164650.0301590.067433
rel. freq. in valid data0.1256430.028930.1285120.1056780.0561860.023790.0435740.09743
#94Mean−2.2 × 10−52.63 × 10−59.85 × 10−72.78 × 10−6−5.8 × 10⁻⁶−5.3 × 10⁻⁷−4 × 10⁻⁶−4.9 × 10⁻⁷
maximum0.0203480.0693510.028240.0057373.15 × 10−51.81 × 10−60.0508320.000802
rel. freq. in all data0.5143960.255650.287630.331380.3314260.2783460.2646070.322986
rel. freq. in valid data0.8019590.3985670.4484250.5166310.5167040.433950.412530.503546

References

  1. Cohn, J.F.; Kanade, T. Use of automated facial image analysis for measurement of emotion expression. In Handbook of Emotion Elicitation and Assessment; Coan, J.A., Allen, J.J.B., Eds.; Oxford University Press: New York, NY, USA, 2007; pp. 222–228. [Google Scholar]
  2. Martinez, A.M. The Promises and Perils of Automated Facial Action Coding in Studying Children’s Emotions. Dev. Psychol. 2019, 55, 1965–1981. [Google Scholar] [CrossRef] [PubMed] [Green Version]
  3. Stöckli, S.; Schulte-Mecklenbeck, M.; Borer, S.; Samson, A.C. Facial Expression Analysis with AFFDEX and FACET: A Validation Study. Behav. Res. 2018, 50, 1446–1460. [Google Scholar] [CrossRef] [PubMed]
  4. Valstar, M. Automatic Facial Expression Analysis. In Understanding Facial Expressions in Communication; Mandal, M.K., Awasthi, A., Eds.; Springer: New Delhi, India, 2015; pp. 143–172. ISBN 978-81-322-1933-0. [Google Scholar]
  5. Lewinski, P.; den Uyl, T.M.; Butler, C. Automated Facial Coding: Validation of Basic Emotions and FACS AUs in FaceReader. J. Neurosci. Psychol. Econ. 2014, 7, 227–236. [Google Scholar] [CrossRef] [Green Version]
  6. Flynn, M.; Effraimidis, D.; Angelopoulou, A.; Kapetanios, E.; Williams, D.; Hemanth, J.; Towell, T. Assessing the Effectiveness of Automated Emotion Recognition in Adults and Children for Clinical Investigation. Front. Hum. Neurosci. 2020, 14, 70. [Google Scholar] [CrossRef] [PubMed] [Green Version]
  7. Mortillaro, M.; Meuleman, B.; Scherer, K.R. Automated Recognition of Emotion appraisals. In Handbook of Research on Synthesizing Human Emotion in Intelligent Systems and Robotics; Vallverdú, J., Ed.; Advances in Computational Intelligence and Robotics; IGI Global: Hershey, PA, USA, 2015; ISBN 978-1-4666-7278-9. [Google Scholar]
  8. Clark, E.A.; Kessinger, J.; Duncan, S.E.; Bell, M.A.; Lahne, J.; Gallagher, D.L.; O’Keefe, S.F. The Facial Action Coding System for Characterization of Human Affective Response to Consumer Product-Based Stimuli: A Systematic Review. Front. Psychol. 2020, 11, 920. [Google Scholar] [CrossRef] [PubMed]
  9. Davies, H.; Wolz, I.; Leppanen, J.; Fernandez-Aranda, F.; Schmidt, U.; Tchanturia, K. Facial Expression to Emotional Stimuli in Non-Psychotic Disorders: A Systematic Review and Meta-Analysis. Neurosci. Biobehav. Rev. 2016, 64, 252–271. [Google Scholar] [CrossRef] [PubMed] [Green Version]
  10. Girard, J.M.; Cohn, J.F.; Mahoor, M.H.; Mavadati, S.; Rosenwald, D.P. Social Risk and Depression: Evidence from Manual and Automatic Facial Expression Analysis. In Proceedings of the 2013 10th IEEE International Conference and Workshops on Automatic Face and Gesture Recognition (FG), Shanghai, China, 22–26 April 2013; pp. 1–8. [Google Scholar]
  11. Ekman, P.; Friesen, W.V. Measuring Facial Movement. J. Nonverbal Behav. 1976, 1, 56–75. [Google Scholar] [CrossRef]
  12. Samadiani, N.; Huang, G.; Cai, B.; Luo, W.; Chi, C.-H.; Xiang, Y.; He, J. A Review on Automatic Facial Expression Recognition Systems Assisted by Multimodal Sensor Data. Sensors 2019, 19, 1863. [Google Scholar] [CrossRef] [PubMed] [Green Version]
  13. Ekman, P.; Rosenberg, E.L. What the Face Reveals Basic and Applied Studies of Spontaneous Expression Using the Facial Action Coding System (FACS); Oxford University Press: Oxford, UK, 2005; ISBN 978-0-19-517964-4. [Google Scholar]
  14. Sayette, M.A.; Cohn, J.F.; Wertz, J.M.; Perrott, M.A.; Parrott, D.J. A psychometric evaluation of the facial action coding system for assessing spontaneous expression. J. Nonverbal Behav. 2001, 25, 167–185. [Google Scholar] [CrossRef]
  15. Valstar, M.F.; Mehu, M.; Bihan, J.; Pantic, M.; Scherer, K. Meta-Analysis of the First Facial Expression Recognition Challenge. IEEE Trans. Syst. Man Cybern. B 2012, 42, 966–979. [Google Scholar] [CrossRef] [PubMed] [Green Version]
  16. El Kaliouby, R.; Robinson, P. Real-Time Inference of Complex Mental States from Facial Expressions and Head Gestures. In Real-Time Vision for Human-Computer Interaction; Kisačanin, B., Pavlović, V., Huang, T.S., Eds.; Springer: Boston, MA, USA, 2005; pp. 181–200. ISBN 978-0-387-27697-7. [Google Scholar]
  17. McDuff, D.; Kaliouby, R.E.; Cohn, J.F.; Picard, R.W. Predicting Ad Liking and Purchase Intent: Large-Scale Analysis of Facial Responses to Ads. IEEE Trans. Affect. Comput. 2015, 6, 223–235. [Google Scholar] [CrossRef] [Green Version]
  18. Zeng, Z.; Pantic, M.; Roisman, G.I.; Huang, T.S. A Survey of Affect Recognition Methods: Audio, Visual, and Spontaneous Expressions. IEEE Trans. Pattern Anal. Mach. Intell. 2009, 31, 39–58. [Google Scholar] [CrossRef]
  19. Littlewort, G.; Whitehill, J.; Wu, T.; Fasel, I.; Frank, M.; Movellan, J.; Bartlett, M. The Computer Expression Recognition Toolbox (CERT). In Proceedings of the Face and Gesture 2011, Santa Barbara, CA, USA, 21–25 March 2011; pp. 298–305. [Google Scholar]
  20. Den Uyl, M.J.; van Kuilenburg, H. The FaceReader: Online facial expression recognition. In Proceedings of the Measuring Behavior, Wageningen, The Netherlands, 30 August–2 September 2005; pp. 589–590. Available online: http://citeseerx.ist.psu.edu/viewdoc/download?doi=10.1.1.116.5261&rep=rep1&type=pdf (accessed on 15 August 2019).
  21. Dupré, D.; Krumhuber, E.G.; Küster, D.; McKeown, G.J. A Performance Comparison of Eight Commercially Available Automatic Classifiers for Facial Affect Recognition. PLoS ONE 2020, 15, e0231968. [Google Scholar] [CrossRef] [PubMed]
  22. Martinez, B.; Valstar, M.F. Advances, Challenges, and Opportunities in Automatic Facial Expression Recognition. In Advances in Face Detection and Facial Image Analysis; Kawulok, M., Celebi, M.E., Smolka, B., Eds.; Springer International Publishing: Cham, Switzerland, 2016; pp. 63–100. ISBN 978-3-319-25956-7. [Google Scholar]
  23. Borges, N.; Lindblom, L.; Clarke, B.; Gander, A.; Lowe, R. Classifying Confusion: Autodetection of Communicative Misunderstandings Using Facial Action Units. In Proceedings of the 2019 8th International Conference on Affective Computing and Intelligent Interaction Workshops and Demos (ACIIW), Cambridge, UK, 3–6 September 2019; pp. 401–406. [Google Scholar]
  24. Cohn, J.F.; De La Torre, F. Automated Face Analysis for Affective Computing. In The Oxford Handbook of Affective Computing; Calvo, R., D’Mello, S., Gratch, J., Kappas, A., Eds.; Oxford University Press: Oxford, UK, 2015; ISBN 978-0-19-994223-7. [Google Scholar]
  25. Kulke, L.; Feyerabend, D.; Schacht, A. A Comparison of the Affectiva IMotions Facial Expression Analysis Software with EMG for Identifying Facial Expressions of Emotion. Front. Psychol. 2020, 11, 329. [Google Scholar] [CrossRef] [PubMed]
  26. Beumer, G.M.; Tao, Q.; Bazen, A.M.; Veldhuis, R.N.J. A Landmark Paper in Face Recognition. In Proceedings of the 7th International Conference on Automatic Face and Gesture Recognition (FGR06), Southampton, UK, 10–12 April 2006; pp. 73–78. [Google Scholar]
  27. Cootes, T.F.; Edwards, G.J.; Taylor, C.J. Active Appearance Models. IEEE Trans. Pattern Anal. Mach. Intell. 2001, 23, 681–685. [Google Scholar] [CrossRef] [Green Version]
  28. Dupré, D.; Andelic, N.; Morrison, G.; McKeown, G. Accuracy of Three Commercial Automatic Emotion Recognition Systems across Different Individuals and Their Facial Expressions. In Proceedings of the 2018 IEEE International Conference on Pervasive Computing and Communications Workshops (PerCom Workshops), Athens, Greece, 19–23 March 2018; pp. 627–632. [Google Scholar]
  29. Viola, P.; Jones, M. Rapid Object Detection Using a Boosted Cascade of Simple Features. In Proceedings of the 2001 IEEE Computer Society Conference on Computer Vision and Pattern Recognition (CVPR 2001), Kauai, HI, USA, 8–14 December 2001; Volume 1, pp. I-511–I-518. [Google Scholar]
  30. Van Kuilenburg, H.; Wiering, M.; den Uyl, M. A Model Based Method for Automatic Facial Expression Recognition. In Machine Learning: ECML 2005; Gama, J., Camacho, R., Brazdil, P.B., Jorge, A.M., Torgo, L., Eds.; Lecture Notes in Computer Science; Springer: Berlin/Heidelberg, Germany, 2005; Volume 3720, pp. 194–205. ISBN 978-3-540-29243-2. [Google Scholar]
  31. Lundqvist, D.; Flykt, A.; Öhman, A. The Karolinska Directed Emotional Faces—KDEF (CD ROM); Karolinska Institute, Department of Clinical Neuroscience, Psychology Section: Stockholm, Sweden, 1998. [Google Scholar]
  32. Olszanowski, M.; Pochwatko, G.; Kuklinski, K.; Scibor-Rylski, M.; Lewinski, P.; Ohme, R.K. Warsaw Set of Emotional Facial Expression Pictures: A Validation Study of Facial Display Photographs. Front. Psychol. 2015, 5, 1516. [Google Scholar] [CrossRef] [PubMed]
  33. Van der Schalk, J.; Hawk, S.T.; Fischer, A.H.; Doosje, B. Moving Faces, Looking Places: Validation of the Amsterdam Dynamic Facial Expression Set (ADFES). Emotion 2011, 11, 907–920. [Google Scholar] [CrossRef] [PubMed]
  34. Lewinski, P. Automated Facial Coding Software Outperforms People in Recognizing Neutral Faces as Neutral from Standardized Datasets. Front. Psychol. 2015, 6, 1386. [Google Scholar] [CrossRef] [PubMed] [Green Version]
  35. Skiendziel, T.; Rösch, A.G.; Schultheiss, O.C. Assessing the Convergent Validity between the Automated Emotion Recognition Software Noldus FaceReader 7 and Facial Action Coding System Scoring. PLoS ONE 2019, 14, e0223905. [Google Scholar] [CrossRef] [PubMed] [Green Version]
  36. Rösch, A.G. The Influence of Implicit Motives on the Expression and Perception of Facial Expressions of Emotion [Der Einfluss impliziter Motive auf den Ausdruck und die Wahrnehmung Emotionaler Gesichtsausdrücke]. Ph.D. Thesis, Friedrich-Alexander University, Erlangen, Germany, 2012. Available online: https://opus4.kobv.de/opus4-fau/frontdoor/index/index/docId/2304 (accessed on 20 December 2021).
  37. Cohn, J.F.; Ambadar, Z.; Ekman, P. Observer-based measurement of facial expression with the facial action coding system. In Handbook of Emotion Elicitation and Assessment; Coan, J.A., Allen, J.J.B., Eds.; Oxford University Press: New York, NY, USA, 2007; pp. 203–221. [Google Scholar]
  38. Beringer, M.; Spohn, F.; Hildebrandt, A.; Wacker, J.; Recio, G. Reliability and Validity of Machine Vision for the Assessment of Facial Expressions. Cogn. Syst. Res. 2019, 56, 119–132. [Google Scholar] [CrossRef]
  39. Terzis, V.; Moridis, C.N.; Economides, A.A. Measuring Instant Emotions during a Self-Assessment Test: The Use of FaceReader. In Proceedings of the 7th International Conference on Methods and Techniques in Behavioral Research—MB ’10, Eindhoven, The Netherlands, 24–27 August 2010; ACM Press: New York, NY, USA, 2010; pp. 1–4. [Google Scholar]
  40. D’Arcey, J.T. Assessing the Validity of FaceReader Using Facial EMG; California State University: Chico, CA, USA, 2013; Available online: http://citeseerx.ist.psu.edu/viewdoc/download?doi=10.1.1.916.6560&rep=rep1&type=pdf (accessed on 5 March 2020).
  41. Owada, K.; Kojima, M.; Yassin, W.; Kuroda, M.; Kawakubo, Y.; Kuwabara, H.; Kano, Y.; Yamasue, H. Computer-Analyzed Facial Expression as a Surrogate Marker for Autism Spectrum Social Core Symptoms. PLoS ONE 2018, 13, e0190442. [Google Scholar] [CrossRef] [Green Version]
  42. Carpenter, K.L.H.; Hahemi, J.; Campbell, K.; Lippmann, S.J.; Baker, J.P.; Egger, H.L.; Espinosa, S.; Vermeer, S.; Sapiro, G.; Dawson, G. Digital Behavioral Phenotyping Detects Atypical Pattern of Facial Expression in Toddlers with Autism. Autism Res. 2021, 14, 488–499. [Google Scholar] [CrossRef] [PubMed]
  43. Bersani, F.S.; Polli, E.; Valeriani, G.; Zullo, D.; Melcore, C.; Capra, E.; Quartini, A.; Marino, P.; Minichino, A.; Bernabei, L.; et al. Facial Expression in Patients with Bipolar Disorder and Schizophrenia in Response to Emotional Stimuli: A Partially Shared Cognitive and Social Deficit of the Two Disorders. NDT 2013, 9, 1137–1144. [Google Scholar] [CrossRef] [Green Version]
  44. Leppanen, J.; Dapelo, M.M.; Davies, H.; Lang, K.; Treasure, J.; Tchanturia, K. Computerised Analysis of Facial Emotion Expression in Eating Disorders. PLoS ONE 2017, 12, e0178972. [Google Scholar] [CrossRef] [PubMed] [Green Version]
  45. Mass, E.; Belostoky, L. Craniofacial Morphology of Children with Williams Syndrome. Cleft Palate-Craniofacial J. 1993, 30, 343–349. [Google Scholar] [CrossRef] [PubMed]
  46. Zhao, Q.; Okada, K.; Rosenbaum, K.; Kehoe, L.; Zand, D.J.; Sze, R.; Summar, M.; Linguraru, M.G. Digital Facial Dysmorphology for Genetic Screening: Hierarchical Constrained Local Model Using ICA. Med. Image Anal. 2014, 18, 699–710. [Google Scholar] [CrossRef] [PubMed]
  47. American Psychiatric Association. Diagnostic and Statistical Manual of Mental Disorders: DSM-5, 5th ed.; American Psychiatric Association: Washington, DC, USA, 2013; ISBN 978-0-89042-554-1. [Google Scholar]
  48. Aldridge, K.; George, I.D.; Cole, K.K.; Austin, J.R.; Takahashi, T.N.; Duan, Y.; Miles, J.H. Facial Phenotypes in Subgroups of Prepubertal Boys with Autism Spectrum Disorders Are Correlated with Clinical Phenotypes. Mol. Autism 2011, 2, 15. [Google Scholar] [CrossRef] [PubMed] [Green Version]
  49. Bonnet-Brilhault, F.; Rajerison, T.A.; Paillet, C.; Guimard-Brunault, M.; Saby, A.; Ponson, L.; Tripi, G.; Malvy, J.; Roux, S. Autism Is a Prenatal Disorder: Evidence from Late Gestation Brain Overgrowth: Prenatal Brain Overgrowth in Autism. Autism Res. 2018, 11, 1635–1642. [Google Scholar] [CrossRef]
  50. Sacco, R.; Gabriele, S.; Persico, A.M. Head Circumference and Brain Size in Autism Spectrum Disorder: A Systematic Review and Meta-Analysis. Psychiatry Res. Neuroimaging 2015, 234, 239–251. [Google Scholar] [CrossRef]
  51. Tan, D.W.; Gilani, S.Z.; Maybery, M.T.; Mian, A.; Hunt, A.; Walters, M.; Whitehouse, A.J.O. Hypermasculinised Facial Morphology in Boys and Girls with Autism Spectrum Disorder and Its Association with Symptomatology. Sci. Rep. 2017, 7, 9348. [Google Scholar] [CrossRef] [Green Version]
  52. Tripi, G.; Roux, S.; Matranga, D.; Maniscalco, L.; Glorioso, P.; Bonnet-Brilhault, F.; Roccella, M. Cranio-Facial Characteristics in Children with Autism Spectrum Disorders (ASD). JCM 2019, 8, 641. [Google Scholar] [CrossRef] [PubMed] [Green Version]
  53. Grossard, C.; Dapogny, A.; Cohen, D.; Bernheim, S.; Juillet, E.; Hamel, F.; Hun, S.; Bourgeois, J.; Pellerin, H.; Serret, S.; et al. Children with Autism Spectrum Disorder Produce More Ambiguous and Less Socially Meaningful Facial Expressions: An Experimental Study Using Random Forest Classifiers. Mol. Autism 2020, 11, 5. [Google Scholar] [CrossRef] [PubMed] [Green Version]
  54. Grossman, R.B.; Edelson, L.R.; Tager-Flusberg, H. Emotional Facial and Vocal Expressions During Story Retelling by Children and Adolescents with High-Functioning Autism. J. Speech Lang. Hear. Res. 2013, 56, 1035–1044. [Google Scholar] [CrossRef] [Green Version]
  55. Reddy, V.; Williams, E.; Vaughan, A. Sharing Humour and Laughter in Autism and Down’s Syndrome. Br. J. Psychol. 2002, 93, 219–242. [Google Scholar] [CrossRef] [PubMed]
  56. Trevisan, D.A.; Hoskyn, M.; Birmingham, E. Facial Expression Production in Autism: A Meta-Analysis: Facial Expression Production in Autism. Autism Res. 2018, 11, 1586–1601. [Google Scholar] [CrossRef]
  57. Hull, L.; Petrides, K.V.; Allison, C.; Smith, P.; Baron-Cohen, S.; Lai, M.-C.; Mandy, W. “Putting on My Best Normal”: Social Camouflaging in Adults with Autism Spectrum Conditions. J. Autism Dev. Disord. 2017, 47, 2519–2534. [Google Scholar] [CrossRef]
  58. Borsos, Z.; Gyori, M. Can Automated Facial Expression Analysis Show Differences Between Autism and Typical Functioning? Stud. Health Technol. Inform. 2017, 242, 797–804. [Google Scholar]
  59. Gyori, M.; Borsos, Z.; Stefanik, K. Evidence-Based Development and First Usability Testing of a Social Serious Game Based Multi-Modal System for Early Screening for Atypical Socio-Cognitive Development. Stud. Health Technol. Inform. 2015, 217, 48–54. [Google Scholar]
  60. Gyori, M.; Borsos, Z.; Stefanik, K.; Csákvári, J. Data Quality as a Bottleneck in Developing a Social-Serious-Game-Based Multi-Modal System for Early Screening for ‘High Functioning’ Cases of Autism Spectrum Condition. In Computers Helping People with Special Needs; Miesenberger, K., Bühler, C., Penaz, P., Eds.; Lecture Notes in Computer Science; Springer International Publishing: Cham, Switzerland, 2016; Volume 9759, pp. 358–366. ISBN 978-3-319-41266-5. [Google Scholar]
  61. Gyori, M.; Borsos, Z.; Stefanik, K.; Jakab, Z.; Varga, F.; Csákvári, J. Automated vs Human Recognition of Emotional Facial Expressions of High-Functioning Children with Autism in a Diagnostic-Technological Context: Explorations via a Bottom-Up Approach. In Computers Helping People with Special Needs; Miesenberger, K., Kouroupetroglou, G., Eds.; Lecture Notes in Computer Science; Springer International Publishing: Cham, Switzerland, 2018; Volume 10896, pp. 466–473. ISBN 978-3-319-94276-6. [Google Scholar]
  62. Rutter, M.; Bailey, A.; Lord, C. The Social Communication Questionnaire: Manual; Western Psychological Services: Los Angeles, CA, USA, 2003. [Google Scholar]
  63. Lord, C.; Rutter, M.; DiLavore, P.C.; Risi, S. Autism Diagnostic Observation Schedule; Western Psychological Services: Los Angeles, CA, USA, 1999. [Google Scholar]
  64. Le Couteur, A.; Lord, C.; Rutter, M. The Autism Diagnostic Interview-Revised; Western Psychological Services: Los Angeles, CA, USA, 2003. [Google Scholar]
  65. Roid, G.; Miller, L. Leiter international performance scale-revised: Examiner’s manual. In Leiter International Performance Scale—Revised; Roid, G.H., Miller, L.J., Eds.; Wood Dale: Stoelting, IL, USA, 1997. [Google Scholar]
  66. Bishop, D. The Test for Reception of Grammar; Medical Research Council, Applied Psychology Unit: London, UK; Cambridge, UK, 1983. [Google Scholar]
  67. Lukács, Á.; Győri, M.; Rózsa, S. TROG-H: Új sztenderdizált módszer a nyelvtani megértés fejlődésének vizsgálatára. Gyógypedagógiai Szle. 2013, 1, 1–22. Available online: https://epa.oszk.hu/03000/03047/00059/pdf/EPA03047_gyosze_2013_1_001-022.pdf (accessed on 10 November 2019).
  68. Cliff, N. Dominance Statistics: Ordinal Analyses to Answer Ordinal Questions. Psychol. Bull. 1993, 114, 494–509. [Google Scholar] [CrossRef]
  69. Sodian, B.; Frith, U. Deception and Sabotage in Autistic, Retarded and Normal Children. J. Child Psychol. Psychiatry 1992, 33, 591–605. [Google Scholar] [CrossRef] [PubMed]
  70. Keating, C.T.; Cook, J.L. Facial expression production and recognition in autism spectrum disorders: A shifting landscape. Child Adolesc. Psychiatry Clin. 2020, 29, 557–571. [Google Scholar] [CrossRef] [PubMed]
  71. Egger, H.L.; Dawson, G.; Hashemi, J.; Carpenter, K.L.H.; Espinosa, S.; Campbell, K.; Brotkin, S.; Schaich-Borg, J.; Qiu, Q.; Tepper, M.; et al. Automatic Emotion and Attention Analysis of Young Children at Home: A ResearchKit Autism Feasibility Study. NPJ Digit. Med. 2018, 1, 20. [Google Scholar] [CrossRef] [PubMed]
Figure 1. Histogram on the 12 subjects with nonidentical data series when comparing test1 and test2 datasets, along differing data points, as a percentage of all data points.
Applsci 12 07759 g001
Figure 2. Histogram of the 7 subjects with nonidentical data series when comparing their test2 and test3 data, along the ratio of differing data points. (Data of 5 subjects with identical test2–test3 datasets are not included).
Applsci 12 07759 g002
Figure 3. Group means of the intensities in the 8 emotions, by group (on data from teststable and remaining nonstable test3 data series, n = 60). Error marks: 95% CI.
Applsci 12 07759 g003
Table 1. Demographic and psychometric characteristics of subjects. At the results of statistical difference between groups “ns” means non-significant.
NT Group
n = 31
18 Male/13 Female
ASD Group
n = 29
21 Male/8 Female
Statistical Difference between Groups
Mean (SD)RangeMean (SD)Range
Age (months)53.2 (8.65)38–6857.8 (8.65)41–70t(58) = −2.042; p = 0.046; Cohen’s d = 0.26
IQ by Leiter-R Brief120.5 (14.04)98–147116.3 (13.9)91–139t(58) = 1.156; p = 0.252 (ns)
TROG-H score (receptive grammar)118.2 (14.40)83–147111.3 (14.93)82–153t(58) = 1.156; p = 0.074 (ns); Cohen’s d = 0.23
MedianRangeMedianRange
SCQ score
(ASD symptom severity estimate)
10–3218–29Mann–Whitney’s U < 0.0001; z = −6.732; p < 0.001 (Mann–Whitney);
effect size (stochastic difference; [68]): 1 (large)
Game total score
(number of correct mouse responses out of the total 24)
2419–24232–24Mann–Whitney’s U = 342; z = −1.660; p = 0.097 (ns); effect size (stochastic difference [68]: 0.239 (large)
Table 2. Outline of the scene structure of the game (adapted from Gyori et al. [61]).
Scene ThemeScene FunctionStimuli Presented (Visually)
“Perceptual preferences”To evoke spontaneous emotional and gaze responsesPinwheel, two birds, human agent (narrator)
Introduction and instructions—1To familiarize with characters, task, controlsHuman-like characters (narrator, competitor, cooperator), chest, candy, bowl, controls
Sabotage in cooperative contextTo evoke spontaneous emotional and gaze responses, intentional behavioral (mouse) responses
Sabotage in competitive context
Sabotage in cooperative context
Sabotage in competitive context
Introduction and instructions—2To familiarize with task and controls
Deception in cooperative contextTo evoke spontaneous emotional and gaze responses, intentional behavioral (mouse) responses
Deception in competitive context
Deception in cooperative context
Deception in competitive context
ClosingTo close the sessionHuman agent (narrator)
Table 3. Case flow for subsequent tests (FR8 analyses) and the number of identical testn−1–testn data series.
ASD GroupNT GroupTotal
Number of input cases for test1 and test2/number of identical test1–test2 data series29/2331/2560/48
Number of input cases for test3/number of identical test2–test3 data series6/36/212/5
Remaining “non-stabilized” data series after test3347
Publisher’s Note: MDPI stays neutral with regard to jurisdictional claims in published maps and institutional affiliations.

