1. Introduction
Many engineering construction and scientific research fields are related to the permeability of rock mass, such as hydraulic engineering, civil engineering construction, petroleum exploitation and underground storage, disposal of nuclear wastes, environmental pollution, carbon dioxide storage and underground thermal motion, etc. [
1,
2,
3,
4,
5,
6]. The permeability of the rock mass mainly depends on the fracture permeability. The key problem of quantitatively evaluating the anisotropic rock permeability includes correctly and effectively determining the fracture permeability. The permeability of anisotropic fractured rock (e.g., permeability coefficient, equivalent permeability coefficient and the permeability coefficient tensor of the rock mass) is the most important parameter for engineering design, construction and running. Moreover, it is needed to quantitatively determine the anisotropic rock permeability to study the engineering structure, foundation and groundwater, and the stress field, temperature field, seepage field and chemical field coupling.
The methods to determine the anisotropy permeability coefficient of fractured rock include the following: the fracture sample method, the pumping test method [
7,
8,
9,
10,
11,
12], the three section of water pressure test method [
13], the cross-hole water pressure test method and the method of numerical inversion. All of these methods either depend on the strict hydrogeological conditions that are demanding, time-consuming and troublesome, with a high test cost, or have theoretical flaws, which are difficult to apply practically. For example, petroleum exploitation and nuclear waste treatment projects must deal with deep buried aquifer and weak permeability rocks, which mean it is very difficult to conduct the pumping test. Hence, it is necessary to put forward a theoretical time-saving and easy to operate method to investigate the hydrological parameters of these particular projects.
Recently, the slug test has been widely used in determining the aquifer permeability parameters. In 1967, Cooper [
14] proposed the theory and method of fitting the standard curve with the semi-logarithmic graph of water level changes in the well that was dimensionless with regard to time to obtain the permeability coefficient. Bouwer and Rice [
15] supposed that the groundwater head has the constant head boundary in a certain range, and the boundaries remained constant during the test, without considering the effect of well-skin, according to the ratio of screen length and casing radius to fit the standard curve, and obtained an effective influence radius under test conditions, according to the gradient of the change in well water level with time on the semi-logarithmic graph curve to calculate the permeability coefficient. Kipp [
16] assumed that the aquifer is equal thickness, homogeneous and isotropic, which provided a strict physical theory for the research of underdamping and overdamping aquifer, and protracted a series of standard curve, made a semi-logarithmic graph curve by the dimensionless drawdown and time to fit the standard curve to calculate the permeability coefficient. Belitz [
17] proposed a numerical solution method to analyze the influence of aquifer anisotropy on the results of the slug test. Zemansky [
18] used the high-resolution slug test and provided a detailed vertical distribution of the permeability coefficient. Zhou [
19,
20] developed a field quick testing system for determining rock and soil permeability coefficients based on the principle of vibration of water flow movement in a single well, which made it possible to test rock and soil permeability coefficients in the field fast and efficiently. Zhao [
21] applied the sectional slug test in a field to measure the aquifer permeability and verified the probability to determine the aquifer permeability by the sectional slug test. Meantime, the research used wavelet technology to reduce the noise of the slug test field data. In order to verify the slug test’s high accuracy and stability for determining the permeability coefficient, a comparison with the calculation results of pumping test was made. Slack [
22] carried out the slug test in the biotite gneiss area, and proposed to determine the permeability parameters of fractured rock aquifer through the comprehensive analysis of slug test data and borehole TV data. Zhou and Zhao [
23] proposed a novel apparatus for obtaining the fracture occurrence in borehole. Dai and Zhao [
24] analyzed the effect of the radial constant-water-head boundaries of slug tests on the evaluation of the hydraulic properties of fractured rocks based on a laboratory analogue experiment platform with an artificial fracture.
There are many slug test models and theories around, but the existing theory of the slug test method and test system have trouble dealing with the effect of fractures associated with the geometric features of fractures (occurrence, width, etc.) on water level oscillation. These existing theoretical models of slug tests are generally constructed by taking the horizontal layered aquifer as the physical model. Moreover, most of them deal with porous medium instead of fractured medium. There is little research on the fractured medium, especially on the theoretical research of well flow slug tests in the case of fractures with different dip angles. The permeability parameters obtained from the borehole slug test are often the average parameters of the medium. There are few researches on the slug test method with regard to testing the fracture permeability coefficient in sections and the determination of permeability coefficient tensors of rock mass by the slug test. The current slug test equipment can only record the change process of water level and temperature with time in the borehole, instead of revealing the development of fractures in the borehole. Therefore, it is very difficult to use the current slug test equipment with the slug test to investigate the permeability characteristics of fractured medium anisotropy.
New theories and methods for determining the permeability coefficient of different dip angle fractures are derived based on the well flow vibration equation in fractured medium. A test method for the borehole slug test in fractured rock mass based on the self-developed slug test system for determining permeability coefficient tensors of fractured rock mass is proposed.
By relying on the underground water sealed cavern project of National Huangdao Petroleum Reserve, the geological information, such as fracture occurrence in the borehole, is obtained by using the self-developed test system [
23]. The fracture permeability coefficient, equivalent permeability coefficient and rock mass permeability coefficient tensor of the Huangdao test site are calculated and determined. The field application of determining the permeability coefficient tensor of fractured rock mass according to the borehole geological information and slug test data obtained by the test system is realized. Meantime, the field test comparison between the segmented slug test and conventional water pressure test is carried out to further verify the accuracy and applicability of the new theory and method for determining the permeability parameters of the fractured rock mass.
2. Theory of Slug Test on Determining Permeability Coefficient of Anisotropic Fractured Rock Mass
On the basis of the slug test theory of the horizontal layered aquifer with different relative damping coefficients, which is proposed by Kipp [
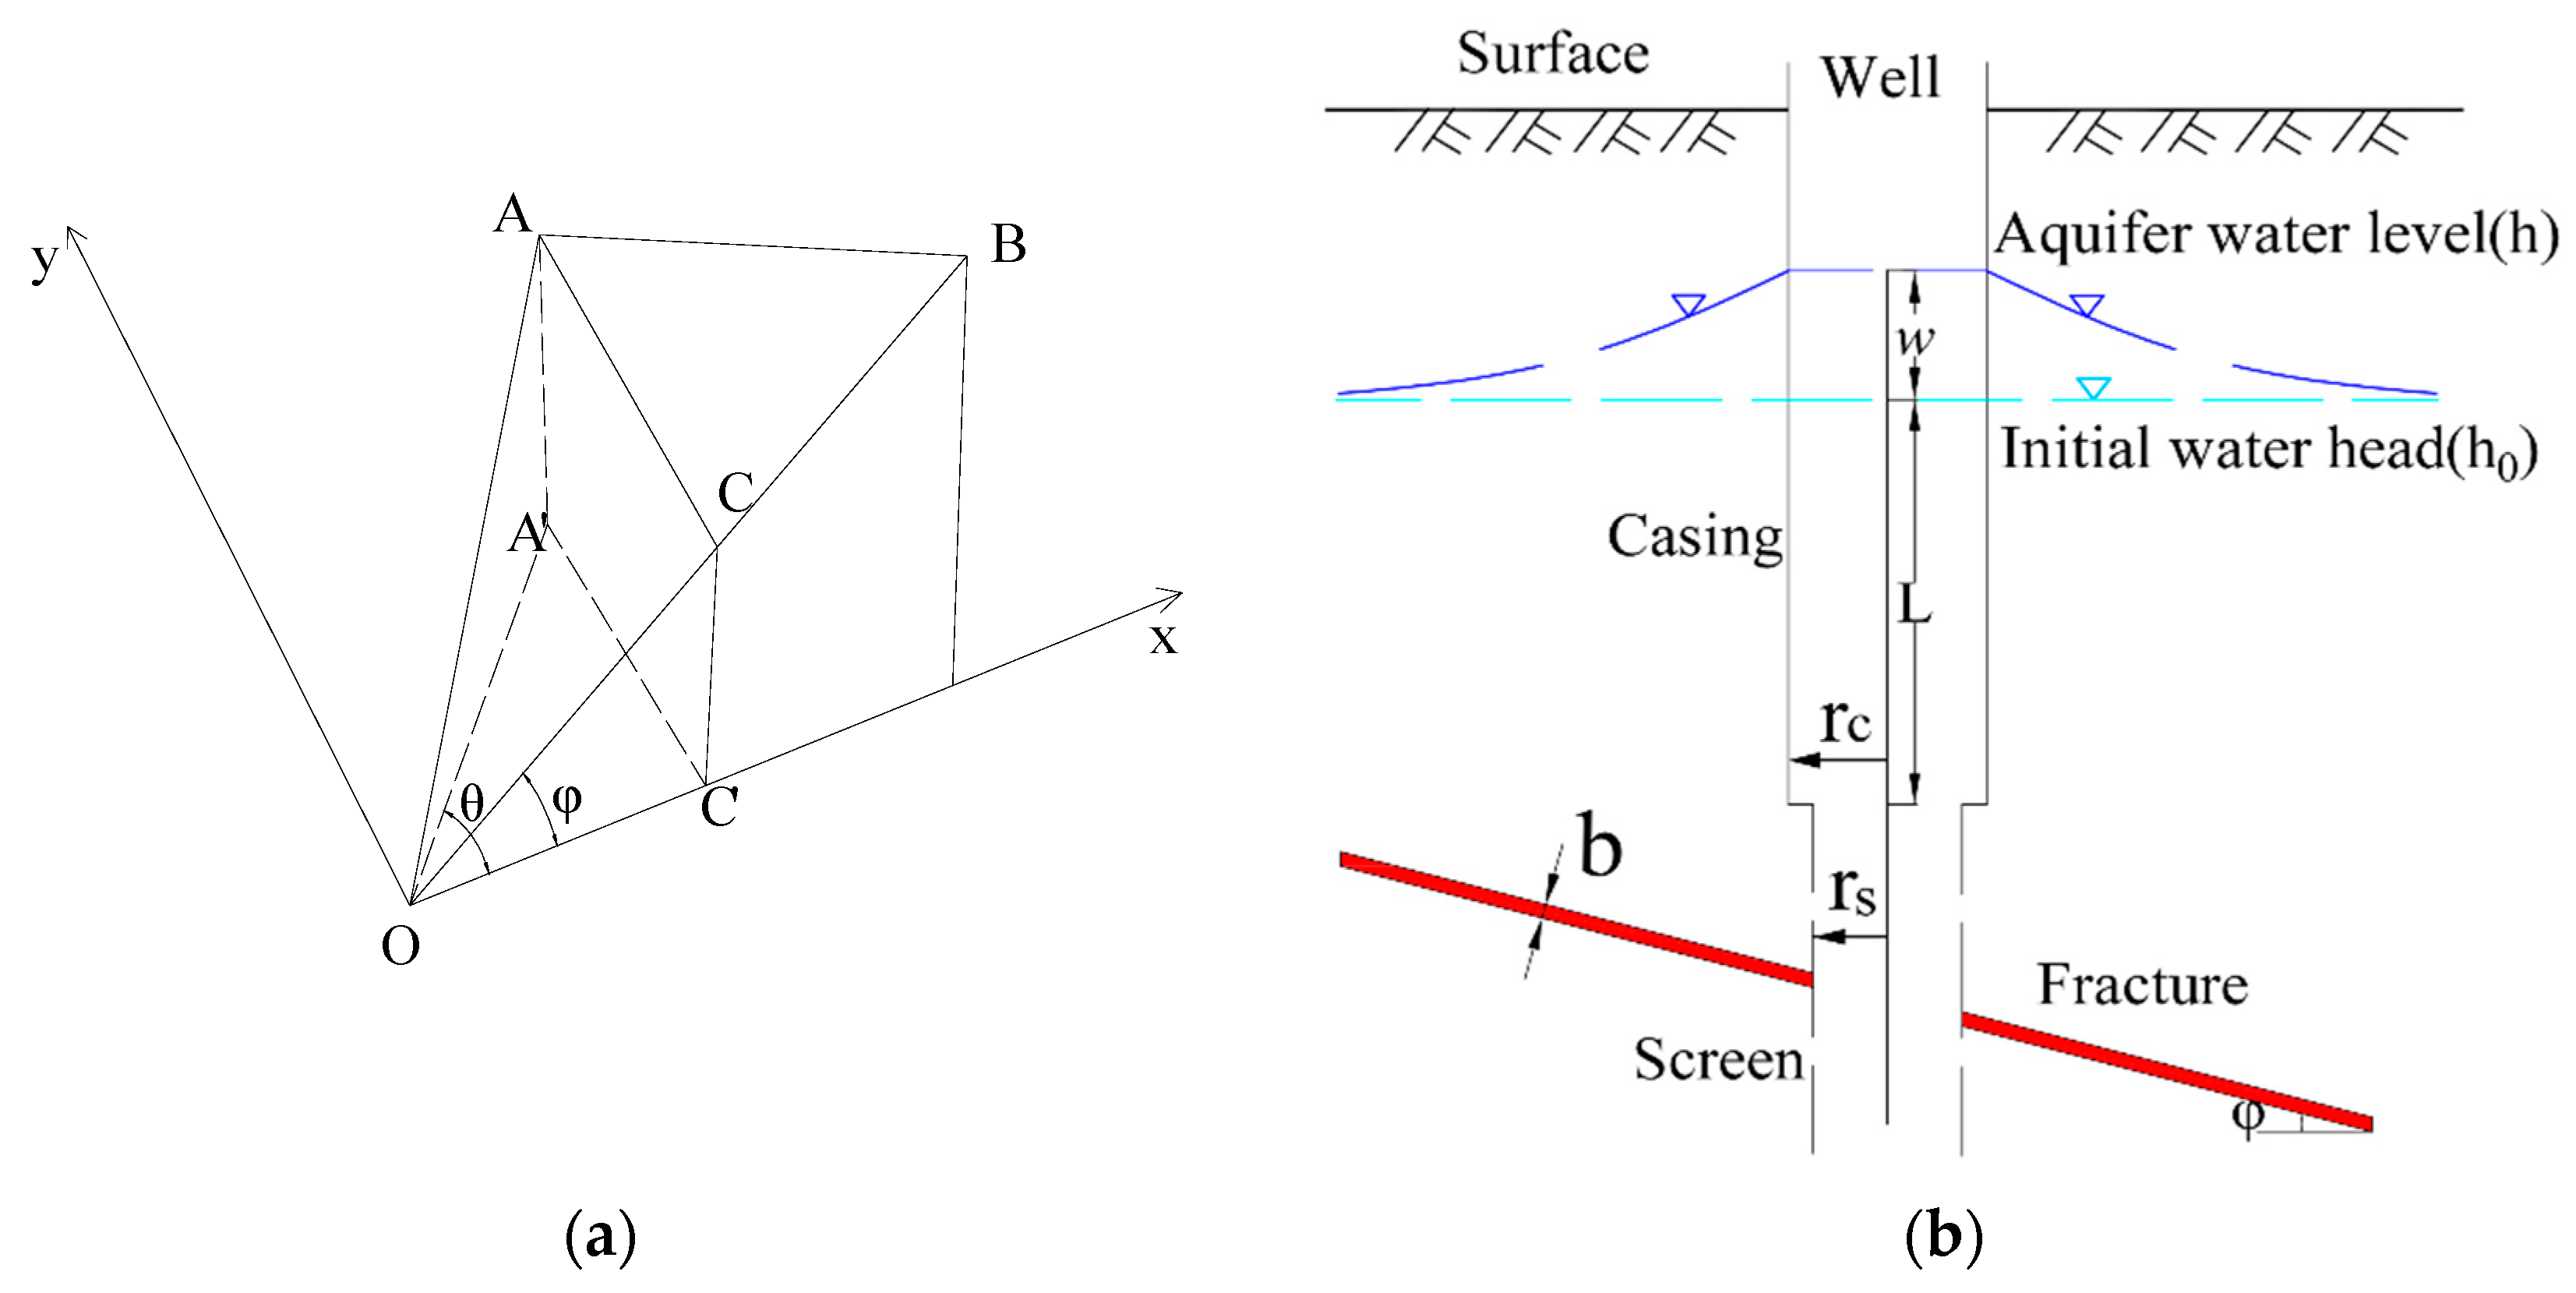
16], a new mathematical model of the vibration equation of a well different dip angle fractured aquifer system is established by combining the groundwater continuous equation, the law of mass conservation and momentum conservation, as shown in
Figure 1. In
Figure 1a, the center of the top hole of the fractured aquifer is the origin
of the cylindrical coordinate, the radial direction is
, and the vertical upward direction is the positive direction of the
axis. In the Cartesian coordinate system, A and B are two points on the elliptic fracture plane, the projection of the maximum oblique line on the fracture surface passing through the point
on the horizontal plane is the positive
axis of the horizontal plane xoy,
is the positive axial of
axis, and
is the positive axial of
axis. Where
is the dip angle of the fracture surface (
),
is the center angle, which takes
as the initial angle,
is the projection of A on the horizontal plane xoy and
is the projection of C on the horizontal plane xoy. The well structure schematic is shown in
Figure 1b. If the cartesian coordinates of A are (
) and the cylindrical coordinates of A are (
), then
,
,
.
A new theoretical model of the slug test under different dip angle fractures is proposed. A new calculation method of determining the different angle fracture permeability coefficient, equivalent permeability coefficient and rock mass permeability coefficient tensor is proposed.
The groundwater continuous equation for the cylindrical coordinate is as follows:
Among them, is the radial distance of the cylindrical coordinate (); is the vertical axis of the cylindrical coordinate (); is the center angle; is the water head of the aquifer (); is storage rate of the fracture (); is the permeability coefficient of the fracture (); is time ().
The corresponding initial conditions are as follows: when
,
; for the boundary condition, when
,
. By converting the Cartesian coordinates for dip fracture surfaces,
, is related to
r,
and then Equation (1) is converted to
According to the law of mass conservation, the well flow caused by the slug test is equal to the radial flow from the surrounding fractured aquifer. The fractured aquifer surrounding boundary of the wall of the well approximates the circle from the ellipse. The mass conservation equation is as follows:
Among them, is the average hydraulic gradient of the fractured aquifer around the wall of the well; is the variation in water level in the well (); is the screen radius or well radius of the test section (); is the casing radius (); b is the fracture width ().
The corresponding initial conditions are as follows: when , .
According to the law of momentum conservation, considering that the water column is still moving in the casing, the movement equation of the water column in the casing still adopts the Kipp model motion equation in the horizontal layered aquifer, as shown in Equation (4).
Among them, , is the height of water column in the casing (); is the water head at the junction of the borehole casing and screen (test section) (); is the initial water head of the aquifer ().
The initial condition is as follows: when , , ,.
In order to solve the mathematical model, it is necessary to make parameters dimensionless. It is shown in
Table 1.
The Equation (2) is made dimensionless, giving
The corresponding initial conditions are as follows: when , ; the boundary condition is as follows:,.
The Equation (3) is made dimensionless, giving
The corresponding initial conditions are as follows: when ,.
The Equation (4) is made dimensionless, giving
The corresponding initial conditions are as follows: when , ,.
The Equations (5)–(7) are carried out after the Laplace transformation.
where
is less than 2, but it is near 2. If
, according to Gille et al. [
25], who proposed that the change in water level is controlled by the transform function
pole, the zero point of
and the pole of
is equal. Therefore, Laplace inverse transformation is required. If
in the Equation (8) can be transformed by the Laplace inverse transformation, it is necessary to use a separable denominator, which requires a root. Then,
If the Equation (9) has a root, then the distance of and have to be very small and take as its limit value, that is . When , , at the same time, make , when is big enough, is a very small number; at the same time, taking into account the dimensionless water storage coefficient is generally in the 102–105 range, then .
When
, the Equation (8) can be changed into the following after inverse transformation:
When
, the Equation (8) can be changed into
When
, the Equation (8) can be changed into
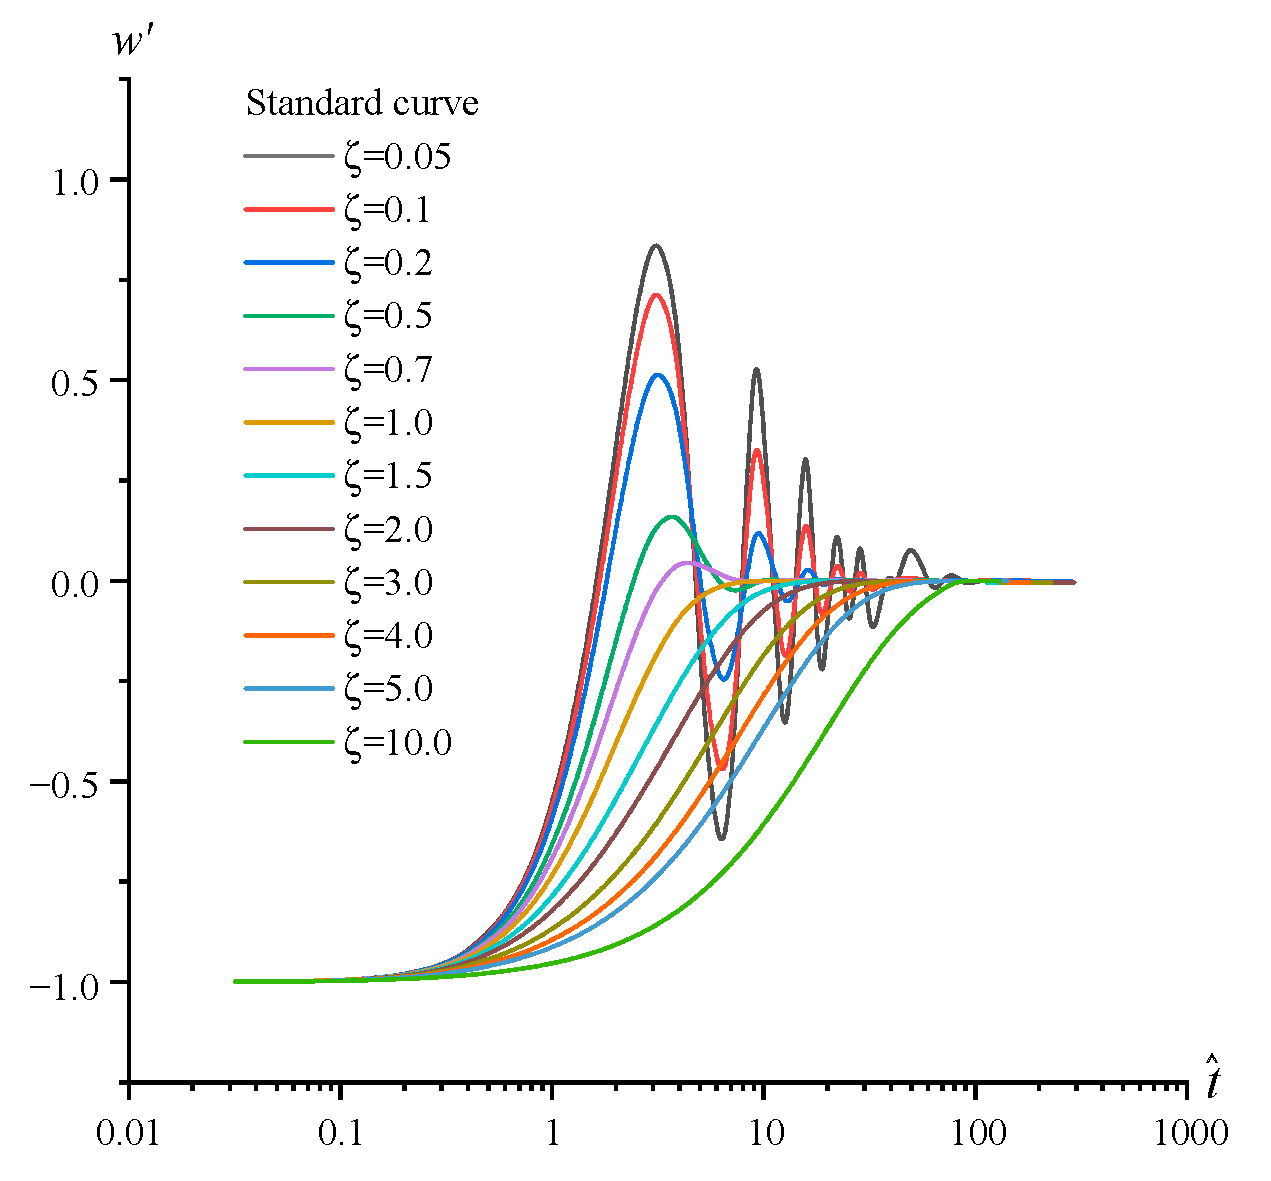
Therefore, according to the Equations (10)–(12), the standard curves of the dimensionless water level change
and dimensionless time
can be drawn with the relative damping coefficient
of 0.05, 0.1, 0.2, 0.5, 0.7, 1, 1.5, 2, 3, 4, 5 and 10, as shown in
Figure 2. In the semi-logarithmic paper of the same modulus with the standard curve, one can draw the measured curve of the water level changes
versus time
, which are collected by the slug test. One must make sure the coordinate origin of the measured curve and standard curve are at the same height in the semi-logarithmic paper. By translating the measured curve time axis
, one must match the measured curve with the standard curve; record the relative damping
and dimensionless coefficients
of standard curve; choose a matching point, record its
and
on the standard curve, together with its
and
on the measured curve. According to the obtained fractured structural plane occurrence in the drilling, the dip direction
, dip angle
and the width of the fracture
, the fracture storage rate and the fracture permeability coefficient can be calculated by the following equations:
The equivalent permeability coefficient
within the length of test section of the same group fracture structural plane for some fractures of different width and spacing in the rock mass can also be calculated as follows:
where
is the permeability parameter of No.
fracture in the No.
group fracture structural plane;
is the total number of fractures in No.
group fracture structural plane;
is the width of No.
fracture in the No.
group fracture structural plane;
is the length of test section in the borehole.
When the fractured rock mass has several groups’ different occurrences fracture structural planes, one must choose
,
and
in the cartesian coordinate system as north, east and the vertically upward direction. The permeability coefficient tensor
can be also calculated as follows:
where
is the number of No.
group fracture structural plane;
is the equivalent permeability coefficient of No.
group fracture structural plane;
is the total groups of fracture structural planes in the rock mass.
This proposed model is only applicable to the case where the dip angle is not zero. If it is a horizontal fracture, the Kipp model can be directly used. At the same time, in order to obtain the fracture permeability coefficient, equivalent permeability coefficient and rock mass permeability coefficient tensor, it is necessary to use the self-developed slug test system to obtain the dip direction and angle of fracture.
3. Application of the Slug Test in Determining the Permeability of Anisotropic Fractured Rock Mass in Huangdao Test Site
3.1. Engineering Background
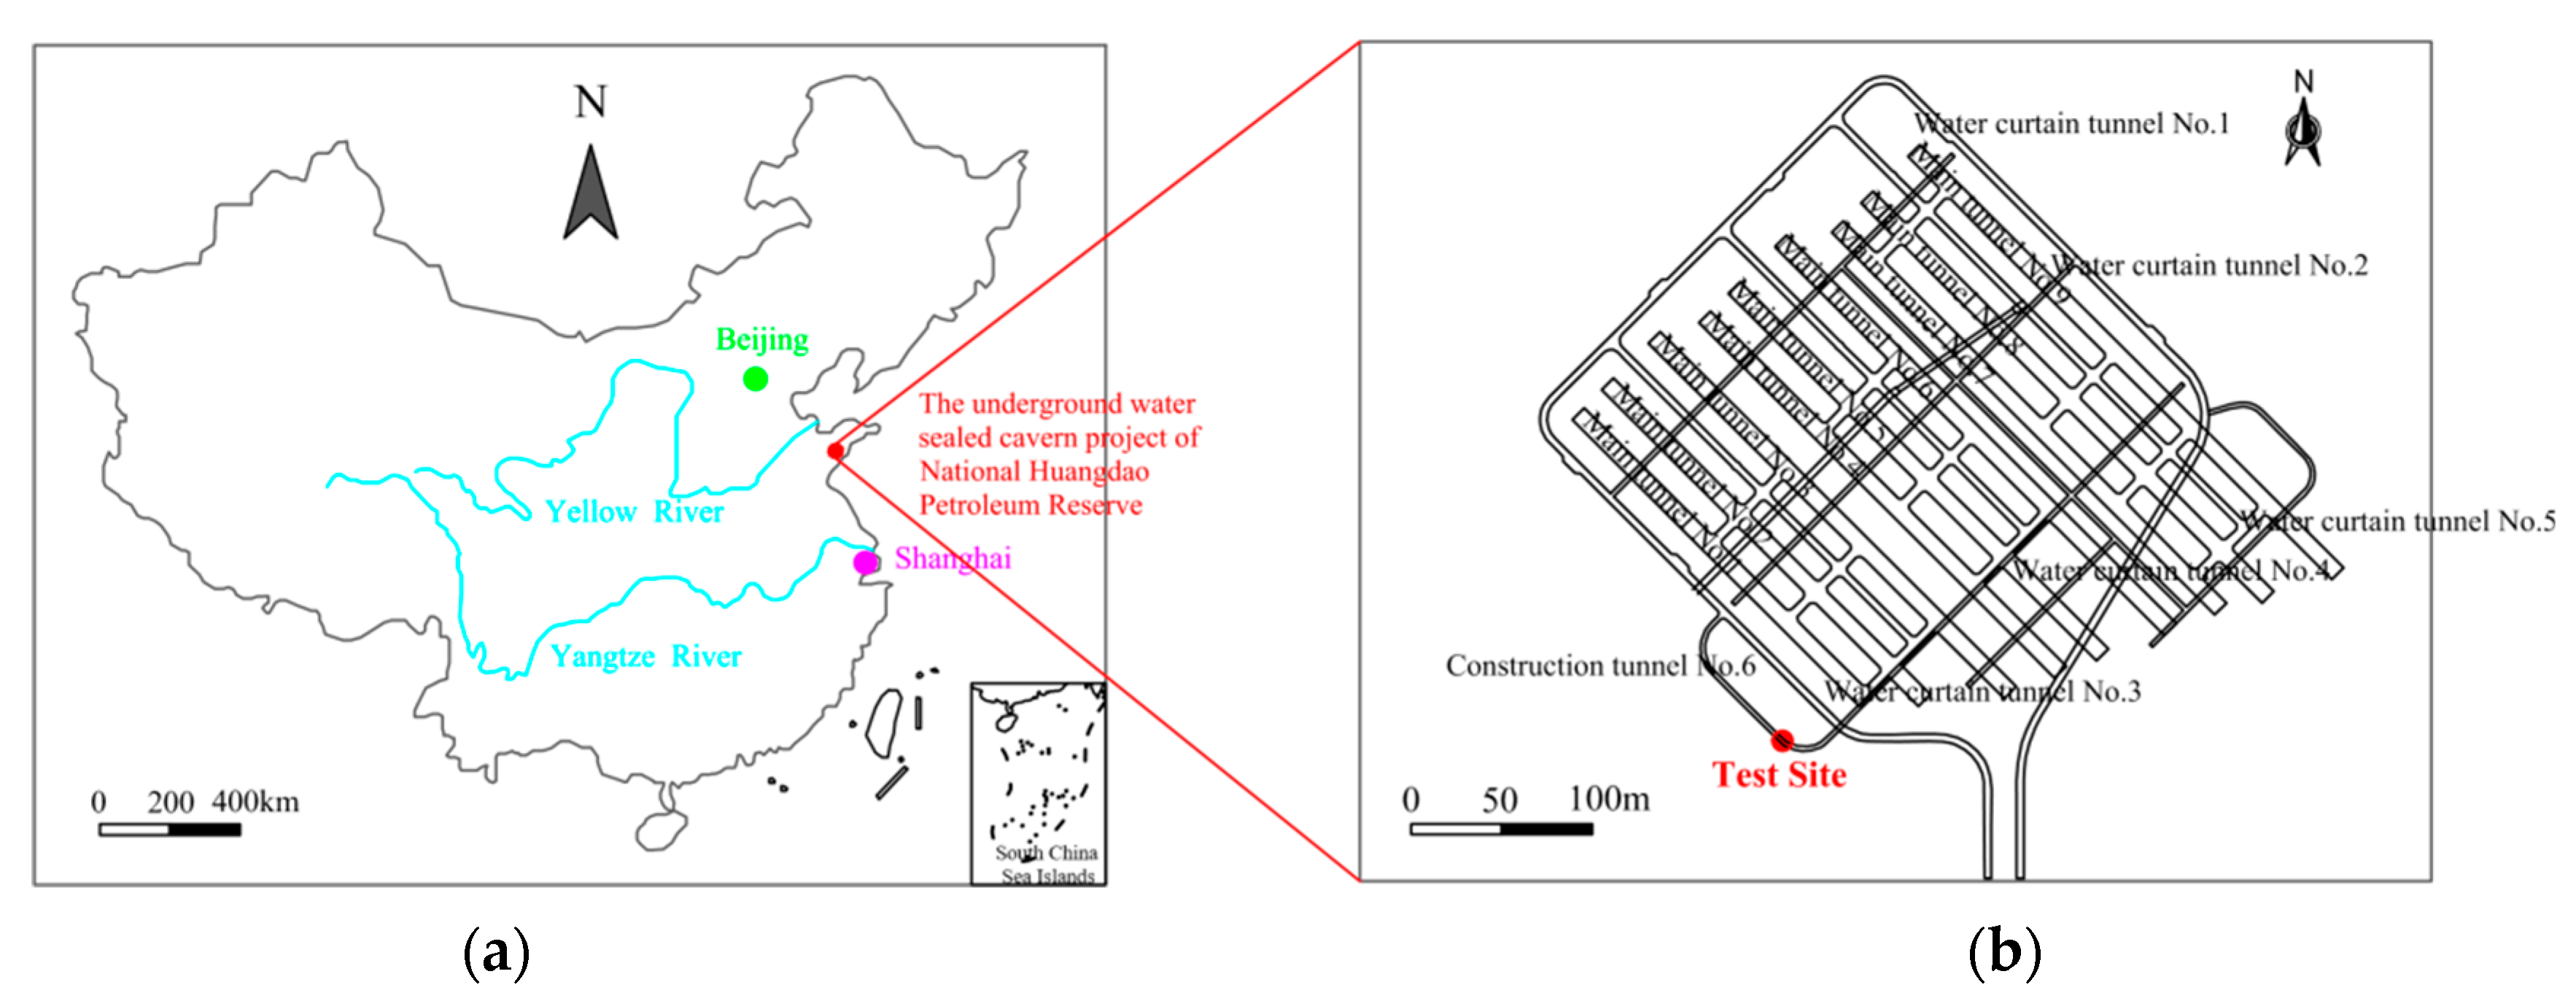
The underground water sealed cavern project of National Huangdao Petroleum Reserve is located in the Qingdao City Economic and Technological Development Zone. The geographical position is shown in
Figure 3a. The cavern area is 600 m wide from east to west and 900 m long from north to south. The total area is about 57.1 hectares. National Huangdao Petroleum Reserve includes two parts, underground engineering and ground support facilities. The capacity of the petroleum reserve is 3 × 10
6 m
3. The distribution shape of underground engineering is shown in
Figure 3b.
The underground engineering mainly includes six construction tunnels, nine main tunnels and five water curtain tunnels. The construction tunnel span is 9 m, and the height is 8 m. The nine main tunnels are arranged in parallel in the 45 degrees direction north by west. The bottom elevation of the main tunnels is −50 m, and the length ranges from 468.8 to 777 m. The main tunnel span is 20 m, and the height is 30 m. The cross-section shape of the main tunnel is a circular arch with a straight wall. The distance between the two adjacent main tunnels is 30 m. Five horizontal water curtain tunnels are set about 30 m above the top surface of the main tunnels, which are arranged perpendicularly to the main tunnels. The total length of the water curtain tunnel is about 2835 m, the span is 5 m, and the height is 4.5 m.
The underground water sealed cavern project of National Huangdao Petroleum Reserve is used to verify the reliability and applicability of the proposed slug test method and self-developed test system in determining the fracture permeability coefficient, equivalent permeability coefficient and rock mass permeability coefficient tensor. The formation lithology of the test site is granite gneiss, and the fractures are not developed, which is conducive to the research of the slug test on fracture permeability. The test site is relatively closed. Meantime, no blasting operation is carried out during the test. Therefore, this site is an ideal test site.
3.2. Field Test Content
The field test site is chosen in the intersection of construction tunnel No. 6 and water curtain tunnel No. 3, and the specific location is shown in
Figure 3b. We drilled holes, took cores, cataloged the cores and manually measured the fracture dip angle at the field test site. At the same time, we used the slug test system for the borehole camera and catalog, found fractures and automatically measured the fracture occurrence. We compared the fracture information automatically obtained by the slug test system with the fracture information obtained by manual logging.
At the same time, the slug test and conventional water pressure test were carried out on the field test site to verify the reliability and accuracy of the proposed slug test method and self-developed test system on determining the rock mass permeability parameter. A group of slug tests were carried out by using the slug test system for each footage, and a group of conventional water pressure tests were carried out about every 5 m. The permeability coefficient tensor of the fractured rock mass in the test site was calculated and determined as well.
3.3. Drill Core Logging
Drilling and coring are carried out at the field test site. A total of 11 footage are drilled in the test hole, and the drilling depth is 10.12 m. Among them, the first footage is 0 to 0.5 m, the second footage is 0.5 to 0.89 m, the third footage is 0.89 to 1.3 m, the fourth footage is 1.3 to 1.8 m, the fifth footage is 1.8 to 2.43 m, the sixth footage is 2.43 to 3.16 m, the seventh footage is 3.16 to 4.76 m, the eighth footage is 4.76 to 5.83 m, the ninth footage is 5.83 to 7.72 m, the tenth footage is 7.72 to 8.99 m, the eleventh footage is 8.99 to 10.12 m. Among them, the casing is set at the first footage of the drilling hole. To ensure the water sealing up effect of the casing, cement is injected at the completion of the first footage. After the cement is completely solidified, an 89 mm drill bit is used for coring. The actual drilling diameter of the whole hole is 89 mm.
Since the first footage is located in the shallow layer and is affected by the previous blasting, the blasting fractures are well developed. However, the first footage is at the casing position; therefore, the fractures in the section have no effect on the slug test results.
In order to compare the geological information automatically obtained by the slug test system with the geological information obtained by manual logging, we took geological information photos of the footage obtained by the slug test system and the corresponding footage core photo for comparison and analysis, as shown in
Figure 4.
It can be observed from
Figure 4 that the slug test system can not only find fractures, but also obtain the same information as those found by drilling and coring. The geological information obtained by the slug test system and manual measurement after coring are shown in
Table 2. The fracture dip angle from the slug test system and manual measurement after coring using the compass are quite consistent. It can be observed from
Table 2 that the fractures are basically large dip angle fractures, which is consistent with the conclusion that the dip angles of fractures in this test site are mostly in the range of 30~60° according to the comprehensive geological survey data. It shows that the slug test system has good reliability and stability.
3.4. The Analysis of Conventional Water Pressure Test Results
According to the Chinese “Specification for Water Pressure Test in Borehole of Hydropower Projects” (NB/T 35113-2018) [
26], generally, a conventional water pressure test [
27,
28] is always carried out with five phases (
,
) and three pressure stages,
,
and
which are 0.3
, 0.6
and 1
, respectively. The water permeability of the test section is calculated by the pressure value (
) and flow rate (
) of the third pressure stage in the Equation (17).
Among them, is the water permeability of the test section (); is the length of the test section (); is the flow rate of the third pressure stage (); is the test section pressure of the third pressure stage ().
Three conventional water pressure tests were conducted on site. The test section ranges of the first group test are 1.06–4.76 m, the second 4.37–10.12 m and the third 1.37–10.12 m.
The
curves of the three water pressure tests are shown in
Figure 5. It can be observed from
Figure 5 that the
curve of the first group water pressure tests belong to the expansion type (
type), and the pressure rise curve in the
curve is basically the curve of the convex to
axis. The pressure drop curve and the pressure rise curve basically coincide. The flow increases significantly when the pressure reaches a certain pressure, indicating that the fracture status changes and the fracture permeability increases under the action of the test pressure.
However, the flow rate of the fourth phase and the second phase, and the fifth phase and the first phase basically coincide, indicating that this fracture status change is temporary and reversible. With the decrease in test pressure, the fracture returns to its original status, which showing an elastic expansion property. The curves of the second and third groups water pressure tests belong to the turbulent flow type ( type), and the pressure rise curve in the curve is basically the curve of the convex to the axis. Similarly, the pressure drop curve and the pressure rise curve basically coincide. The fracture status has not changed during the whole test period.
The water permeability of the corresponding test section in three group tests are calculated as well [
28], and the calculation results are shown in
Table 3. It can be observed from
Table 3 that with the increase in the buried depth of the test section, the water permeability decreases gradually.
3.5. The Analysis of the Slug Test Results
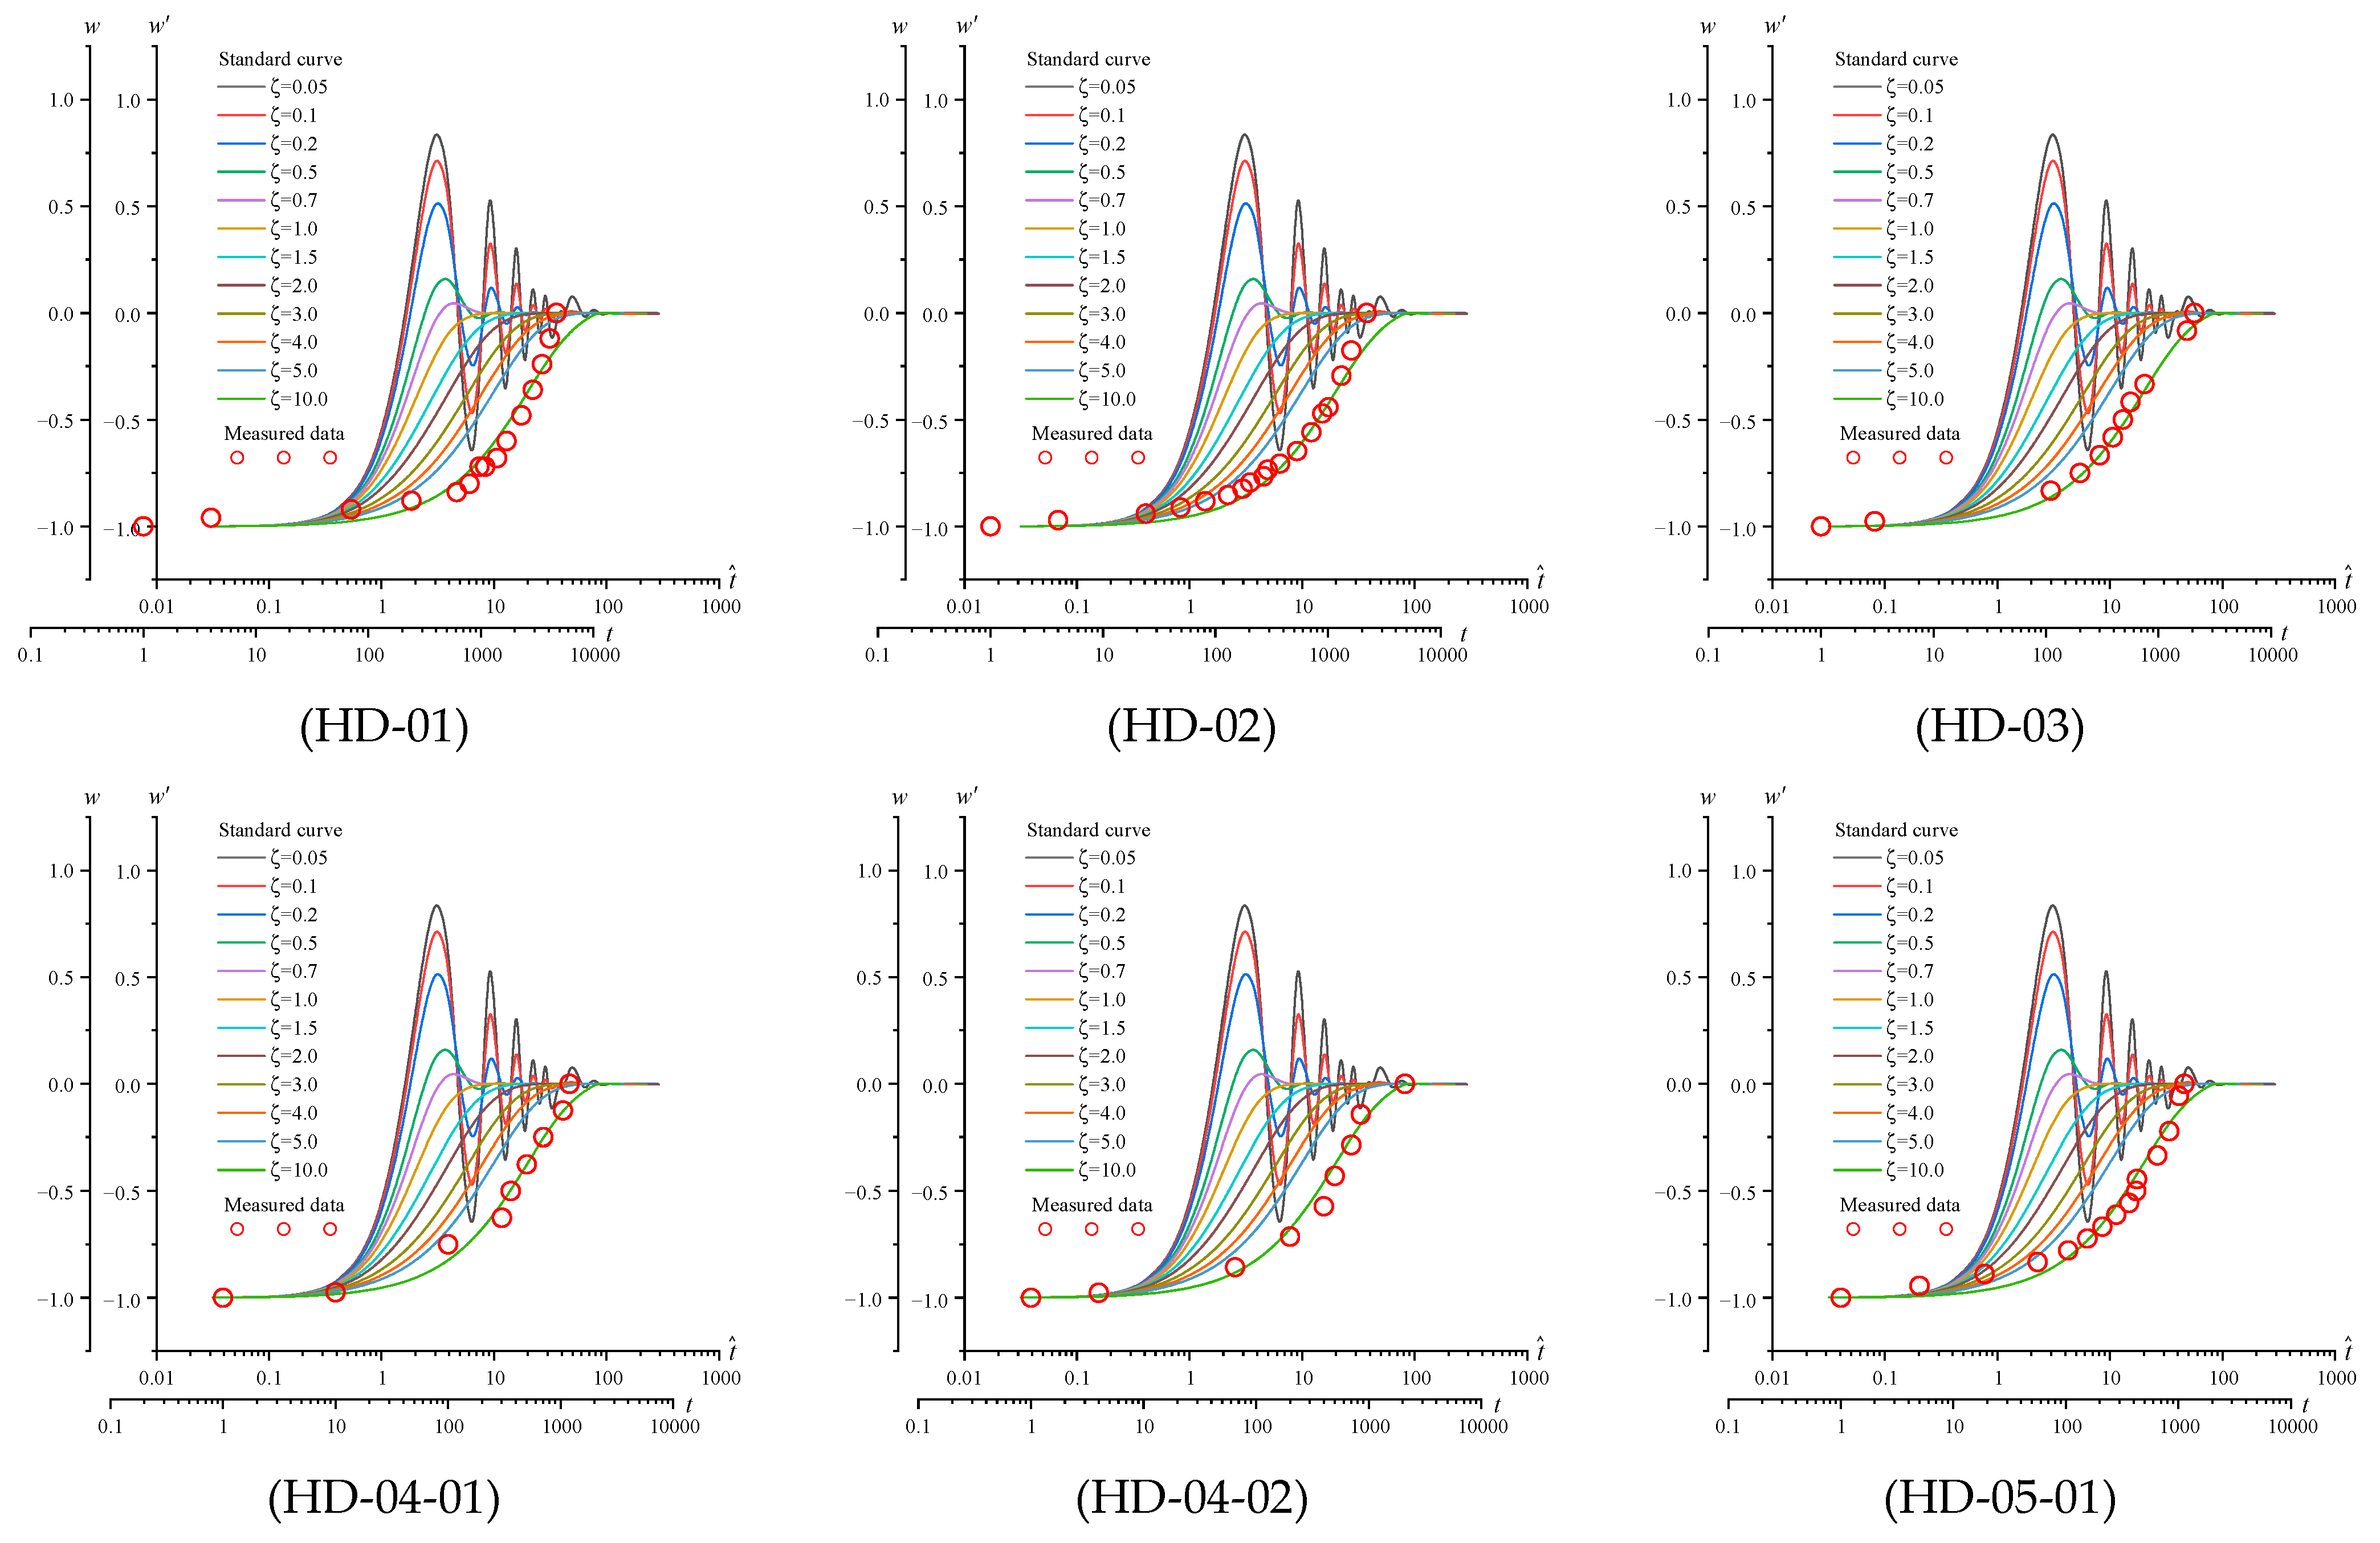
The excitation methods of the pneumatic mode and water lifting mode are used for the slug test. In order to obtain the (equivalent) permeability coefficient of the fracture in the borehole, the corresponding slug test was carried out from the second footage of the drilling to the end footage. The location of the test section of the slug test and water pressure test is shown in
Figure 6. The fitting curve of slug test is respectively shown in
Figure 7. The equivalent permeability coefficients of fractures at each test section in the borehole are calculated according to Equations (14) and (15), and the calculation results are shown in
Table 4 and
Figure 8.
It can be observed from
Table 4 and
Figure 8 that, in general, the equivalent permeability coefficients of fractures gradually decrease with the increase in drilling depth, which is consistent with the conclusion that the core integrity is better with the increase in drilling depth. Moreover, at the same test section, the calculation results of the pneumatic slug tests are nearly 2–4 times larger than that of water lifting slug tests. In addition, the initial water level difference of the water lifting slug tests is bigger than that of the pneumatic slug tests. It shows that the initial water level change value of the pneumatic slug tests is smaller, due to the influence of the pneumatic sealing device and the air pressure. The influence range is smaller than that of the water lifting slug test. The pneumatic slug test can only result in the permeability coefficient in a small range near the borehole, while the water lifting slug test has a larger influence range. The permeability coefficient measured by the water lifting slug test is also related to the trace length and connectivity of the fracture. Moreover, it can be observed from
Table 4 that the same excitation mode of slug tests at the same test section contributes to the same results. It indicates that slug test system has better stability with smaller accidental error.
3.6. Comparative Analysis of the Slug Tests and Water Pressure Tests Results
According to the assumption of the rock mass equivalent permeability coefficient, it is assumed that heterogeneous rock strata are mostly composed of many mutually alternating layered rock strata with different permeability. The thickness of each single layer is much smaller than its extension length. When the permeability coefficient
and thickness
of each layer are known, the equivalent permeability coefficient in the direction parallel to the layer
can be calculated by the following equation:
Therefore, in order to compare the results of the water pressure test and slug test in the same test section, it is necessary to obtain the equivalent permeability coefficient of the slug test in the same test section as the water pressure test, based on the assumption of the rock mass equivalent permeability coefficient. The test section ranges of the first group of the water pressure test are 1.06 to 4.76 m. Therefore, it is required that the equivalent permeability coefficient determined by the slug test corresponding to this test section ranges compares with the water permeability calculated by the water pressure test. However, the test section ranges of the sixth group of the slug test are 0.5 to 4.76 m, and the test section ranges of the first group of the slug test are 0.5 to 0.89 m. The test section ranges of the first group of the slug test are included in the test section ranges of the sixth group of the slug test. Therefore, the equivalent permeability coefficient from 0.89 to 4.76 m can be calculated based on the slug test data, according to the assumed layered rock mass equivalent permeability coefficient method. The test section ranges can be approximately 1.06 to 4.76 m of the test section ranges of the first group of water pressure tests. Similarly, the test section ranges of the second group of the water pressure test are 4.37 to 10.12 m, so it is necessary to calculate the equivalent permeability coefficient determined by the slug test that corresponds to this test section ranges. However, the test section ranges of the tenth group of the slug test are 0.5 to 10.12 m and the test section ranges of the sixth group of the slug test are 0.5 to 4.76 m. So, the equivalent permeability coefficient from 4.76 to 10.12 m can be calculated based on the slug test data, according to the assumed layered rock mass equivalent permeability coefficient method. The test section ranges can be approximately 4.37 to 10.12 m of the test section ranges of the second group of water pressure tests. Similarly, the test section ranges of the third group of the water pressure test are 1.37 to 10.12 m, and the equivalent permeability coefficient determined by the slug test corresponding to this test section ranges shall also be calculated. The test section ranges of the tenth group of the slug test are 0.5 to 10.12 m, and the test section ranges of the second group of the slug test are 0.5 to 1.3 m. Therefore, similarly, according to the assumed layered rock mass equivalent permeability coefficient method, the equivalent permeability coefficient from 1.3 to 10.12 m can be calculated based on the slug test data. The test section ranges can be approximately 1.37 to 10.12 m of the test section ranges of the third group of water pressure tests. The equivalent permeability coefficient of fractures by the slug test in the test section corresponding to the three groups of water pressure tests is calculated, according to the assumed layered rock mass equivalent permeability coefficient method. The calculation results are shown in
Table 5.
According to the relationship between water permeability and permeability coefficient in the Chinese “Code for engineering geological investigation of water resources and hydropower” (GB50487-2008) [
29], it can be observed from
Figure 9 that the water permeability calculation results of the three groups of water pressure tests are basically consistent with the equivalent permeability coefficient results determined by the slug test in the corresponding test section, which can indicate the accuracy and applicability of the proposed slug test method and self-developed test system used to determine the fracture permeability coefficient, which is more convenient and efficient than other test methods.
3.7. The Calculation of the Fractured Rock Mass Permeability Coefficient Tensor
Therefore, according to the fracture statistics in
Table 2, the 10 fractures are divided into 4 groups, and fracture classification statistics are shown in
Table 6 and
Figure 10. In order to calculate the fractured rock mass permeability coefficient tensor at the test site, it is necessary to calculate the permeability coefficient of each fracture. Therefore, it is necessary to calculate the equivalent permeability coefficient of each fracture in the corresponding test section. Similarly, the equivalent permeability coefficient of the fracture in the corresponding test section is calculated according to the assumed layered rock mass equivalent permeability coefficient method, and the calculation results are summarized in
Table 7. For the convenience of calculation, the symbols of fracture-related information (dip direction, dip angle and fracture permeability coefficient) are listed in
Table 8.
It can be observed from
Table 7 that there is only one fracture in each footage, except for two fractures in the second footage and the seventh footage. Therefore, according to
Table 6, assuming that the fracture width, dip angle and permeability coefficient of fracture No. 2 and No. 3 in the second fracture group are basically the same, and the fracture width, dip angle and permeability coefficient of fracture No. 7 and No. 8 in the fourth fracture group are basically the same,
,
,
,
,
,
. So, according to the equivalent permeability coefficient of fractures in the corresponding test section determined by the slug test, the permeability coefficient of each fracture is inversely calculated, and then the equivalent permeability coefficient of all four fracture groups in the whole borehole test section is respectively determined. Finally, the fractured rock mass permeability coefficient tensor in the whole borehole test section is calculated. Because, according to the Equation (15),
If Equation (21) is placed into Equation (19), then
The depth of the whole borehole test section is and one can calculate the equivalent permeability coefficient of every fracture group in the whole borehole test section.
The equivalent permeability coefficient of the first fracture group in the whole borehole test section is as follows:
If Equation (23) is placed into Equation (32), then
The equivalent permeability coefficient of the second fracture group in the whole borehole test section is as follows:
If Equations (24) and (25) are placed into Equation (34), then
The equivalent permeability coefficient of the third fracture group in the whole borehole test section is as follows:
If Equations (26), (27) and (30) are placed into Equation (36), then
The equivalent permeability coefficient of the fourth fracture group in the whole borehole section is as follows:
If Equations (29) and (31) are placed into Equation (38), then
According to the average dip direction
and dip angle
of the four fracture groups in
Table 6 and the Equation (16), the fractured rock mass permeability coefficient tensor in the whole borehole test section is calculated, and the following is obtained:


