Article

Effect of COVID-19 on Selected Characteristics of Life Satisfaction Reflected in a Fuzzy Model

by
Dariusz Mikołajewski
1,2 and
Piotr Prokopowicz
1,*
1
Institute of Computer Science, Kazimierz Wielki University, 85-064 Bydgoszcz, Poland
2
Laboratory of Neurophysiological Research, Medical University of Lublin, 20-059 Lublin, Poland
*
Author to whom correspondence should be addressed.
Appl. Sci. 2022, 12(15), 7376; https://doi.org/10.3390/app12157376
Submission received: 24 June 2022 / Revised: 14 July 2022 / Accepted: 20 July 2022 / Published: 22 July 2022
(This article belongs to the Special Issue Artificial Intelligence in Life Quality Technologies)

Abstract

:

Featured Application

Potential application of the work concerns automatic or semi-automatic systems for the assessment and classification of characteristics of life satisfaction as far as early risk of work-related stress or burnout.

Abstract

The general goal of the research in this article is to devise an algorithm for assessing overall life satisfaction—a term often referred to as Quality of Life (QoL). It is aggregated to its own proposition, called personal life usual satisfaction (PLUS). An important assumption here is that the model is based on already known and commonly used solutions, such as medical (psychological and physiotherapeutic) questionnaires. Thanks to this, the developed solution allows us to obtain a synergy effect from the existing knowledge, without the need to design new, complicated procedures. Fuzzy multivariate characterization of life satisfaction presents a challenge for a complete analysis of the phenomenon. The complexity of description using multiple scales, including linguistic, requires additional computational solutions, as presented in this paper. The detailed aim of this study is twofold: (1) to develop a fuzzy model reflecting changes in life satisfaction test scores as influenced by the corona virus disease 2019 (COVID-19) pandemic, and (2) to develop guidelines for further research on more advanced models that are clinically useful. Two groups affected by professional burnout to different degrees were analyzed toward life satisfaction twice (pre- and during pandemy): a study group (physiotherapists, n = 25) and a reference group (computer scientists, n = 25). The Perceived Stress Score (PSS10), Maslach Burnout Inventory (MBI), Satisfaction with Life Scale (SWLS), and Nordic Musculoskeletal Questionnaire (NMQ) were used. The resultant model is based on a hierarchical fuzzy system. The novelty of the proposed approach lies in the combination of the use of data from validated clinimetric tests with the collection of data from characteristic time points and the way in which they are analyzed using fuzzy logic through transparent and scalable hierarchical models. To date, this approach is unique and has no equivalent in the literature. Thanks to the hierarchical structure, the evaluation process can be defined as a modular construction, which increases transparency and makes the whole procedure more flexible.

1. Introduction

In a global view of the development and condition of our civilization, we pay attention to the quality of life of the community. In the colloquial sense, the assessment of life is a highly subjective parameter. There are many aspects in everyday life that contribute to a human’s overall satisfaction and contentment.
In scientific studies, general satisfaction of life is often associated with global/national economic factors such as gross domestic product (GDP; see Abbreviations for list of abbreviations) per capita [1,2]. The economic context is important, but there are important factors independent of it, related to the psychological aspects of life, e.g., burnout. It is also difficult to consider satisfaction with life without considering the physical condition of the human organism.
Personal assessment of life quality is particularly dependent on one’s internal beliefs and attitudes towards everyday activities, so even a high financial/economic status does not guarantee a positive assessment of one’s own achievements. Therefore, it is worth looking at psychological research in search of representative coefficients supporting the assessment of life satisfaction.
The main contribution of this paper is the proposition of the solution of the scientific problem. The specific issue to be solved is an interdisciplinary problem of technical and clinical relevance, with a global reach, related to simple, low-cost, efficient, reproducible, and accessible diagnostics for the short- and long-term consequences of the COVID-19 pandemic and related conditions.
The main goal of the research presented here is to devise a model and algorithm to evaluate individual satisfaction with life—a parameter often referred to as Quality of Life [3,4,5]. In our case, we focus on individual impressions, and not on global economic parameters. This is why we are introducing the alternative factor, “personal living usual satisfaction”, or PLUS. An important assumption of the designed algorithm is that the model should be based on already known and widely used solutions, such as medical questionnaires (in the field of psychology and physiotherapy). Thanks to this, the developed results will allow us to obtain a synergy effect from the existing knowledge, without designing new, complex procedures.
To create a measurement model that will combine data of different nature into one coherent system, it is worth using fuzzy logic [6,7,8]. Due to the specificity of psychological research, many of it is based on questionnaire assessment. In such cases, the linguistic model—the basis for the fuzzy system—is already pre-prepared.
By using questionnaires as a data source, we have access to a linguistic description of the dependencies and results. This description is the result of years of experience of the scientists who develop these questionnaires. To preserve this knowledge and experience in the created digital model, in the presented research, we used a tool such as the fuzzy sets and the fuzzy systems. Their main advantage is the ability to define rules based on a linguistic description. In this way, it is possible to propose an algorithm/model while maintaining the intuitions and assumptions of data sources that are not described by a mathematical model.
From a number of previous studies [9,10,11,12,13], the hierarchical model of fuzzy systems in evaluation applications turned out to be effective; therefore, it was used in the present research. Thanks to the hierarchical structure, the evaluation process can be defined as a modular construction. This increases the transparency and makes the whole procedure more flexible and easier to extend with new parameters or to change the existing ones, depending on the availability of research.
Designing the individual life quality evaluation procedure, we focus on three different contexts of personal life aspects:
-
general opinion about one’s own well-being and satisfaction;
-
physical condition—physical everyday issues;
-
satisfaction with work and its results.
If there is no reason to emphasize any area of life, in the reliable quality evaluation model, we treat all partial assessments as equally important. In the study, the Perceived Stress Score (PSS10), Maslach Burnout Inventory (MBI), and Nordic Musculoskeletal Questionnaire (NMQ) were used. PSS10 measures psychological stress—it is used to assess the extent to which situations in a person’s life are judged by them to be stressful [14]. MBI is a tool to measure professional burnout in three dimensions: emotional exhaustion (EE), depersonalization (DP), and personal achievement (PA) [15]. The Satisfaction with Life Scale (SWLS) is a short 5-item instrument designed to measure global cognitive judgments of satisfaction with one’s life. The NMQ is a symptom questionnaire for musculoskeletal disorders, mainly for lower back, neck, and shoulder pain [16]. All of the above-mentioned tests are frequently used, valid, and reliable [17,18,19] and thus comparative material is more readily available, but they are rarely used simultaneously, which adds value to the present study.
We were particularly interested in the influence of the COVID-19 pandemic onwell-being and life satisfaction, taking into consideration also the possible effects of burnout and occupational stress. Occupational burnout is a multidimensional syndrome that includes emotional exhaustion, depersonalization, and a low sense of fulfillment at work.
A literature review of the impact of the COVID-19 pandemic on life satisfaction, conducted on five leading bibliographic databases, showed 354 papers published between 2020 and 2022 (56 in 2020, 195 in 2021, and 146 in 2022), focusing mainly on socioeconomic disparities. Only one of them used computational intelligence. A similar literature review of the impact of the COVID-19 pandemic on burnout, conducted on five leading bibliographic databases, showed 1567 papers published between 2020 and 2022 (393 in 2020, 948 in 2021, and 386 in 2022), including 111 reviews (35 in 2020, 65 in 2021, and 23 in 2022) and only 19 meta-analyses (5 in 2020, 8 in 2021, and 2 in 2022). As many as 212 papers were concerned with building some form of model of the impact of the pandemic on occupational burnout, but none used a computational model for this purpose, significantly speeding up the analysis and allowing much broader inferences from the data. This paper aims to fill the aforementioned gap in research and data analysis, drawing on original data from our own research.
To date, factors such as work overload, material resources, human resources, communication, and social support at work have been key in explaining burnout. The COVID-19 pandemic and the resulting changes in social interactions, work performance, and increased workload in some professions (including IT and medical) have further highlighted these adverse changes. Organizational strategies to offset this additional detrimental impact of the pandemic have proven necessary. These should include improved work organization, clear, fluent, and regular communication, increasing control over the work environment, and improving the confidence and skills of colleagues [20]. Undoubtedly, the COVID-19 pandemic has placed additional strain on healthcare workers, but the specific effects on these workers remain unknown, despite the fact that healthcare worker burnout is a well-documented phenomenon. Despite the difficult situation in the healthcare system during the pandemic, compassion fatigue (CF) and burnout (BO) rates remain moderate/high, while compassion satisfaction (CS) increases, especially among nurses, probably because of their motivation to relieve suffering and because of perceived social recognition. Hence, further intensification of strategies to improve CS and prevent BO and CF in at-risk groups in the long term is necessary [21]. The review by Galanis et al., on a group of 18,935 nurses, obtained the following results.
  • They observed that the overall prevalence of
    -
    emotional exhaustion was 34.1%;
    -
    depersonalization was 12.6%;
    -
    lack of personal accomplishment was 15.2%.
  • The main risk factors were found to be
    -
    younger age;
    -
    less social support;
    -
    low family and co-worker preparedness to cope with the COVID-19 outbreak;
    -
    increased sense of threat of COVID-19 virus;
    -
    longer time working in quarantined areas;
    -
    working in a high-risk environment;
    -
    working in hospitals with inadequate and insufficient material and human resources;
    -
    higher workload;
    -
    lower level of specialized COVID-19 training [22].
A similar study conducted among physiotherapists showed that, during COVID-19 pandemic,
-
over 40% of physical therapists experienced personal and professional burnout and 25% experienced patient-related burnout [23];
-
managerial activity was significantly correlated with therapist frustration [24].
Especially during the COVID-19 pandemic, emphasis should be placed on implementing early detection strategies for burnout, the importance of a healthy psychosocial work environment, increasing job satisfaction, and avoiding role conflict to counteract physical and mental fatigue and exhaustion for physical therapists [23,24]. A cross-sectional study among nurses, physician assistants, respiratory therapists, healthcare technicians, physical therapists, occupational therapists, and speech therapists obtained the following results.
  • Several factors significantly increased the likelihood of at-risk well-being:
    -
    lower levels of resilience;
    -
    use of support resources;
    -
    lack of organization understanding of the emotional support needs of healthcare workers;
    -
    increased workload;
    -
    insufficient personal protective equipment;
    -
    staff was insufficient to safely care for patients;
    -
    lower levels of psychological safety.
  • Several factors were found to be significantly associated with higher levels of resilience:
    -
    positive perceptions of the organization’s understanding of the emotional support needs;
    -
    belief that sufficient educational resources were available regarding COVID-19 patient care;
    -
    positive perceptions of support from direct supervisors;
    -
    positive perceptions of staff redeployment policies;
    -
    higher levels of psychological safety [25,26,27].
Prior to the COVID-19 pandemic, more than 50% of physicians reported symptoms of professional burnout, and this number is likely increasing as the pandemic continues [28]. The aforementioned situation significantly affects the health of the population and the effectiveness of the workforce, representing an important scientific, clinical, economic, and social problem. Objectification and reduction of measurement uncertainty will allow not only for a more accurate estimation of the current state, but also forthe prediction of future values and trend measurement to potentially reverse the direction of change from negative (increase in burnout and its severity over time) to positive (stabilization and then decrease in burnout and its severity over time). The historical trajectory, the way it is defined, the diversity of etiologies and symptoms, their personalization, and the imprecision of clinical diagnosis require dedicated tools housed in preventive medicine and lifestyle medicine [28]. One such tool is fuzzy models, already used in the computational modeling of health-related outcomes, including disease diagnosis [9,10,11,29,30]. A review of the literature showed 6208 publications concerning applications of fuzzy logic in medicine (1974–2022). The literature review showed that fuzzy logic is increasingly being used effectively to diagnose diseases based on symptoms and historical and clinical data, and its popularity is growing. Major areas of fuzzy logic applications in medicine to date include diagnostic testing and/or therapy for diabetes, heart, lung, liver and kidney diseases, breast cancer, cholera, brain tumors, asthma, viral diseases, Parkinson’s disease, and Huntington’s disease, as well as ophthalmology (iris) and dentistry [29]. Among the important directions indicated for the application of fuzzy logic is the study of celiac disease [29].
The research gap lies in the lack of a fuzzy model reflecting accurately and flexibly the changes in life satisfaction test scores under the impact of the COVID-19 pandemic, and indirectly in the lack of guidelines for further research on more sophisticated models that are technically feasible and clinically useful.
Only two of all found articles concern the application of fuzzy logic [11,31]. The first article presents a new fuzzy algorithm model that extends the interpretability of the scale scores obtained with the Maslach Burnout Inventory (MBI) [11]. The other paper deals with the use of fuzzy logic to design an intelligent fuzzy inference system to assess midwives’ burnout levels. It takes into account both findings from the literature on professional burnout and expert knowledge obtained through semi-structured interviews. It incorporates fuzzy rules as more intuitive and easier to understand and modify by users. The study confirms the consistency of midwives’ burnout ratings generated by the fuzzy system with the experts’ ratings in terms of precision and personalization. This extends the functionality of the system beyond simple assessment also to the study of the interdependence of burnout factors and supports the creation of prevention strategies [8].
Fuzzy logic belongs to artificial intelligence (AI) and, more broadly, computational intelligence (CI) methods [8,32]. The process of making clinical decisions based on diagnostic test results, patient history, etc., is inherently accompanied by ambiguity and uncertainty, which can be reduced by using fuzzy logic [33]. Uncertainty here does not mean a lack of knowledge, but only a lack of unambiguous accuracy of linguistic description that cannot be assessed by statistical methods or probability calculus. Hence, in the absence of a fuzzy description, the choice would be subject to greater error. Uncertain knowledge works in the vast majority of cases, but not in every case. It is equivalent to expert knowledge—each expert draws knowledge and diagnostic rules from his or her own experience, but this experience need not be the same. The concept of “minor stress” or “moderate pain”, as well as an “appropriate dose of medication”, may also be experienced or described differently by different patients. In the case of fuzzy sets, a feature value may only belong to the set to some degree, allowing for a more tailored description of the value of diagnostic uncertainty. In this way, descriptive information typical for humans is converted into numerical information (e.g., about the represented range of numbers) that is possible to process by computational systems. The process of converting values from the domain of real numbers to values from the domain of fuzzy sets is called fuzzification, and the reverse process is defuzzification. It allows a certain freedom of value operation and information exchange in the system–human relationship. From the perspective of constructing a fuzzy system, the following steps are crucial:
-
definition of the task and how it can be accomplished using fuzzy sets;
-
definition of linguistic variables and their fuzzy equivalents;
-
definition of membership functions;
-
definition of a set of fuzzy rules for these variables;
-
choice of defuzzification method.
Thus, a clinical decision support system based on Mamdani-type fuzzy data using clustering and pivot tables can help to make clinical decisions concerning five groups of diseases [34] or musculoskeletal disorders [35]. The current study is a step toward developing computational patient models to support medical professionals in diagnosing burnout. Digital patient twins and artificial intelligence-based optimization can play a key role in improving the accuracy, efficiency, and safety of such computational tools and supporting the fulfillment of constraints in patient-specific solutions [36,37].
The novelty of the proposed approach lies in the combination of the use of data from validated clinimetric tests with the collection of data from characteristic time points and the way in which they are analyzed using fuzzy logic through transparent and scalable hierarchical models. To date, this approach is unique and has no equivalent in the literature.
The aim of this study is twofold: (1) to develop a fuzzy model reflecting changes in life satisfaction test scores as influenced by the COVID-19 pandemic, and (2) to develop guidelines for further research on more advanced models that are clinically useful.

2. Materials and Methods

2.1. Materials

The results of the MBI were analyzed in two groups: a study group (physical therapists, n = 25) and a reference group (informaticians, n = 25). A clinical summary of the subjects is presented in Table 1.

2.2. Methods

There are several clinical scales used to assess job stress, burnout, and well-being. We used four of them: Perceived Stress Score (PSS10), Maslach Burnout Inventory (MBI), Satisfaction with Life Scale (SWLS), and Nordic Musculoskeletal Questionnaire (NMQ). The choice of tests was dictated by a number of factors, most notably the universality of their use with global reach (not necessarily in combination, such as in this study), the validity and reliability of the tests, and the possibilities for the replication of the tests, in addition to identifying directions for further research, particularly in the domain of computational analysis. The characteristics of each scale relevant to the multivariate analysis are presented in Table 2.
Each study participant was evaluated twice: before the COVID-19 pandemic and in the second year of the pandemic.

2.3. Statistical Analysis

The results of the tests and calculations were each time recorded in an MS Excel spreadsheet and statistically analyzed using Statistica 13 (StatSoft, Tulsa, OK, USA). The normality of the data distribution was checked each time using the Shapiro–Wilk test (α = 0.05).
The p value was set at 0.05. The significance level was set at 0.05 because this value is commonly used in biomedical publications, and we would like our results to be comparable with others published within the topic of burnout analysis.
Values for distributions close to the normal distribution were represented by the mean value and standard deviation (SD).
Values for distributions deviating from the normal distribution were represented by the median, minimum value, maximum value, and lower quartile (Q1) and upper quartile (Q3).
The strength and direction of correlation between the results were represented using Spearman’s Rho coefficient.

2.4. Computational Methods

The main goal of the research was to adopt linguistic models of psychological questionnaires in an evaluation algorithm. Therefore, for its construction, the fuzzy system was used as the basic tool for the computation of linguistically defined rules.To design the evaluation process, where the different sources of data are proposed, we need a system with multiple inputs and one output, which will be the final assessment.
As part of the research, three fuzzy systems were defined. Since the assumptions of the evaluation are based on questionnaires whose principles and interpretation are described linguistically, we rely on fuzzy systems of the Mamdani type.
During previous research [9,10,11,12,13], the configuration below was efficient:
  • aggregation of premises in the rules—PROD;
  • implication—MIN;
  • aggregation of results from the rules (accumulation)—MAX;
  • defuzzification—center of gravity (COG).
The aforementioned parameters were used also in all of the models proposed in this paper.
By using fuzzy systems in the models of evaluation, we obtain a flexible tool for scaling the results. We use this advantage to make the results scale as an interval [0;1].
We use mainly normal trapezoidal fuzzy sets (they can also be called fuzzy intervals); therefore, to describe them, we use a similar notation as in LR fuzzy sets (see Dubois Prade, 1980 [38]). However, we change the order of the values. For example, a trapezoidal fuzzy set T can be described as below:
T = (l, k1, k2, r)
where l—the beginning of the support of T, r—end of the support, k1,k2—define the kernel interval of trapezoidal fuzzy set T.
Such description of a fuzzy set is a standard in many popular scientific tools such as Mathlab, Octave, or Scilab.
For the research in this paper, the six inputs of data were separated as follows.
-
PSS10—Perceived Stress Score
  • range of values XPSS = (0;40);
  • general interpretation: the higher value means the worse situation;
  • specificity of the interpretation suggests three potential output states.
-
SWLS
  • range of values XSWLS = (5;35);
  • general interpretation: a lower value means a worse situation;
  • specificity of the interpretation suggests six potential output states; however, as the numerical interval is narrow, we paired the context of the outputs, obtaining finally three potential output states.
-
NMQ—Nordic Musculoskeletal Questionnaire
  • range of values XNMQ = (0;40);
  • general interpretation: ahigher value means aworse situation;
  • there is no specific number of output interpretations.
Although the Maslach Burnout Inventory (MBI) is one questionnaire, it represents three quite different factors, so it is reasonable to treat them separately. Additionally, each of them has its own scale and interpretation.
-
“Emotional exhaustion” Xem
  • range of values Xem = (0;54);
  • general interpretation: a higher value means a worse psychological condition.
-
“Depersonalization” Xdep
  • range of values Xdep = (0;30);
  • general interpretation: a higher value means a worse psychological condition.
-
“Lack of personal achievements” Xachiev
  • range of values Xachiev = (0;48);
  • general interpretation: a lower value means a worse psychological condition—note that it is opposite to the other MBI factors.
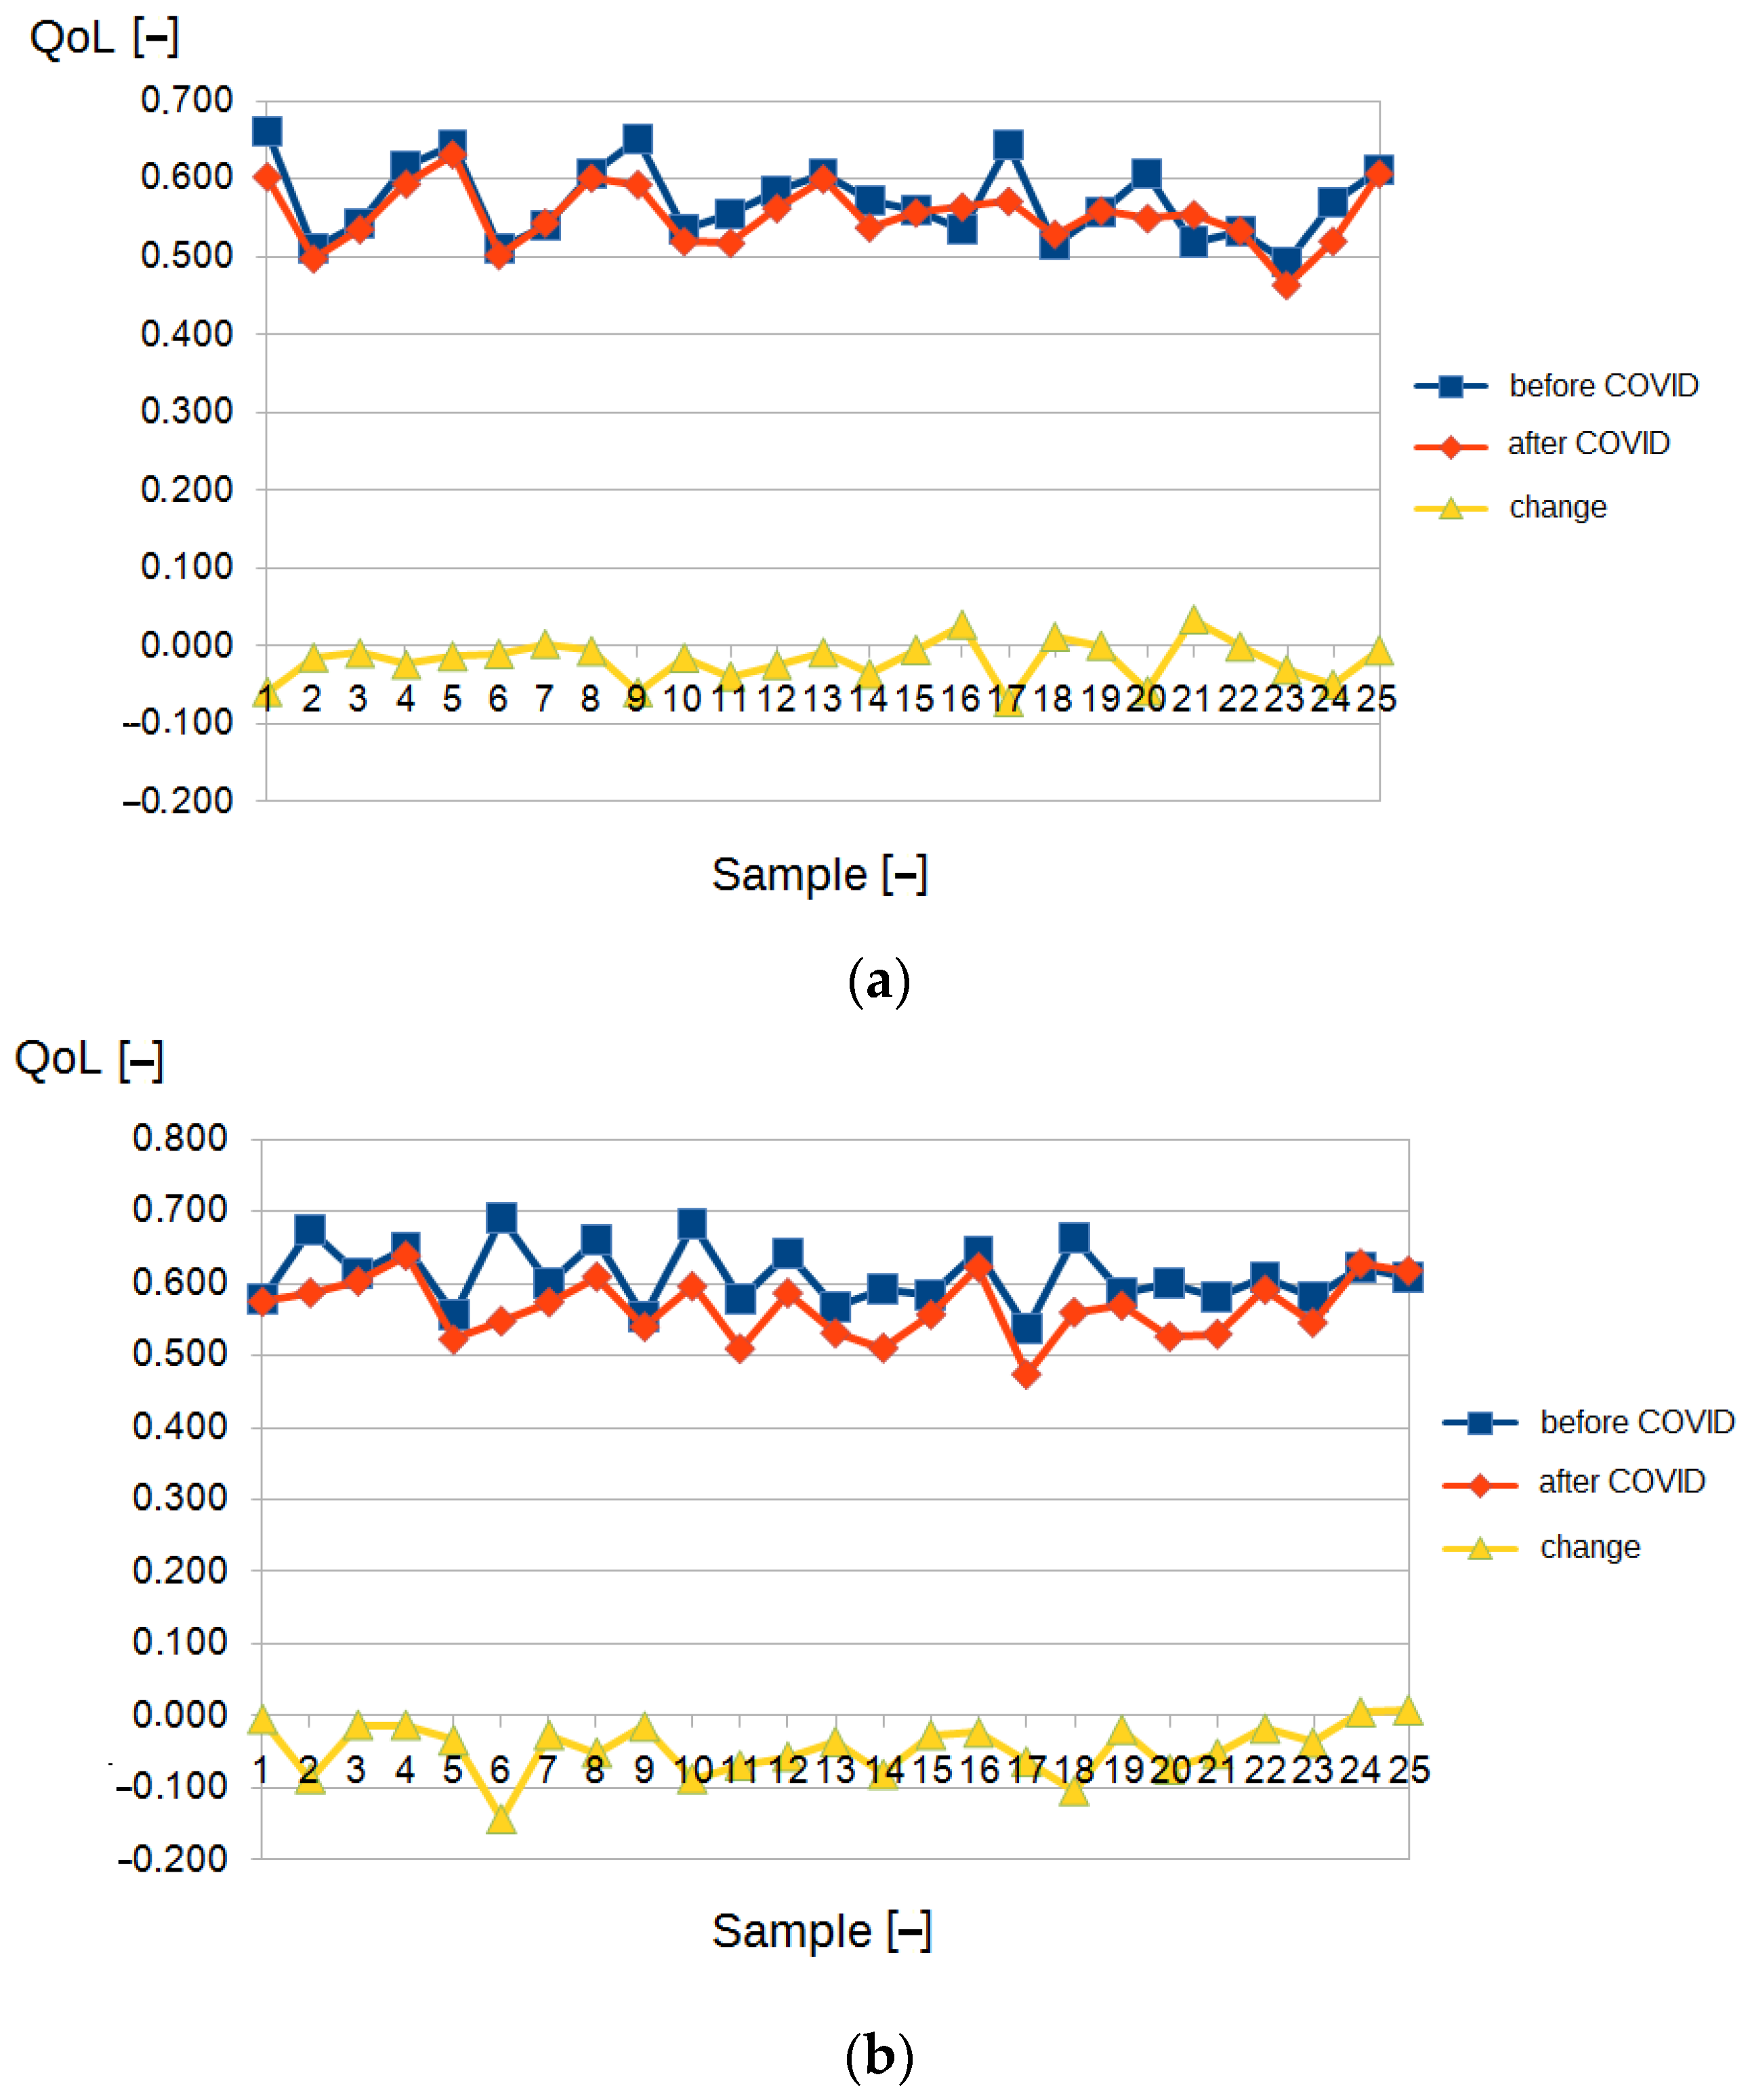
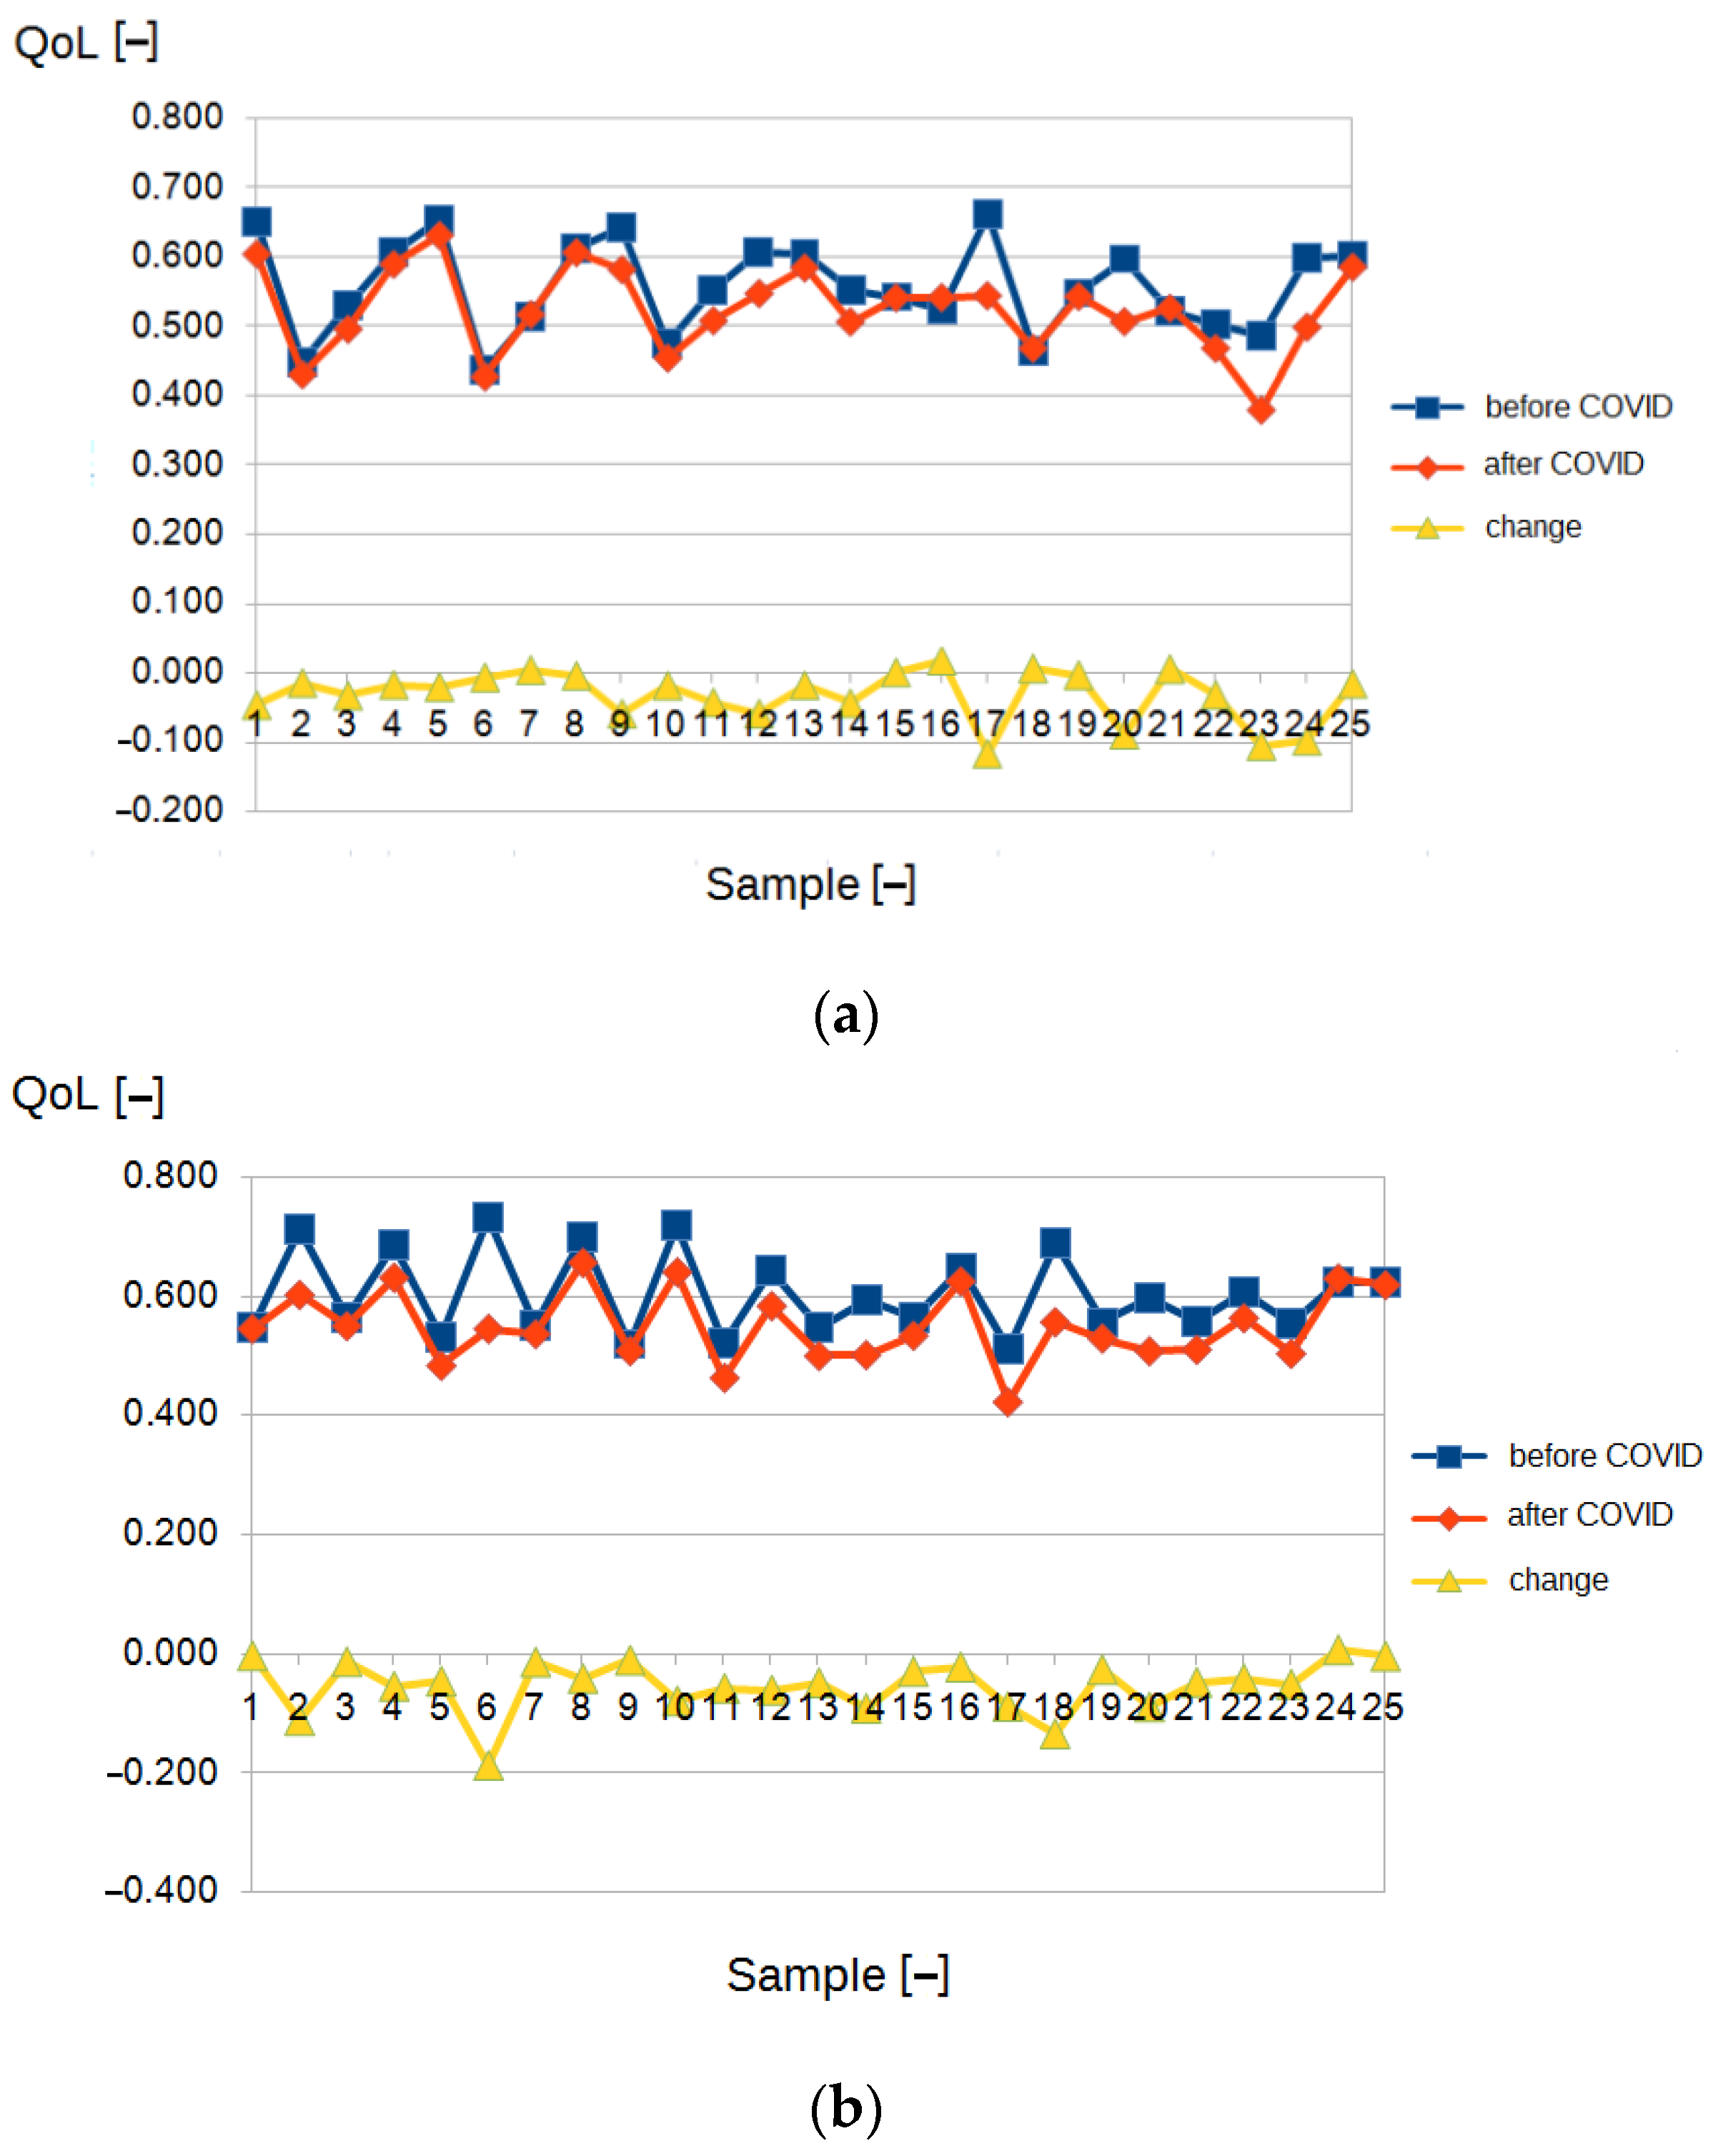
All three factors have three specific potential interpretations of output states.
These above input data belong to three different concepts of life quality evaluation.
(a)
PSS10 and SWLS—the respondent’s general opinion about their own life.
(b)
NMQ—physical state.
(c)
MBI factors—job burnout.
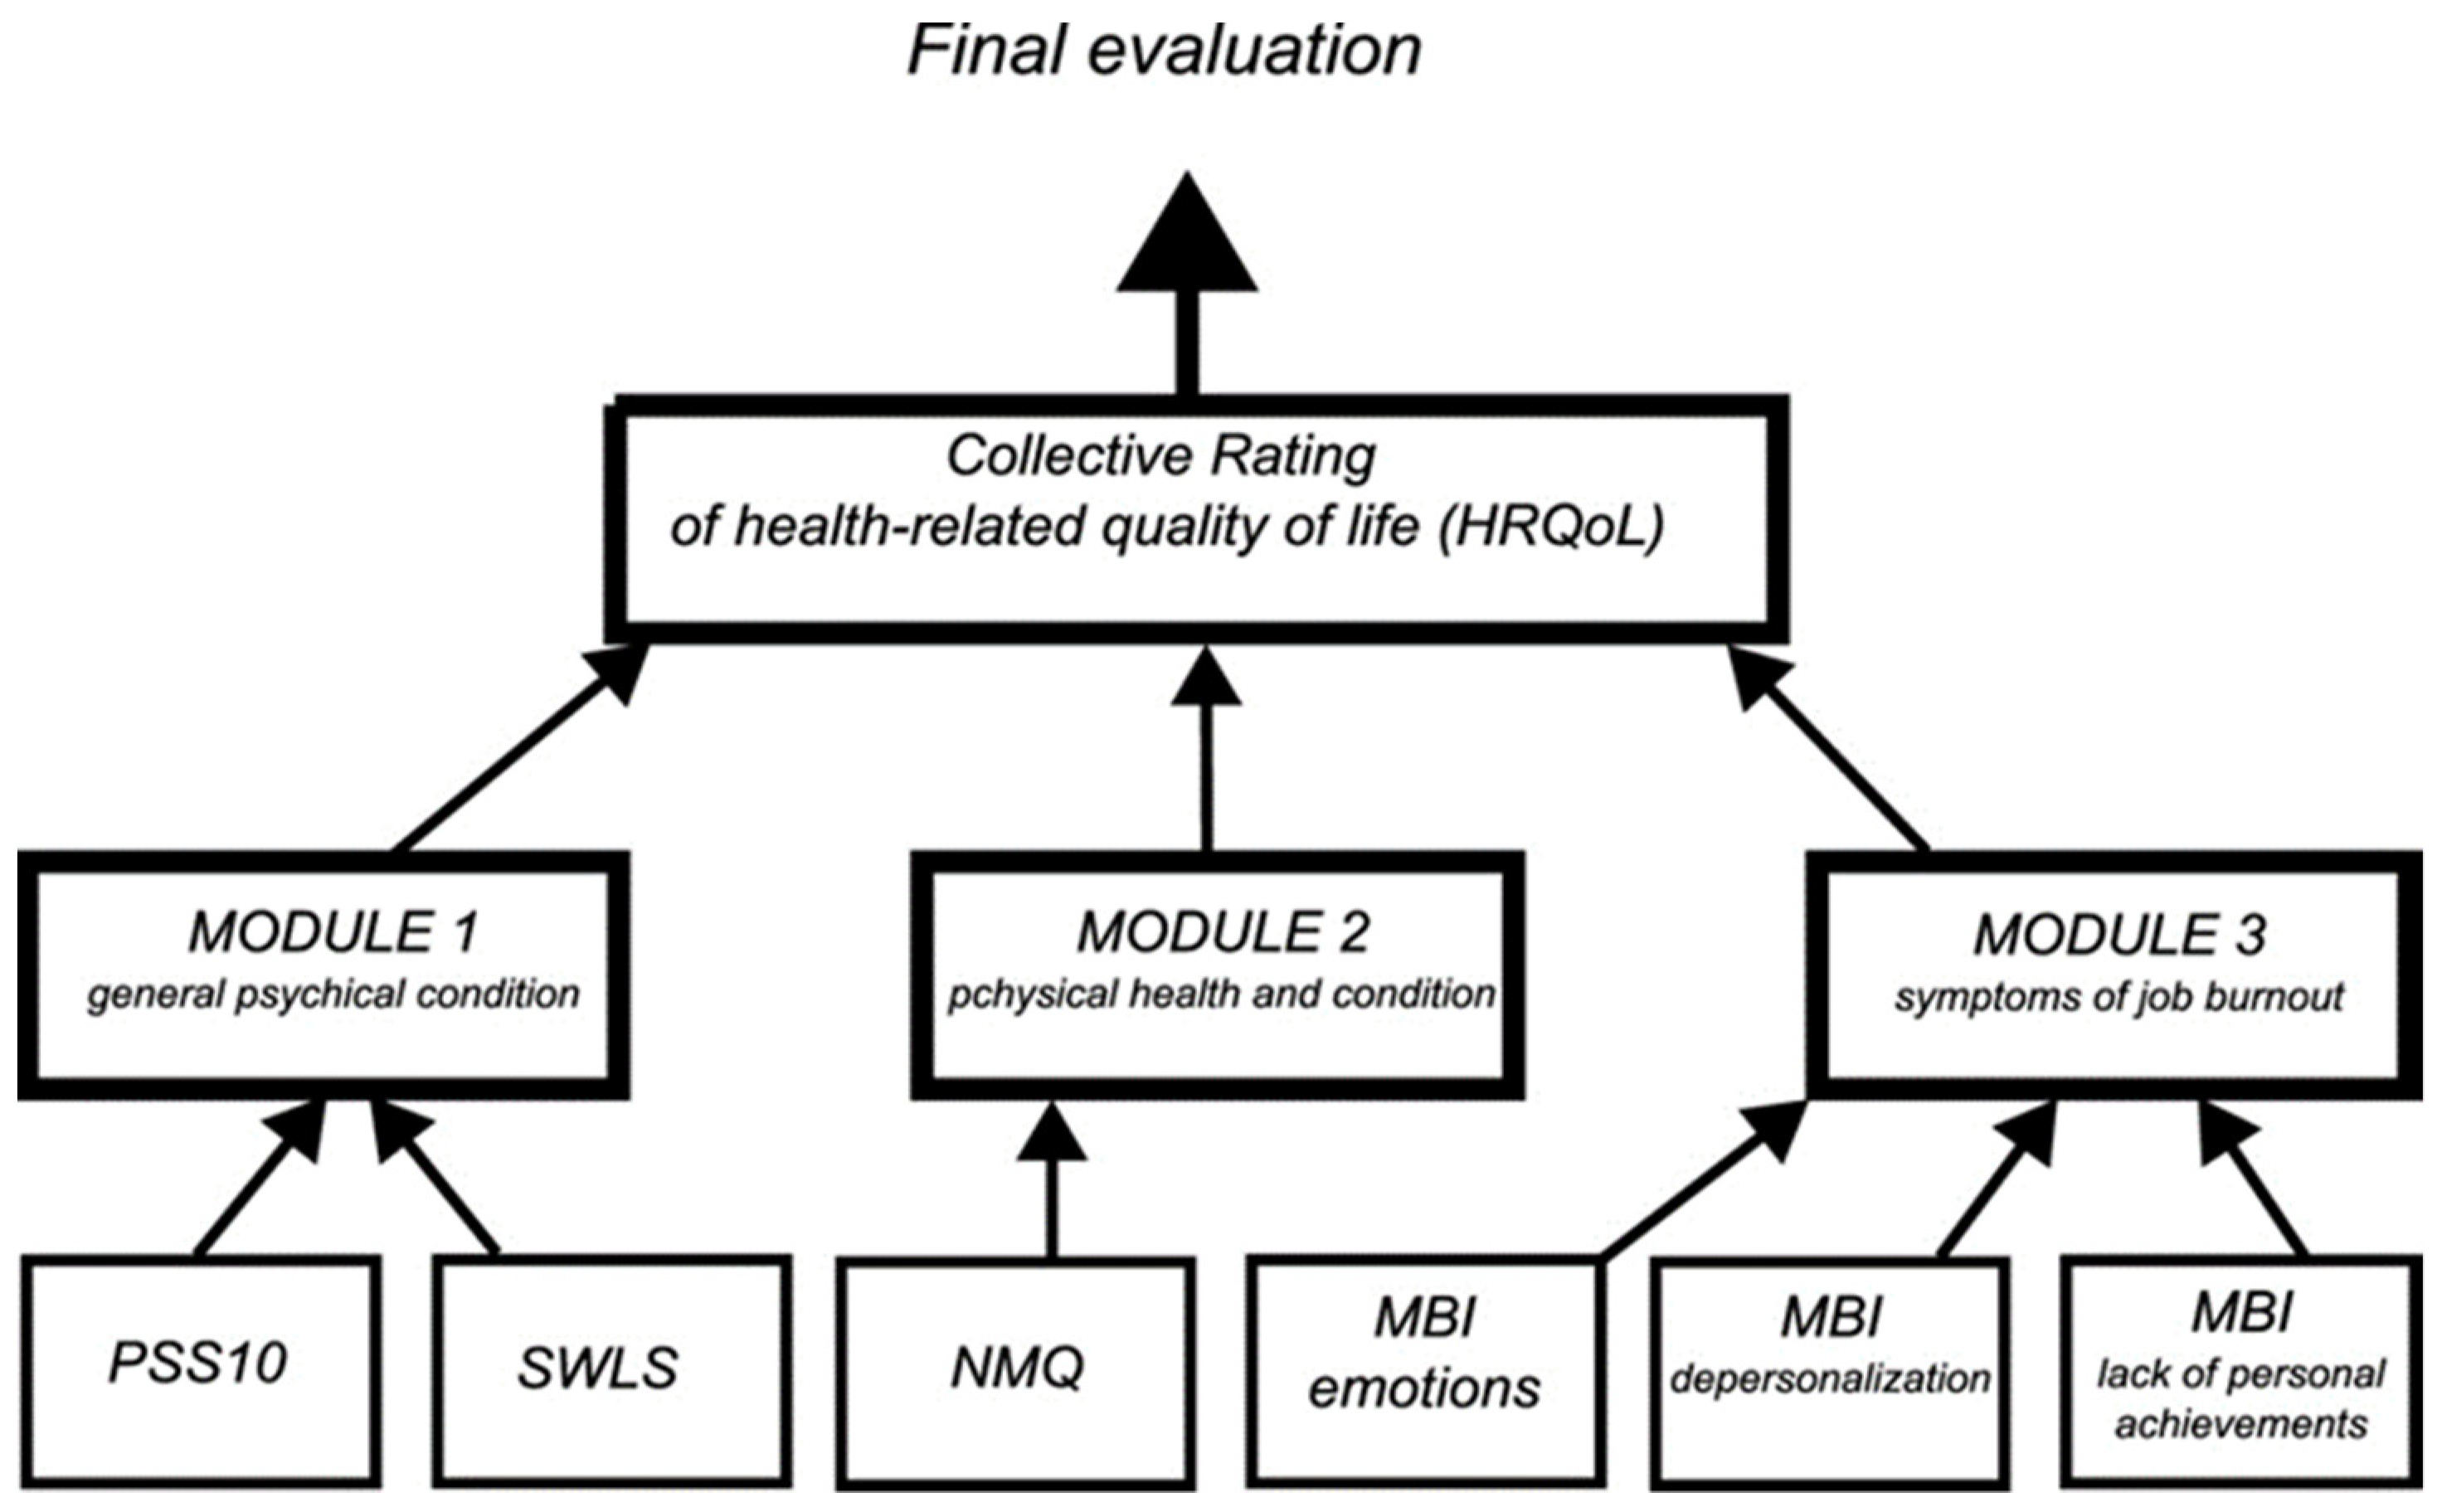
  • Proposition 0
The very first trivial attempt of the design of the evaluation proposition was a simple fuzzy system.
The input variables PSS10 and SWLS were described by three linguistic values (derived from the specificity of questionnaire interpretation) and the rest by two. Such a system needed a number of rules:
|R| = 3 × 3 × 2 × 2 × 2 × 2 = 144
where R represents the set of rules for the system.
This trivial proposition was only the starting point. Different concepts of measuring life quality are not equally represented, so the results cannot be treated as truly representative.
  • Proposition 1
As the first working proposition, the hierarchical fuzzy system was used based on previous experience [9,10,11,12,13]. Apart from the reduction in the number of rules, this conception allowed for modular construction (see Figure 1). This caused the final assessment to depend on three input sources with equal importance, which we expected from the evaluation.
Model 1 is a two-tiered hierarchical system divided into three modules:
-
mental state assessment module—a system that collects data from the PSS10 (three linguistic values) and SWLS;
-
physical state assessment module—a system collecting data from the NMQ survey questionnaires;
-
burnout assessment module—based on MBI, but divided into 3 features: emotions, depersonalization, and lack of achievements; this was a simplified structure of the approach given inthe work of Prokopowicz and Mikołajewski [11].
For Module 1, input variables PSS10 and SWLS have three input variables—three linguistic values—so the number of rules is:
|RMOD1|= 3 × 3 = 9
As Module 2 is represented only by the NMQ factor, it is simply a fuzzy system-based normalization of the input to the [0;1] interval. As, in this case, we described the input by three values, we have three rules:
|RMOD2| = 3
Module 3 represents a concept from our previous research (Prokopowicz and Mikołajewski [10]).
Here, we have three MBI factors as inputs and each has three fuzzy values.
Therefore, rules are counted as follows:
|RMOD3|= 3 × 3 × 3 = 27
The final system’s purpose is the aggregation of the results from the modules. Inputs are normalized to [0;1] thus, we use the simplest model—three inputs with two values each. The number of rules for this solution is:
|RFINAL|= 2 × 2 × 2 = 8
The whole system using the sum of rules is:
|R|= 9 + 3 + 27 + 8 = 47
The number of rules is significantly smaller than for the trivial attempt, but more importantly, the model is more intuitive.
  • Proposition 2
This proposition is an extended version of the previous one. In fact, the number of rules is not as important as the flexibility and intuitiveness. Therefore, during the research, we defined more variants of the evaluation fuzzy systems. They were slightly different; here, we present the system that processes the information with more detailed portions of data.
The reason for the proposition is the further averaging adopted in the processing of data in the modules and taking into account more detailed characteristics of evaluation.
To the previous proposition, an additional tier was added. Its purpose is the pre-normalization of inputs. For every input is added a simple, one-in-one-out fuzzy system. However, for Module 2, there is only one input, so, in fact, this module was already (previously) suitable for the pre-normalization of data. Thus, in this case, there was no change.
For the Module 1 system—gathering input factors—we used two values in each input.
For the Module 3 system, as there are three inputs, we used three values for each, to maintain the averaging quality of data processing.
The numbers of rules are as follows.
Module 1:
|RPSS| = 3, |RSWLS| = 3, |RMOD1| = 2 × 2 = 4,
Module 2:
|RMOD2| = 3,
Module 3:
|RDepersonalization| = 3;|REmotions| = 3; |RAchievements| = 3; |RMOD3| = 3 × 3 × 3 = 27,
Final:
|RFINAL| = 2 × 2 × 2 = 8.
|R| = 3 + 3 + 4 + 3 + 3 + 3 + 3 + 27 + 8 = 57.
The extended variant of the hierarchical fuzzy system added a small number of rules compared to the previous proposition. An additional effect is that, after the first tier, we have a normalized [0;1] assessment. Furthermore, some parameters weredefined with the opposite interpretation (the lower, the better), but after the first tier, all data have the same direction of interpretation.

3. Results

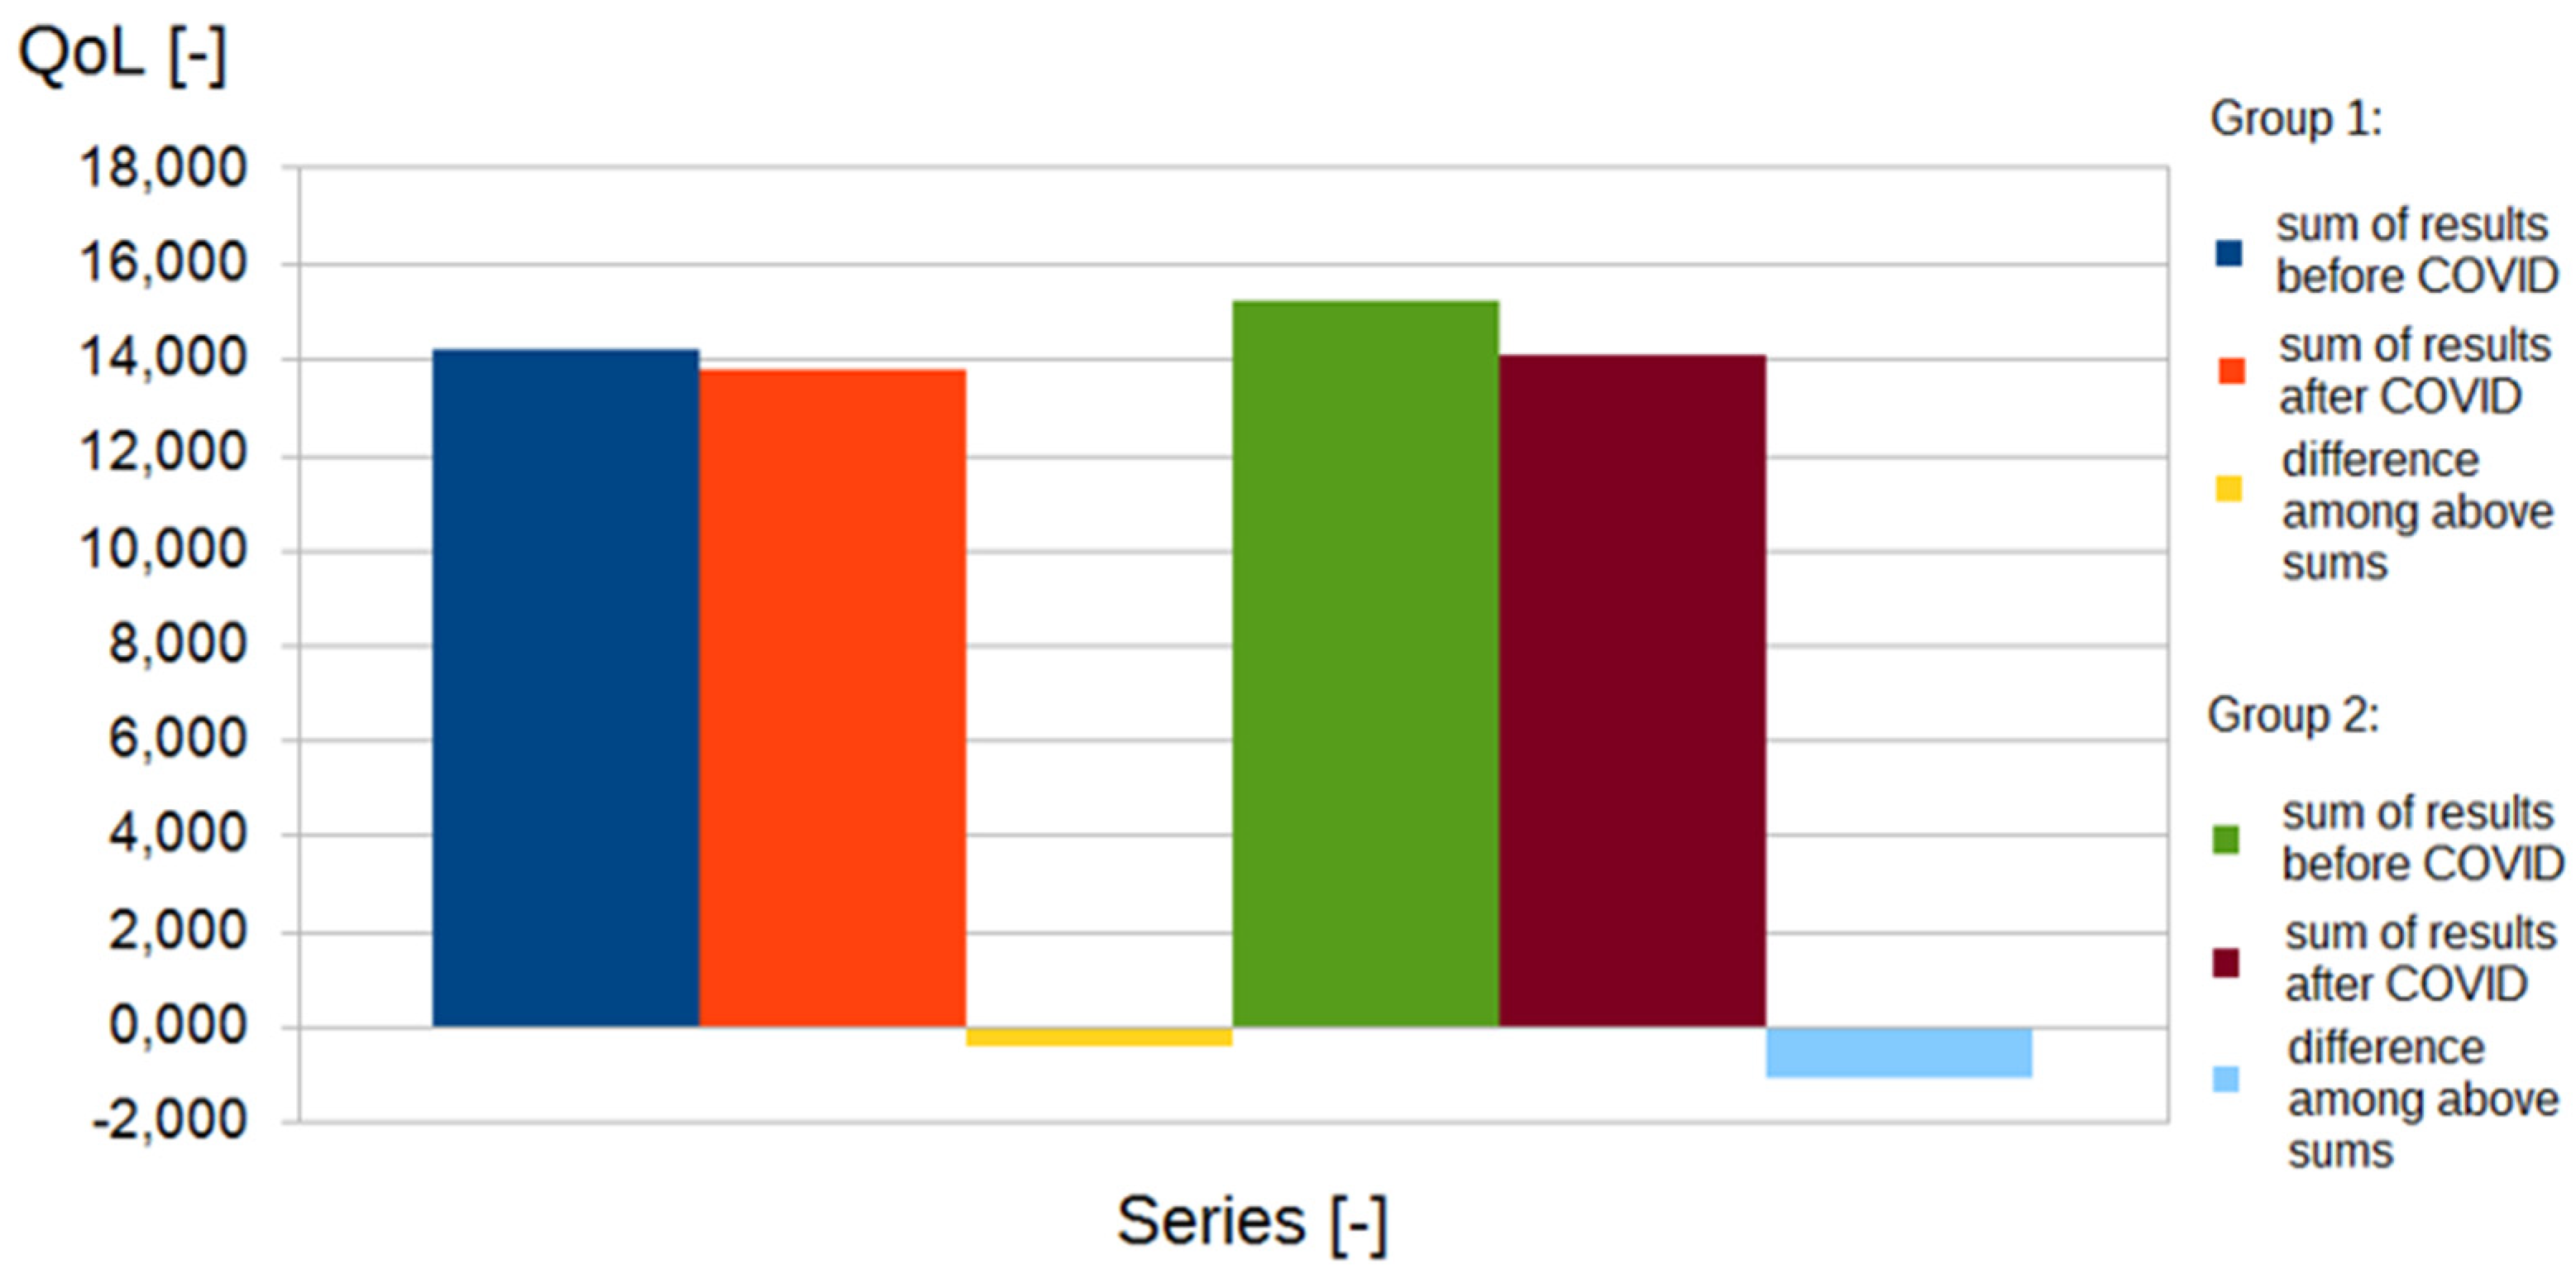
3.1. General Results

The results of the study are presented in the tables below (Table 3, Table 4, Table 5 and Table 6). The values, expressed as medians, were significantly worse in the study group than in the reference group.
The differences between the groups are shown in the tables when discussing Models 1–3.

3.2. Fuzzy Evaluation Models Summary

Three fuzzy models, representative of the larger number of models studied, have been selected for presentation in this paper.
As a baseline, we created Model 0—a traditional (non-hierarchical) approach: all data are processed by one fuzzy system, which results in a large number of 144 rules. The model described and constructed in such a way works, but it is impractical in everyday use, so we treat it as a reference model for other, more advanced models presented later in this paper. This model also proves that, even with a large number of data and rules, it is possible to create a traditional fuzzy model, but it is worthwhile to optimize it. The next two models represent hierarchical algorithms.
Model 1 is a two-tiered hierarchical system divided into three modules:
-
mental state assessment module—a system that collects data from the PSS10 and SWLS;
-
physical state assessment module—a system collecting data from the NMQ survey questionnaires;
-
burnout assessment module—based on MBI, but divided into three features: emotions, depersonalization, and lack of achievements—with a simplified structure adapted from the work of Prokopowicz and Mikołajewski [11] (Table 7, Figure 1, Figure 2).
Model 2 is a hierarchical system similar to Model 1, but with an additional initial layer in the form of simple fuzzy systems for the results from each type of questionnaire, which performs an initial normalization of the questionnaire data to the 0–1 interval (Table 8, Figure 3 and Figure 4).
New features were extracted as measurable properties of the observed phenomenon. The aforementioned datasets became the starting point for the development of three different fuzzy models, from which, after comparison, the one that was best suited to the study groups and the way that they were evaluated was selected. The third model clearly has an advantage.
In summary, this paper defines two fuzzy systems (Model 1, Model 2) for assessing certain psychological factors. Verification indicated that Model 2 was a better fit to the characteristics and changes in the input data than Model 1 (Table 9). Furthermore, Model 2 was a better fit to the characteristics and changes in the data in the physiotherapist group than in the IT group. This points to the possibility and even necessity of adapting and tuning models to specific patient groups to facilitate their use in a personalized medicine setting.
Overall, the essential added value of Models 1 and 2 presented is the accurate translation of existing medical procedures into evaluation algorithms while maintaining the assumptions of the linguistically described model.
The computational analysis was carried out using proprietary software that is part of a library developed over the last 10 years for processing and calculating Ordered Fuzzy Numbers (OFN). The computational correctness of the above solutions has been confirmed so far, many times, by control calculations using spreadsheets or comparison with reference values obtained from Matlab’s Fuzzy Logic Toolbox.

4. Discussion

The solution presented in this publication directly transfers the theoretical assumptions of measurements carried out through psychological questionnaires to a practical algorithm. It is possible, due to the application of a fuzzy system and its potential, to create a model based on linguistic description. The choice of the method appropriate to the investigated decision problem is not easy: Gershon’s model contains 27 criteria to compare multi-criteria methods, and Tecle’s model contains as many as 49 criteria to compare multi-criteria methods. Usually, the choice of the appropriate method itself is a multi-criteria problem and should be based on its properties and expert experience.
Fuzzy sets are used in multi-criteria analysis when the feature of a decision variant is described by several values. The use of fuzzy numbers makes it possible to take into account in the decision-making process such situations in which the values of features are described ambiguously (linguistically) or take several values, creating a certain range of variability. It is used, among others, in the fuzzy decision-making method TOPSIS (The Technique for Order of Preference by Similarity to Ideal Solution), which is based on the determination of the distances of considered values from ideal and non-ideal solutions. The final result of the above-mentioned analysis is a synthetic index, creating a ranking of examined versions, where the best one is considered to be the one with the smallest distance from the ideal solution and, at the same time, the largest distance from the non-ideal solution. The largest value of the ranking coefficient indicates the best variant.
The literature review showed 512 biomedical studies using TOPSIS published between 1987 and 2022, of which 149 studies (published between 2007 and 2022) involved the use of fuzzy TOPSIS [39,40]. However, none of the aforementioned publications addressed the use of the TOPSIS method in the diagnosis and treatment of burnout. The total number of papers on the use of fuzzy multi-criteria analysis in biomedical research was 319 between 1999 and 2022. Unfortunately, there were no papers on occupational burnout.
The review of 569 studies by Broekhuizen et al. showed that multi-criteria decision analysis (MCDA) is increasingly being used to support decisions in healthcare. The most commonly used approaches are
-
fuzzy set theory (45%);
-
deterministic sensitivity analysis (31%);
-
probabilistic sensitivity analysis (15%);
-
Bayesian framework (6%);
-
grey theory (3%) [41].
The analytic hierarchical process combined with fuzzy set theory was used in as many as 31% of the studies, but only 3% of the studies were published in health-related journals. The conclusions emphasize that, for most health decisions, a deterministic approach (effective with low complexity and simple interpretation and implementation) may be sufficient, but in cases where multiple sources of uncertainty need to be considered simultaneously, a more complex approach is needed [41,42]. Fuzziness of burnout has been confirmed by Maijaand & Katri [43]. In a traditional work-centered society, work structures, daily life, routines and habits, and work-related malaise require a “work-like” health management system based on research findings. Employees with burnout experience work-related distress that can be assessed and analyzed. This will both increase the effectiveness of burnout prevention strategies and the impact of other factors such as the COVID-19 pandemic, reduce absenteeism, and maintain a morally valuable assessment of the conduct of the aforementioned individuals not wanting to further endanger others [43]. Patients on sick leave due to burnout generally rated their health-related quality of life (HRQoL) as very poor, and their scores were significantly lower on all subscales compared with healthy full-time working individuals [44]. The phenotypic correlation between job burnout and sick leave due to somatic conditions is 0.07. The above-mentioned correlation was not influenced by family factors, but the correlations between job burnout and sick leave due to stress (0.26) and other psychiatric disorders (0.30) were completely explained by common genetic factors [45]. There is little quantitative research, in addition to varying methodological quality, that examines factors associated with return-to-work burnout. Further research is needed to refine guidelines for occupational healthcare support activities [46].
The solution proposed in this paper (PLUS) is an alternative to the above approach. The study adds significantly to our knowledge of fuzzy-based modeling for the situation of patients with job burnout. The results may be useful both in computational projects and in clinical work in terms of future research.
Only one study so far concerned the computational analysis of the impact of the COVID-19 pandemic on life satisfaction, but it used simple nomograms [47]. The results of this study suggested that the government of South Korea should provide economic support, infectious disease education, and individualized psychological counseling programs for people at high risk of life dissatisfaction following the COVID-19 pandemic. Due to the specificity of the South Korean population, it is difficult to compare the results of the aforementioned study with ours.
Important limitations of the study presented here are the small group sizes and the relatively young age of the participants. The aforementioned data will be supplemented in subsequent studies for further factor groups. Currently, a comparable solution is lacking among both scientific and clinical approaches. Hence, the research questions posed, the proposed fuzzy logic approach, and the results presented provide an important starting point for further research. Our approach can be extended to inference and prediction using artificial neural networks, as well as to studying the unevenness (degree of rate of change) of individual test results using multifractal analysis.
Artificial intelligence-based frameworks are increasingly used in computer-aided diagnosis (CADx) and computer-aided detection (CADe) systems. The hierarchical structure of the fuzzy system allows for a more flexible combination of multiple data sources, which makes the tool presented developable and more useful in the future, when extending the research presented here. Extensions include analyzing trends and predicting values in the medium and long term, enabling the timely implementation of strategies to prevent detrimental changes and losses for companies, including in light of post-pandemic changes, which may exacerbate the group of phenomena described.
It has been possible to create a single tool that aggregates the results obtained from multiple tests. This enables more aspects of the phenomenon to be covered, including complex ones such as burnout, so that the resulting assessment will be even more accurate and complete. This also emphasizes the possible impact of our approach. One of the goals of the research presented in this paper was to preserve the experience of psychologists in the final model; therefore, the structure of the fuzzy system proposed in the paper is based on linguistic models, whose structure comes directly from the interpretation of certain (used) psychological questionnaires. Thus, also, we do not search the fuzzy system’s structural composition by adaptation from data. Additionally, there are too few data for a model created by adaptive methods to be reliable.
As the practical application of the proposed model is the assessment of changes in PLUS, an interesting area of future research is the possibility of using the potential of OFN [8,48,49,50]. This allows for the modeling and processing of information about the dynamics of changes while maintaining the intuitiveness of fuzzy models. Moreover, because the model proposed here operates on fuzzy values [51,52,53,54], it is quite simple to generate results that can be further analyzed and processed as OFN. A key direction for further research is also to increase the number of measurement points over time (more than two), so that a trend can be identified and a development scan be predicted while the influence of the environment remains unchanged. This applies both to healthy people (as part of preventive medicine) and to people with various diagnosed conditions [55,56,57]. The development of both of the above-mentioned groups of applications requires research both on larger groups of patients (within the framework of big data) and on small datasets (within the framework of so-called precision medicine) [58,59,60,61].
Finally, the intuitiveness and modularity of the presented algorithm gives important advantages in the development and use of the PLUS parameter concept. This is in terms of the flexibility of the model, as it is easy to adapt to a different set of base coefficients. With the availability of other survey data covering the same module, we can easily include them in the algorithm, without significantly changing the basic measurement structure. For example, if we wish to replace the data from PSS10 with another parameter assessing the general mental state of a patient, we can easily replace this element in the model while retaining the rest. Of course, the comparability of the results based on various sources requires further research. However, when normalized at the lowest level of the hierarchical structure (as in Model 2), the rest of the processing is similar, regardless of the data source.

5. Conclusions

By building systems for the artificially intelligent analysis of biomedical research results, we seek to discover both new tools and new knowledge/mechanisms that are difficult to extract by other methods.
The new fuzzy models (PLUS) presented in this paper represent a promising new tool to support clinicians in the area of the computational analysis of life satisfaction, including job stress and burnout, useful for screening. New computational tools to support diagnosticians can speed up the arrival of help and increase effectiveness in prevention, as well as enabling early prediction of the development of already detected conditions and diseases. Such solutions may help to identify new markers, more sensitive than the ones used so far, allowing the earlier detection of the initial stages of the aforementioned conditions, in order to refer patients for further, more advanced diagnosis and, if necessary, specialized therapy. The readability and flexibility of the linguistic rules in the models makes it easier to take into account the individual characteristics of the study population when implementing the model and facilitates more advanced analyses.
In the medical context, the main benefit of the results presented in this work, including PLUS, is the definition of an evaluation model that transforms test results into a universal percentage scale, while preserving the properties of the guidelines underlying the group of tests used for the study.

Author Contributions

Conceptualization, D.M. and P.P.; methodology, D.M. and P.P.; software, D.M. and P.P.; validation, D.M. and P.P.; formal analysis, D.M. and P.P.; investigation, D.M. and P.P.; resources, D.M. and P.P.; data curation, D.M. and P.P.; writing—original draft preparation, D.M. and P.P.; writing—review and editing, D.M. and P.P.; visualization, D.M. and P.P.; supervision, D.M. and P.P.; project administration, D.M. and P.P.; funding acquisition, D.M. and P.P. All authors have read and agreed to the published version of the manuscript.

Funding

This work was supported in part by the grant to maintain research potential of Kazimierz Wielki University.

Institutional Review Board Statement

Not applicable.

Informed Consent Statement

Not applicable.

Data Availability Statement

Not applicable.

Conflicts of Interest

The authors declare no conflict of interest.

Abbreviations

AIartificial intelligence
CADxcomputer-aided diagnosis
CADecomputer-aided detection
CIcomputational intelligence
COGcenter of gravity
COVID-19corona virus disease 2019
GDPgross domestic product
HRQoLHealth-Related Quality of Life
NMQNordic Musculoskeletal Questionnaire
MBIMaslach Burnout Inventory
OFNOrdered Fuzzy Numbers
PLUSpersonal life usual satisfaction
PSS10Perceived Stress Score
Q1lower quartile
Q3upper quartile
QoLQuality of Life
SDstandard deviation
SWLSSatisfaction with Life Scale
TOPSISThe Technique for Order of Preference by Similarity to Ideal Solution

References

  1. Proto, E.; Rustichini, A. A Reassessment of the Relationship between GDP and Life Satisfaction. PLoS ONE 2013, 8, e79358. [Google Scholar] [CrossRef] [Green Version]
  2. Easterlin, R.A.; Angelescu, L. Happiness and growth the world over: Time series evidence on the happiness-income paradox. IZA Discuss. Papers 2009, 4060, 31. [Google Scholar] [CrossRef]
  3. Zhou, M.; Lin, W. Adaptability and Life Satisfaction: The Moderating Role of Social Support. Front. Psychol. 2016, 7, 1134. [Google Scholar] [CrossRef] [Green Version]
  4. Ruggeri, K.; Garcia-Garzon, E.; Maguire, Á.; Matz, S.; Huppert, F.A. Well-being is more than happiness and life satisfaction: A multidimensional analysis of 21 countries. Health Qual. Life Outcomes 2020, 18, 192. [Google Scholar] [CrossRef]
  5. Krys, K.; Park, J.; Kocimska-Zych, A.; Kosiarczyk, A.; Selim, H.A.; Wojtczuk-Turek, A.; Haas, B.W.; Uchida, Y.; Torres, C.; Capaldi, C.A.; et al. Personal Life Satisfaction as a Measure of Societal Happiness is an Individualistic Presumption: Evidence from Fifty Countries. J. Happiness Stud. 2021, 22, 2197–2214. [Google Scholar] [CrossRef]
  6. Zadeh, L. Fuzzy sets. Inf. Control 1965, 8, 338–353. [Google Scholar] [CrossRef] [Green Version]
  7. Zadeh, L. From computing with numbers to computing with words—from manipulation of measurements to manipulation of perceptions. Int. J. Appl. Math. Comput. Sci. 2002, 12, 307–324. [Google Scholar]
  8. Prokopowicz, P. The use of Ordered Fuzzy Numbers for modeling changes in dynamic processes. Inf. Sci. 2019, 470, 1–14. [Google Scholar] [CrossRef]
  9. Prokopowicz, P.; Mikołajewski, D.; Tyburek, K.; Mikołajewska, E. Computational gait analysis for post-stroke rehabilitation purposes using fuzzy numbers, fractal dimension and neural networks. Bull. Pol. Acad. Sci. Tech. Sci. 2020, 68, 191–198. [Google Scholar]
  10. Mikołajewska, E.; Prokopowicz, P.; Mikołajewski, D. Computational gait analysis using fuzzy logic for everyday clinical purposes—preliminary findings. Bio-Algorithms Med.-Syst. 2017, 13, 37–42. [Google Scholar] [CrossRef]
  11. Prokopowicz, P.; Mikołajewski, D. Fuzzy Approach to Computational Classification of Burnout—Preliminary Findings. Appl. Sci. 2022, 12, 3767. [Google Scholar] [CrossRef]
  12. Prokopowicz, P.; Mikołajewski, D.; Tyburek, K.; Mikołajewska, E.; Kotlarz, P. AI-Based Analysis of SelectedGaitParameters in Post-strokePatients. In Image Processing and Communications: Techniques, Algorithms and Applications, Advances in Intelligent Systems and Computing Book Series; Choraś, M., Ryszard, S.C., Eds.; Springer: Cham, Switzerland, 2020; Volume 1062, pp. 197–205. [Google Scholar] [CrossRef]
  13. Prokopowicz, P.; Mikołajewski, D.; Mikołajewska, E.; Kotlarz, P. Fuzzy System as an Assessment Tool for Analysis of the Health-Related Quality of Life for the People After Stroke. In Lecture Notes in Artificial Intelligence Book Series, Proceedings of the Artificial Intelligence and Soft Computing: 16th International Conference, ICAISC 2017, Zakopane, Poland, 11–15 June 2017; Rutkowski, L., Korytkowski, M., Scherer, R., Tadeusiewicz, R., Zadeh, L.A., Zurada, J.M., Eds.; Springer: Cham, Switzerland, 2017; pp. 710–721. [Google Scholar] [CrossRef]
  14. Cohen, S.; Kamarck, T.; Mermelstein, R. A global measure of perceived stress. J. Health Soc. Behav. 1983, 24, 385–396. [Google Scholar] [CrossRef]
  15. Maslach, C.; Jackson, S.E. The Measurement of Experienced Burnout. J. Organ. Behav. 1981, 2, 99–113. [Google Scholar] [CrossRef]
  16. Crawford, J.O. The Nordic Musculoskeletal Questionnaire. Occup. Med. 2007, 57, 300–301. [Google Scholar] [CrossRef] [Green Version]
  17. Baik, S.H.; Fox, R.S.; Mills, S.D.; Roesch, S.C.; Sadler, G.R.; Klonoff, E.A.; Malcarne, V.L. Reliability and validity of the Perceived Stress Scale-10 in Hispanic Americans with English or Spanish language preference. J. Health Psychol. 2019, 24, 628–639. [Google Scholar] [CrossRef]
  18. Wickramasinghe, N.D.; Dissanayake, D.S.; Abeywardena, G.S. Validity and reliability of the Maslach Burnout Inventory-Student Survey in Sri Lanka. BMC Psychol. 2018, 6, 52. [Google Scholar] [CrossRef]
  19. Descatha, A.; Roquelaure, Y.; Chastang, J.F.; Evanoff, B.; Melchior, M.; Mariot, C.; Ha, C.; Imbernon, E.; Goldberg, M.; Leclerc, A. Validity of Nordic-style questionnaires in the surveillance of upper-limb work-related musculoskeletal disorders. Scand. J. Work Environ. Health 2007, 33, 58–65. [Google Scholar] [CrossRef] [Green Version]
  20. García, G.M.; Calvo, J.C.A. The threat of COVID-19 and its influence on nursing staff burnout. J. Adv. Nurs. 2021, 77, 832–844. [Google Scholar] [CrossRef]
  21. Ruiz-Fernández, M.D.; Ramos-Pichardo, J.D.; Ibáñez-Masero, O.; Cabrera-Troya, J.; Carmona-Rega, M.I.; Ortega-Galán, Á.M. Compassion fatigue, burnout, compassion satisfaction and perceived stress in healthcare professionals during the COVID-19 health crisis in Spain. J. Clin. Nurs. 2020, 29, 4321–4330. [Google Scholar] [CrossRef]
  22. Galanis, P.; Vraka, I.; Fragkou, D.; Bilali, A.; Kaitelidou, D. Nurses’ burnout and associated risk factors during the COVID-19 pandemic: A systematic review and meta-analysis. J. Adv. Nurs. 2021, 77, 3286–3302. [Google Scholar] [CrossRef]
  23. Jácome, C.; Seixas, A.; Serrão, C.; Teixeira, A.; Castro, L.; Duarte, I. Burnout in Portuguese physiotherapists during COVID-19 pandemic. Physiother. Res. Int. 2021, 26, e1915. [Google Scholar] [CrossRef]
  24. De Sire, A.; Marotta, N.; Raimo, S.; Lippi, L.; Inzitari, M.T.; Tasselli, A.; Gimigliano, A.; Palermo, L.; Invernizzi, M.; Ammendolia, A. Psychological distress and work environment perception by physical therapists from southern Italy during COVID-19 pandemic: The CALABRIA study. Int. J. Environ. Res. Public Health 2021, 18, 9676. [Google Scholar] [CrossRef]
  25. Munn, L.T.; Liu, T.L.; Swick, M.; Rose, R.; Broyhill, B.; New, L.; Gibbs, M. Original Research: Well-Being and Resilience Among Health Care Workers During the COVID-19 Pandemic: A Cross-Sectional Study. Am. J. Nurs. 2021, 121, 24–34. [Google Scholar] [CrossRef]
  26. Mikołajewska, E. Work-related musculoskeletal injuries in physiotherapists. Med. Pr. 2013, 64, 681–687. [Google Scholar] [CrossRef] [Green Version]
  27. Mikołajewska, E. Strategies of prevention of the work-related injuries in physiotherapists. Med. Pr. 2016, 67, 673–679. (In Polish) [Google Scholar] [CrossRef] [Green Version]
  28. Merlo, G.; Rippe, J. Physician Burnout: A Lifestyle Medicine Perspective. Am. J. Lifestyle Med. 2020, 15, 148–157. [Google Scholar] [CrossRef]
  29. Thukral, S.; Rana, V. Versatility of fuzzy logic in chronic diseases: A review. Med. Hypotheses 2019, 122, 150–156. [Google Scholar] [CrossRef]
  30. Azar, A.T.; Hassanien, A.E. Scientific Research Group in Egypt (SRGE). Editorial on: Fuzzy Logic in Biomedicine. Comput Biol. Med. 2015, 64, 321–322. [Google Scholar] [CrossRef]
  31. Barbounaki, S.; Vivilaki, V.G. A fuzzy intelligent system to assess midwives’ burnout conditions. Eur. J. Midwifery 2021, 6, 7. [Google Scholar] [CrossRef]
  32. Kosiński, W.; Prokopowicz, P.; Rosa, A. Defuzzification Functionals of Ordered Fuzzy Numbers. IEEE Trans. Fuzzy Syst. 2013, 21, 1163–1169. [Google Scholar] [CrossRef]
  33. Ahmadi, H.; Gholamzadeh, M.; Shahmoradi, L.; Nilashi, M.; Rashvand, P. Diseases diagnosis using fuzzy logic methods: A systematic and meta-analysis review. Comput. Methods Programs Biomed. 2018, 161, 145–172. [Google Scholar] [CrossRef] [PubMed]
  34. Hernández-Julio, Y.F.; Prieto-Guevara, M.J.; Nieto-Bernal, W.; Meriño-Fuentes, I.; Guerrero-Avendaño, A. Framework for the Development of Data-Driven Mamdani-Type Fuzzy Clinical Decision Support Systems. Diagnostics 2019, 2, 52. [Google Scholar] [CrossRef] [PubMed] [Green Version]
  35. Farzandipour, M.; Nabovati, E.; Saeedi, S.; Fakharian, E. Fuzzy decision support systems to diagnose musculoskeletal disorders: A systematic literature review. Comput. Methods Programs Biomed. 2018, 163, 101–109. [Google Scholar] [CrossRef] [PubMed]
  36. Rojek, I.; Mikołajewski, D.; Dostatni, E. Digital twins in product lifecycle for sustainability in manufacturing and maintenance. Appl. Sci. 2021, 11, 31. [Google Scholar] [CrossRef]
  37. Rojek, I.; Mikołajewski, D.; Dostatni, E.; Macko, M. AI-optimized technological aspects of the material used in 3D printing processes for selected medical applications. Materials 2020, 13, 5437. [Google Scholar] [CrossRef]
  38. Dubois, D.; Prade, H. Fuzzy Sets and Systems Theory and Applications; Academic Press: Boston, MA, USA, 1980. [Google Scholar]
  39. Clemente-Suárez, V.J.; Navarro-Jiménez, E.; Ruisoto, P.; Dalamitros, A.A.; Beltran-Velasco, A.I.; Hormeño-Holgado, A.; Laborde-Cárdenas, C.C.; Tornero-Aguilera, J.F. Performance of Fuzzy Multi-Criteria Decision Analysis of Emergency System in COVID-19 Pandemic. An Extensive Narrative Review. Int. J. Environ. Res. Public Health 2021, 18, 5208. [Google Scholar] [CrossRef]
  40. Zaidan, A.A.; Zaidan, B.B.; Al-Haiqi, A.; Kiah, M.L.; Hussain, M.; Abdulnabi, M. Evaluation and selection of open-source EMR software packages based on integrated AHP and TOPSIS. J.Biomed. Inform. 2015, 53, 390–404. [Google Scholar] [CrossRef] [Green Version]
  41. Broekhuizen, H.; Groothuis-Oudshoorn, C.G.; van Til, J.A.; Hummel, J.M.; IJzerman, M.J. A review and classification of approaches for dealing with uncertainty in multi-criteria decision analysis for healthcare decisions. Pharmacoeconomics 2015, 33, 445–455. [Google Scholar] [CrossRef] [Green Version]
  42. Moreno-Calderón, A.; Tong, T.S.; Thokala, P. Multi-criteria Decision Analysis Software in Healthcare Priority Setting: A Systematic Review. Pharmacoeconomics 2020, 38, 269–283. [Google Scholar] [CrossRef]
  43. Maija, K.; Katri, K. The moral orders of work and health: A case of sick leave due to burnout. Sociol. Health Illn. 2019, 41, 219–233. [Google Scholar] [CrossRef]
  44. Grensman, A.; Acharya, B.D.; Wändell, P.; Nilsson, G.; Werner, S. Health-related quality of life in patients with Burnout on sick leave: Descriptive and comparative results from a clinical study. Int. Arch. Occup. Environ. Health 2016, 89, 319–329. [Google Scholar] [CrossRef] [PubMed]
  45. Mather, L.; Bergström, G.; Blom, V.; Svedberg, P. The covariation between burnout and sick leave due to mental disorders is explained by a shared genetic liability: A prospective swedish twin study with a five-year follow-up. Twin Res. Hum. Genet. 2014, 17, 535–544. [Google Scholar] [CrossRef] [PubMed] [Green Version]
  46. Kärkkäinen, R.; Saaranen, T.; Hiltunen, S.; Ryynänen, O.P.; Räsänen, K. Systematic review: Factors associated with return to work in burnout. Occup. Med. 2017, 67, 461–468. [Google Scholar] [CrossRef] [Green Version]
  47. Byeon, H. Influence of the COVID-19 Pandemic on the Subjective Life Satisfaction of SouthKoreanAdults: Bayesian Nomogram Approach. Diagnostics 2022, 12, 761. [Google Scholar] [CrossRef]
  48. Kosinski, W.; Prokopowicz, P. Fuzziness–Representation of Dynamic Changes. In New Dimensions In FuzzyLogic And Related Technologies, Vol I, Proceedings; Stepnicka, M., Novak, V., Bodenhofer, U., Eds.; EuropeanSocFuzzy Log &Technol: Barcellona, Spain, 2007; pp. 449–456. [Google Scholar]
  49. Prokopowicz, P.; Golsefid, S.M.M. Aggregation Operator for Ordered Fuzzy Numbers Concerning the Direction. In Artificial Intelligence and Soft Computing. ICAISC 2014. Lecture Notes in Computer Science; Rutkowski, L., Korytkowski, M., Scherer, R., Tadeusiewicz, R., Zadeh, L.A., Zurada, J.M., Eds.; Springer: Cham, Switzerland, 2014; Volume 8467. [Google Scholar] [CrossRef]
  50. Prokopowicz, P.; Czerniak, J.; Mikołajewski, D.; Apiecionek, Ł.; Slezak, D. Theory and Applications of Ordered Fuzzy Number: A Tribute to Professor Witold Kosiński. In Studies in Fuzziness and Soft Computing; Springer: Berlin/Heidelberg, Germany, 2017; Volume 356. [Google Scholar]
  51. Vilela, M.; Oluyemi, G.; Petrovski, A. A holistic approach to assessment of value of information (VOI) with fuzzy data and decisioncriteria. Decis. Appl. Manag. Eng. 2020, 3, 97–118. [Google Scholar] [CrossRef]
  52. Pamucar, D.; Bozanic, D.; Puska, A.; Marinkovic, D. Application of neuro-fuzzy system for predicting the success of a company in public procurement. Decis. Appl. Manag. Eng. 2022, 5, 135–153. [Google Scholar] [CrossRef]
  53. Precup, R.-E.; Preitl, S.; Petriu, E.; Bojan-Dragos, C.-A.; Szedlak-Stinean, A.-I.; Roman, R.-C.; Hedrea, E.-L. Model-BasedFuzzy Control Results for Networked Control Systems. Rep. Mech. Eng. 2020, 1, 10–25. [Google Scholar] [CrossRef]
  54. Bozanic, D.; Tesic, D.; Marinkovic, D.; Milic, A. Modeling of neuro-fuzzy system as a support in decision-making processes. Rep. Mech. Eng. 2021, 2, 222–234. [Google Scholar] [CrossRef]
  55. Li, M.; Xiao, P. Network Blockchain Security Sharing Model Based on Fuzzy Logic. Comput. Intell Neurosci. 2022, 2022, 1509000. [Google Scholar] [CrossRef]
  56. Khan, S.; Iqbal, W.; Waheed, A.; Mehmood, G.; Khan, S.; Zareei, M.; Biswal, R.R. An Efficient and Secure Revocation-Enabled Attribute-Based Access Control for eHealth in Smart Society. Sensors 2022, 22, 336. [Google Scholar] [CrossRef]
  57. Medici, V.; Czlonkowska, A.; Litwin, T.; Giulivi, C. Diagnosis of Wilson Disease and Its Phenotypes by Using Artificial Intelligence. Biomolecules 2021, 11, 1243. [Google Scholar] [CrossRef] [PubMed]
  58. Luvizutto, G.J.; Silva, G.F.; Nascimento, M.R.; Sousa Santos, K.C.; Appelt, P.A.; de Moura Neto, E.; de Souza, J.T.; Wincker, F.C.; Miranda, L.A.; Hamamoto Filho, P.T.; et al. Use of artificial intelligence as an instrument of evaluation after stroke: A scoping review based on international classification of functioning, disability and health concept. Top. Stroke Rehabil. 2022, 29, 331–346. [Google Scholar] [CrossRef] [PubMed]
  59. Fleck, D.E.; Ernest, N.; Asch, R.; Adler, C.M.; Cohen, K.; Yuan, W.; Kunkel, B.; Krikorian, R.; Wade, S.L.; Babcock, L. Predicting Post-Concussion Symptom Recovery in Adolescents Using a Novel Artificial Intelligence. J. Neurotrauma 2021, 38, 830–836. [Google Scholar] [CrossRef]
  60. Berman, A.L.; Silverman, M.M. A Call to Clarify Fuzzy Sets. Crisis 2021, 42, 1–4. [Google Scholar] [CrossRef] [PubMed]
  61. Ruotsalainen, P.; Blobel, B. Health Information Systems in the Digital Health Ecosystem-Problems and Solutions for Ethics, Trust and Privacy. Int. J. Environ. Res. Public Health 2020, 17, 3006. [Google Scholar] [CrossRef] [PubMed]
Figure 1. General structure of the proposed fuzzy system.
Applsci 12 07376 g001
Figure 2. Results of fuzzy Quality of Life assessment: Model 1, (a) group 1, (b) group 2.
Applsci 12 07376 g002
Figure 3. Results of fuzzy Quality of Life assessment: Model 2, (a) group 1, (b) group 2.
Applsci 12 07376 g003
Figure 4. Comparison of fuzzy Quality of Life between group 1 and group 2.
Applsci 12 07376 g004
Table 1. Clinical summary of the subjects.
Study Group
(n = 25, 100%)
Reference Group
(n = 25, 100%)
Age (years)
Mean26.9226.12
SD3.973.94
Min2222
Q12423
Median2525
Q32927
Max3435
Seniority (years)
Mean3.23.36
SD2.612.53
Min11
Q111.5
Median23
Q354
Max89
Gender:
Females (F)10 (40%)11 (44%)
Males (M)15 (60%)14 (56%)
Table 2. Multivariate assessment used in the study.
ScalePSS10MBISWLSNMQ
Direction of changethe higher the score, the higher the stressthe higher the score, the higher the stressthe higher the score, the higher quality of livingthe higher the score, the higher number of problems
Scoring1–4: low
7–10: high
three component scales: emotional exhaustion (9 items), depersonalization (5 items), and personal achievement (8 items), are measured separatelyrange of scores is 5–35, where 5–9 extremely dissatisfied with life, 20 neutral, 31–35 extremely satisfied with lifewhether someone has problems with their locomotion and how often
Table 3. General multivariate results in the study (only statistically significant changes included).
ScalePSS10MBISWLSNMQ
Direction of change in group 1
(physiotherapists)
after COVID-19
higher stresshigher stresslower quality of livinghigher number of problems
Direction of change in group 2
(informaticians)
after COVID-19
lower stresslower stresshigher quality of livingno change
Table 4. Results for the study group.
ScalePSS10MBISWLSNMQ
Mean29.1648.7616.60.72
SD2.4314.684.060.73
Min2532100
Q12838141
Median2846161
Q33152181
Max3479152
Distributiondata are not normally distributeddata are not normally distributeddata are not normally distributeddata are not normally distributed
Mean30.657.2414.960.73
SD2.1213.143.750.74
Min273980
Q129.544.5131
Median3055141
Q33272161
Max3579252
Distributiondata are not normally distributeddata are not normally distributeddata are not normally distributeddata are not normally distributed
Table 5. Results for the reference group.
ScalePSS10MBISWLSNMQ
Mean18.7617.254.160.44
SD3.382.7216.670.51
Min1014250
Q117.51544.50
Median1917530
Q32118691
Max2424771
Distributiondata are not normally distributeddata are not normally distributeddata are not normally distributeddata are not normally distributed
Mean16.2413.8863.60.48
SD2.852.3515.070.51
Min1010410
Q11512.5510
Median1614640
Q31815761
Max2120871
Distributiondata are not normally distributeddata are not normally distributeddata are not normally distributeddata are not normally distributed
Table 6. Correlations between test results.
Group 1 (Physical Therapists)—before COVID-19
ScalePSS10MBISWLSNMQ
PSS10-0.473
p = 0.016
n.s.n.s.
MBI0.473
p = 0.016
-n.s.0.440
p = 0.028
SWLSn.s.n.s.-n.s.
NMQn.s.0.440
p = 0.028
n.s.-
Group 1 (Physical Therapists)—after COVID-19
PSS10-0.430
p = 0.032
n.s.n.s.
MBI0.430
p = 0.032
-−0.483
p = 0.015
n.s.
SWLSn.s.−0.483
p = 0.015
-n.s.
NMQn.s.n.s.n.s.-
Group 2 (Informaticians)—before COVID-19
PSS10-n.s.n.s.n.s.
MBIn.s.-n.s.n.s.
SWLSn.s.n.s.-0.805
p = 0.000
NMQn.s.n.s.0.805
p = 0.000
-
Group 2 (Informaticians)—after COVID-19
PSS10-n.s.n.s.n.s.
MBIn.s.-n.s.n.s.
SWLSn.s.n.s.-0.528
p = 0.007
NMQn.s.n.s.0.528
p = 0.007
-
n.s. = not significant.
Table 7. Fuzzy models: Model 1, groups 1 and 2.
No.Physical TherapistsInformaticians
Before COVID-19After COVID-19ChangeBefore COVID-19After COVID-19Change
10.6600.603−0.0580.5790.574−0.004
20.5110.498−0.0140.6740.587−0.087
30.5430.535−0.0080.6150.603−0.012
40.6160.594−0.0230.6500.638−0.012
50.6430.631−0.0120.5560.522−0.034
60.5110.502−0.0090.6910.547−0.144
70.5400.5430.0040.6000.574−0.026
80.6070.601−0.0050.6600.609−0.051
90.6510.593−0.0580.5540.540−0.014
100.5340.520−0.0140.6840.596−0.088
110.5560.518−0.0380.5780.509−0.069
120.5850.562−0.0230.6430.586−0.057
130.6070.600−0.0070.5670.531−0.036
140.5720.538−0.0350.5910.510−0.081
150.5600.557−0.0040.5830.557−0.026
160.5350.5640.0290.6450.622−0.023
170.6420.571−0.0710.5370.474−0.064
180.5160.5290.0130.6640.559−0.104
190.5570.5590.0020.5880.569−0.019
200.6060.549−0.0560.6000.526−0.074
210.5190.5540.0350.5820.529−0.053
220.5330.5330.0000.6080.591−0.017
230.4930.464−0.0300.5820.545−0.037
240.5680.520−0.0480.6210.6270.006
250.6110.607−0.0040.6080.6170.009
Min0.4930.464−0.0710.5370.474−0.144
Max0.6600.6310.0350.6910.6380.009
Mean0.5710.554−0.0170.6100.566−0.045
SD0.0490.0400.0270.0430.0420.037
Median0.5640.555−0.0130.6040.571−0.036
Q10.5340.529−0.0350.5820.531−0.069
Q30.6070.593−0.0040.6450.596−0.017
Table 8. Fuzzy models: Model 2, groups 1 and 2.
No.Physical TherapistsInformaticians
Before COVID-19After COVID-19ChangeBefore COVID-19After COVID-19Change
10.6560.599−0.0570.5740.570−0.004
20.4890.471−0.0180.6690.587−0.082
30.5370.507−0.0300.6110.595−0.016
40.6070.589−0.0180.6500.629−0.021
50.6390.631−0.0080.5520.513−0.039
60.4900.4900.0000.6820.544−0.138
70.5230.5280.0060.5960.570−0.026
80.5800.5800.0000.6600.609−0.051
90.6460.581−0.0650.5500.540−0.010
100.5250.501−0.0230.6700.591−0.079
110.5600.515−0.0440.5690.494−0.075
120.5760.553−0.0230.6430.586−0.057
130.6030.584−0.0190,5560.521−0.035
140.5580.507−0.0510.5910.506−0.085
150.5490.547−0.0020.5790.547−0.032
160.5310.5530.0220.6500.628−0.022
170.6280.544−0.0840.5260.464−0.062
180.5000.5170.0160.6590.555−0.104
190.5510.547−0.0040.5840.565−0.018
200.5970.512−0.0850.5960.515−0.081
210.5210.5460.0250.5780.524−0.054
220.5230.508−0.0160.6080.581−0.027
230.4860.448−0.0380.5780.535−0.043
240.5640.504−0.0600.6210.6280.006
250.5970.580−0.0170.6130.6170.004
Min0.4860.448−0.0850.5260.464−0.138
Max0.6560.6310.0250.6820.6290.006
Mean0.5610.538−0.0240.6070.561−0.046
SD0.0500.0430.0300.0440.0450.036
Median0.5590.545−0.0190.6020.568−0.041
Q10.5230.507−0.0440.5780.524−0.075
Q30.5970.580−0.0020.6500.591−0.021
Table 9. Verification of models: correlations between their results and change intest outcomes.
Group 1 (Physical Therapists)
ScaleModel 1Model 2
Change in PSS10−0.493
p = 0.012
−0.484
p = 0.014
Change in MBIn.s.−0.161
p = 0.044
Change in SWLS0.278
p = 0.001
0.369
p = 0.069
Change in NMQn.s.0.039
p = 0.049
Group 2 (Informaticians)
Change in PSS10n.s.0.157
p = 0.009
Change in MBIn.s.0.390
p = 0.009
Change in SWLS−0.322
p = 0.012
−0.283
p = 0.016
Change in NMQ−0.350
p = 0.046
−0.390
p = 0.044
n.s. = not significant.
Publisher’s Note: MDPI stays neutral with regard to jurisdictional claims in published maps and institutional affiliations.

