Article

Evaluation of Biobed Bio-Mixture from Olive Oil Mill Wastewater Treatment as a Soil Organic Amendment in a Circular Economy Context

by
Vasiliki Kinigopoulou
1,*,
Evangelos Hatzigiannakis
1,
Athanasios Guitonas
2,
Efstathios K. Oikonomou
2,
Stefanos Stefanou
3 and
Dionisios Gasparatos
4
1
Soil & Water Resources Institute, Hellenic Agricultural Organization “DEMETER”, Sindos, 574 00 Thessaloniki, Greece
2
Faculty of Rural and Surveying Engineering, Aristotle University of Thessaloniki, 541 24 Thessaloniki, Greece
3
Department of Agriculture, School of Geotechnical Sciences, International Hellenic University, Sindos, 574 00 Thessaloniki, Greece
4
Department of Natural Recourses Management and Agricultural Engineering, Agricultural University of Athens, 118 55 Athens, Greece
*
Author to whom correspondence should be addressed.
Appl. Sci. 2022, 12(14), 7347; https://doi.org/10.3390/app12147347
Submission received: 11 June 2022 / Revised: 9 July 2022 / Accepted: 19 July 2022 / Published: 21 July 2022
(This article belongs to the Special Issue Soil Fertility and Plant Nutrition for Sustainable Agriculture)

Abstract

:
This study, based on circular economy principles and sustainable development practices, aims to present the results of soil samples analysis after their mixture with a biobed bio-mixture of straw, soil and compost, used for two consecutive years as organic bio-filter of olive oil mill wastewater. So far, exhausted bio-mixtures used in biobeds to minimize pesticide point-source contamination turned out to contain residues of pesticides, and they are considered hazardous wastes; thus, they require special treatment before their disposal. Contrariwise, saturated bio-mixtures from bio-bed systems utilized for olive mill wastewater (OMWW) treatment not only do not require any special treatment before their final disposal but also can be exploited as a soil amendment. To this end, the effects of the used bio-mixture application in three different proportions as a soil amendment on the physical and chemical properties of medium-texture soil were investigated. The application of water simulating a typical irrigation period during a growing season took place. Upon completion of the water application, soil samples were collected from two different depths of the columns and analyzed, and leachates collected from the columns were also analyzed. Soil texture, organic matter, calcium carbonate, electrical conductivity (EC), pH, total nitrogen, nitrates, nitrites, ammonium, available phosphorus, exchangeable potassium, sodium, calcium and magnesium, exchangeable sodium percentage (ESP), cation exchange capacity (CEC), available iron, manganese, copper, zinc and boron were monitored in the soil samples as indexes of potential soil amendment, and EC, pH, nitrates, potassium, sodium, calcium, magnesium, sodium adsorption ratio (SAR), total hardness, iron, manganese, copper, zinc and boron were monitored in the leachates as indexes of potential groundwater contamination.The study demonstrated the effective use of saturated bio-mixture as an organic soil amendment, while the impact of selected amendments on groundwater was the minimum.

1. Introduction

One of the most intractable environmental issues in Greece, and also in the Mediterranean basin countries, is the treatment of olive mill wastes (OMW). Olive oil producers have to deal with serious disposal problems, especially when massive amounts of liquid and solid wastes are generated over a few months a year [1], since olive oil production is seasonal, so the treatment process should be flexible enough to operate in a non-continuous mode; otherwise, olive mill wastes should be stored. The problem is enhanced by the fact that this period of the year coincides with frequent and intense rainfalls [2]. Currently, OMW is improperly treated and being left out in outdoor storage/evaporation lagoons during periods of high precipitation, so they may reach water bodies and cause serious modifications to the underground water properties [3]. Specifically, olive oil mill wastewaters (OMWW) cannot be directly disposed into any natural recipient or domestic wastewater treatment plant due to their high pollution load (i.e., high values of biological oxygen demand, chemical oxygen demand, organic matter content, salinity, total phenols and low pH values); thus, they may affect the soil and underground water quality [4]. Additionally, the situation is distressed by the fact that no treatment plants are available at the mills due to cost restrictions.
Many researchers have investigated the critical handling of this so-called “burden” by various treatment techniques, including physicochemical, biological and advanced oxidation methods [5]. Numerous methods, individual or combined, such as filtration, ultrafiltration, oxidation, ozonation, coagulation, centrifugation, flocculation, incineration, reverse osmosis and photolysis have been carried out to treat OMWW. Most of these approaches are quite useful as pretreatment methods, since they are inefficient regarding pollutant removal, but they are costly and do not generate valuable sub-products [6]. The aim of these methods is water recovering from olive oil mill wastewaters, without taking into consideration the intriguing potential of this waste as a whole entity. In light of the above, several studies have been carried out working towards using OMWW as a renewable resource and aspiring to transform them from a pollutant to agricultural water resource or organic fertilizer [7].
Meanwhile, olive mill by-products and their compost with other plant materials have been widely used as soil amendments in agriculture, contributing significantly in circular and sustainable economy, as they lie in supporting agricultural recycling of the generated wastes [8,9]. Besides the reduction in the annual amount of olive mill point source pollution to surface water and underground aquifers, many researchers have proven that they can improve soil chemical and physical characteristics [8,10,11,12], increase the organic matter content in non-fertile soils [10,13] and amplify nutrient absorption [14]. In addition, their application to landfills has the positive effect of reducing organic loads, and their use in horticulture may reduce and replace peat.
This study aims to present the results of soil samples analysis after their mix with a biobed bio-mixture of straw, soil and compost, used for two consecutive years as the organic bio-filter of olive oil mill wastewater [15,16]. So far, exhausted bio-mixtures used in bio-beds to minimize pesticide point-source contamination turned out to contain residues of pesticides and they are considered hazardous wastes; thus, they require special treatment before their disposal [17]. Contrariwise, saturated bio-mixtures from biobed systems utilized for OMWW treatment not only do not require any special treatment before their final disposal, they can also be exploited as a soil amendment. To this end, the effects of the used bio-mixture application in different proportions as a soil amendment on the physical and chemical properties of a medium-texture cultivated soil were investigated. Irrigation applied during a growing season was also simulated. Upon completion of the irrigation simulation experiment, soil samples were collected from two different depths of the columns and analyzed, and leachates collected from the columns were analyzed as well.

2. Materials and Methods

2.1. Characteristics of the Soil, Used Bio-Mixture and Irrigation Water

A loamy soil was collected from the upper soil layer (0–20 cm) of a cultivated field next to the premises of Soil and Water Resources Institute (SWRI) of the Hellenic Agricultural Organization “DEMETER” in Sindos, Greece.
Bio-mixture prepared of straw, soil and compost (50:25:25 vol%), used for two consecutive years as organic bio-filter of olive oil mill wastewater as described in our previous work [16], was extracted from the biobed; it was then homogenized and finally spread out outside undercover for almost four weeks, in order to air dry naturally under sun exposure. Physicochemical characteristics of the bio-mixture are presented in Table 1. The chemical analysis of irrigation water is also presented in Table 2.

2.2. Experimental Setup

The experiment was performed in the premises of Soil and Water Resources Institute (SWRI) of the Hellenic Agricultural Organization “DEMETER”, in Sindos—Thessaloniki, Greece. The experiment took place between January and March of 2018 and lasted 10 weeks. The experimental procedure included the following intermediate steps:
Twelve prototype devices were constructed; the devices included a PVC cylinder column of 500 mm diameter (internal diameter 470 mm) and a total height of 50 cm, which subsequently would be filled with the soil and bio-mixture–soil mix in different proportions. Fine meshes were attached to the lower part of the cylinders in order to prevent sediment transport. The cylinders were based on protected metal pans, which were intended to collect leachates from the columns. The columns were roof-protected and not exposed to precipitation or any other external water source.
The next step included the sampling of reference agricultural loamy soil from the area of Sindos. The soil was not sieved to simulate realistic agronomic conditions as much as possible. However, any stones or large aggregates were removed. The lower 30 cm of the columns were filled with the control soil (76.5 kg), whilst the upper 20 cm were filled with the bio-mixture–soil mix in three different proportions, namely 0% (control, C), 1% (biomix 1%), 2% (biomix 2%) and 3% (biomix 3%) bio-mixture, respectively. Specifically, 46.46 kg of biomix 1% were added to the upper 20 cm of the column for the 1st proportion, 46.92 kg of biomix 2% were added for the 2nd proportion and 47.38 kg of biomix 3% were added for the 3rd proportion. There were 3 columns for the control and three of each treatment, also. The quantities used were such that they could be applied in a realistic agronomic application and were selected intentionally, as they correspond to applications of 27, 54 and 81 tons of bio-mixture per ha. After filling the columns, they remained intact for fifteen days to achieve equilibrium between the soil and the bio-mixture.
Regarding irrigation, a period of water application equal to 10 weeks was decided, performing two irrigations every week. Each irrigation dose included 4 L of tap water. The total volume of added water for the whole irrigation period was 80 L per column, which proportionally simulates 4600 mm or 4600 m3 ha−1, which is considered to be a common irrigation scheme for cultivations [18,19,20]. Soil moisture was measured and recorded, at a depth of 0–10 cm, with a Theta Kit, Delta-T Device, before the first application of the irrigation water each week. Leachates were scheduled to be collected in a weekly time span. Due to the limited infiltration capacity of the experimental soil, no leachate was collected from the columns filled with the control sample during the first week.
With respect to soil, samples were collected from two different depths (20 cm and 40 cm) after the experiment’s completion (10th week). Thus, the results reflect the cumulative effect of subsequent applications. The samples were air-dried, and the fraction of fine earth (<2 mm) was used for laboratory analyses.

2.3. Analytical Methods

The physicochemical parameters of the leachates were determined according to Standard Methods for the Examination of Water and Wastewater Handbook [21]. The parameters measured were: electrical conductivity (EC), pH, nitrates, K, Na, Ca, Mg, SAR, Total Hardness, Fe, Mn, Cu, Zn and B.
The chemical parameters of the samples (soil, bio-mixture and bio-mixture/soil) were determined according to Methods of Soil Analysis Handbook [22]. pH was measured by a JENWAY 3520 pH Meter in water-saturated soil paste for soil samples and in 1:2 (v/v) bio-mixture/water slurry for bio-mixture samples. Electrical conductivity was measured by a CRISON GLP 32 Conductimeter in water-saturated soil paste for soil samples and in 1:2 (v/v) bio-mixture/water slurry for bio-mixture samples. The Walkley–Black method was used for soil organic matter analysis [23], while Loss-On-Ignition Method was used for bio-mixture organic matter analysis [24]. CaCO3 was measured with Automatic Digital Soil Calcimeter Fogl. The extractable-available phosphorus and boron were determined colorimetrically using a Perkin Elmer Lambda 35 UV/VIS spectrophotometer. Exchangeable K and Na were determined after extraction with ammonium acetate by a Sherwood M410 Flame Photometer. Exchangeable Ca and Mg were determined after extraction with ammonium acetate with a Perkin Elmer AAnalyst 200 Atomic Absorption Spectrometer. Available Fe, Cu, Mn and Zn were measured after extraction with DTPA with a Perkin Elmer AAnalyst 200 Atomic Absorption Spectrometer. Total N was determined according to ISO 11261:1995 Soil quality—Determination of total nitrogen—Modified Kjeldahl Method [25]. NO3 measurement was performed after extraction with KCl and by passage through a column of copperized cadmium, based on Methods of Soil Analysis—Part 3—Chemical Methods, 1996, Chapter 38 Nitrogen—Inorganic Forms [26]. Soil texture analysis was performed according to Bouyoucos method [27]. Cation Exchange Capacity was determined according to Ammonium Acetate Method [28]. The exchangeable sodium percentage (ESP), which describes the level of adsorbed Na in soil, was calculated by the following equation: ESP = (exchangeable Na/Cation Exchange Capacity) × 100. Concerning physical properties, saturated water content, field capacity, permanent wilting point and bulk density were determined using a soil moisture pressure plate apparatus, according to the standard methods described in Soil Survey Laboratory Methods Manual, Version 4.0 [29].

2.4. Statistical Analysis

Statistical analysis was performed using the SPSS v.27 software. One-way ANOVA was performed to compare soil physicochemical parameters between the treatments. In this case, we were interested in testing the statistical hypothesis of the equality of a mean population set regarding the treatments as a factor. Significant differences between the means of measured parameters were tested at p < 0.05 using the Duncan test.

3. Results and Discussion

3.1. Bio-Mixture Effect on Soil Physical Properties

Soil supplementation with bio-mixture had non-negative effects on most of the physical characteristics of the soil in both depths (0–20 cm, 20–40 cm) (Table 3). More specifically, bio-mixture amendments substantially reduced the bulk density of the soil, as a result of the lower bulk density of the bio-mixture and the differences between the soil and the treatments being significant (p < 0.05), without existing differences between the bio-mixtures treatments. The reductions compared with the non-amended soil (C) at the first depth (0–20 cm) were 16%, 20% and 15% for 1% biomix, 2% biomix and 3% biomix, respectively. The reductions compared with the non-amended soil (C) at the second depth (20–40 cm) were 17%, 13% and 12% for 1% biomix, 2% biomix and 3% biomix, respectively (Table 3). Additionally, there was an expected increase of 13% in saturated water content of the amended soils in the first depth (0–20 cm), due to the larger porosity of the bio-mixture, and a slightly smaller increase of 10% in the second depth (20–40 cm), as soil samples did not contain bio-mixture. In both depths, the increase of saturated water content in bio-mixtures treatments in relation to control soil was also significant (p < 0.05). It was also observed that the available water content (difference between water content at field capacity and permanent wilting point) decreased at depth 0–20 cm from 8.8% to 8.1%, 5.9% and 5.8% for 1% biomix, 2% biomix and 3% biomix, respectively. A similar trend was pointed out at depth 20–40 cm, as a decline in the available water content was observed from 8.9% to 8.3%, 6.3% and 6.2% for 1% biomix, 2% biomix and 3% biomix, respectively. Significant differences (p < 0.05), wherever they exist, between the treatments for field capacity and permanent wilting point, are presented in Table 3. Results indicated that greater effects were found in the upper layer (0–20 cm depth), while at the 20–40 cm depth the same trend was observed, nominating that soil particles’ movement took place downwards.

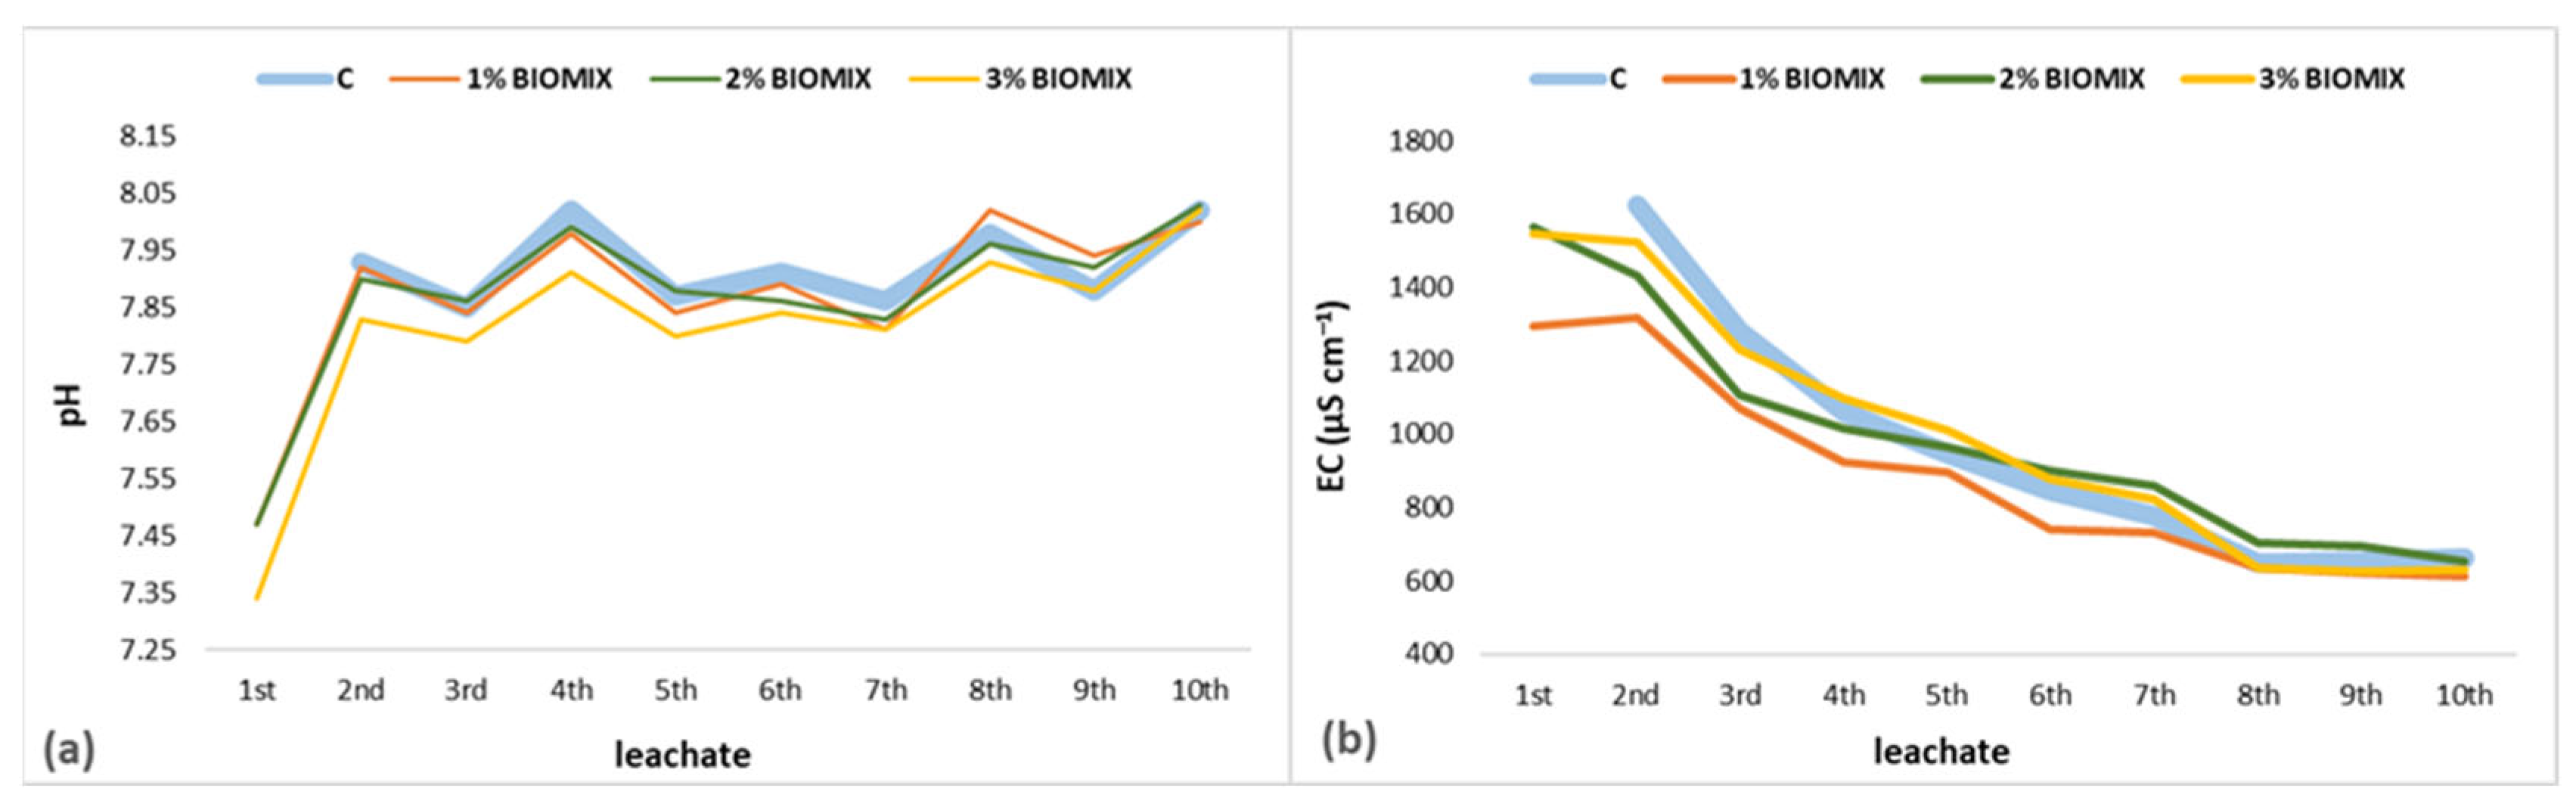
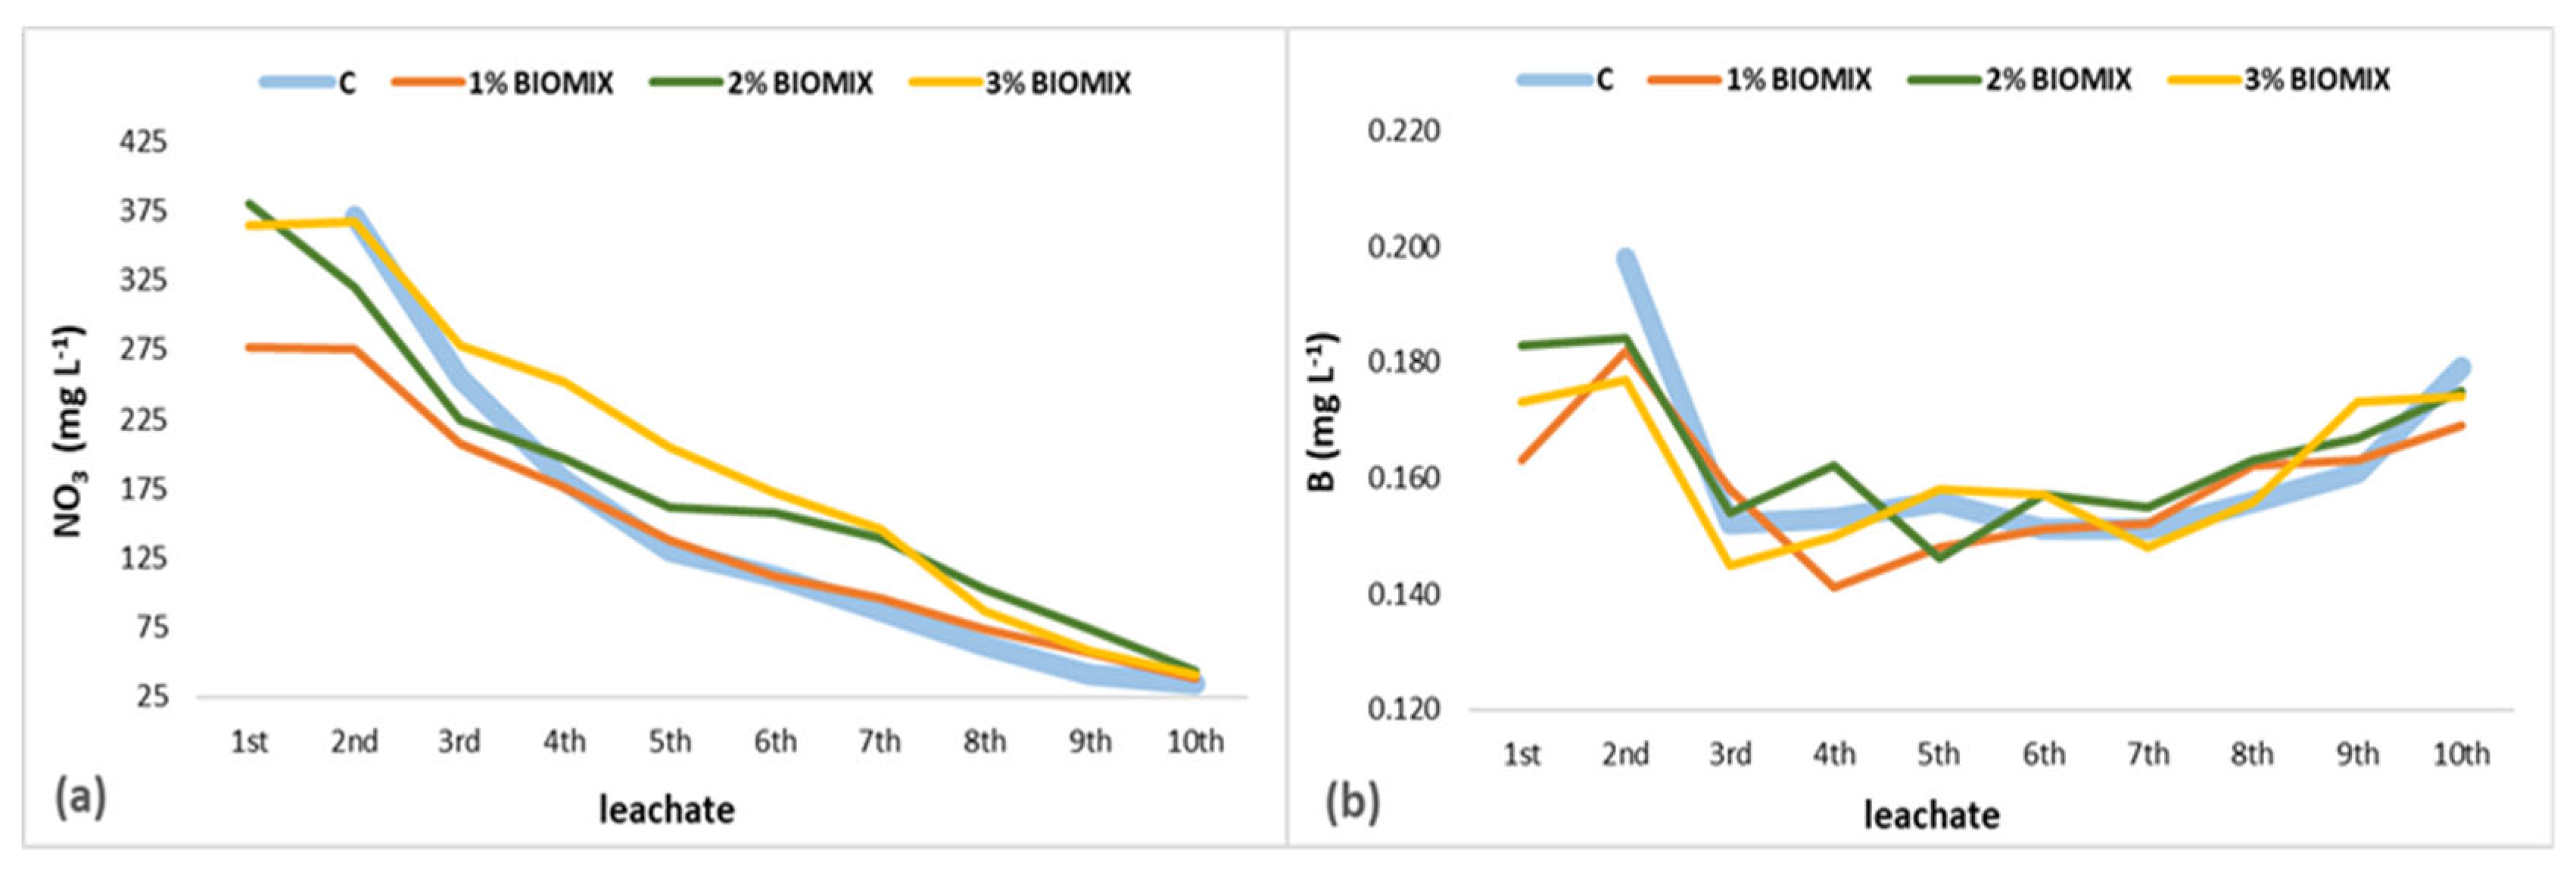
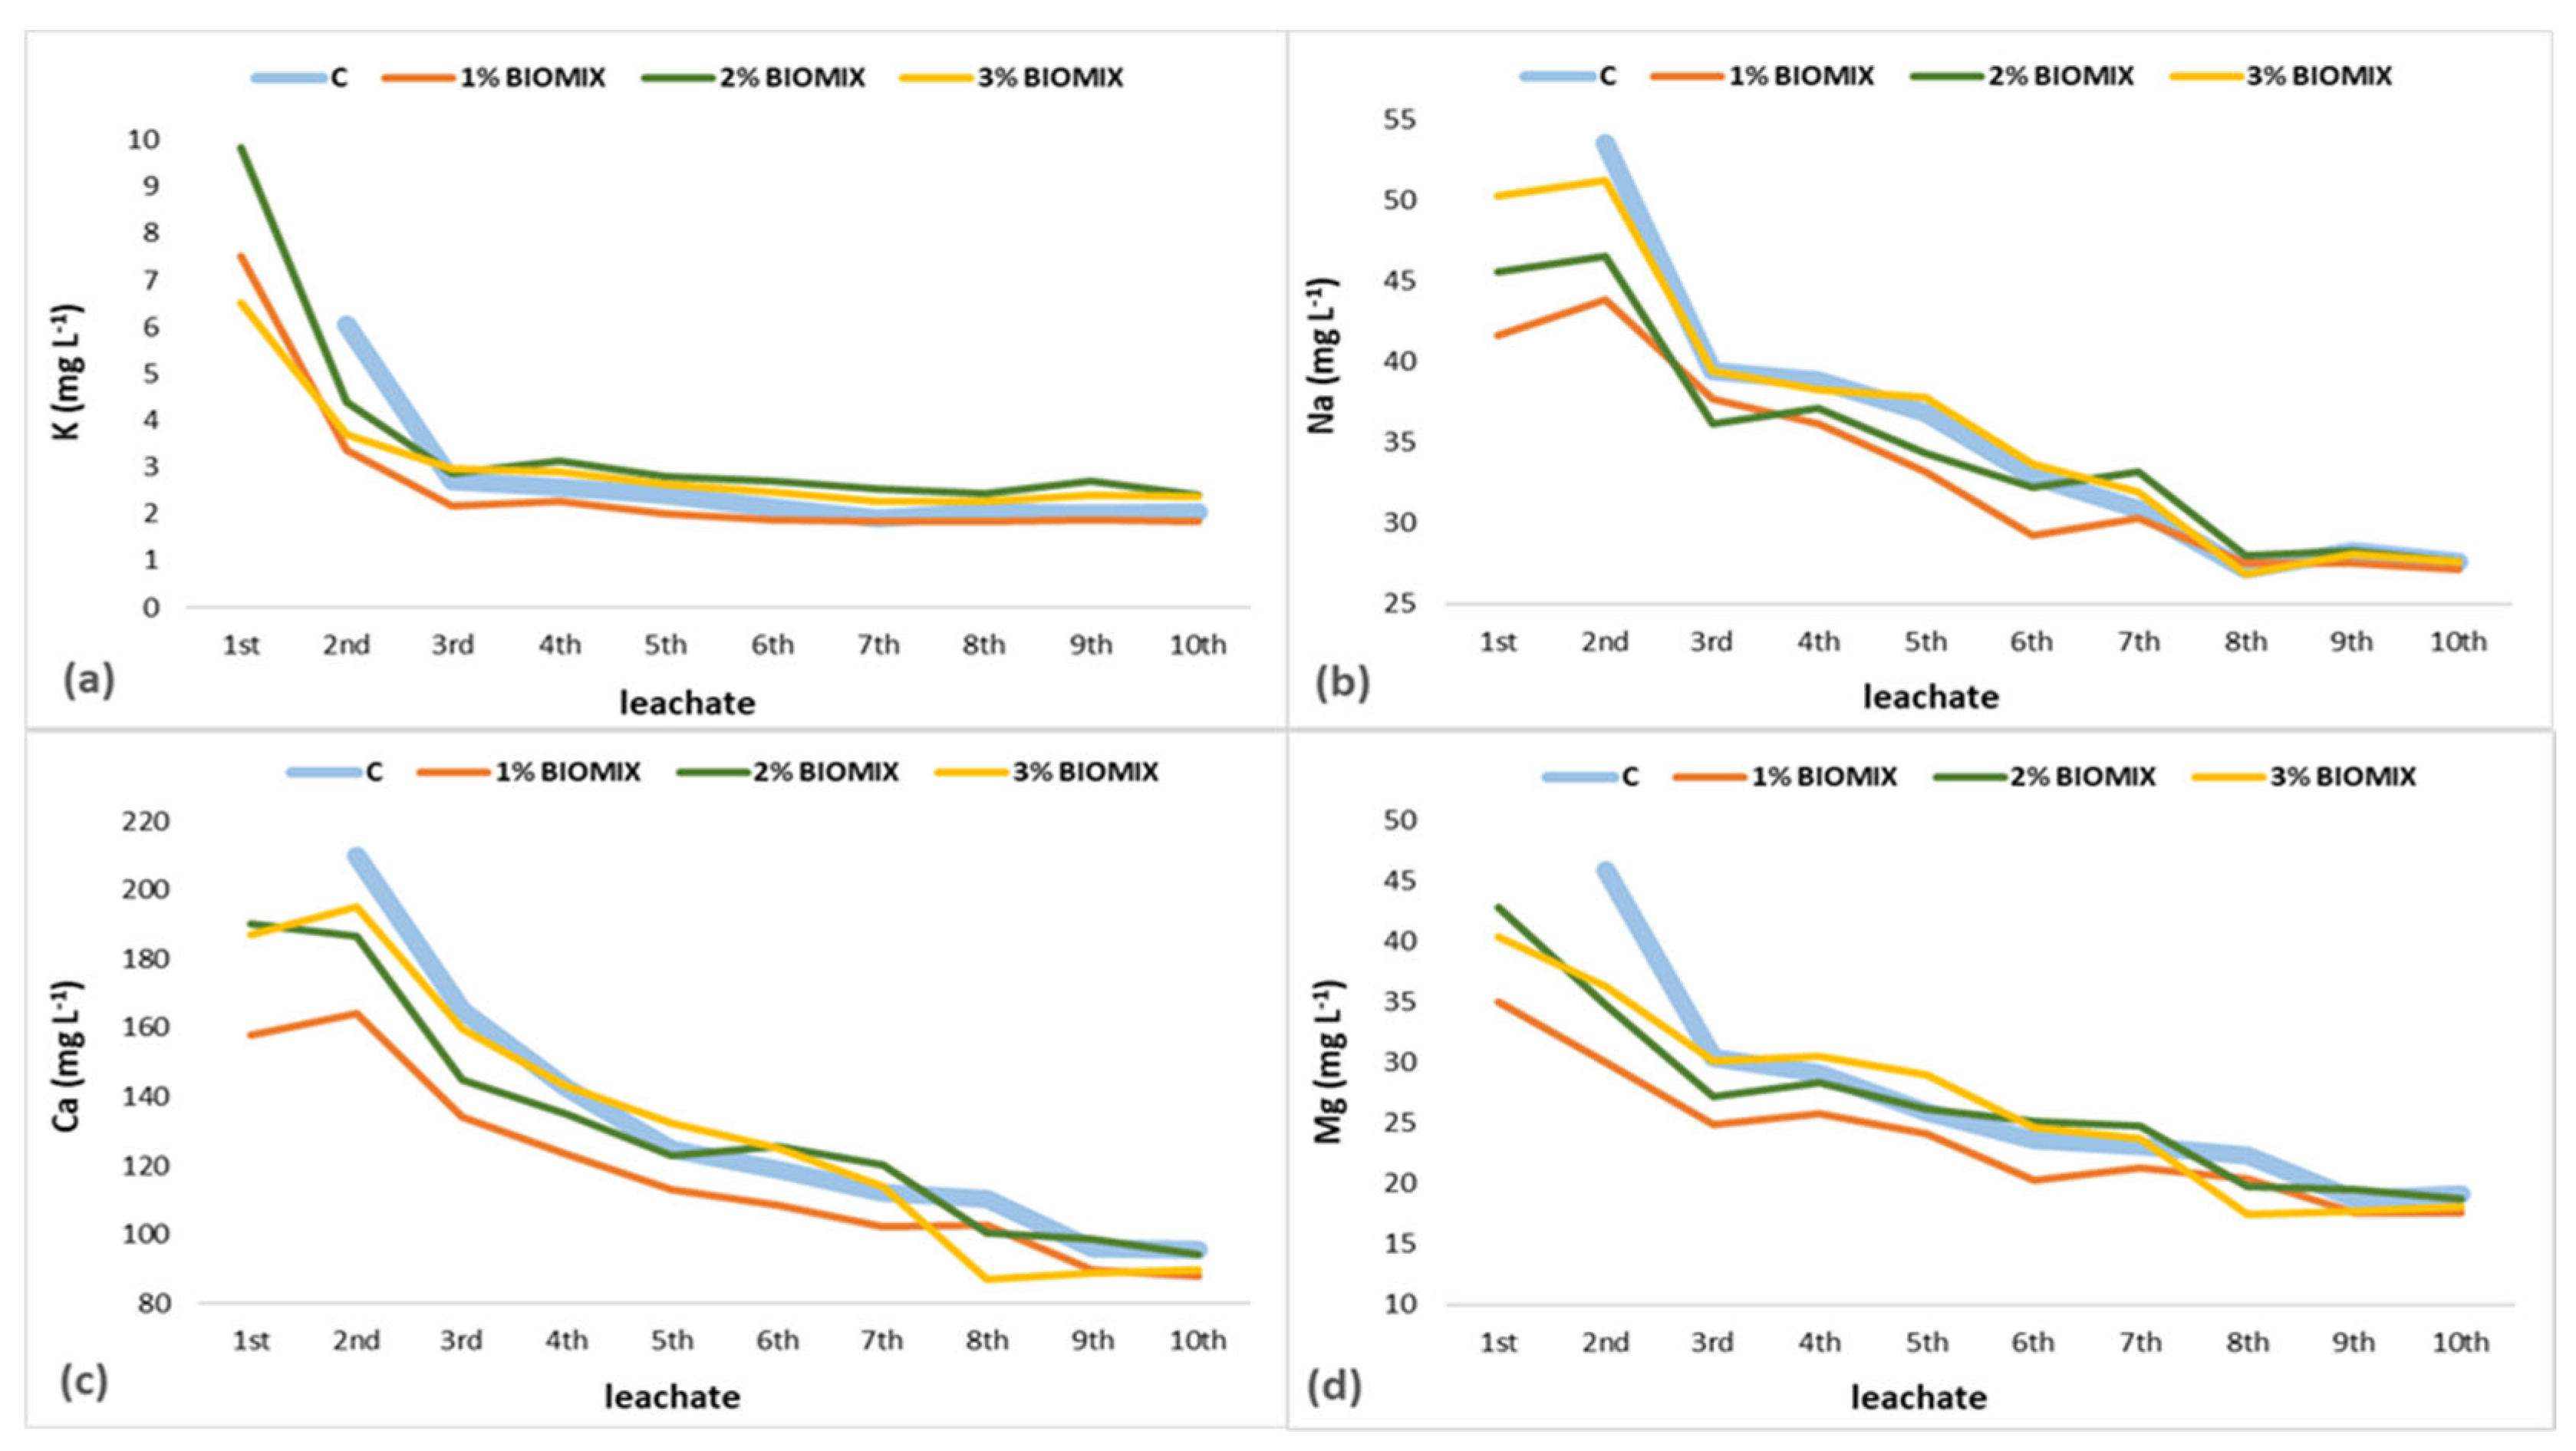
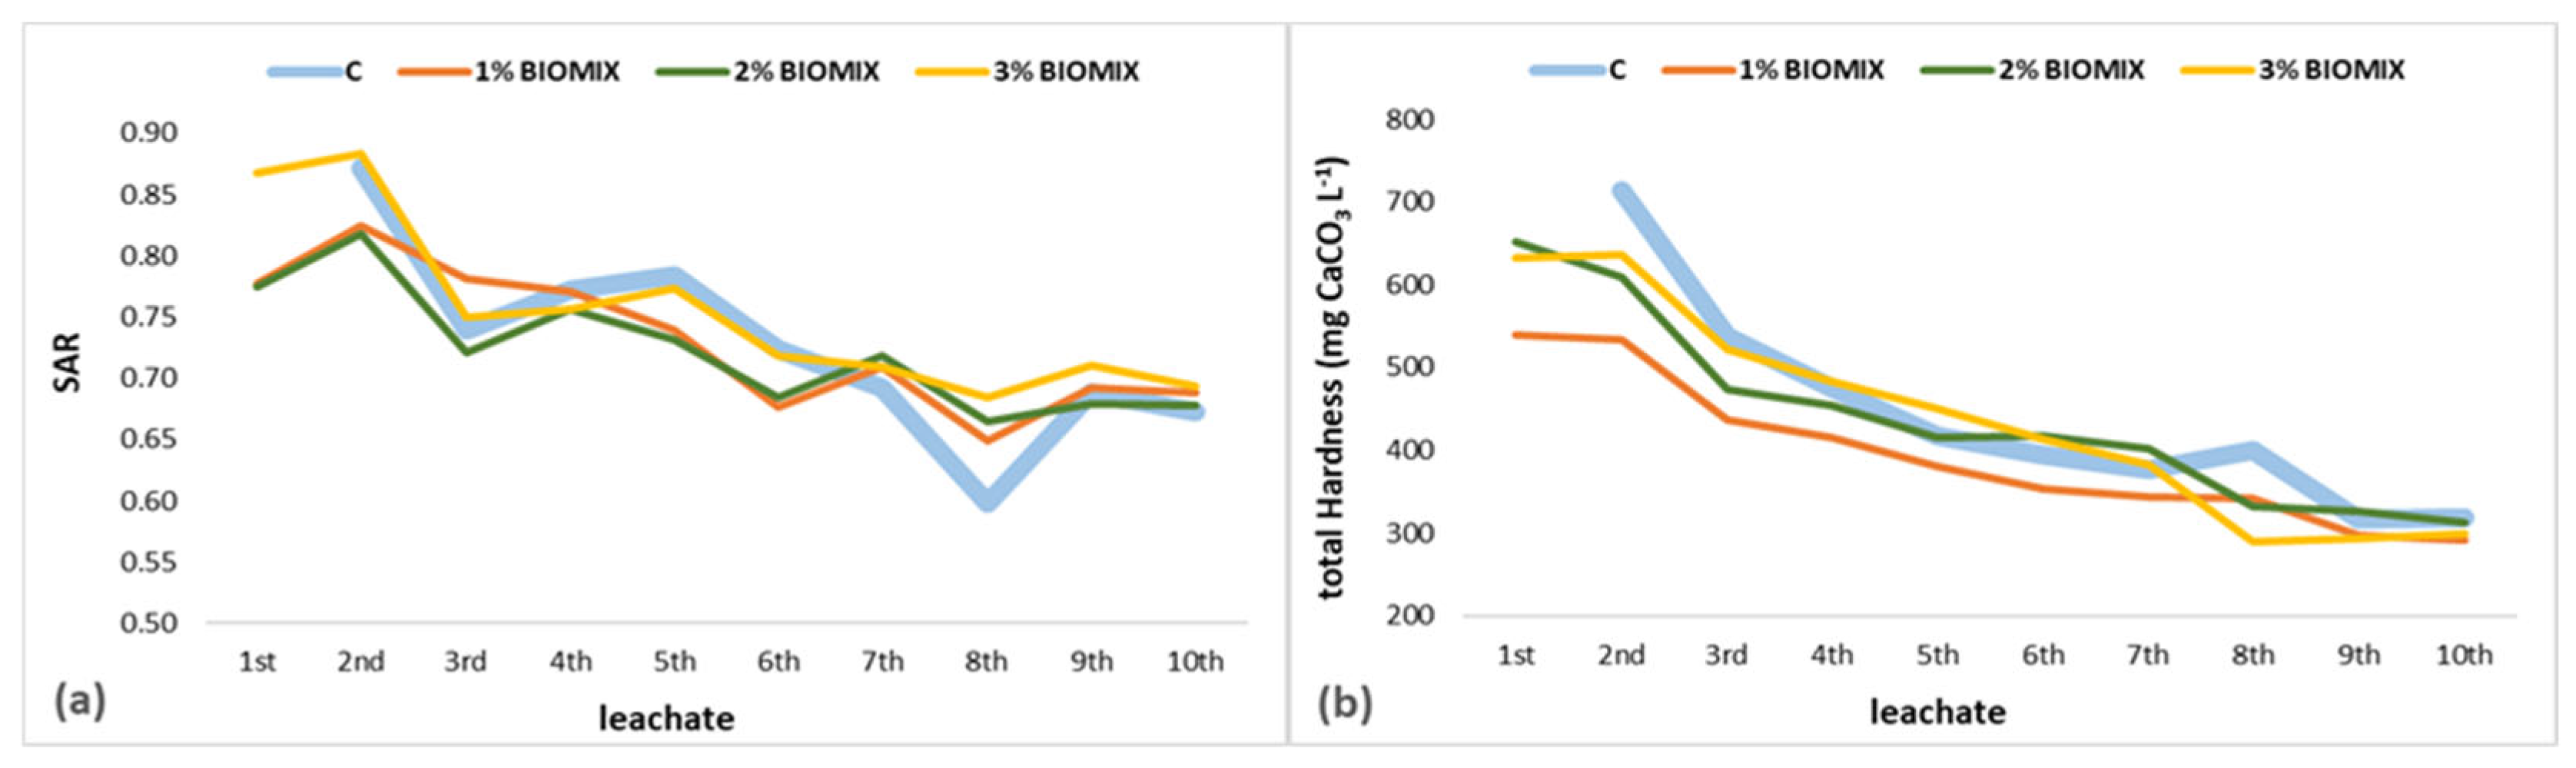
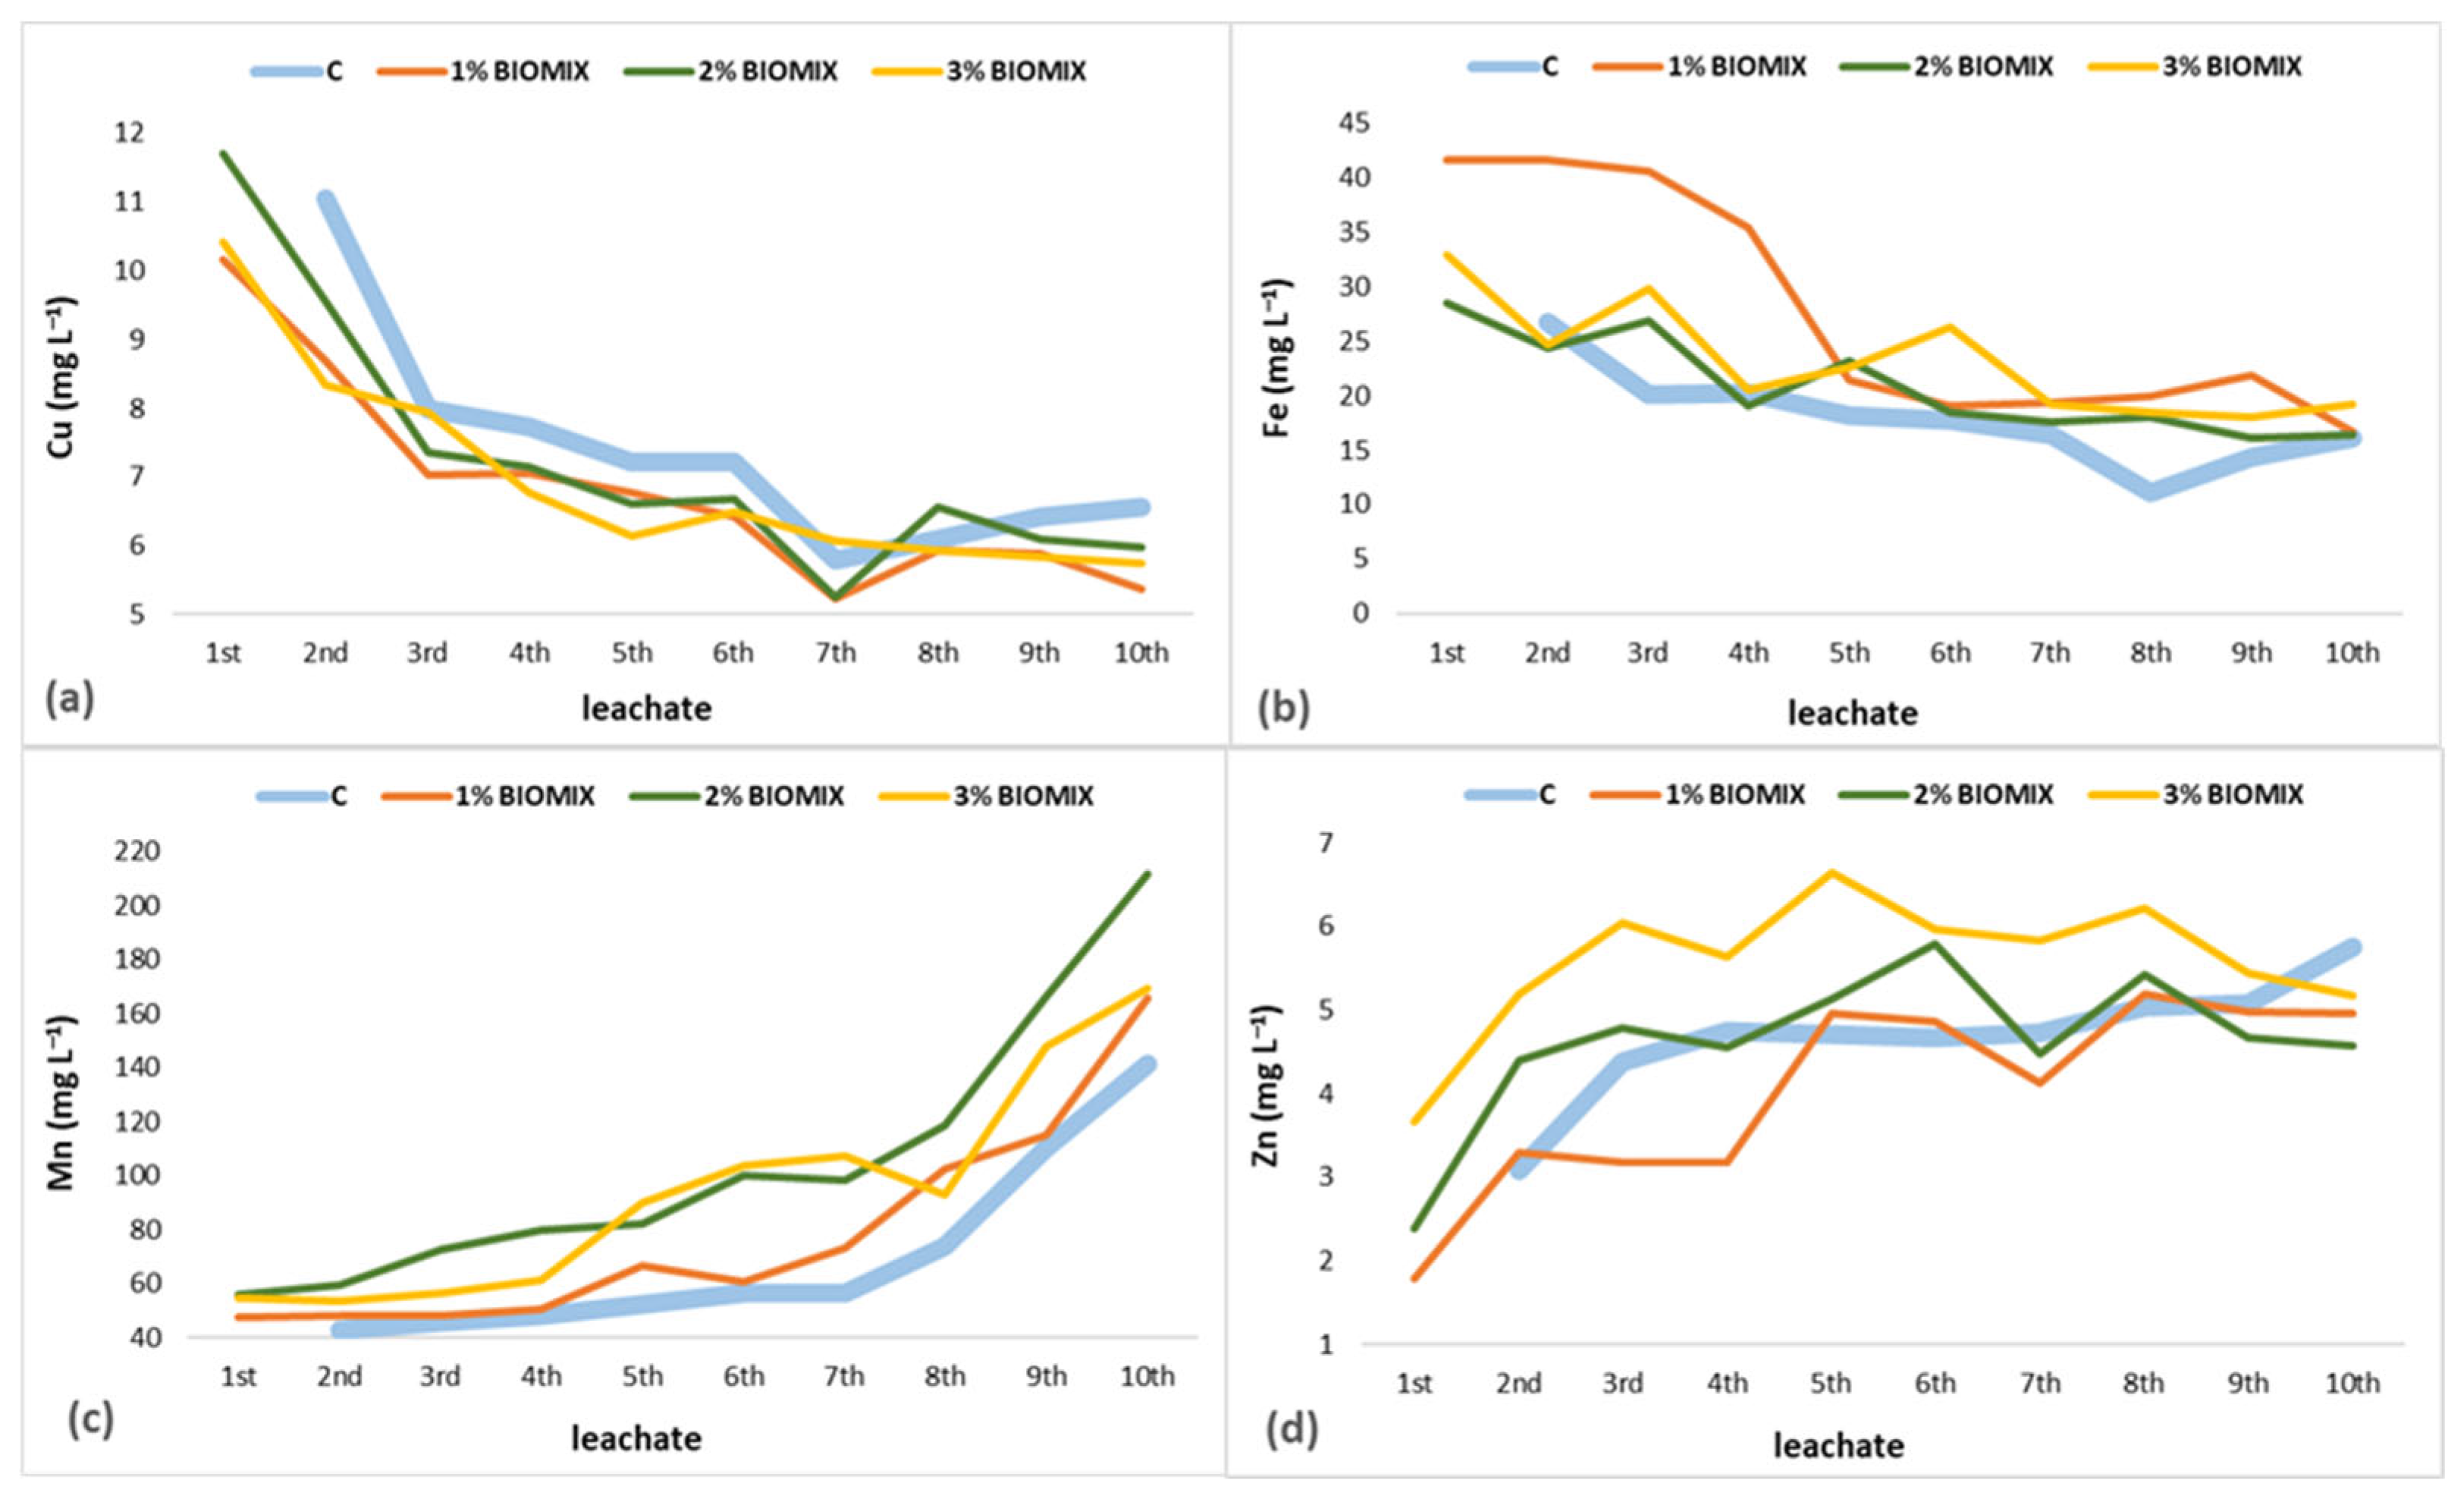
3.2. Bio-Mixture Effect on Leachates Chemical Characteristics

The results of the chemical analysis of the leachates from each bulk sample are presented in Figure 1, Figure 2, Figure 3, Figure 4 and Figure 5. Regarding pH values, a slight decrease due to ion exchange processes was observed in the leachates of the bio-mixtures after the first application of the irrigation water compared to control soil pH values, but these values increased during subsequent irrigations and stabilized around eight, which is the same value as the control soil (Figure 1a). Acidic values of pH may consist of a hazard both for soil and groundwater when leaching occurs [30], but during the experiment, the pH of the leachate was always between seven and eight for all treatments. The raise of pH is in agreement with soil capacity to exchange cations, ensuing in hydrogen ion subtraction from the liquid phase.
The electrical conductivity of all leachates decreased to 58% at the end of the experimentation. A decline in the EC values of all three bio-mixtures was observed during subsequent irrigations, in relation to the initial EC value of the control soil. Noteworthy is the fact that EC values of the first bio-mixture (biomix 1%) were slightly lower than those of the other two bio-mixtures. However, at the end of the irrigation applications they had about the same value (Figure 1b). The lessening tendency of electrical conductivity can be ascribed to the soil retention of the salts dissolved in the bio-mixture and especially since this was impregnated with olive mill wastewater (OMWW), in conjunction with the fact that dilution took place due to watering [30].
Concerning NO3 concentration, a decrease was noted in all leachates, possibly due to the mineralization of organic nitrogen and organic nitrogen degradation. It is observed that nitrate concentrations were higher in biomix 2% and biomix 3% compared to biomix 1%, ascribed to the fact that they consist of higher amounts of OMWW, in which nitrogen is mainly in the organic form and nitrate may accumulate in the soil after organic nitrogen mineralization by soil microorganisms [31]. At the end of the irrigation scheme, the NO3 concentration of bio-mixtures leachates was slightly elevated compared to the concentration of the leachate of the control soil, and more specifically, a higher concentration was observed in the second bio-mixture (biomix 2%) (Figure 2a).
As far as boron concentration, when bio-mixture was added to different percentages, boron values decreased in the leachates after the first irrigation, compared to control soil values, especially in the leachate of the third bio-mixture (biomix 3%). During subsequent irrigations there was a decrease in boron values, while at the end of irrigation, boron values of the second bio-mixture (biomix 2%) and the third bio-mixture (biomix 3%) were slightly higher than those of the first bio-mixture (biomix 1%) (Figure 2b).
Regarding potassium concentrations, its values in the leachates gradually decreased during irrigation. Although in the beginning, potassium values were higher in the leachates of the three bio-mixtures after the first irrigation in relation to the control soil, at the end of the irrigation period, concentrations were at the same levels, with slightly increased values in the leachates of the second bio-mixture (biomix 2%) and the third bio-mixture (biomix 3%) (Figure 3a). The average potassium concentration eventually reaching the water table was always negligible regardless of the soil treatments.
Likewise, sodium concentration followed a similar trend, since a decrease was noticed in all leachates of all three bio-mixtures, whilst when irrigation was completed, sodium concentrations in the leachates of the bio-mixtures and control soil were at the same levels (Figure 3b).
Calcium and magnesium content was higher in the leachates of the second bio-mixture (biomix 2%) and the third bio-mixture (biomix 3%) compared to that of the first bio-mixture after the first irrigation, but they were still lower than that of the control soil, while at the end of the irrigation period concentrations were at the same levels, with slightly increased values in the leachates of the second bio-mixture (biomix 2%) (Figure 3c,d).
Sodium absorption ratio (SAR) values in all leachates were also determined during the irrigation scheme in order to evaluate the potential impact of irrigation water on bio-mixtures and control soil. Compared to the control soil, slight reductions were observed in terms of sodium absorption ratio (SAR) values, which were all almost at the same levels (Figure 4a).
As regards leachates’ total hardness, values of all three bio-mixtures were lower than that of the control soil during the first irrigations while, at the end of all watering applications, all values decreased, in particular with a lower value observed in the first bio-mixture (biomix 1%) (Figure 4b).
As far as the leachate copper contents were concerned, a decline was observed in all bio-mixtures in comparison to the copper content of the control soil leachate, whilst the lowest concentration was determined in the first bio-mixture (biomix 1%) at the end of irrigation (Figure 5a).
Concerning iron, leachate concentration values fluctuated throughout the irrigation period (Figure 5b).
Manganese showed a gradual increase in leachates of all three bio-mixtures during irrigation compared to its value in the control soil, recording a higher concentration in the second bio-mixture (biomix 2%) (Figure 5c).
Regarding zinc concentration in the leachates, a reduction took place during the first water application in the first bio-mixture (biomix 1%) and the second bio-mixture (biomix 2%), though concentration values rise as irrigation continued; nevertheless, in the end, there were lower values in bio-mixture leachates than in the control soil leachate, with the lowest value being observed in the second bio-mixture (biomix 2%) (Figure 5d).
Synopsizing, at the end of the irrigation scheme, leachate content deriving from soil supplementation with the bio-mixture used as a physical filter for OMWW degradation does not pose a threat to groundwater, since all values are within the limit concentrations [32].

3.3. Bio-Mixture Effect on pH, EC, Organic Matter, CEC and ESP of Soil

The texture of the control soil (C) was loam and remained the same in each treatment (biomix 1%, biomix 2%, biomix 3%) (Table 4 and Table 5), indicating that the effect of adding the bio-mixture at these rates on soil texture is negligible.
The pH, electrical conductivity (EC), organic matter (OM), cation exchange capacity (CEC) and exchange sodium percentage (ESP) variations between the treatments are presented in Table 4 and Table 5.
The results showed that at 0–20 cm depth, pH increased the same in the three bio-mixtures treatments, from 7.01 (control) to 7.15, with the differences between the control soil and the bio-mixtures being significant (p < 0.05), while at 20–40 cm depth there were found no significant differences between the treatments. EC was slightly affected by the application of the bio-mixture, showing small increases of 6%, 3% and 8% for 1% biomix, 2% biomix and 3% biomix, respectively (Table 4 and Table 5). However, in most cases there were found no significant differences between the treatments, while values remained below the salinity threshold [11].
Regarding organic matter (O.Μ.), a significant (p < 0.05) gradual increase was observed as the percentage of the bio-mixture increased. More specifically, organic matter of samples from 0–20 cm depth, increased from 3.41% to 3.85%, 4.07% and 4.04% for 1% biomix, 2% biomix and 3% biomix, respectively. It is noteworthy that at 20–40 cm depth, no significant differences were observed between the treatments, since the movement of large organic molecules through the soil layer is difficult [33].
Similarly, cation exchange capacity (CEC) increased at surface soil (0–20 cm) from 17.8 cmolc kg−1 (control soil) to 18.1, 19.1 and 20.3 cmolc kg−1 for 1% biomix, 2% biomix and 3% biomix, respectively (Table 4 and Table 5). The suchlike increase occurred in the soil samples at the 20–40 cm depth (Table 4 and Table 5), pointing out the significant contribution of organic matter to this parameter. In both depths, the highest values were recorded in biomix 3% treatment, and their differences with control soil and biomix 1% were significant (p < 0.05).
In the case of ESP, no significant differences were found between the treatments in either depth.

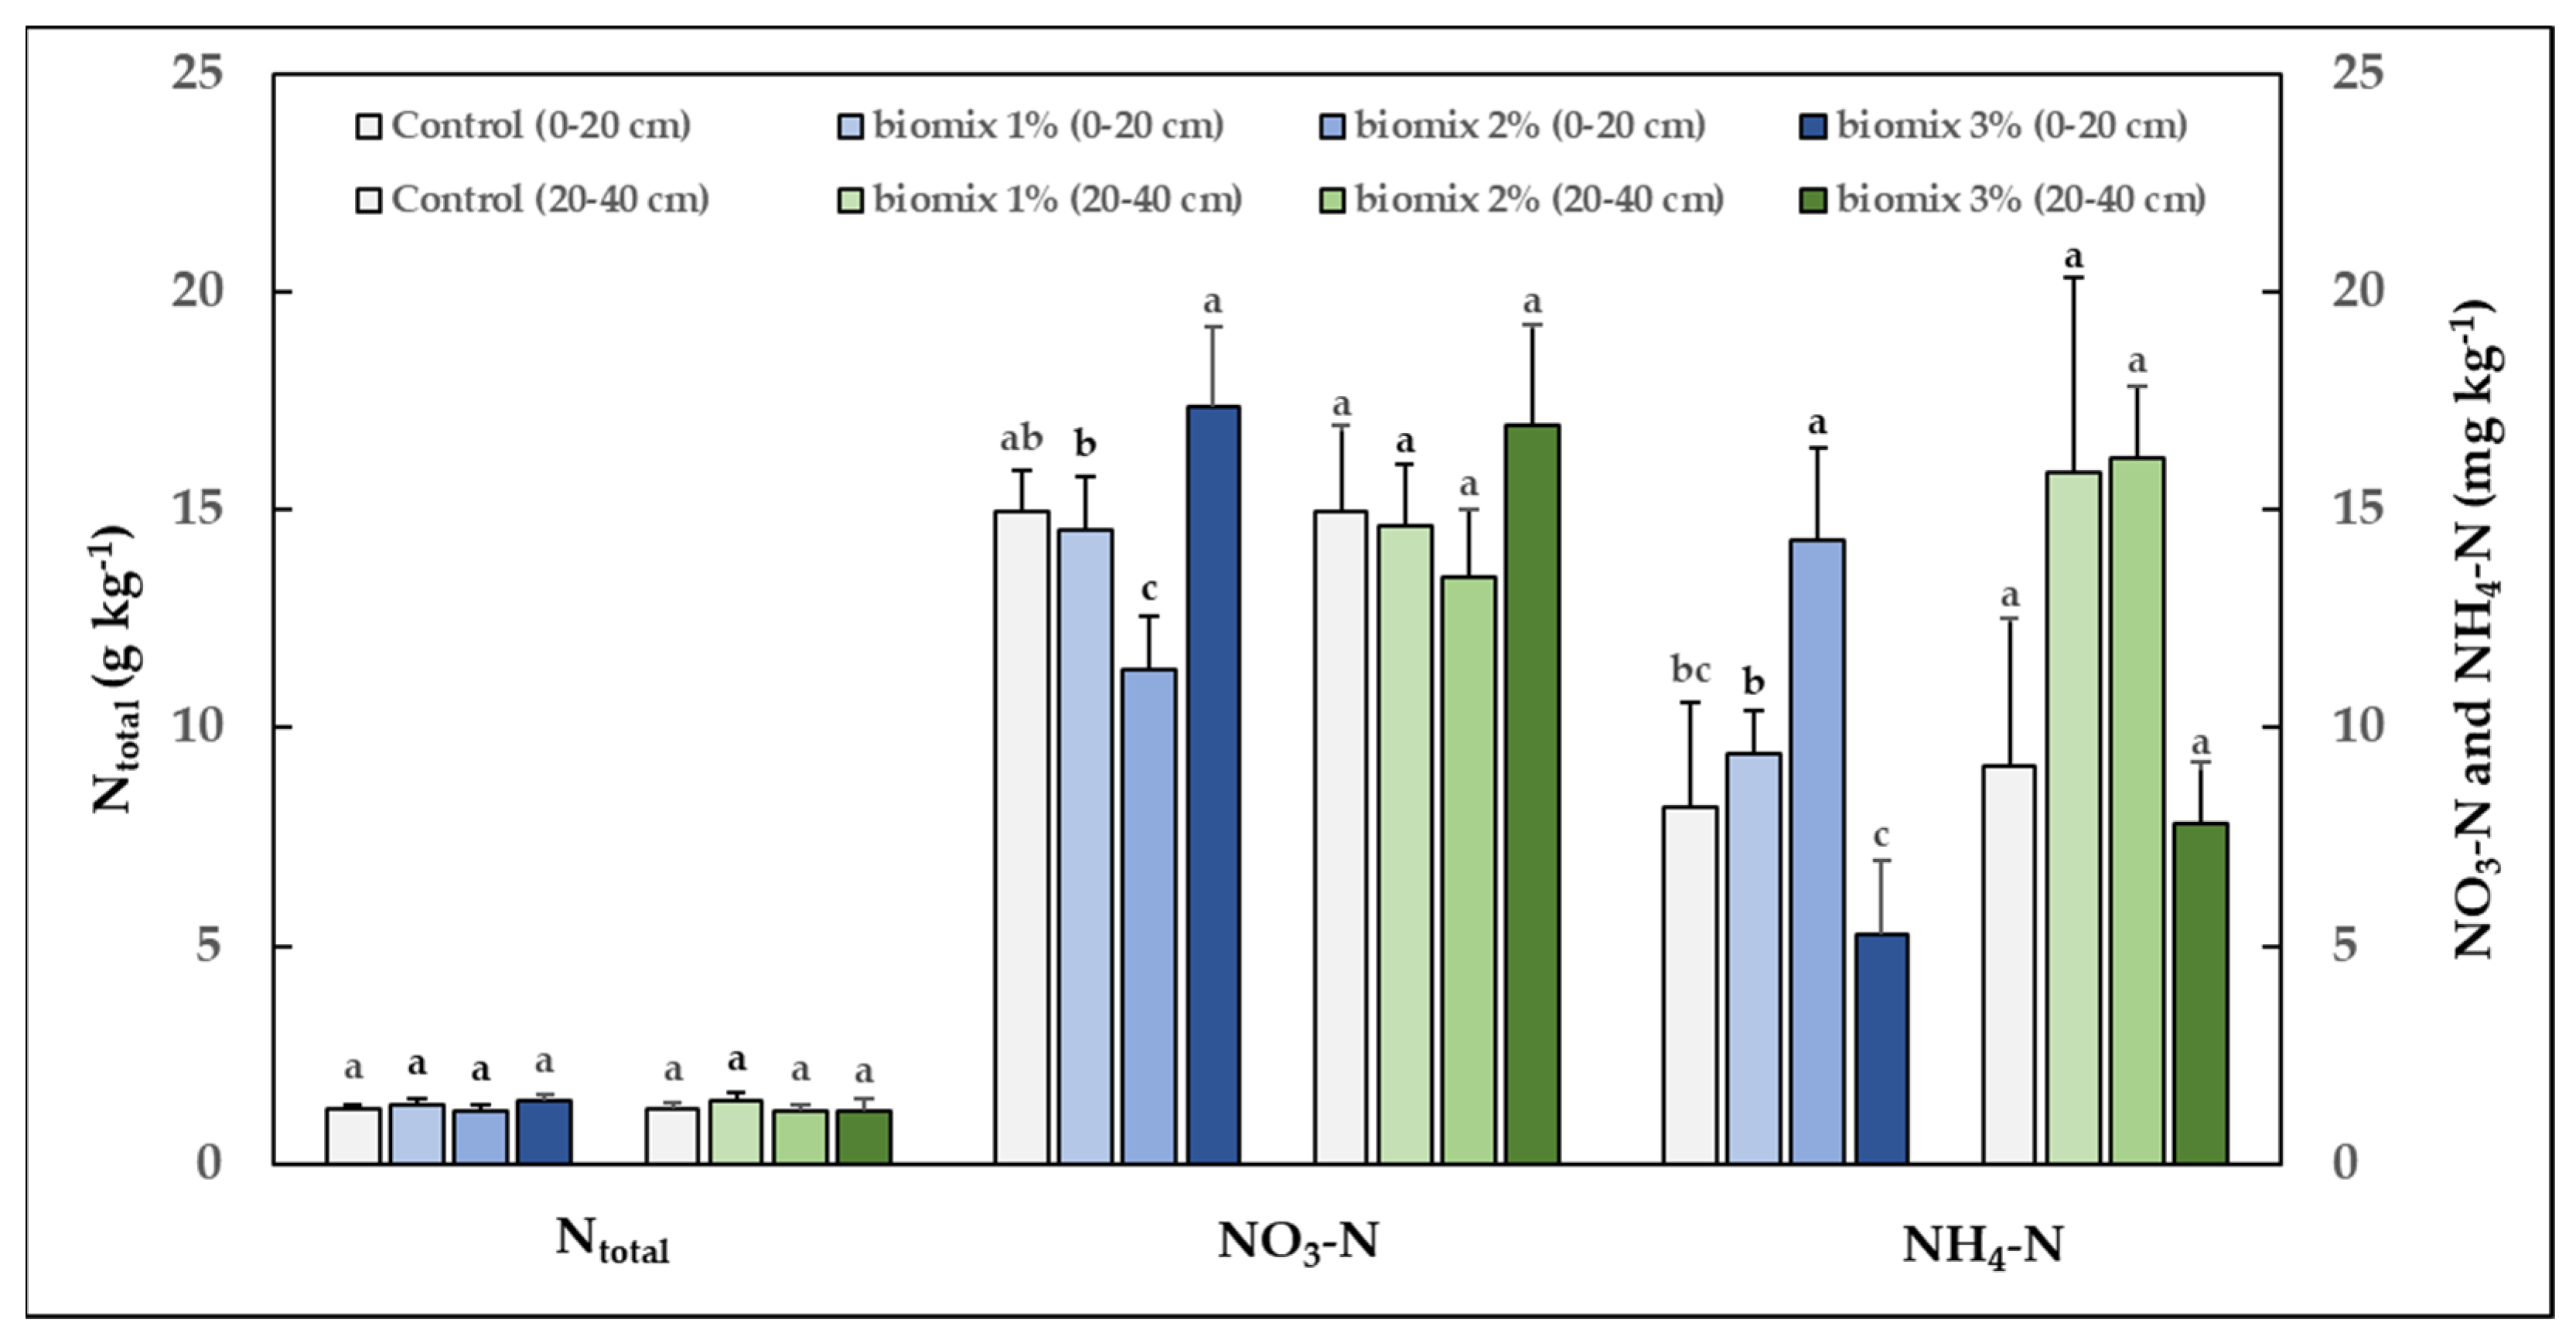
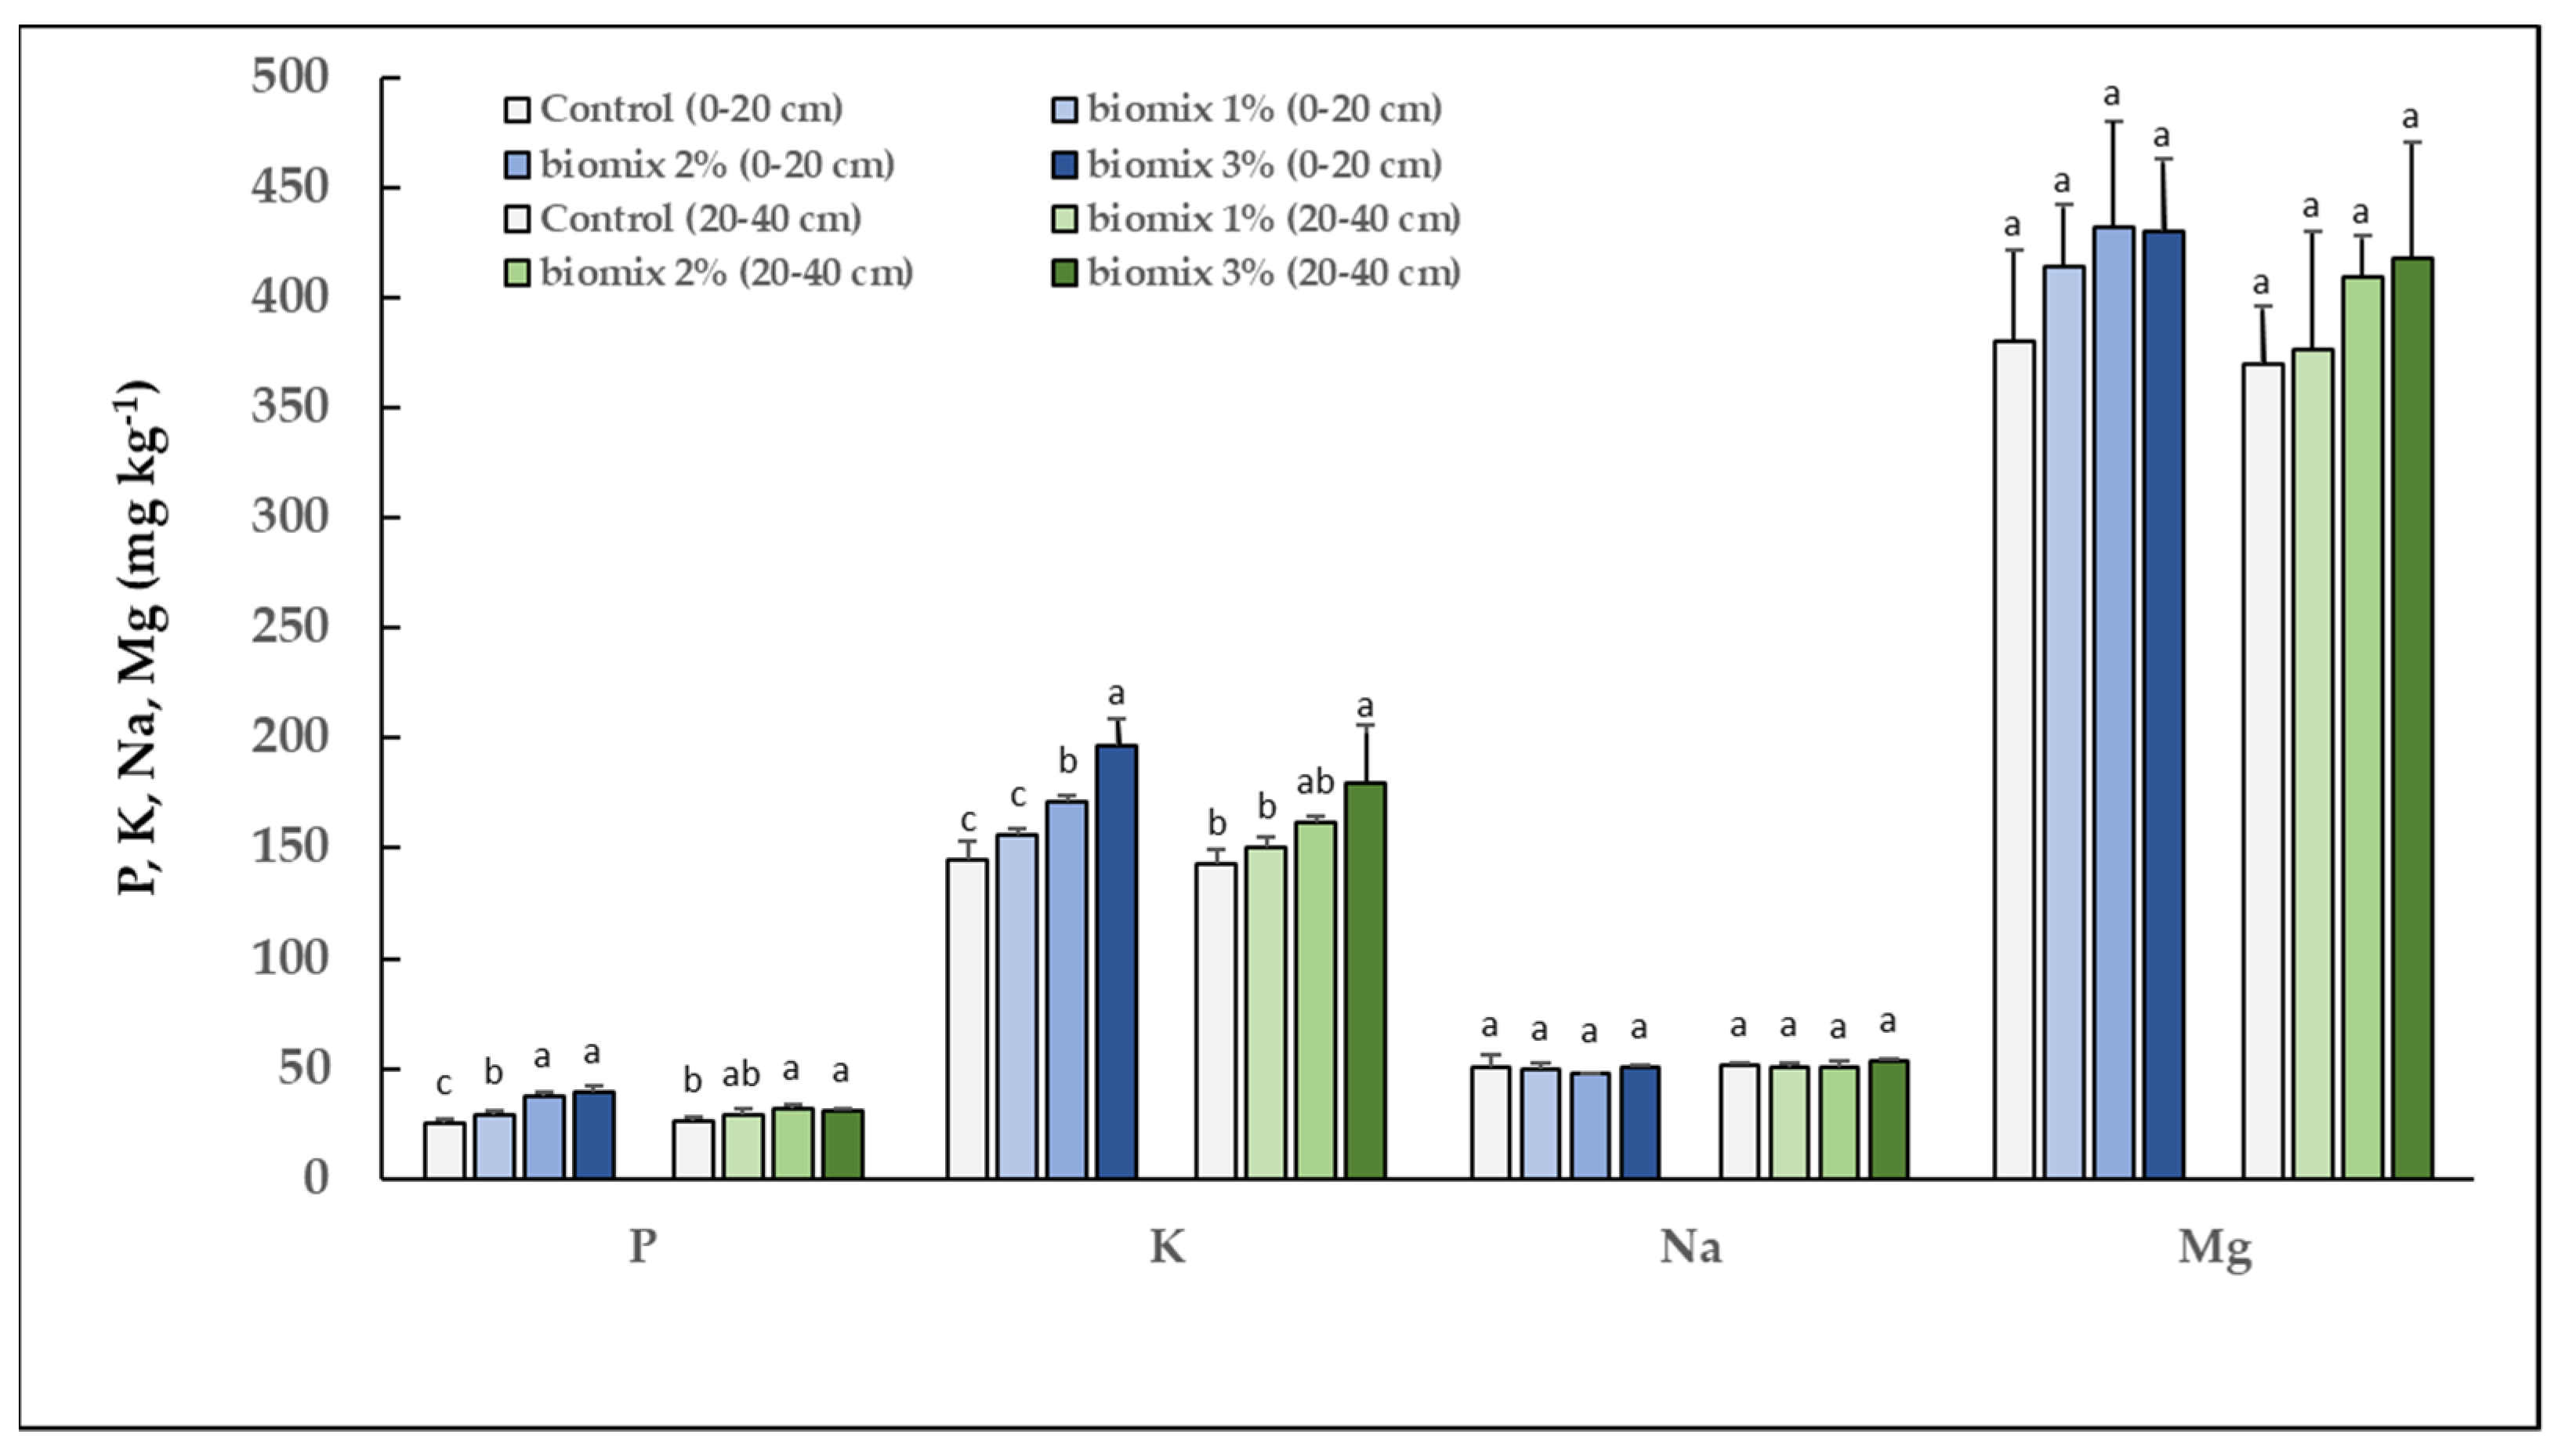
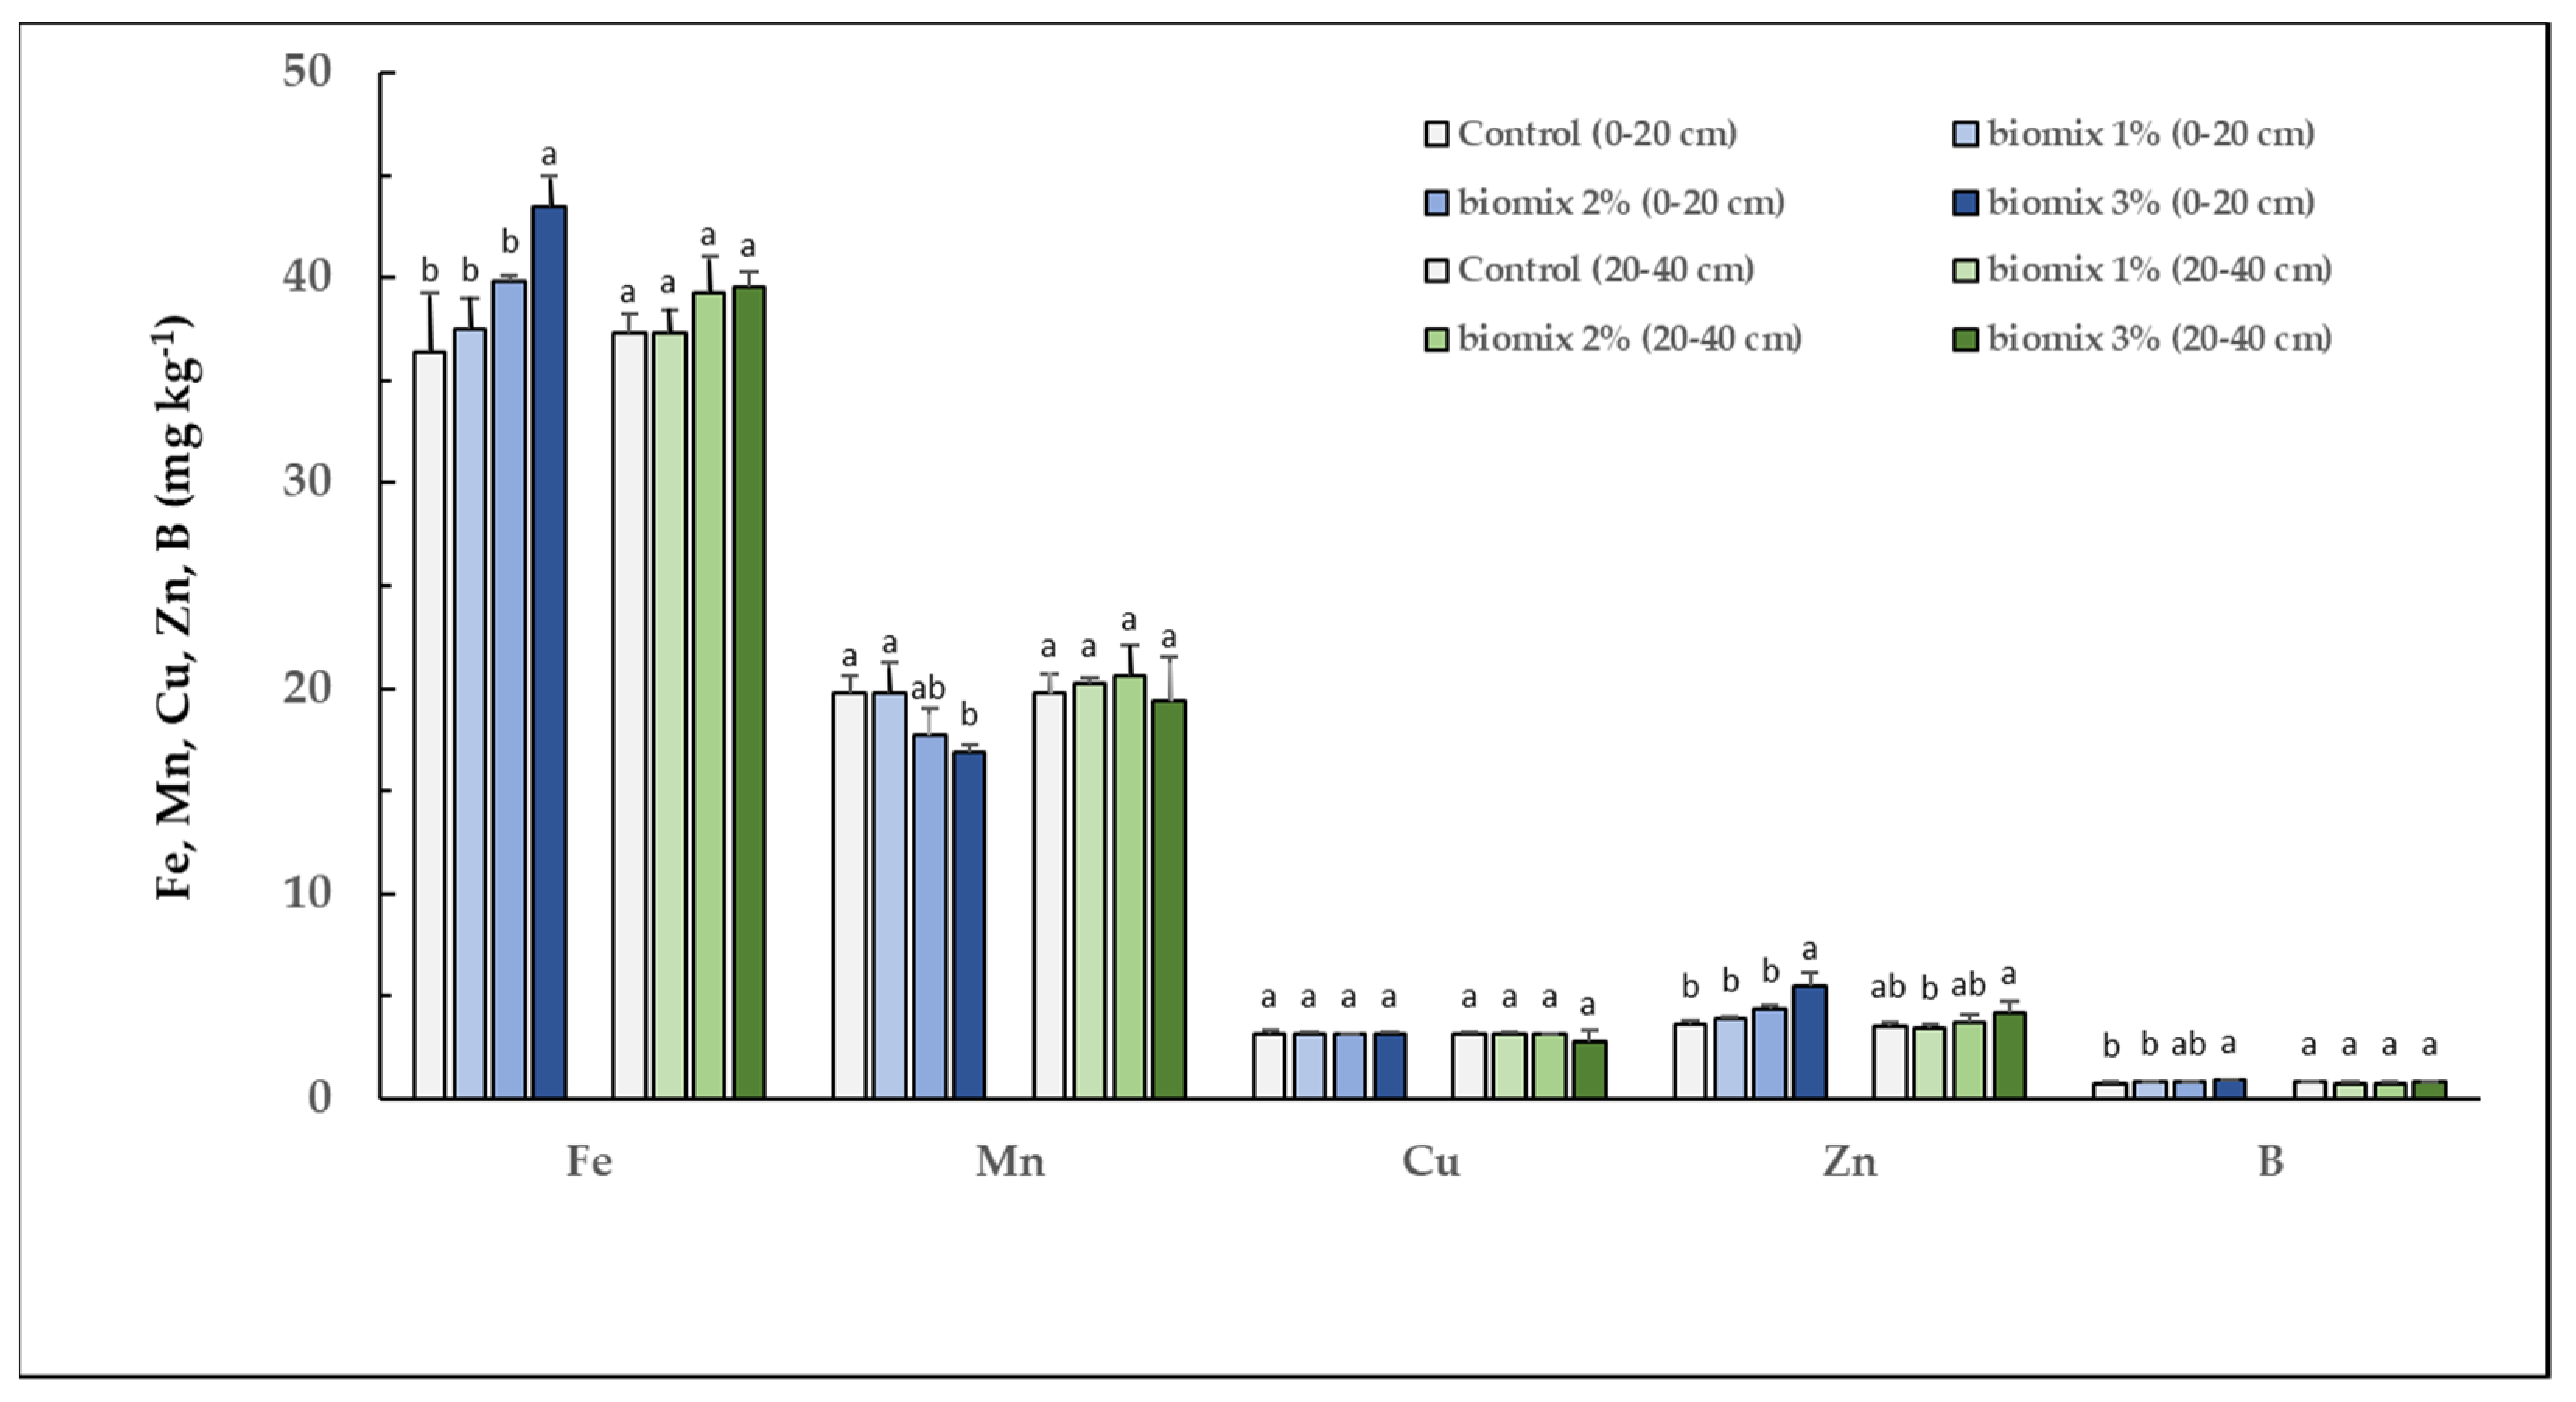
3.4. Bio-Mixture Effect on N-Compounds, Macro-Nutrients and Micro-Nutrients Content of the Soil

A rise in total nitrogen of bio-mixture–soil at 0–20 cm layer samples was observed in 1% biomix (8%) and 3% biomix (14%), indicating that bio-mixture contributes to the increase of total nitrogen concentration of soil, while there was not much differentiation in the total N of soil at 20–40 cm layer samples. Noteworthy is the increase (13–14%) of the nitrate–nitrogen in biomix 3% at both bio-mixture–soil at 0–20 cm and soil at 20–40 cm layer samples, whilst the ammonium nitrogen concentration increased in biomix 1% and in biomix 2% at both 0–20 cm and 20–40 cm layer samples (Figure 6).
It is also worth commenting on the fact that the concentration of phosphorus increases significantly in proportion to the percentage of bio-mixture, in relation to its concentration in the control soil, both at the surface horizon (0–20 cm) where bio-mixture was applied and in the soil samples at a depth of 20–40 cm (Figure 7). In particular, the phosphorus increased rates observed were 16%, 47% and 55% for 1% biomix, 2% biomix and 3% biomix, respectively, regarding bio-mixture–soil at 0–20 cm layer samples. Furthermore, increase rates of phosphorus in the soil at 20–40 cm layer samples were 11%, 21% and 23% for 1% biomix, 2% biomix and 3% biomix, respectively.
Regarding potassium, a higher increase was recorded at the upper layer of the soil (0–20 cm). As far as the potassium concentration of bio-mixture–soil at 0–20 cm layer samples, an increase of 8% took place in biomix 1%, 18% in biomix 2% and 36% in biomix 3% compared to the control soil concentration (Figure 7). The suchlike trend was observed at 20–40 cm layer samples, with the corresponding increase being up to 5%, 13% and 26% for biomix 1%, biomix 2% and biomix 3%, respectively (Figure 7). Compared to other soil treatments with OMW as an amendment [34,35], there was not a large increase in potassium content compared to the control, but nevertheless, this increase is considered quite significant.
In this case, sodium content was not affected by the application of the bio-mixture and remained constant in control soil and in all three bio-mixtures, as there were no changes in its concentration (Figure 7).
There was also an upward trend in magnesium content in both bio-mixture–soil and soil samples, reaching growth rates of 14% and 11%, respectively, for biomix 2% and 13% for biomix 3% (Figure 7). As observed in other works concerning the addition of OMW as a soil amendment, as far as the soil magnesium contents were concerned, no significant differences were noted [36].
It is well known that one of the main soil parameters that controls the micronutrient distribution and availability in soils is organic matter because it supplies chelating agents, which increase their solubility [37]. According to our results, a gradual increase of iron concentration was observed as the percentage of the bio-mixture increased. More specifically, iron concentration of samples from the 0–20 cm depth increased from 36.4 mg kg−1 to 37.5, 39.9 and 43.5 mg kg−1 for 1% biomix, 2% biomix and 3% biomix, with values corresponding to 3%, 10% and 20% rates, respectively. It is noteworthy that iron content increased significantly even in the soil at a depth of 20–40 cm (Figure 8). Concerning zinc concentration, a rise of 6%, 19% and 50% took place for 1% biomix, 2% biomix and 3% biomix at 0–20 cm layer samples, respectively. For the second layer, zinc content was not affected by the application of the bio-mixture, as there were slight changes in its concentration in soil at 20–40 cm layer samples (Figure 8). Likewise, increased concentrations of zinc and iron after OMW application were also reported by Aqeel et al. [38]; these values are due to enhanced soil microbial activity [39]. According to Piotrowska et al. [40], the increase of extractable iron can be attributed to the fact that this metal may catalyze the oxidative transformation of phenols in soil. Furthermore, no significant changes in manganese and copper content in both bio-mixture–soil and soil samples were pointed out.
For boron concentration, which is presented in Figure 8, increments of 5%, 7% and 18% took place for 1% biomix, 2% biomix and 3% biomix at 0–20 cm layer samples, respectively. Boron content was not affected by the application of the bio-mixture, as there were slight changes in its concentration in soil at 20–40 cm layer samples (Figure 8).

4. Conclusions

As suggested in our previous paper and as pointed out by this study, saturated bio-mixtures from biobed systems utilized for OMWW treatment not only do not require any special treatment before their final disposal but can also be exploited as a soil amendment. To this end, the effects of the used bio-mixture application in different proportions as a soil amendment on the physical and chemical properties of a medium-texture cultivated soil were investigated. The study demonstrated that soil supplementation with bio-mixture shows a high potential for the improvement of soil physical properties due to proper aeration and leaching, especially when used for heavy soils, as well as for the enhancement of soil fertility, regarding the rise of organic matter, cation exchange capacity, phosphorus and nitrogen. Furthermore, a sufficient amelioration of the second depth soil (20–40 cm) was observed due to soil particles movement downwards. Moreover, chemical analysis of the leachates intimated that the impact of selected amendments on groundwater quality was the minimum.
The promising outcomes, combined with the fact that exhausted bio-mixtures’ reuse follows the circular economy principles, may facilitate the arduous and intractable treatment of OMWW in Greece, given that its disposal would be an additional problem that an olive oil mill owner would have to deal with. Recycling bio-mixture is a win-win strategy to transform a potential environmental threat associated to its disposal in a valuable resource.
Further, future research may be conducted on the treatment and utilization of exhausted bio-mixture by composting and vermicomposting to produce organic soil amendment as well so that it can be used in crop fertilization.

Author Contributions

Conceptualization: E.H. and V.K.; Methodology: E.H.; Formal analysis: V.K. and S.S.; Investigation: V.K. and E.H.; Resources: E.H., V.K. and A.G.; Data curation: V.K., S.S. and D.G.; Writing—original draft preparation: V.K. and E.H.; Writing—review and editing: V.K., E.H., A.G., E.K.O., S.S. and D.G.; Visualization: V.K. and E.H.; Supervision: E.H.; Project administration: E.H., A.G. and E.K.O.; Funding acquisition: E.H. All authors have read and agreed to the published version of the manuscript.

Funding

This research received no external funding.

Institutional Review Board Statement

Not applicable.

Informed Consent Statement

Not applicable.

Data Availability Statement

Not applicable.

Acknowledgments

The authors are thankful to Savvas Tsolakidis and Antonios Terzidis for their contribution to the preparation of the bio-mixture–soil mixtures and the construction and filling of the columns.

Conflicts of Interest

The authors declare no conflict of interest.

References

  1. Nassar, N.N.; Arar, L.A.; Marei, N.N.; Abu Ghanim, M.M.; Dwekat, M.S.; Sawalha, S.H. Treatment of olive mill based wastewater by means of magnetic nanoparticles: Decolourization, dephenolization and COD removal. Environ. Nanotechnol. Monit. Manag. 2014, 1–2, 14–23. [Google Scholar] [CrossRef] [Green Version]
  2. Chatjipavlidis, I.; Antonakou, M.; Demou, D.; Flouri, F.; Balis, C. Bio-Fertilization of Olive Oil Mills Liquid Wastes. The Pilot Plant in Messinia, Greece. Int. Biodeterior. Biodegrad. 1996, 38, 183–187. [Google Scholar] [CrossRef]
  3. Azzaz, A.A.; Jeguirim, M.; Kinigopoulou, V.; Doulgeris, C.; Goddard, M.L.; Jellali, S.; Matei Ghimbeu, C. Olive mill wastewater: From a pollutant to green fuels, agricultural and water source and bio-fertilizer–Hydrothermal carbonization. Sci. Total Environ. 2020, 733, 139314. [Google Scholar] [CrossRef]
  4. Souilem, S.; El-Abbassi, A.; Kiai, H.; Hafidi, A.; Sayadi, S.; Galanakis, C.M. Olive oil production sector: Environmental effects and sustainability challenges. In Olive Mill Waste: Recent Advances for Sustainable Management; Elsevier Inc.: Amsterdam, The Netherlands, 2017; pp. 1–28. ISBN 9780128053140. [Google Scholar]
  5. Azzaz, A.A.; Khiari, B.; Jellali, S.; Ghimbeu, C.M.; Jeguirim, M. Hydrochars production, characterization and application for wastewater treatment: A review. Renew. Sustain. Energy Rev. 2020, 127, 109882. [Google Scholar] [CrossRef]
  6. de Gonçalves, C.C.M.; de Paiva, P.C.A.; Dias, E.S.; de Siqueira, F.G.; Henrique, F. Evaluation of the cultivation of Pleurotus sajor-caju (fries) sing. on cotton textile mill waste for mushroom production and animal feeding. Cienc. e Agrotecnol. 2010, 34, 220–225. [Google Scholar] [CrossRef] [Green Version]
  7. Marks, E.A.N.; Kinigopoulou, V.; Akrout, H.; Azzaz, A.A.; Doulgeris, C.; Jellali, S.; Rad, C.; Zulueta, P.S.; Tziritis, E.; El-Bassi, L.; et al. Potential for production of biochar-based fertilizers from olive millwaste in mediterranean basin countries: An initial assessment for Spain, Tunisia, and Greece. Sustainability 2020, 12, 6081. [Google Scholar] [CrossRef]
  8. Ntoulas, N.; Nektarios, P.A.; Gogoula, G. Evaluation of olive mill wastecompost as a soil amendment for Cynodon dactylon turf establishment, growth, and anchorage. HortScience 2011, 46, 937–945. [Google Scholar] [CrossRef] [Green Version]
  9. Regni, L.; Nasini, L.; Ilarioni, L.; Brunori, A.; Massaccesi, L.; Agnelli, A.; Proietti, P. Long Term Amendment with Fresh and Composted Solid Olive Mill Waste on Olive Grove Affects Carbon Sequestration by Prunings, Fruits, and Soil. Front. Plant Sci. 2017, 7, 2042. [Google Scholar] [CrossRef]
  10. Doula, M.K.; Tinivella, F.; Ortego, L.L.M.; Kavvadias, V.A.; Sarris, A.; Theocharopoulos, S.; Sanchez-Monedero, M.A.; Elaiopouls, K. Good Practices for the Agronomic Use of Olive Mill Wastes–Application Guide (Science for Life PROSODOL); LIFE07/ENV/GR/000280; Doula, M., Ed.; European Commission: Brussels, Belgium, 2012.
  11. Chaari, L.; Elloumi, N.; Mseddi, S.; Gargouri, K.; Bourouina, B.; Mechichi, T.; Kallel, M. Effects of olive mill wastewater on soil nutrients availability. J. Interdiscip. Multidiscip. Res. 2014, 2, 175–183. [Google Scholar]
  12. Nasini, L.; Gigliotti, G.; Balduccini, M.A.; Federici, E.; Cenci, G.; Proietti, P. Effect of solid olive-mill waste amendment on soil fertility and olive (Olea europaea L.) tree activity. Agric. Ecosyst. Environ. 2013, 164, 292–297. [Google Scholar] [CrossRef]
  13. Ehaliotis, C.; Papadopoulou, K.; Kotsou, M.; Mari, I.; Balis, C. Adaptation and population dynamics of Azotobacter vinelandii during aerobic biological treatment of olive-mill wastewater. FEMS Microbiol. Ecol. 2006, 30, 301–311. [Google Scholar] [CrossRef]
  14. Seferoğlu, S.; Bilgehan Aydin, G.; Aydin, M. Impact of solid and liquid olive oil waste applications on important soil properties. Arch. Agron. Soil Sci. 2012, 58, S180–S184. [Google Scholar] [CrossRef]
  15. Kinigopoulou, V.; Hatzigiannakis, E.; Guitonas, A.; Oikonomou, K.E. Olive Oil Mill Waste Water Treatment with Biobed. In Proceedings of the Protection and Restoration of the Environment XV, Patra, Greece, 7–10 July 2020; pp. 575–586. [Google Scholar]
  16. Kinigopoulou, V.; Hatzigiannakis, E.; Guitonas, A.; Oikonomou, E.K.; Samaras, P. Utilization of biobed for the efficient treatment of olive oil mill wastewater. Desalin. Water Treat. 2021, 223, 167–179. [Google Scholar] [CrossRef]
  17. Delgado-Moreno, L.; Nogales, R.; Romero, E. Vermiremediation of biomixtures from biobed systems contaminated with pesticides. Appl. Sci. 2020, 10, 3173. [Google Scholar] [CrossRef]
  18. Papamihail, D.; Mpampatzimopoulos, C. Applied Agricultural Hydraulics; ZITI: Thessaloniki, Greece, 2015; ISBN 978-960-456-415-6. [Google Scholar]
  19. Papazafiriou, Z.G. Water Needs of Crops; ZITI: Thessaloniki, Greece, 1999. [Google Scholar]
  20. Papazafiriou, Z.G. Crop evapotranspiration: Regional studies in Greece. In Proceedings of the International Symposium of Applied Agrometeorology and Agroclimatology, Volos, Greece, 24–26 April 1996; COST 77, 79, 711, EUR 18328. European Commission: Brussels, Belgium, 1996; pp. 275–286. [Google Scholar]
  21. Standard Methods for the Examination of Water and Wastewater, 23rd Edition. Available online: https://www.wef.org/resources/publications/books/StandardMethods/ (accessed on 19 February 2021).
  22. Methods of Soil Analysis, Part 3: Chemical Methods|Wiley. Available online: https://www.wiley.com/en-us/Methods+of+Soil+Analysis%2C+Part+3%3A+Chemical+Methods-p-9780891188254 (accessed on 19 February 2021).
  23. Nelson, D.W.; Sommers, L.E. A rapid and accurate procedure for estimation of organic carbon in soils. Proc. Indiana Acad. Sci. 1975, 84, 456–462. [Google Scholar]
  24. Ben-Dor, E.; Banin, A. Determination of organic matter content in arid-zone soils using a simple “loss-on-ignition” method. Commun. Soil Sci. Plant Anal. 1989, 20, 1675–1695. [Google Scholar] [CrossRef]
  25. ISO-ISO 11261:1995-Soil Quality—Determination of Total Nitrogen—Modified Kjeldahl Method. Available online: https://www.iso.org/standard/19239.html (accessed on 18 February 2021).
  26. Keeney, D.R.; Nelson, D.W. Methods of Soil Analysis; Page, A.L., Ed.; Agronomy Monographs; American Society of Agronomy, Soil Science Society of America: Madison, WI, USA, 1983; ISBN 9780891189770. [Google Scholar]
  27. Bouyoucos, G.J. Hydrometer Method Improved for Making Particle Size Analyses of Soils1. Agron. J. 1962, 54, 464–465. [Google Scholar] [CrossRef]
  28. Sumner, M.E.; De Ramos, L.; Kukier, U.; Ramos, L.D. Communications in Soil Science and Plant Analysis Compulsive exchange method for determining soil exchange capacities: Proposed time and labor saving modifications compulsive exchange method for determining soil exchange capacities: Proposed time and labor sav-ing modifications. Commun. Soil Sci. Plant Anal 1994, 25, 567–572. [Google Scholar] [CrossRef]
  29. Soil Survey Laboratory Methods Manual, 4th ed.; Burt, R. (Ed.) United States Department of Agriculture, U.S. Govt. Print. Office: Washington, DC, USA, 2004.
  30. Caputo, M.C.; De Girolamo, A.M.; Volpe, A. Soil amendment with olive mill wastes: Impact on groundwater. J. Environ. Manage. 2013, 131, 216–221. [Google Scholar] [CrossRef]
  31. Gómez-Muñoz, B.; Hatch, D.J.; Dixon, E.R.; Garcia-Ruiz, R. Gross and net rates of nitrogen mineralisation in soil amended with composted olive mill pomace. Rapid Commun. Mass Spectrom. 2011, 25, 1472–1478. [Google Scholar]
  32. Dec.nc.gov Groundwater Standards. Available online: https://deq.nc.gov/about/divisions/water-resources/water-planning/classification-standards/groundwater (accessed on 15 December 2021).
  33. Kavvadias, V.; Doula, M.K.; Komnitsas, K.; Liakopoulou, N. Disposal of olive oil mill wastes in evaporation ponds: Effects on soil properties. J. Hazard. Mater. 2010, 182, 144–155. [Google Scholar] [CrossRef]
  34. Di Bene, C.; Pellegrino, E.; Debolini, M.; Silvestri, N.; Bonari, E. Short- and long-term effects of olive mill wastewater land spreading on soil chemical and biological properties. Soil Biol. Biochem. 2013, 56, 21–30. [Google Scholar] [CrossRef]
  35. Magdich, S.; Ben Ahmed, C.; Jarboui, R.; Ben Rouina, B.; Boukhris, M.; Ammar, E. Dose and frequency dependent effects of olive mill wastewater treatment on the chemical and microbial properties of soil. Chemosphere 2013, 93, 1896–1903. [Google Scholar] [CrossRef]
  36. Chartzoulakis, K.; Psarras, G.; Moutsopoulou, M.; Stefanoudaki, E. Application of olive mill wastewater to a Cretan olive orchard: Effects on soil properties, plant performance and the environment. Agric. Ecosyst. Environ. 2010, 138, 293–298. [Google Scholar] [CrossRef]
  37. Chatzistathis, T.; Papaioannou, A.; Gasparatos, D.; Molassiotis, A. From which soil metal fractions Fe, Mn, Zn and Cu are taken up by olive trees (Olea europaea L. cv. ‘Chondrolia Chalkidikis’) in organic groves? J. Environ. Manag. 2017, 203, 489–499. [Google Scholar] [CrossRef]
  38. Aqeel, A.M.; Hameed, K.M.; Alaudatt, M. Effect of Olive Mill By-products on Mineral Status, Growth and Productivity of Faba Bean. J. Agron. 2007, 6, 403–408. [Google Scholar] [CrossRef] [Green Version]
  39. Tisdale, S.L.; Nelson, W.L.; Beaton, J.B.; Havlin, J.L. Soil Fertility and Fertilizers, 5th ed.; Pearson Education: London, UK, 2003. [Google Scholar]
  40. Piotrowska, A.; Iamarino, G.; Rao, M.A.; Gianfreda, L. Short-term effects of olive mill waste water (OMW) on chemical and biochemical properties of a semiarid Mediterranean soil. Soil Biol. Biochem. 2006, 38, 600–610. [Google Scholar] [CrossRef]
Figure 1. Changes of: (a) pH values and (b) EC values in the leachates of the 10 irrigation applications of the four treatments. Each value is the mean of three replicates.
Applsci 12 07347 g001
Figure 2. Changes of: (a) NO3 (mg/L) concentrations and (b) B (mg/L) concentrations in the leachates of the 10 irrigation applications of the four treatments. Each value is the mean of three replicates.
Applsci 12 07347 g002
Figure 3. Changes of: (a) K (mg/L) concentrations, (b) Na (mg/L) concentrations, (c) Ca (mg/L) concentrations and (d) Mg (mg/L) concentrations in the leachates of the 10 irrigation applications of the four treatments. Each value is the mean of three replicates.
Applsci 12 07347 g003
Figure 4. Changes of: (a) SAR values and (b) Total Hardness (mg CaCO3 L−1) values in the leachates of the 10 irrigation applications of the four treatments. Each value is the mean of three replicates.
Applsci 12 07347 g004
Figure 5. Changes of: (a) Cu (mg L−1) concentrations, (b) Fe (mg L−1) concentrations, (c) Mn (mg L−1) concentrations and (d) Zn (mg L−1) concentrations in the leachates of the 10 irrigation applications of the four treatments. Each value is the mean of three replicates.
Applsci 12 07347 g005
Figure 6. Average Ntotal (g kg−1), NO3-N (mg kg−1) and NH4-N (mg kg−1) concentrations and their standard deviations (SD) of samples of the four treatments at 0–20 cm and 20–40 cm depth. Each value is the mean of three replicates. Different letters above each column within the same parameter evaluated, indicate significant differences among treatments.
Applsci 12 07347 g006
Figure 7. Average P, K, Na and Mg (mg kg−1) concentrations and their standard deviations (SD) of samples of the four treatments at 0–20 and 20–40 cm depth. Each value is the mean of three replicates. Different letters above each column within the same parameter evaluated, indicate significant differences among treatments.
Applsci 12 07347 g007
Figure 8. Average B (mg kg−1), Fe (mg kg−1), Mn (mg kg−1), Zn (mg kg−1) and Cu (mg kg−1) concentrations and their standard deviations (SD) of samples of the four treatments (a) at 0–20 cm depth and (b) at 20–40 cm depth. Each value is the mean of three replicates. Different letters above each column within the same parameter evaluated, indicate significant differences.
Applsci 12 07347 g008
Table 1. Main physicochemical characteristics of used bio-mixture.
ParameterValue
Sand (%)58.8
Silt (%)25.6
Clay (%)15.6
pH6.70
Electrical Conductivity (μS cm−1)5460
Organic Matter (%) 3.60
Organic Carbon (%) 1.30
CaCO3 (%)1.17
ESP (%) 6.13
Cation Exchange Capacity (cmolc kg−1)32.6
P-Olsen (mg kg−1)291
Exchangeable Na (mg kg−1)460
Exchangeable K (mg kg−1)2550
Exchangeable Ca (mg kg−1)2965
Exchangeable Mg (mg kg−1)561
N total (g kg−1)6.52
NO3-N (mg kg−1)405
B (mg kg−1)3.82
Fe (mg kg−1)39.6
Mn (mg kg−1)5.54
Zn (mg kg−1)66.2
Cu (mg kg−1)2.73
Table 2. Main chemical characteristics of irrigation water.
ParameterValueParameterValue
pH8.0K (mg L−1)1.90
EC (μS cm−1)451Na (mg L−1)7.70
NO3 (mg L−1)1.84Ca (mg L−1)49.1
NO2 (mg L−1)0.00Mg (mg L−1)25.7
NH4+ (mg L−1)0.008Zn (mg L−1)0.08
Cl (mg L−1)3.98B (mg L−1)0.004
Table 3. Saturated water content, field capacity, permanent wilting point and bulk density changes in the samples of the four treatments z.
Depth (cm)TreatmentSaturated Water Content (%) v/vField Capacity (%) v/vPermanent Wilting Point (%) v/vBulk Density (g/cm3)
0–20C45.6 b33.8 a25.0 a1.63 a
Biomix 1%51.6 a32.0 ab23.9 a1.37 b
Biomix 2%50.3 a29.7 b23.8 a1.30 b
Biomix 3%51.6 a29.9 b24.1 a1.38 b
20–40C47.0 b33.6 a24.7 ab1.58 a
Biomix 1%52.3 a30.7 ab22.4 b1.31 b
Biomix 2%51.1 ab29.2 b22.9 ab1.37 b
Biomix 3%52.1 a32.4 ab26.2 a1.39 b
z Values are the mean of three replicates. Values accompanied by a different letter in each column differ significantly (p < 0.05) using the Duncan test.
Table 4. Soil texture, pH, EC, O.M., CEC and ESP in the four treatments at 0–20 cm depth z.
Sample (0–20 cm Depth)Sand (%)Silt (%)Clay (%)pHEC (µS cm−1)O.M. (%)CEC (cmolc kg−1)ESP (%)
C46.427.526.17.01 b351 ab3.41 c17.8 b1.25 a
Biomix 1%46.128.425.57.15 a371 a3.85 b18.1 b1.19 a
Biomix 2%46.027.226.87.15 a340 b4.07 a19.1 ab1.15 a
Biomix 3%45.227.727.17.15 a378 a4.04 a20.3 a1.08 a
z Values are the mean of three replicates. Values accompanied by different letter in each column differ significant (p < 0.05) using the Duncan test.
Table 5. Soil texture, pH, EC, O.M., CEC and ESP in the four treatments at 20–40 cm depth z.
Sample (20–40 cm Depth)Sand (%)Silt (%)Clay (%)pHEC (µS cm−1)O.M. (%)CEC (cmolc kg−1)ESP (%)
C45.728.825.56.94 a358 a3.45 a18.4 b1.22 a
Biomix 1%44.728.526.87.02 a364 a3.89 a18.5 b1.20 a
Biomix 2%46.527.326.16.98 a364 a3.95 a19.1 ab1.15 a
Biomix 3%45.127.727.27.02 a369 a3.95 a20.3 a1.14 a
z Values are the mean of three replicates. Values accompanied by different letter in each column differ significant (p < 0.05) using the Duncan test.
Publisher’s Note: MDPI stays neutral with regard to jurisdictional claims in published maps and institutional affiliations.

