
Numerical Evaluation in a Scaled Rotor-Less Nozzle Vaned Radial Turbine Model under Variable Geometry Conditions

 ,
,  , and
, and
Abstract
:1. Introduction
2. Materials and Methods
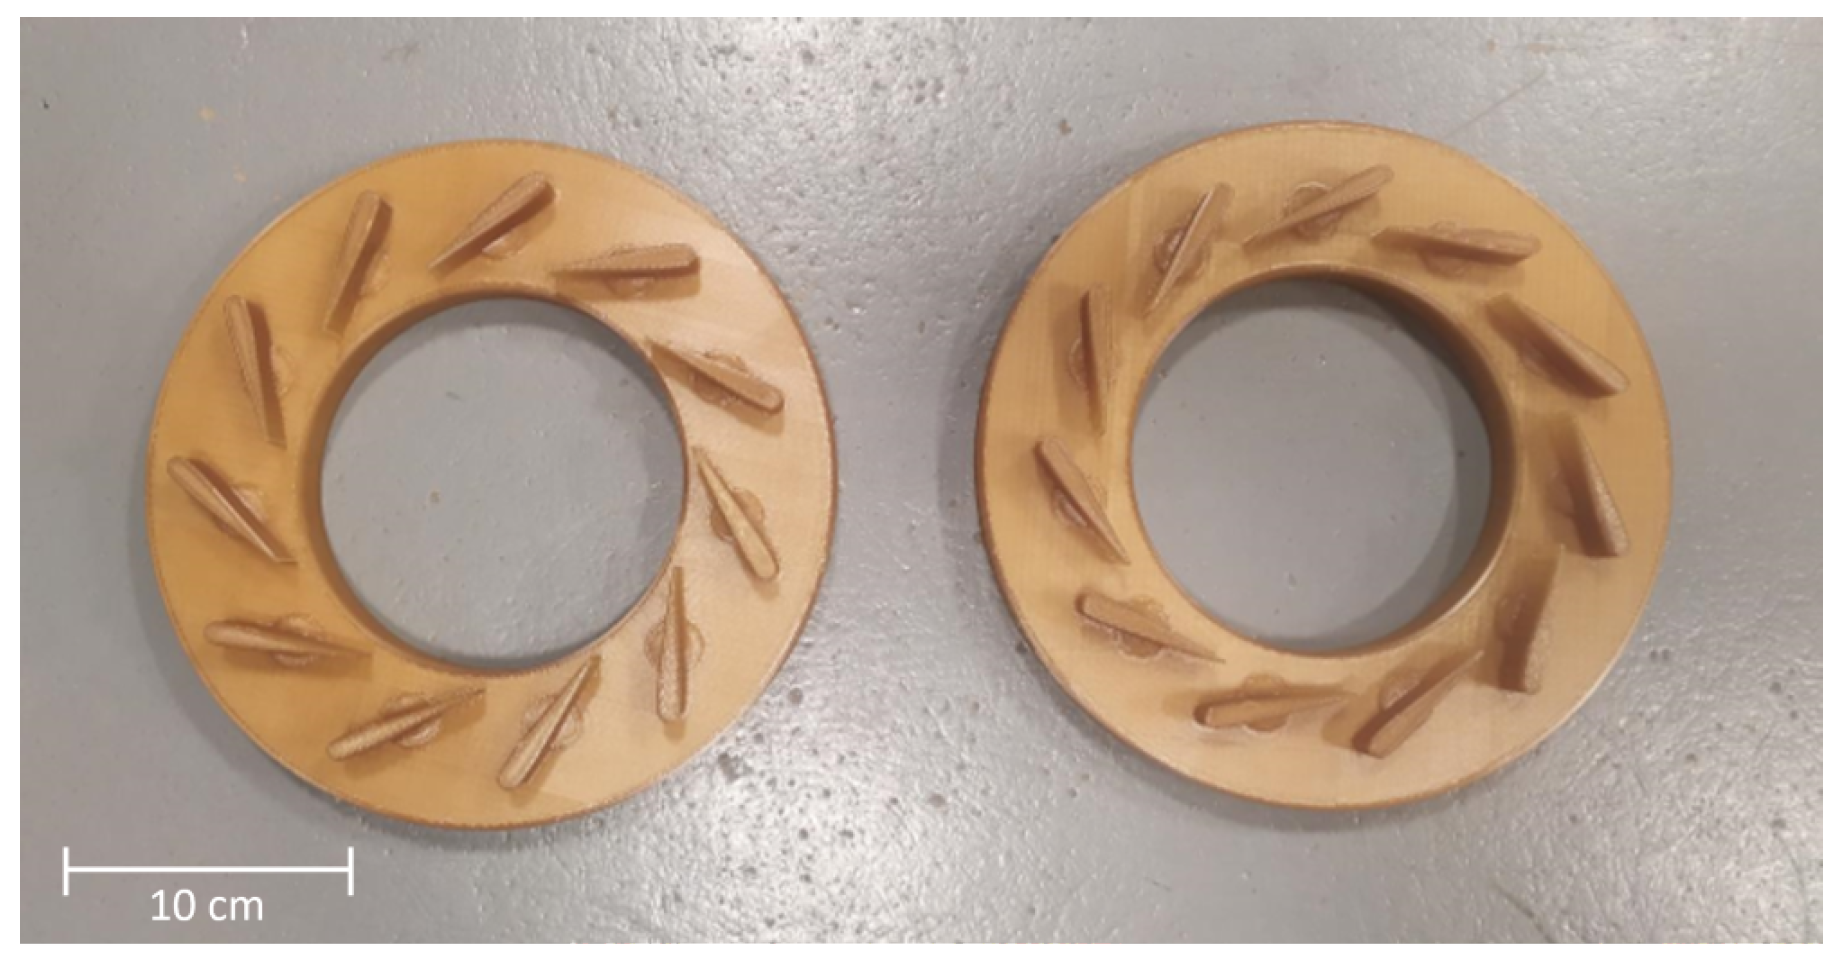
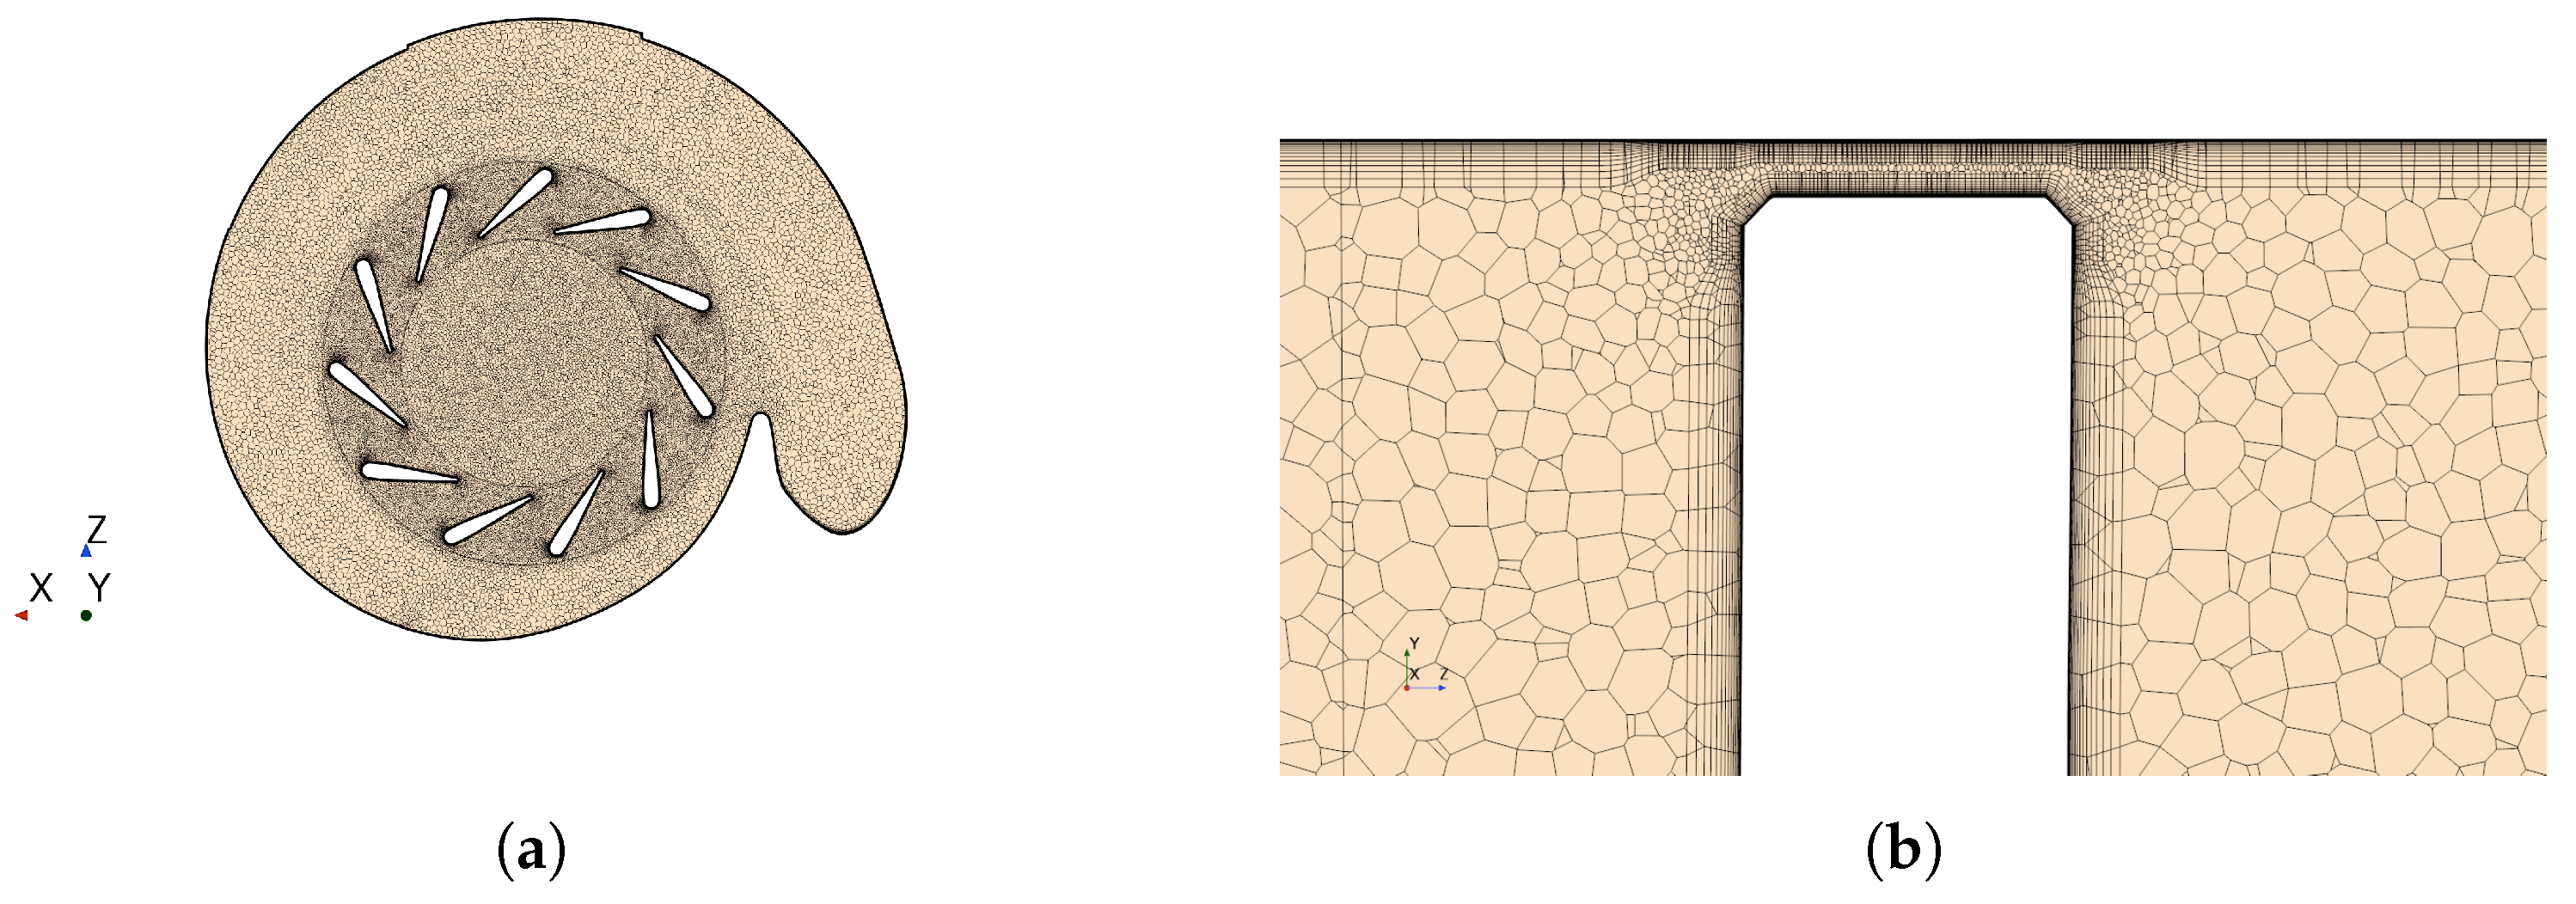
2.1. CFD Setup
2.2. 1D Model
3. Results
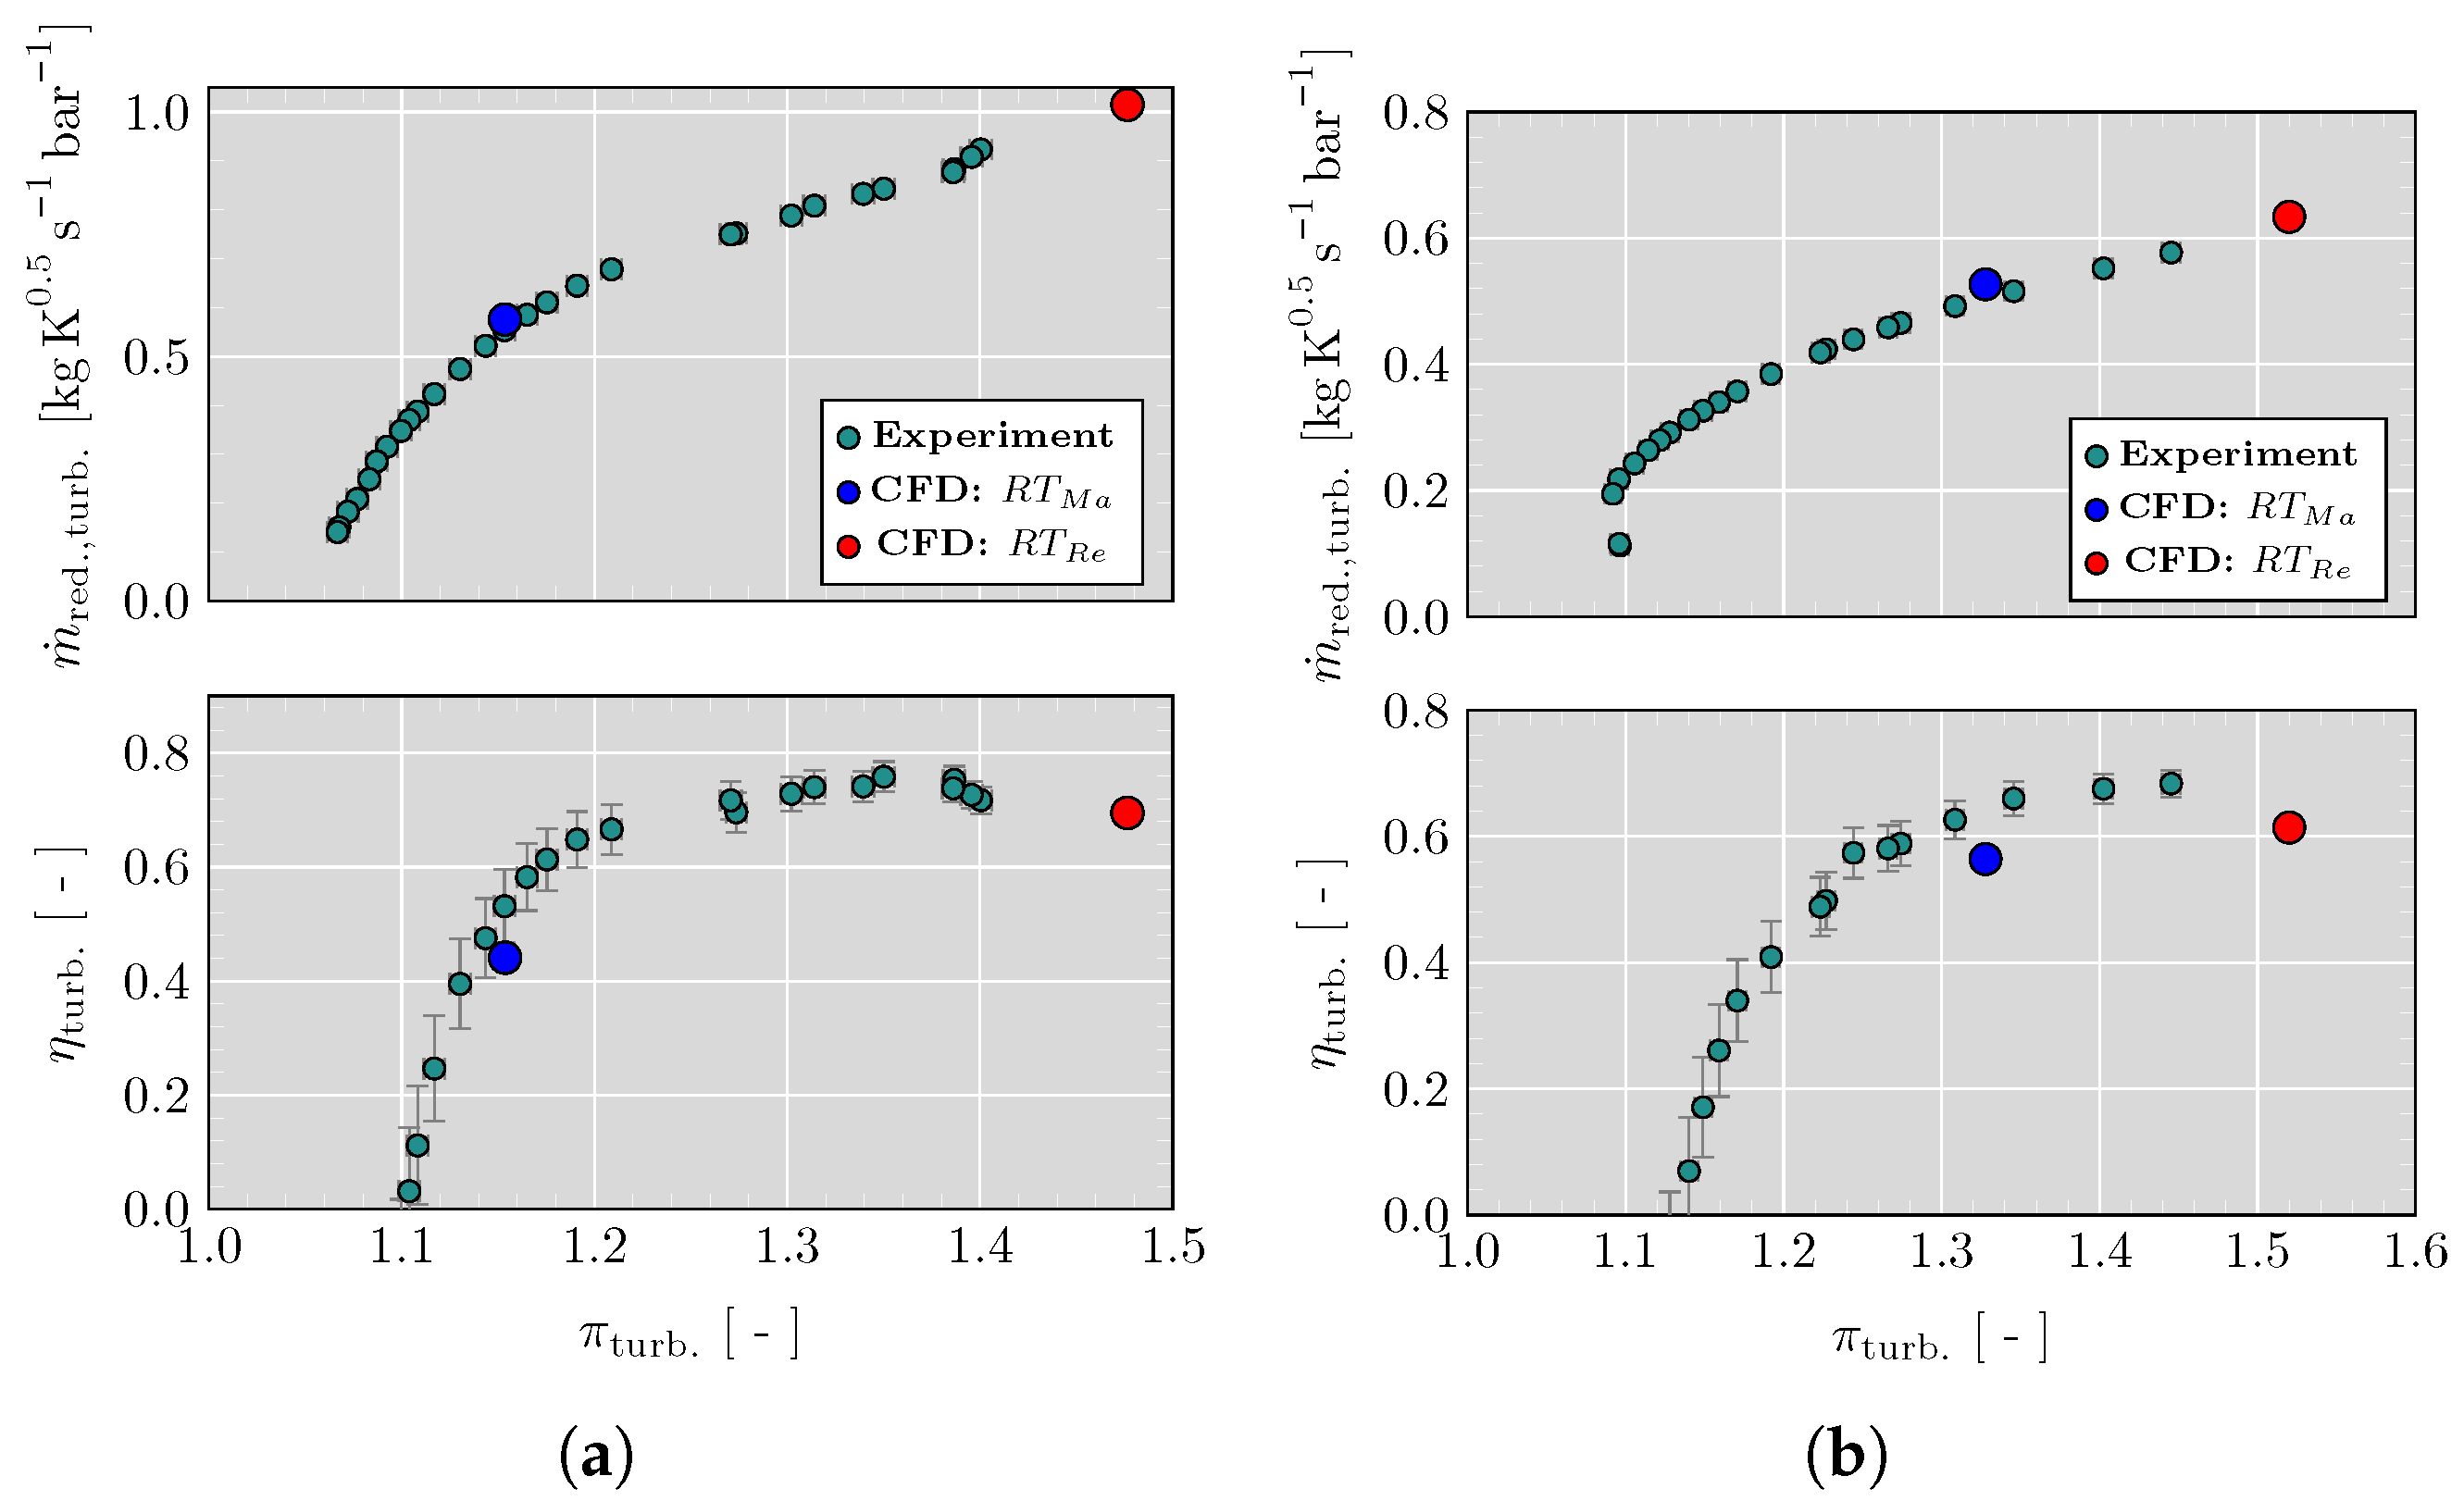
3.1. Validation
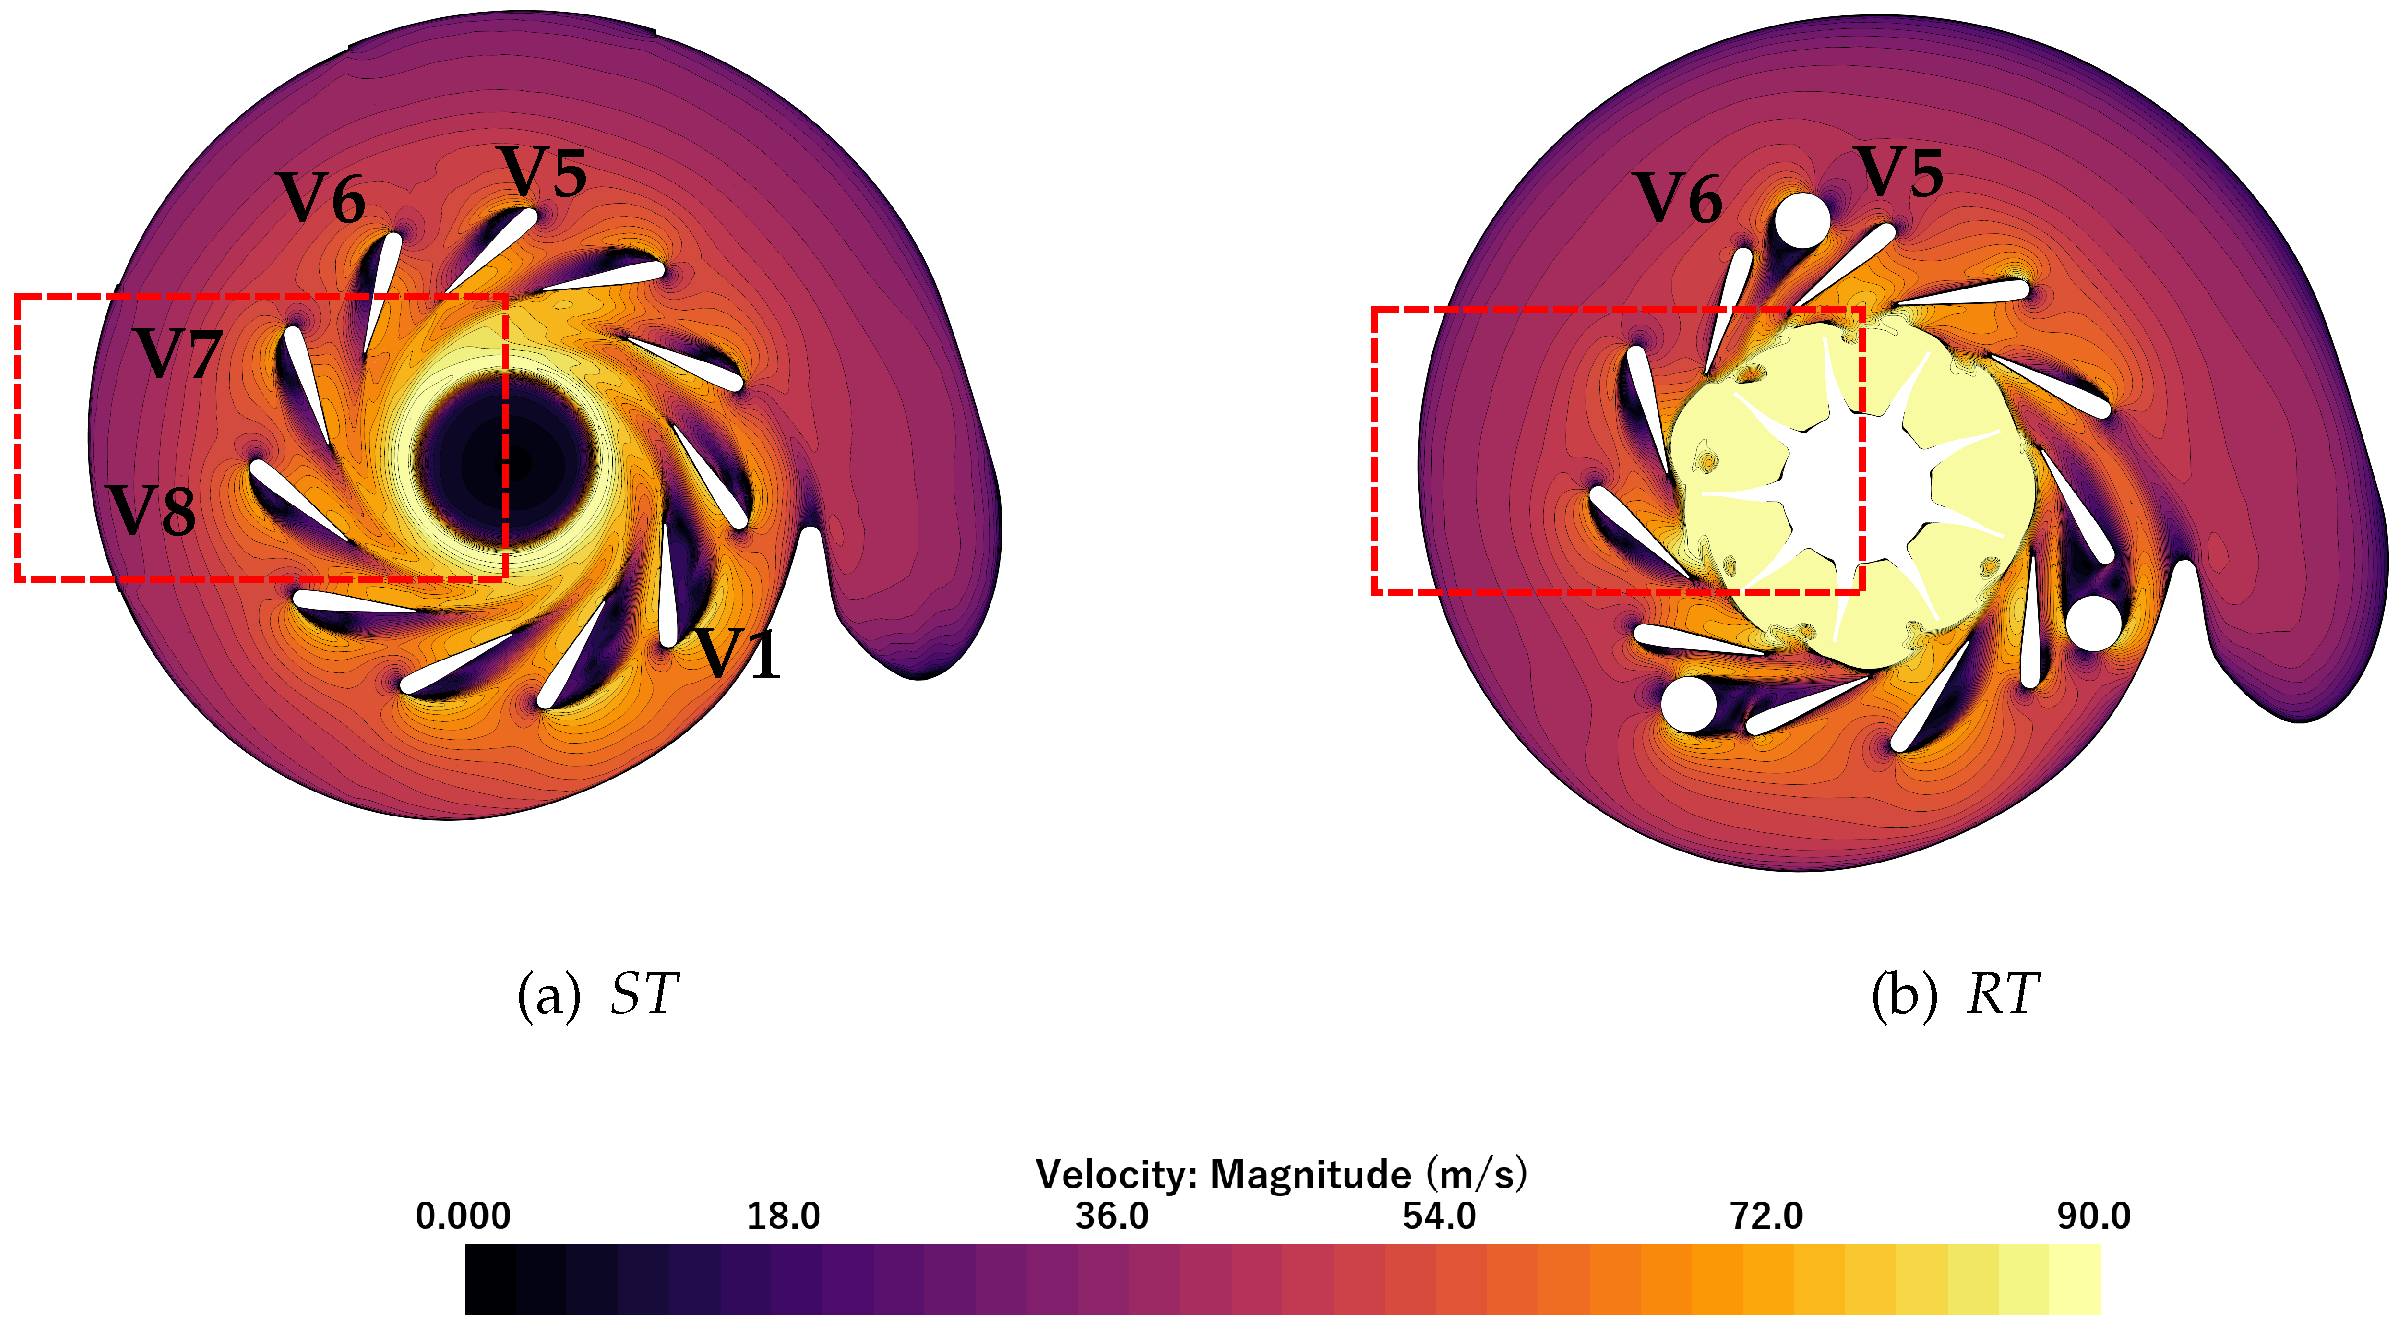
3.2. Gap Height Variation
4. Conclusions
Author Contributions
Funding
Institutional Review Board Statement
Informed Consent Statement
Data Availability Statement
Conflicts of Interest
Abbreviations
| CFD | Computational Fluid Dynamics |
| EU | European Union |
| MFR | Mass Flow Rate |
| SS | Suction Side |
| PS | Pressure Side |
| RT | Real Turbine |
| ST | Scaled Turbine |
| LE | Leading Edge |
| TE | Trailing Edge |
| PR | Pressure Ratio |
| RANS | Reynolds Average Navier–Stokes |
| VGT | Variable Geometry Turbine |
| Roman Letters | |
| Mach Number | |
| Reynolds Number | |
| Mass Flow | |
| Reduced Mass Flow | |
| p | Pressure |
| I | Turbulence Intensity |
| l | Turbulence Length Scale |
| h | Tip Gap Height |
| Greek Letters | |
| Stator Blade Angle | |
| Efficiency | |
| Dynamic Viscosity | |
| Corresponding Pressure Ratio | |
| Flow Angle | |
| Subscripts and Superscripts | |
| Turbine Inlet Section | |
| Mach Similarity | |
| Reduced Numbers | |
| Reynolds Similarity | |
| Relative Value | |
| s | Static Conditions |
| Stator Vane or Rotor Blade Surface | |
| Total or Stagnation Conditions | |
| Total-To-Static Value | |
References
- Yaumi, A.L.; Bakar, M.A.; Hameed, B. Recent advances in functionalized composite solid materials for carbon dioxide capture. Proc. ICE Energy 2017, 124, 461–480. [Google Scholar] [CrossRef]
- Williams, M.; Minjares, R. A Technical Summary of Euro 6-VI Vehicle Emission Standards; European Commission; International Council for Clean Transportation (ICCT): Washington, DC, USA, 2016; pp. 1–17. [Google Scholar]
- Commission Regulation (EU) 2016/427 of 10 March 2016 Amending Regulation (EC) No. 692/2008 as Regards Emissions from Light Passenger and Commercial Vehicles (Euro 6), 2016; European Union: Maastricht, The Netherlands, 2016.
- Praveena, V.; Martin, M. A review on various after treatment techniques to reduce NOx emissions in a CI engine. J. Energy Inst. 2018, 91, 704–720. [Google Scholar] [CrossRef]
- Joshi, M.; Shaver, G.; Vos, K.; McCarthy, J.; Farrell, L.A. Internal exhaust gas recirculation via reinduction and negative valve overlap for fuel-efficient aftertreatment thermal management at curb idle in a diesel engine. Int. J. Engine Res. 2021, 23, 11. [Google Scholar] [CrossRef]
- Pla, B.; Bares, P.; Sanchis, E.; Aronis, A. Ammonia injection optimization for selective catalytic reduction aftertreatment systems. Int. J. Engine Res. 2021, 22, 2169–2179. [Google Scholar] [CrossRef]
- Cheng, L.; Dimitriou, P.; Wang, W.; Peng, J.; Aitouche, A. A novel fuzzy logic variable geometry turbocharger and exhaust gas recirculation control scheme for optimizing the performance and emissions of a diesel engine. Int. J. Engine Res. 2020, 21, 1298–1313. [Google Scholar] [CrossRef]
- Sindhu, R.; Rao, G.P.; Murthy, K. Effective reduction of NOx emissions from diesel engine using split injections. Alex. Eng. J. 2018, 57, 1379–1392. [Google Scholar] [CrossRef]
- Pla, B.; Piqueras, P.; Bares, P.; Aronis, A. Simultaneous NOx and NH 3 slip prediction in a SCR catalyst under real driving conditions including potential urea injection failures. Int. J. Engine Res. 2021, 23, 14680874211007646. [Google Scholar]
- Inaba, K.; Ojima, Y.; Masuko, Y.; Kobashi, Y.; Shibata, G.; Ogawa, H. Thermal efficiency improvement with super-charging and cooled exhaust gas recirculation in semi-premixed diesel combustion with a twin peak shaped heat release. Int. J. Engine Res. 2019, 20, 80–91. [Google Scholar] [CrossRef]
- Kunanoppadon, J. Thermal Efficiency of a Combined Turbocharger Set with Gasoline Engine. Am. J. Eng. Appl. Sci. 2010, 3, 342–349. [Google Scholar] [CrossRef]
- Mahmoudi, A.R.; Khazaee, I.; Ghazikhani, M. Simulating the effects of turbocharging on the emission levels of a gasoline engine. Alex. Eng. J. 2017, 56, 737–748. [Google Scholar] [CrossRef]
- Enisu, M.; Terakawa, Y.; Ibaraki, S. Mitsubishi turbocharger for lower pollution cars. Mitsubishi Heavy Ind. Tech. 2004, 41, 1–3. [Google Scholar]
- Germanand, J.; Isenstadt, A. Downsized Boosted Gasoline Engines. Int. Counc. Clean Transp. 2016, 22, 1–13. [Google Scholar]
- Serrano, J.; Piqueras, P.; la Morena, J.D.; Gómez-Vilanova, A.; Guilain, S. Methodological analysis of variable geometry turbine technology impact on the performance of highly downsized spark-ignition engines. Energy 2021, 215, 119122. [Google Scholar] [CrossRef]
- Benajes, J.; Novella, R.; Gomez-Soriano, J.; Barbery, I.; Libert, C. Advantages of hydrogen addition in a passive pre-chamber ignited SI engine for passenger car applications. Int. J. Engine Res. 2021, 45, 13219–13237. [Google Scholar] [CrossRef]
- Yip, H.L.; Srna, A.; Yuen, A.C.Y.; Kook, S.; Taylor, R.A.; Yeoh, G.H.; Medwell, P.R.; Chan, Q.N. A Review of Hydrogen Direct Injection for Internal Combustion Engines: Towards Carbon-Free Combustion. Appl. Sci. 2019, 9, 4842. [Google Scholar] [CrossRef] [Green Version]
- Kerviel, A.; Pesyridis, A.; Mohammed, A.; Chalet, D. An Evaluation of Turbocharging and Supercharging Options for High-Efficiency Fuel Cell Electric Vehicles. Appl. Sci. 2018, 8, 2474. [Google Scholar] [CrossRef] [Green Version]
- European Commission. Hydrogen Energy and Fuel Cells: A Vision for Our Future; European Commission: Karlsruhe, Germany, 2003. [Google Scholar]
- Suhrmann, J.F.; Peitsch, D.; Gugau, M.; Heuer, T. On the Effect of Volute Tongue Design on Radial Turbine Performance. Turbo Expo Power Land Sea Air 2012, 8, 891–901. [Google Scholar] [CrossRef]
- Cravero, C.; Leutcha, P.J.; Marsano, D. Simulation and Modeling of Ported Shroud Effects on Radial Compressor Stage Stability Limits. Energies 2022, 15, 2571. [Google Scholar] [CrossRef]
- Galindo, J.; Serrano, J.R.; Garcia-Cuevas, L.M.; Medina, N. Using a CFD analysis of the flow capacity in a twin-entry turbine to develop a simplified physics-based model. Aerosp. Sci. Technol. 2021, 112, 106623. [Google Scholar] [CrossRef]
- Mehrnia, S.; Miyagawa, K.; Kusaka, J.; Nakamura, Y. Radial turbine optimization under unsteady flow using nature-inspired algorithms. Aerosp. Sci. Technol. 2020, 103, 105903. [Google Scholar] [CrossRef]
- Marsan, A.; Moreau, S. Analysis of the flow structure in a radial turbine. In Proceedings of the 11th European Conference on Turbomachinery Fluid Dynamics & Thermodynamics, Madrid, Spain, 23–25 March 2015. [Google Scholar]
- Maki, H.; Mori, Y. On the Study of the Flow through an Impeller of Mixed and Inward-Flow Radial Turbines: 3rd Report, Interference with the Flow from the Circular Nozzle. Jpn. Soc. Mech. Eng. 1973, 16, 81–92. [Google Scholar] [CrossRef]
- Binder, N.; Guyaderand, S.L.; Carbonneau, X. Analysis of the Variable Geometry Effect in Radial Turbines. ASME. J. Turbomach. 2012, 134, 041017. [Google Scholar] [CrossRef] [Green Version]
- Zhu, C.; Shao, W.Y.; Ma, Z.Y.; Lv, G.C.; Wang, X.F. Investigation on Interaction between Geometry and Performance and Design of S-CO2 Radial Inflow Turbine’s Vaneless Inlet Volute. In Proceedings of the Fourth Chinese International Turbomachinery Conference (CITC 2020), Nanchang, China, 10–13 April 2020. [Google Scholar]
- Giersch, T.; Hönisch, P.; Beirow, B.; Kühhorn, A. Forced response analyses of mistuned radial inflow turbines. J. Turbomach. 2013, 135, 031034. [Google Scholar] [CrossRef]
- Píštěk, V.; Kučera, P.; Fomin, O.; Lovska, A. Effective mistuning identification method of integrated bladed discs of marine engine turbochargers. J. Mar. Sci. Eng. 2020, 8, 379. [Google Scholar] [CrossRef]
- Tiseira, A.; Garcia-Cuevas, L.; Inhestern, L.; Echavarria, J. Development of Choked Flow in Variable Nozzle Radial Turbines. Int. J. Engine Res. 2021, in press. [Google Scholar] [CrossRef]
- Galindo, J.; Arnau, F.J.; Garcia-Cuevas, L.M.; Soler, P. Experimental validation of a quasi-two-dimensional radial turbine model. Int. J. Engine Res. 2020, 21, 915–926. [Google Scholar] [CrossRef]
- Tiseira, A.; Navarro, R.; Inhestern, L.; Hervás, N. Design and Numerical Analysis of Flow Characteristics in a Scaled Volute and Vaned Nozzle of Radial Turbocharger Turbines. Energies 2020, 13, 2930. [Google Scholar] [CrossRef]
- Sharma, S.; Garcia-Tiscar, J.; Allport, J.M.; Barrans, S.; Nickson, A.K. Evaluation of modelling parameters for computing flow-induced noise in a small high-speed centrifugal compressor. Aerosp. Sci. Technol. 2020, 98, 105697. [Google Scholar] [CrossRef]
- Pan, L.; Yang, M.; Murae, S.; Sato, W.; Shimohara, N.; Yamagata, A. Influence of tip clearance distribution on blade vibration of vaneless radial turbine. Proc. Inst. Mech. Eng. Part J. Automob. Eng. 2022, 236, 1007–1018. [Google Scholar] [CrossRef]
- Serrano, J.R.; Gil, A.; Navarro, R.; Inhestern, L.B. Extremely low mass flow at high blade to jet speed ratio in variable geometry radial turbines and its influence on the flow pattern: A CFD analysis. In Proceedings of the ASME Turbo Expo 2017: Turbomachinery Technical Conference and Exposition, Charlotte, NC, USA, 26–30 June 2017. [Google Scholar]
- Dufour, G.; Carbonneau, X.; Arbez, P.; Cazalbou, J.B.; Chassaing, P. Mesh-generation parameters influence on centrifugal compressor simulation for design optimization. In Proceedings of the Heat Transfer Summer Conference, Charlotte, NC, USA, 11–15 July 2004; Volume 46911, pp. 609–617. [Google Scholar]
- Menter, F.R.; Kuntz, M.; Langtry, R. Ten years of industrial experience with the SST turbulence model. Turbul. Heat Mass Transf. 2003, 4, 625–632. [Google Scholar]
- Baar, R.; Biet, C.; Boxberger, V.; Mai, H.; Zimmermann, R. New evaluation of turbocharger components based on turbine outlet temperature measurements in adiabatic conditions. In Proceedings of the ISROMAC-15, Honolulu, HI, USA, 24–28 February 2014; pp. 24–28. [Google Scholar]
- Zimmermann, R.; Baar, R.; Biet, C. Determination of the isentropic turbine efficiency due to adiabatic measurements and the validation of the conditions via a new criterion. Proc. Inst. Mech. Eng. Part J. Mech. Eng. Sci. 2018, 232, 4485–4494. [Google Scholar] [CrossRef] [Green Version]
- Serrano, J.R.; Tiseira, A.; Garcia-Cuevas, L.M.; Inhestern, L.B.; Tartoussi, H. Radial turbine performance measurement under extreme off-design conditions. Energy 2017, 125, 72–84. [Google Scholar] [CrossRef] [Green Version]
- Spence, S.W.T.; O’Neill, J.; Cunningham, G. An investigation of the flowfield through a variable geometry turbine stator with vane endwall clearance. Proc. Inst. Mech. Eng. Part J. Power Energy 2006, 220, 899–910. [Google Scholar] [CrossRef]


| Scaled Turbine | Real Turbine | |
|---|---|---|
| (ST) | (RT) | |
| Blade number | 11 | 11 |
| Chord length | 52.5 mm | 17.5 mm |
| Vane height | 24 mm | 8 mm |
| Tip height | 1.5 and 0.5 mm | 0.2 mm |
| Tip-to-vane ratio | 0.063 and 0.021 | 0.025 |
| Blade angle- | 51 65 73 | 53 63 73 |
| VGT opening |
| m [kg s] | 0.183 | 0.320 | 0.0365 | 0.062 |
| [kg K s bar] | 3.160 | 5.198 | 0.577 | 0.736 |
| [bar] | 1.073 | 1.141 | 1.175 | 1.560 |
| [bar] | 1 | 1 | 1 | 1 |
| [K] | 343.15 | 343.15 | 343.15 | 343.15 |
| [N s m] | 1.855 × 10 | 1.855 × 10 | 1.855 × | 1.855 × |
| 1.269 × | 2.219 × | 0.759 × | 1.289 × | |
| 0.1 | 0.1 | 0.04 | 0.04 | |
| l [m] | 0.01 | 0.01 | 0.003 | 0.003 |
| m [kg s] | 0.141 | 0.320 | 0.0385 | 0.0484 |
| [kg K s bar] | 2.396 | 4.738 | 0.526 | 0.575 |
| [bar] | 1.086 | 1.252 | 1.357 | 1.560 |
| [bar] | 1 | 1 | 1 | 1 |
| [K] | 343.15 | 343.15 | 343.15 | 343.15 |
| [N s m] | 1.855 × | 1.855 × | 1.855 × | 1.855 × |
| 0.978 × | 2.219 × | 0.801 × | 1.007 × | |
| 0.1 | 0.1 | 0.04 | 0.04 | |
| l [m] | 0.01 | 0.01 | 0.003 | 0.003 |
Publisher’s Note: MDPI stays neutral with regard to jurisdictional claims in published maps and institutional affiliations. |
© 2022 by the authors. Licensee MDPI, Basel, Switzerland. This article is an open access article distributed under the terms and conditions of the Creative Commons Attribution (CC BY) license (https://creativecommons.org/licenses/by/4.0/).
Share and Cite
Serrano, J.R.; Tiseira, A.O.; López-Carrillo, J.A.; Hervás-Gómez, N. Numerical Evaluation in a Scaled Rotor-Less Nozzle Vaned Radial Turbine Model under Variable Geometry Conditions. Appl. Sci. 2022, 12, 7254. https://doi.org/10.3390/app12147254
Serrano JR, Tiseira AO, López-Carrillo JA, Hervás-Gómez N. Numerical Evaluation in a Scaled Rotor-Less Nozzle Vaned Radial Turbine Model under Variable Geometry Conditions. Applied Sciences. 2022; 12(14):7254. https://doi.org/10.3390/app12147254
Chicago/Turabian StyleSerrano, José Ramón, Andrés Omar Tiseira, Juan Antonio López-Carrillo, and Natalia Hervás-Gómez. 2022. "Numerical Evaluation in a Scaled Rotor-Less Nozzle Vaned Radial Turbine Model under Variable Geometry Conditions" Applied Sciences 12, no. 14: 7254. https://doi.org/10.3390/app12147254