Article

Analysis of Load-Settlement Curve Based on Load Transfer at Pile-Soil Interface

1
School of Civil Engineering, Northeast Forestry University, Harbin 450001, China
2
School of Information Engineering, Shandong Vocational and Technical University of International Studies, Rizhao 276526, China
3
School of Civil Engineering, Southeast University, Nanjing 210096, China
*
Author to whom correspondence should be addressed.
Appl. Sci. 2022, 12(14), 7150; https://doi.org/10.3390/app12147150
Submission received: 9 June 2022 / Revised: 30 June 2022 / Accepted: 12 July 2022 / Published: 15 July 2022

Abstract

:
A field pile loading test was carried out on the Peshawar–Karachi Motorway (PKM) project in Pakistan to show the settling mechanism of bored pile foundation in pulverized soil and the force characteristics of frictional resistance at the pile-soil interface. The changes in pile lateral frictional resistance and pile settlement during the loading-unloading process of test piles were measured and analyzed, as well as the load-settlement distribution characteristics of test piles in different soil layers, the distribution of test pile internal forces, and the changes in pile-soil relative displacement. It was established that there was considerable deterioration of pile lateral frictional resistance and residual deformation of pile tip displacement throughout the test pile load-settlement process, and the association between the pile-soil interface frictional resistance and pile-soil relative displacement was addressed. The results reveal that the frictional resistance at the pile-soil interface is directly connected to the nature of the soil layer, with a positive connection between the natural density, specific gravity, compression deformation, and the plastic index under immediate load, and a negative correlation between the natural moisture content, compression coefficient, and settlement variations after unloading. The load-settlement of the pile rose in a non-linear proportion during the loading-unloading operation, with a maximum settlement value at the pile top of 8.14 mm and a residual deformation at the pile bottom of 1.94 mm. The frictional resistance of the pile perimeter was distributed non-linearly throughout the pile depth, and the frictional resistance of the pile-soil interface was severely deteriorated at an embedded depth of 15 m, with the degradation degree of the silty soil layer being significantly smaller than that of the silty clay soil. The relative pile-soil displacement was positively linked with the lateral frictional resistance of the pile under the same load, and the correlation coefficient in silty soil was much greater than that in sandy soil.

1. Introduction

The static load test is a reliable pile bearing capacity test method, but the pile self-anchor test provides a novel pile bearing capacity test method by employing pile bottom anchor technology to supply a reaction force for the test, and the pile, subsoil, and pile bottom anchor compose a sort of internal force transfer system due to the displacement and deformation of the pile bottom soil (rock) layer under the action of the pile and anchor load, thereby resulting in the change [1]. The static load test can better reflect the real operation of the pile foundation. The pile-soil variation is determined by the nature of the soil around the pile [2], the water content [3], the pile lateral soil pressure [4], the roughness of the pile [5], and the sinking rate of the pile [6] during static compression.
Currently, the load-bearing performance of foundation piles is calculated using the following methods: elastic theory technique, load transfer method, shear displacement method, numerical calculation method, and so on [7]. Yu et al. [7] analyzed the quasi-static expansion of a cylindrical or spherical cavity in an infinite dilatant elastic–plastic soil and gave the closed form solutions for the stress and displacement fields in the soil during the expansion of the cavity. Tran et al. [8] investigated the lateral strength parameters of the pile-soil interface by numerically calculating the interface strength parameters, and the results showed that the interface strength parameters increased with an increasing depth of burial and converged to a constant value at a depth of 4R (R is the pile diameter). However, it was more complicated to simulate the process of piles entering the soil by numerical methods, which involves the nature and parameters of soil [9,10], soil ontology [11], the properties of the pile-soil interface [12], the universality of simulation results [13], as well as the limitations of the numerical method, etc. [14,15,16]. Given this, it was impossible to accurately simulate the pile pressing process.
As a result, numerous academics performed indoor simulation experiments to explore and analyze pile-soil displacement and pile-soil interaction during the loading-unloading process. Zhang et al. [17] investigated the mechanical properties of the pile-soil interface in cohesive soil by indoor simulation experiments, and it was found that clays with a different roughness and moisture content had different effects on the shear strength and parameters of the pile-soil interface, with higher roughness and higher moisture content having a smaller effect on the shear strength. Therefore, the mechanical performance of the pile-soil interface was governed by the roughness, water content, and shear rate. Seo et al. [18,19] performed series of in situ pullout experiments on soil-nailing systems using both pressurized grouting and common gravitational grouting to compare the pullout loads of both cases and to verify the effectiveness of the pressurized grouting on the soil-nailing system. The pullout load of soil nailing using pressurized grouting was approximately 36% higher than that of soil nailing using gravitational grouting. This was attributed to the additional compaction of soil by cavity expansion and the increase in the residual stress and the dilatancy angle by pressurized grouting. Based on the Brillouin Optical Time Domain Reflectometry (Gossen Metrawatt GmbH, Nürnberg, Germany) (BOTDR) fiber optic strain profile, the profiles of axial load, skin friction, and displacement can be obtained.
Meanwhile, numerous researchers had studied the influence of stress history on the friction coefficient and cohesiveness at the pile-soil interface using loading-unloading systems. A. Franza et al. [20] investigated the sinking process of hydrostatic piles in sandy soils utilizing indoor half-pile model tests, revealing the movement patterns of the soil at different locations around the piles. It was well known that the method of installation of pile foundations had a great influence on the behavioral characteristics of the piles. Most of the current research on the installation form of pile foundations focused on driven piles and hydrostatic piles, but there was some research on the pile-soil interface characteristics of bored piles under hydrostatic pressure [21,22,23]. Wu et al. [24] analyzed the mechanical behaviors and law of the grouting mode transition of the unloading grout sand–concrete interface with different grout conditions. Kasper et al. [25] investigated the influence of the soil and grout material properties as well as, the cover depth on the surface settlements and the loading and deformation of the tunnel lining in shield-driven tunnels. Akhtar Hossain et al. [26] investigated the strength of soil-nails that depend on the behavior of the soil–cement grout interface at saturated and unsaturated conditions. As well, the dilation values of the soil–cement interface for different grouting pressures were less than that of completely decomposed granite (CDG) soil under different suctions. The interface shear strength increased with the grouting pressure at saturated conditions, in which a downward trend was obvious—as the suction value was increased from saturated conditions. Wang et al. [27] investigated the effect of grouting volume on the shearing characteristics of the interface between cohesive soil and concrete piles with different roughness, and combined grouting equipment and a direct shear apparatus to carry out a total of 48 groups of direct shear tests on cohesive soil–concrete interfaces that incorporate the grouting process. The test results showed that the shear behavior of the grouted cohesive soil–concrete interface was improved mainly because of the increase in the grouting volume, and the roughness increased the interfacial apparent cohesion.
Recent advances in strain measurement using optical fibers provide new opportunities for monitoring the performance of piles. If the pile-soil interaction (e.g., load transfer functions t–z or p–y) is of interest, then BOTDR optical fiber sensing may be sufficient when a continuous distribution of axial forces and/or bending moments needs to be established [28]. Klar et al. [29] discussed the advantages of distributed strain measurement by BOTDR compared to conventional discrete measurements (e.g., strain sensors) through the theoretical analysis of the pile-soil interaction problems. Pelecanos et al. [30] discussed the BOTDR-distributed monitoring technology and explored its application in a number of pile load test cases (both top-loaded using an external reference frame and bidirectionally loaded using an Osterberg cell) in London.
The investigations above show that the properties of the pile-soil interface are affected by a variety of factors, and so far, static load experiments have mostly been static load test studies with indoor simulations and numerical simulations, with a lack of actual field static load test studies of infill piles. As a result, there is no accurate knowledge of the pressure, mechanical, and interface properties of bored piles under a static load of pulverized soil. The authors investigated test piles 1–3 of a 150 m long bridge (QK667) near the town of Uch Sharif in Pakistan’s Peshawar–Karachi Motorway (PKM) project for this purpose. Monitoring of on-site pile load tests, indoor tests, and theoretical analysis were used to investigate the stress characteristics, settlement, and displacement of monopiles in pulverized sandy soil under a vertical load. This paper will serve as a theoretical foundation for the subsequent design of similar projects and has significant value for engineering applications.

2. Fundamental Principles

2.1. Soil Compression Settlement

The earth beneath the pile foundation compresses and deforms due to the external load of the pile foundation, creating settlement, and the ultimate settlement S may be described as follows [31]:
S = m s i = 1 n Δ S i = m s i = 1 n σ z = 0 E s i z i C i z i 1 C i 1
In which, S is the foundation’s ultimate settlement (mm); n is the number of soil layers in the compression layer; σz(0) is the value of extra stress at the base ground (kPa); σh is the base compressive stress(kPa), when z/b > 1, σh adopts the base’s average stress, and when z/b < 1, σh adopts the compressive force at the greatest compressive stress point b/3~b/4 in the graph of average stress at the base; b is the width of the foundation (m); γ is the capacitive weight of soil; h is depth of base embedment (m); and zi, zi−1 is the distance between the bottom of the i-th and i−1-th layers of the substrate (m).
The depth control standard for settlement computation is expressed as follows:
Δ S n 0.025 i = 1 n Δ S i
In which, ∆Si is the compression of the i-th layer of soil; ∆Sn is the settlement value of the corresponding soil layer (mm); Esi is the compression modulus of the corresponding soil layer (kPa); Ci, Ci−1 is the average coefficient of extra stress in the relevant soil layer; and ms is the empirical correction coefficient of settlement.

2.2. Pile Foundation Compression Settlement

The eventual settlement of the pile foundation can be expressed as follows [32,33]:
s = Ψ Ψ e s , = Ψ Ψ e j = 1 m p 0 j i = 1 n z i j α ¯ i j z ( i 1 ) j α ¯ ( i 1 ) j E s i
In which, s is the ultimate pile foundation settlement(mm); s’ is the pile foundation settlement using the Boussinessq solution (mm); Ψ is the settlement empirical correction coefficient; Ψe is the pile foundation’s equivalent settlement coefficient; m indicates the quantity of rectangular loads; P0j is the amount of increased compressive stress in the j-th rectangular block, expressed in (kPa); n represents the quantity of crushed soil layers; Esi is the compression modulus of the corresponding soil layer(MPa); zij, z(i−1)j is the embedded depth of the corresponding soil layer (m); and α ¯ i j , α ¯ ( i 1 ) j is the average extra stress coefficient of the corresponding soil-layer-embedded depth.
The criteria for limiting the calculated depth of the pile settlement can be expressed as follows:
σ z 0.2 σ c ,   σ z = j = 1 m a j p 0 j
In which, aj is the coefficient of additional stress.

2.3. Relative Pile-Soil Displacement

The relative displacement of the pile soil is the displacement of the soil at a certain distance (no displacement change). As a result, the relative pile-soil displacement achieved in the test is the change in pile displacement at that depth. Therefore, the pile-soil relative displacement Srsi may be calculated as follows [34,35]:
S r s i = S t j = 1 i L j 2 ε j + ε j + 1
In which, Lj is the embedded length of the j-th pile section; St is the settlement of the pile top; and εj, εj+1−j, and εj+1 are the section reinforcement strain.

3. Overview of the Experiment

3.1. Overview of the Test Project

The test piles were a non-bearing pier foundation located 3 km west of Uch Sharif, Pakistan, near the QK667 long bridge. The test piles were surveyed and sampled early on, and their stratigraphic lithology is detailed in Table 1. Its borehole sample and calibration studies revealed that the horizontal distribution was homogeneous, and that vertical stratification was visible, with a horizontal groundwater height of 3.4 m.

System for Testing Load-Bearing Capability

This experiment was meant to investigate the settlement deformation of a single-pile under vertical load in accordance with the main technical specifications of the Pakistan National Highway Administration and ASTM D1143. The test pile was a single bored pile of 30 m length and 1.2 m diameter composed of C30 gravel concrete, with the reinforcing set according to the drawing-required specifications, and the maximum designed load of the single pile was 2191 KN (refer to Figure 1).

3.2. Sensors Installation

Sensors Arrangement

On top of the pile, a flat plate with a larger diameter than the pile was installed. The gap between the inner and outer pipes was 20 mm to accommodate the microsensor’s installation space and to prevent soil from entering the test pile and damaging the sensor. Temperature self-compensating, fiber-grating soil pressure sensors and dial indicators were installed on the loading platform on top of the pile to monitor the change in pile-driving resistance during the pile-driving process. The soil pressure and pore water pressure of the pile-soil interface were measured in real time using the CF3820 high-speed static signal test analyzer (refer to Figure 2). A silicon piezoresistive pressure sensor was embedded in the opening of the test pile to directly measure the radial earth pressure at the pile-soil interface. Table 2 shows the sensor’s specific parameters.
At the position where the sensor was installed on the pile, a circular hole with a diameter of 20 mm was opened, and a cylindrical casing with a diameter of 20 mm and a height of 10 mm was welded at the aperture. The sensor side was equally coated with epoxy resin and inserted into the cylindrical sleeve, with the sensor surface flush with the pile surface. After the epoxy resin had hardened, the waterproof glue was applied to seal the sensors. The sensor’s data cable was routed through the space between the inner and outer tubes and into the designated outlet near the pile’s top.
Six sets of steel stress sensors were installed at varying depths in the pile to verify that the points are spaced as uniformly as possible in the pile. The pile top shaft force was measured with the first stress gauge, which was set to 0.00, and the pile end shaft force was measured with the last stress gauge, which was set 1 m above the pile end. To limit the inaccuracy, three stress sensors were symmetrically put at each depth portion.
The connecting steel pipe was lifted by 1.5 m and secured with clamps after lowering it to the bottom of the hole. The top 1.23 m was cut off, which is the sum of the original length of the settlement gauge (1.13 m) and half of the settlement range (0.1 m). The connecting steel pipe was lowered to the bottom of the hole after connecting it to the settlement sensors via a threaded sleeve (refer to Figure 3). The serpentine tube was lifted from the settlement gauge and adjusted for the initial reading to ensure that it is between 50% and 75% of the settlement range. The settlement meter flange was installed and secured with cement mortar.

3.3. Loading Test Program

The experimental platform length for test piles S1#, S2#, and S3# was 10 m; the width was 7 m; and the height was 7.5 m. The working load of the pile was 2191 KN, and the maximum test load was 4382 KN. The platform was loaded with bagged sand (refer to Figure 1) and the total weight of its upper part was 4820 KN. The maximum load of the bearing device was 5258 KN, and the actual loading weight was 640 t. When loading a single pile, the load was applied in graded increments of 15% of the intended weight—which was 789 KN—and the actual load was 80 t for 8 times, with each load level maintained for 1 h for a total of 8 h. After, the maximum load (600 t) was applied, and the overall test time reached 12 h. When the observed axial movement did not exceed 0.25 mm for more than 1 h, the unloading began at 25% of the maximum test load—i.e., 1315 KN—and the actual unloading was 160 t. The reduction time interval was 1 h, which was repeated 4 times for a total of 4 h.

4. Analysis of Pile Settlement Mechanism

To explore the piles’ settlement mechanism, in-situ soils of various depths ranging from 0 m to 35 m were drilled for research (see Figure 4), and the piles’ settlement process was evaluated by investigating the physical characteristics of the soil samples in the holes.

4.1. Analysis of Basic Physical Parameters

As shown in Figure 5, the natural moisture content of the examined in-situ soil samples is between 23.8% and 28.2%, the density is between 1.56 and 1.96 g/cm3, and the specific gravity is between 1.91 and 2.99, as shown in Figure 3. The value of the natural water content exhibits an up-and-down tendency with increasing depth. The natural water content of the soil samples diminishes with increasing depth, revealing a trough buried at a depth of 15 m. The natural moisture content of the soil samples progressively increases and levels out between 15 and 35 m of burial depth; the density increases with depth and fluctuates noticeably. The density increases to 1.96 g/cm3 at 17.8 m and lowers to 1.61 g/cm3 at 19.4 m; other depths seem to remain steady. The specific gravity increases with burial depth, peaking at 2.68 at 3.2 m; the shift is subtle with increasing depth, and the trend is mild, with values ranging between 2.62 and 2.99.

4.1.1. Liquid–Plastic Limit Test Analysis

The liquid limit (ωL) of the test soil sample is approximately 26.1% and the plastic limit (ωp) is approximately 22.1%, showing a trend change typical of rising up and down with depth, and its volatility is more obvious. The plastic index is 9.5 at the embedded depth of 5.6 m, and its type is medium-liquid limit silty sand with high water permeability; the plasticity index is 11.32 at the embedded depth of 10.7 m, the plasticity index is 12.43 at the embedded depth of 22.1 m, and the plasticity index is 12.29 at the embedded depth of 24 m—and the wave peaks arise with considerable variations. The medium-liquid limit silty clay is a medium compressive soil with low water permeability.

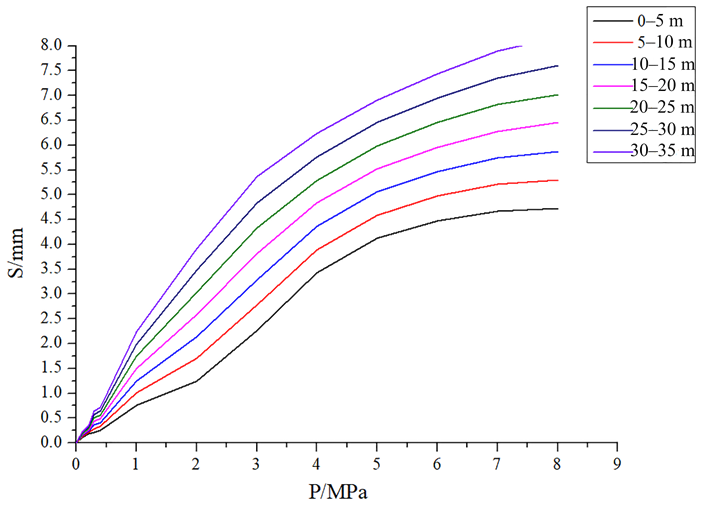
4.1.2. Analysis of Soil Sample Compression Deformation

As shown in Figure 6, the load curves at various depths show a similar tendency in the deformation of the seven groups of soil samples. When the soil sample pressure reaches 2 MPa, the deformation is more pronounced, and the variation trend is more apparent from 0–5 m. When the pressure reaches 6 MPa, the pressure gradually stabilizes, and the deformation gradient begins to gradually diminish and level out with increasing depth.

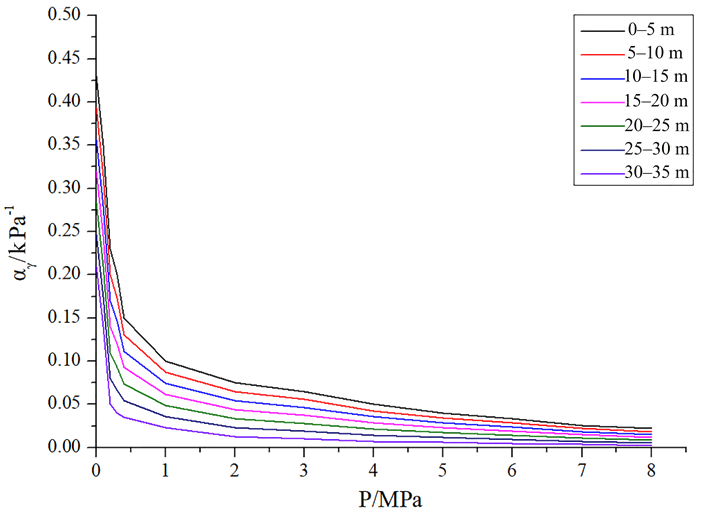
4.1.3. Analysis of Soil Compression Coefficients

As shown in Figure 7, the compression coefficient of the soil samples steadily declines with increasing depth, and its fluctuation pattern stays consistent, tending to moderate with increasing pressure. The compression coefficient drops significantly with extremely big variations when the soil sample is subjected to pressures ranging from 100–200 kPa. Soil samples at a depth of 0–15 m belong to extremely compressible soils, soil samples at a depth of 15–25 m belong to medium compressible soils, and soil samples at a depth of 25–30 m belong to low compressible soils.

4.2. Load-Settlement Fluctuation Law of Test Piles

As shown in Figure 8a,b, the measured settlement-time curves of test piles S1#, S2#, and S3# are essentially the same as the general “S-shaped” curve. The settlement of the pile increased in a linear proportion during the first 605 min of the loading process, and the major consolidation settlement rate of the soil is quicker with 0.197 mm/h for test pile S1#, 0.364 mm/h for test pile S2#, and 0.407 mm/h for test pile S3#. After 605 min, the consolidation rate of the soil steadily reduces and the settlement tendency gradually moderates; during the first 255 min of the unloading process, the settlement grew with the load steadily reducing, and the pile settlement rate gradually tended to lessen with the extension of time, with 0.23 mm/h for test pile S1#, 0.429 mm/h for test pileS2#, and 0.47 mm/h for test pile S3#. The elastic compression deformation and primary consolidation settling dominate settlement at this stage. After 255 min, the settlement pace has become moderate and soft and the settlement has essentially converged. This is due to an incomplete slag at the pile end of test pile S1#, which gradually hardened with pile top loading; The bearing layer of test piles S2# and S3# is primarily a pulverized sandy soil layer with some clay, which takes longer to consolidate and has a more visible settlement tendency.
The load-settlement curve of the test pile, as shown in Figure 9a–c, is of the slow-varying type. When the pile top load is modest, the pile top settlement of S1# is minimal and develops slowly, with a settlement of around 30 mm. The pile tip settlement is about 2.5 mm and the pile compression is approximately 27.5 mm. The top load-settlement of piles S2# and S3# grew more rapidly, where the pile top settlement is approximately 66 mm for test pile S3#, the pile end settlement is approximately 15 mm, and the pile compression is approximately 30 mm; while the pile top settlement is approximately 56 mm for pile S2#, the pile end settlement is approximately 12.5 mm, and the pile compression is31 mm. After unloading, the settlement of the pile top grows slowly for test heaps S1#, S2#, and S3#, whereas the settlement of the pile end practically did not create rebound for test pile S1#. Due to less silt at the bottom of the pile, no rebound was created when the pile bottom sediment solidified during unloading. Since pile compression, linear elastic deformation has happened, and hence the settlement change of the pile top is generally steady. Test piles S2# and S3# contain a thick layer of silty caly under the pile end, and the load of the pile end creates rebound and residual deformation during unloading; the final residual volume for test pile S2# is about 10 mm, and the final residual volume for test pile S3# is approximately 11 mm.
As shown in Figure 10, the load-pile compression curve is a percentage of the pile top settlement separated into four stages for test piles S1#, S2#, and S3#.
The first stage is 0–160 t, which means “unchanged stage”. At this stage, the pile top load is tiny, the pile end has not yet operated, and the maximum settlement of the pile end is around 0.5 mm, while the pile compression accounts for 99% of the pile top settlement—which practically all of the settlement originates from the pile compression at this time—and the test pile exhibits the characteristics of a pure friction pile.
The second stage is 160–240 t, which is known as the “slow change stage”. At this stage, the pile end begins to move gradually and the settlement rises in tandem with the load. The maximum settlement is around 2.6 mm. The compression accounts for 89% of the pile top settlement and the amount reduces as the pile top settlement falls. The pile’s nature changes from pure friction pile to end-bearing friction pile at this point, and the pile exhibits linear elastic compression.
The third stage is 240–320 t, often known as the “rapid change stage”. The pile compression varies substantially at this stage, owing to the increased pile top load, fast compression deformation of sediment, and draining consolidation of soil in the bearing layer near the pile end. As a result, pile compression is responsible for 45% of pile top settling. The quick increase in pile end settlement led to a rapid drop in pile compression as a percentage of pile top settlement.
The fourth stage is 320–640 t, also known as the “slow change stage”, which has considerably enhanced the qualities of the bearing layer at the pile end, decreased the settlement difference at the end of the test pile, and compressed the pile body. The settlement-to-pile-top ratio is quite steady, accounting for 44%, and the curve changes slowly.

4.3. Analysis of Internal Forces at the Pile-Soil Interface

4.3.1. Stress Analysis for Test Pile

The axial force steadily decreases from top to bottom as the depth increases for test piles S1#, S2#, and S3#, as illustrated in Figure 11a–c. However, at a depth range of 5.5 m from the pile end, the axial force grows less with depth. Due to the firm bearing layer at the pile end and the little relative displacement of the pile soil, the pile lateral resistance is reduced. When the load is minimal, the axial force of the bottom portion of the pile is near to zero; as the load grows, the bearing capacity of the pile end gradually increases; and as the weight increases, the pile end gradually comes into play, and the pile axial force increases. The axial force for test pile S1# is about 2600 KN under the specified maximum load, the axial force for test pile S2# is approximately 1000 KN, and the axial force for test pile S3# is approximately 2100 KN, accounting for 40.63%, 16.67%, and 32.81% of the pile top load, respectively.

4.3.2. Force Analysis of Pile-Soil Interface Friction Resistance

The connection between axial force and lateral friction resistance is stated in Equation (6). The lateral friction resistance of each layer of soil is considered to be the same during the calculation procedure, and τavgi is the average of the lateral frictional resistance in stratiform soil, which may be represented as follows [19]:
τ a v g i = P i P i 1 A i
In which, Pi and Pi+1 are the axial forces of the i-th and i+1-th sections, and Ai is the lateral area of the i-th layered pile.
Figure 12 depicts the distribution curves of the lateral frictional resistance along test piles Sl#, S2#, and S3# under various load levels.
For test piles S1#, S2#, and S3#, as illustrated in Figure 12a–c, the lateral frictional resistance is non-linearly distributed over the pile body and progressively increases with increasing pile top load. The lateral frictional resistance is greater in the higher and lower parts of the pile, whereas it is reduced at a depth of 15 m. The presence of a thick layer of silt soil on the lateral of a pile reduces the lateral frictional resistance, which is owed to lower rebound and loosening in silt soil, and soil tension is discharged with less degradation on the lateral of a pile. The highest value comes at 20 m of embedded depth, which is related to the softening phenomena of lateral frictional resistance and the minor rise in radial earth pressure in the silt clay layer; hence, the lateral frictional resistance reduces by varying degrees as load increases, and then progressively declines and sustains at a certain value.
Figure 13 depicts the connection between lateral frictional resistance and pile top load for test piles S1#, S2#, and S3#. Figure 11 shows that the lateral frictional resistance as a percentage of pile top load is around 100 percent for test piles S1#, S2#, and S3# at a low load (less than 160 t). The load is borne solely by the lateral frictional resistance at this point, and the test pile acts as a pure friction pile. With increasing pile top load, the pile end resistance tends to “slowly shift”, the lateral frictional resistance ratio progressively declines, and the pile end plays the function of “primary force”, at which point the test pile exhibits end-bearing friction pile transition characteristics.
When the pile top load achieves the intended load of 220 t, the ratio of lateral frictional resistance to the pile top load (i.e., the lateral frictional resistance ratio) for test piles S1#, S2#, and S3# is 91%, 93%, and 90%, respectively. The lateral frictional ratios of test piles S1#, S#, and S3# at maximum loads of 640 t are 75%, 75%, and 76%, respectively. It can be observed that the pile lateral frictional resistance at maximum load provides the majority of the test pile bearing capacity, while the pile end bearing capacity is only partially given, and the test pile plays the end-bearing friction pile characteristic at this stage.
As shown in Table 3, the lateral frictional resistance in clay, silty clay, pelitic silty sand, and silt with clay over 15 m of the test pile has varying degrees of weakening, i.e., the measured value to the geological report ratio is less than one. The lateral frictional resistance in silt with clay, clay, and silty sand below 15 m of the pile has a mild strengthening effect, i.e., the measured value to the geological report ratio is more than 1. The lateral dynamic resistance of the soil layer in the lower portion of the pile is not fully developed, with a ratio of only 0.772 between the measured and supplied values of the lateral dynamic resistance of the soil layer towards the pile end. This is mostly due to the poor soil quality of the shallow soil layer and the softening of the lateral resistance created by lateral slip damage during the static loading process, while the Poisson effect of lateral expansion and deformation of the pile is induced by the existence of the pile end resistance, which is one of the reasons for the weak strengthening impact of side friction resistance.

4.4. Displacement Analysis of Pile-Soil Interface

Under the same load, as shown in Figure 14a,b, the pile-soil relative displacement is negatively connected with pile length, which is a process that occurs gradually from the top to the bottom of the pile. Under a pile top load of 2400 KN, the pile-soil relative displacement increases considerably for test piles S1#, S2#, and S3#, rising 16.0 mm for test pile S1#, and 4.75 mm for the pile bottom, thereby resulting in less and less deformation and hardening in the slag. The relative displacement rises 12.3 mm at the top and 12.2 mm at the bottom for test piles S2# or S3#. Therefore, as the pile top weight grows, the thick layer of silty soil beneath the pile end compresses and deforms, causing the relative displacement of pile-soil to increase proportionally.
The field observation data is fitted by the Boltzmann curve model, and the analytical formula of the model is obtained:
S t = 21.035 10.854 1 + e x 26.29 0.496
R2 = 0.9985 is the correlation coefficient. As shown in Figure 15, the relative pile displacement increases with increasing pile lateral resistance, which is positively linked, and its slope is the correlation coefficient, which is directly connected to soil depth and soil parameters. The correlation coefficient in silt soil is visibly and considerably higher than in silt–clay soil, and it gradually falls as depth increases.

5. Conclusions

This work primarily introduces the test pile test, including the test pile scheme and the test data to be obtained during the test. As well, it collates the data, which includes the pile axial force, pile lateral friction resistance, and settlement at specified depths under varied loading situations. The analysis and comparison yielded the following conclusions:
  • Under load, the pile body experiences an elastic shift with linear behavior. With increasing load, the pile foundation’s settlement value rises. The main elements are elastic compression of the pile body and elastic compression of the foundation soil below the pile body’s bottom, with a maximum settlement value of 8.14 mm. During the unloading process, the compressed soil swells, the porosity rises, the moisture is saturated, and residual deformation occurs, with a maximum residual amount of 1.94 mm.
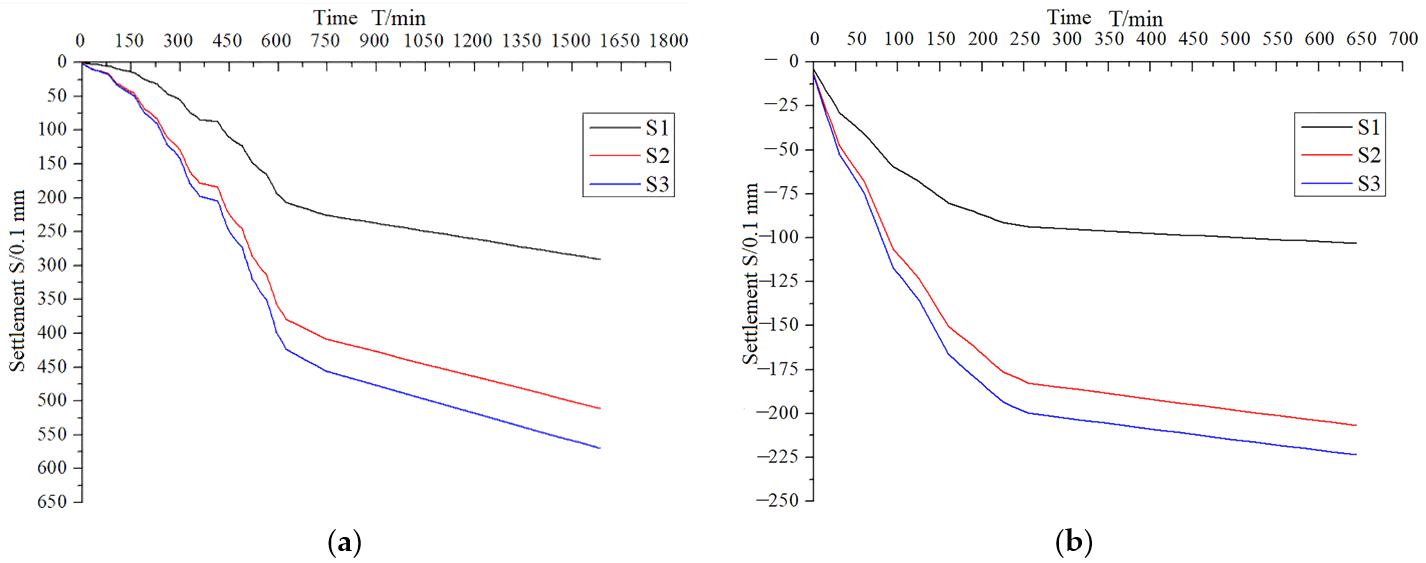
  • The test pile’s settlement-time curve was essentially the same, which was “S-shaped”. The pile’s settlement rose in a non-linear proportion during the loading-unloading process. After unloading, the displacement of the test pile didn’t change or lightly changed, and there was residual deformation at the bottom of the test pile. The ultimate residual was about 10 mm for the S2# end of the test pile and 11 mm for the S3# end of the test pile.
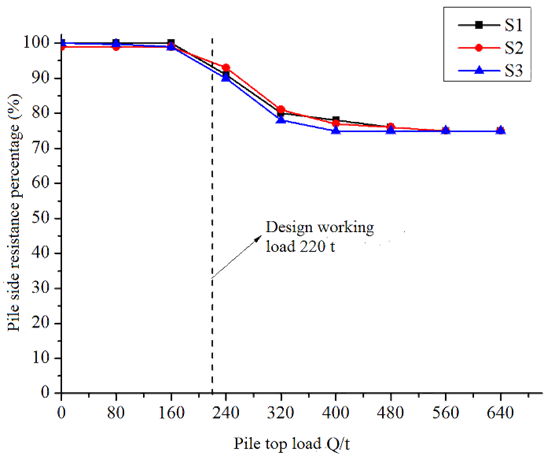
  • The load-settlement curve of the test pile is a slowly changing kind, and the pile end sediment has a significant impact on pile settling. Given that there was less sediment at the bottom of the pile and no rebound after slag hardening at the bottom of the pile during unloading, the pile top settled mostly due to pile compression, but the pile axial force was steadily reduced from top to bottom as the depth increased. At the same time, the fast-growing pile end settlement led to a rapidly falling ratio of pile compression to pile top settlement, making the pile top settlement change relatively steadily.
  • The lateral friction resistance of the test pile gradually grew as the pile top weight increased, and it was distributed non-linearly along the pile. The test piles indicate a change from pure friction piles to end-bearing friction piles throughout the loading process, and the lateral friction in the pile-soil interface zone exhibits a deterioration phenomenon. The amplitude of deterioration in silt was lower than in silty clay, and the degradation tendency gradually decreased as depth increased.
  • Under the same load, the relative displacement of pile-soil reduced steadily as embedded depth increased. The relative displacement of pile-soil was a steady process from the top to the lower section of the pile, and it was favorably connected with the pile lateral friction resistance, and the fitting model may be used as a reference in related disciplines.
  • The lateral frictional resistance of the test pile above 15 m exhibits varying degrees of weakening, i.e., the ratio of measured value to the geological report is less than 1. The lateral frictional resistance of the pile below 15 m has a weak strengthening effect, i.e., the ratio of measured value to the geological report is greater than 1. The lateral dynamic resistance of the soil layer in the lower portion of the pile is not fully developed, with a ratio of 0.772 between the measured and supplied values of the lateral dynamic resistance of the soil layer towards the pile end.

Author Contributions

Conceptualization, D.M. and M.Z.; methodology, D.M. and M.Z.; investigation, Y.S.; resources, W.Z.; data curation, Y.S.; writing—original draft preparation, D.M. and M.Z.; writing—review and editing, D.M. and M.Z.; Experiment, D.M.; supervision, M.Z.; project administration, Y.S. and W.Z.; funding acquisition, M.Z. All authors have read and agreed to the published version of the manuscript.

Funding

This research is financially supported by National Key Research and Development Program of China(2017YFC0703408); National Natural Science Foundation of China (52078109).

Institutional Review Board Statement

Not applicable.

Informed Consent Statement

Not applicable.

Data Availability Statement

The data presented in this study are available on request from the corresponding author.

Conflicts of Interest

The authors declare no conflict of interest.

References

  1. Xie, H.; Han, C.; Du, C.; Wang, B.; Zhang, Y.; Mo, P. Analysis of pile-soil interaction of precast pile driven in coastal strata. In International Conference on Civil Engineering; Springer: Singapore, 2022; pp. 474–486. [Google Scholar]
  2. Makris, N.; Gazetas, G. Dynamic pile-soil-pile interaction. Part II: Lateral and seismic response. Earthq. Eng. Struct. Dyn. 1992, 21, 145–162. [Google Scholar] [CrossRef]
  3. Saggu, R. Cyclic pile-soil interaction effects on load-displacement behavior of thermal pile groups in sand. Geotech. Geol. Eng. 2022, 40, 647–661. [Google Scholar] [CrossRef]
  4. Desen, K.; Maotian, L.; Weiming, W. Comparative analysis of seismic response characteristics of pile-soil-structure interaction system. J. Ocean Univ. China 2006, 5, 1–6. [Google Scholar] [CrossRef]
  5. Wang, X.; Wang, J.; Zhang, Z. A thermo-mechanical model for pile-soil interface behavior. IOP Conf. Ser. Earth Environ. Sci. 2021, 861, 072145. [Google Scholar] [CrossRef]
  6. Wang, C.H.; Jin, K.; Zhan, C. Model test studies of the mechanical properties of pile-soil interface. Appl. Mech. Mater. 2013, 392, 904–908. [Google Scholar] [CrossRef]
  7. Yu, H.S.; Houlsby, G.T. Finite cavity expansion in dilatant soils: Loading analysis. Géotechnique 1991, 41, 173–183. [Google Scholar] [CrossRef]
  8. Tran, N.X.; Bong, T.; Yoo, B.S. Evaluation of the soil–pile interface properties in the lateral direction for seismic analysis in sand. Soil Dyn. Earthq. Eng. 2021, 140, 106473. [Google Scholar] [CrossRef]
  9. Liu, Y.; Vanapalli, S.K. Load displacement analysis of a single pile in an unsaturated expansive soil. Comput. Geotech. 2019, 106, 83–98. [Google Scholar] [CrossRef]
  10. Wang, Y.H.; Xu, Z.Q. Experimental Study on Earth Pressure of Pile-Soil Interface During Penetration of Opening and Closed Static Pressure Pipe Pile. J. Hunan Univ. Sci. Technol. 2022, 37, 36–42. [Google Scholar]
  11. Bourne-Webb, P.J.; Freitas, T.M.B. Assunção R M F. A review of pile-soil interactions in isolated, thermally-activated piles. Comput. Geotech. 2019, 108, 61–74. [Google Scholar] [CrossRef]
  12. Li, P.; Zhou, Z.; Chen, L.; Liu, G.; Xiao, W. Research on dust suppression technology of shotcrete based on new spray equipment and process optimization. Adv. Civ. Eng. 2019, 2019, 1–11. [Google Scholar] [CrossRef]
  13. Liu, X.Y.; Wang, Y.H. Experimental Study on the Radial Stress at the Interface of Static Pressure Pile in the Clay Soil Foundation. J. Wuhan Univ. Technol. 2019, 41, 84–89. [Google Scholar]
  14. Heydinger, A.G.; O’Neill, M.W. Analysis of axial pile-soil interaction in clay. Int. J. Numer. Anal. Methods Geomech. 1986, 10, 367–381. [Google Scholar] [CrossRef]
  15. Castelli, F.; Maugeri, M.; Mylonakis, G. Numerical analysis of kinematic soil—pile interaction. AIP Conf. Proc. 2008, 1020, 618–625. [Google Scholar]
  16. Shi, W.Q.; Wang, J.H.; Chen, J.J. Numerical analysis of the laterally loaded pile considering the unlinear characteristic of pile-soil interface. J. Shanghai Jiaotong Univ. 2006, 40, 1457. [Google Scholar]
  17. Zhang, M.; Sang, S.; Wang, Y. Factors influencing the mechanical characteristics of a pile–soil interface in clay soil. Front. Earth Sci. 2020, 7, 364. [Google Scholar] [CrossRef]
  18. Seo, H.J.; Jeong, K.H.; Choi, H.; Lee, I.M. Pullout resistance increase of soil nailing induced by pressurized grouting. J. Geotech. Geoenviron. Eng. 2012, 138, 604–613. [Google Scholar] [CrossRef]
  19. Seo, H. Monitoring of CFA pile test using three dimensional laser scanning and distributed fiber optic sensors. Opt. Lasers Eng. 2020, 130, 106089. [Google Scholar] [CrossRef]
  20. Franza, A.; Zheng, C.; Marshall, A.M.; Jimenez, R. Investigation of soil–pile–structure interaction induced by vertical loads and tunnelling. Comput. Geotech. 2021, 139, 104386. [Google Scholar] [CrossRef]
  21. Su, D.; Wu, Z.; Lei, G.; Zhu, M. Numerical study on the installation effect of a jacked pile in sands on the pile vertical bearing capacities. Comput. Geotech. 2022, 145, 104690. [Google Scholar] [CrossRef]
  22. Tamura, S.; Ohno, Y.; Shibata, K.; Funahara, H.; Nagao, T.; Kawamata, Y. E-Defense shaking test and pushover analyses for lateral pile behavior in a group considering soil deformation in vicinity of piles. Soil Dyn. Earthq. Eng. 2021, 142, 106529. [Google Scholar] [CrossRef]
  23. Liu, J.; Zhang, Z.; Yu, F. Case history of installing instrumented jacked open-ended piles. J. Geotech. Geoenviron. Eng. 2012, 138, 810–820. [Google Scholar] [CrossRef]
  24. Wu, Y.; Zhao, C.; Zhao, C.; Wang, Y.; Fei, Y. Effect of grout conditions on the mechanical behaviors of unloading sand-concrete interface for reinforcing bored pile foundation. Constr. Build. Mater. 2020, 243, 118218. [Google Scholar] [CrossRef]
  25. Kasper, T.; Meschke, G. A numerical study of the effect of soil and grout material properties and cover depth in shield tunnelling. Comput. Geotech. 2006, 33, 234–247. [Google Scholar] [CrossRef]
  26. Hossain, M.A.; Yin, J.H. Influence of grouting pressure on the behavior of an unsaturated soil-cement interface. J. Geotech. Geoenviron. Eng. 2012, 138, 193–202. [Google Scholar] [CrossRef]
  27. Wang, Y.B.; Zhao, C.; Wu, Y. Study on the effects of grouting and roughness on the shear behavior of cohesive soil–concrete interfaces. Materials 2020, 13, 3043. [Google Scholar] [CrossRef]
  28. Gao, L.; Cao, Y.; Liu, H.; Zhao, Z.; Ye, Y.; Fan, C.; Tu, W. Experiment and numerical study on the monitoring of super long cast-in-place pile temperature based on BOTDR technology. Measurement 2021, 179, 109481. [Google Scholar] [CrossRef]
  29. Klar, A.; Bennett, P.J.; Soga, K.; Mair, R.J.; Tester, P.; Fernie, R.; Torp-Peterson, G. Distributed strain measurement for pile foundations. Proc. Inst. Civ. Eng.-Geotech. Eng. 2006, 159, 135–144. [Google Scholar] [CrossRef]
  30. Loizos, P.; Kenichi, S.; Elshafie Mohammed, Z.E.B.; Cedric, K.; Ye, G.C.; Yue, O.; Hyung-Joon, S. Distributed Fiber Optic Sensing of Axially Loaded Bored Piles. J. Geotech. Geoenviron. Eng. 2018, 144, 04017122. [Google Scholar]
  31. Wang, L.; Wu, W.; Zhang, Y.; Li, L.; Liu, H.; Naggar, M.H.E. Nonlinear analysis of single pile settlement based on stress bubble fictitious soil pile model. Int. J. Numer. Anal. Methods Geomech. 2022, 46, 1187–1204. [Google Scholar] [CrossRef]
  32. MA, D.; Han, X.; Zhou, Y.H. Compression Deformation Analysis of Single Pile Under Vertical Load. Constr. Technol. 2020, 49, 1618–1622. [Google Scholar]
  33. Wu, M.; Chen, L.; Xu, F.; Yang, Q.; Rusong, N.I.E. Measurement and Analysis of Compression Deformation of a Super-long Pile Foundation in Deep Soft Deposit. J. Hunan Univ. Nat. Sci. 2019, 46, 87–96. [Google Scholar]
  34. Azijul Islam, M.; Gupta, A.; Gupta, N.; Islam, T. Laboratory Investigation of Soil Plugs in Open Ended Model Piles Driven into Sand. In Proceedings of the IFCEE 2021, Dallas, TX, USA, 10–14 May 2021; pp. 108–118. [Google Scholar]
  35. Goudar, S.; Kamatagib, A. An Experimental Evaluation of Axial Load Bearing Capacity of Belled and Straight Piles Embedded in Sand. Int. J. Eng. 2022, 35, 1599–1607. [Google Scholar] [CrossRef]
Figure 1. (a) Site views for in situ loading test; (b) Schematic diagram of loading conditions in test pile.
Applsci 12 07150 g001
Figure 2. (a) Grouting devices; (b) Grouting volume and grouting pressure monitoring devices.
Applsci 12 07150 g002
Figure 3. (a) Axial force sensors deployment; (b) Settlement sensors deployment.
Applsci 12 07150 g003
Figure 4. QK667-1 soil samples at different depths in boreholes.
Applsci 12 07150 g004
Figure 5. Curves of soil sample’s basic physical parameters and compression coefficient change with depth.
Applsci 12 07150 g005
Figure 6. The depth of soil sample deformation varies with pressure.
Applsci 12 07150 g006
Figure 7. Compression coefficient of a soil sample at various depths with a pressure change curve.
Applsci 12 07150 g007
Figure 8. (a) Loading settlement–time curve; (b) Unloading settlement–time curve.
Applsci 12 07150 g008
Figure 9. (a) Pile head load-settlement curve; (b) Pile tip load-settlement curve; (c) Pile compression load-settlement curve.
Applsci 12 07150 g009aApplsci 12 07150 g009b
Figure 10. Load-pile compression as a percentage of pile head settlement.
Applsci 12 07150 g010
Figure 11. (a) Axial force distribution diagram of test pile S1#; (b) Axial force distribution diagram of test pile S2#; (c) Axial force distribution diagram of test pile S3#.
Applsci 12 07150 g011
Figure 12. (a) Lateral frictional resistance under different loads for test pile S1#; (b) Lateral frictional resistance under different loads for test pile S2#; (c) Lateral frictional resistance under different loads for test pile S3#.
Applsci 12 07150 g012
Figure 13. Curve of test lateral resistance as a percentage of pile head load.
Applsci 12 07150 g013
Figure 14. (a) Pile-soil relative displacement curve for test pile S1#; (b) Pile-soil relative displacement for test pile S2# and S2#.
Applsci 12 07150 g014
Figure 15. Relationship between relative pile displacement and pile lateral resistance.
Applsci 12 07150 g015
Table 1. Lithology analysis table of QK667-1stratum.
Soil Depth (m)Soil Thickness (m)Strata Description
2.02.0Silt: greyish–brown, loose, high porosity
8.56.6Silty clay: gray–brown, loose, silty clay layer embedded depth of 5.6~6.0 m
11.02.5Silty clay: gray, the silty clay layer is buried at a depth of 6.6~7.3 m
24.013.0Silty sandy soil: gray, high porosity, loose, saturated with water, with a small amount of silty clay at 15.0–15.2 m, a small amount of gravel at 15.2–15.4 m and 17.7–18.8 m, and a small amount of silty clay at 22.0–24.0 m, gray–brown
35.011.0Silty sandy soil: grayish–yellow, relatively loose, with a small amount of gravel at 24.0~25.0 m, and silty clay at 25.0~29.5 m
Table 2. Silicon piezoresistive pressure sensor parameter.
Diameter × Height/
(mm × mm)
Maximum Dynamic
Frequency/kHz
Precision/%Operating
Voltage/V
20 × 1220000.10~5
Table 3. Strengthening or weakening coefficient of lateral friction resistance of different soil layers.
The Layer of SoilMaximum (Ultimate) Lateral Friction Resistance/kPaAverage of Scale Factor
Measured Values for Test Pile S1#Measured Values for Test Pile S2#Measured Values for Test Pile S3#Geological Reports Provide Values
Clay1010.210.7110.936
Silty clay11.511.7611.83120.975
Pelitic silty-sand232424.8250.957
Silt with clay12.81313.2121.083
Silt20.521.322201.063
Silty sand26.427.528.6261.057
Publisher’s Note: MDPI stays neutral with regard to jurisdictional claims in published maps and institutional affiliations.

