Article

A Heuristic Fuzzy Based 5G Network Orchestration Framework for Dynamic Virtual Network Embedding

School of Computer Information and Communication Engineering, Kunsan National University, Gunsan 54150, Korea
*
Authors to whom correspondence should be addressed.
Appl. Sci. 2022, 12(14), 6942; https://doi.org/10.3390/app12146942
Submission received: 20 June 2022 / Revised: 5 July 2022 / Accepted: 6 July 2022 / Published: 8 July 2022
(This article belongs to the Special Issue Edge Intelligence for beyond 5G Networks)

Abstract

:
Network slicing has become an unavoidable requirement for allocating 5G mobile network resources when sharing resources among devices that have varying needs. As a result, the virtual network slices get resources from the shared physical infrastructure that matches their needs. In order to maximize the use of shared resources, it is critical to provide an efficient virtual network embedding strategy for mapping each user’s requests to a physical infrastructure. Virtual network embedding primarily deals with the two most important network parameters—node mapping and link mapping. This paper proposes the heuristic fuzzy algorithm for node mapping and Dijikstra’s algorithm for link mapping. The proposed fuzzy based multi-criteria decision making technique uses membership functions for node parameters to prepare node mapping. By determining the shortest path, Dijikstra’s algorithm is used to provide link mapping. The proposed strategy is tested under dynamic physical infrastructure conditions for validation. The average acceptance ratio, costrevenue ratio, and average utilization of node capacity and link bandwidth are used to evaluate the performance of the proposed strategy. In addition, the obtained results are compared to the literature to show that the proposed strategy is effective.

1. Introduction

The fifth generation of communication networks, also known as simply 5G, has been continuously restructuring the setting of information and communications technology (ICT) over the past few years. In tandem with the introduction of technologies that go beyond 5G, a plethora of new services have also come into existence. These services include augmented and virtual reality, communications between vehicles and other objects, electronic health care, and smart homes. Because of the wide variety of services that are already available, the International Telecommunication Union (ITU) has determined three primary usage scenarios for 5G services such as Ultra-reliable Low Latency Communications (uRLLC), Enhanced Mobile Broadband (eMBB), and Massive Machine Type Communications (mMTC) [1]. To be more specific, in order to meet the needs of users, it is necessary to have adaptive and on-demand resource provisioning methods that allow for efficient resource allocation based on a variety of service request types [2]. In addition, in order to supply end-users with the highest possible quality of service (QoS), it is necessary to satisfy the numerous requirements that are imposed by these services. As part of the Alliance’s Next Generation Mobile Networks (NGMN), they introduced the concept of network slicing, which enables the allocation of resources for 5G network devices with varying performance requirements [3]. Assuming a shared physical infrastructure, Figure 1 illustrates logical networks with isolated components.
Virtual Network Functions (VNFs) are used to create slices of physical infrastructure based on the grouping of requirements, which include virtual resources, logical topology, traffic regulation, and node and link provisioning rules [4]. The 3rd Generation Partnership Project (3GPP) authorized the 5G system architecture that supports network slicing in its first edition of 5G normative standards [5]. In order to provide the best service, each slice in the network is defined as it has its own unique set of network functions [6]. There are three types of network slicing solutions: service, resource, and deployment. There are three main steps in network slicing: creating the slices, isolating the slices, and managing the slices [7]. In recent years, network slicing (NS) has become the focus of the majority of research relating to 5G networks as a result of its capacity to improve service provisioning and QoS. For example, the research presented in Ref. [8] investigated the management and allocation of radio access network (RAN) resources with particularly emphasis on uRLCC and eMBB slices.
The authors suggested a method of intelligent decision-making as a means of controlling network traffic and allocating the necessary resources. Ref. [9] provides a comprehensive breakdown of the myriad of factors that play a role in the execution of network slicing concepts. These factors consist of resource allocation, slice isolation and security, radio access network (RAN) virtualization, granularity of function, and end-to-end (E2E) slice orchestration. The work also describes the challenges associated with the implementation of network slicing, such as optimizing resource efficiency, providing the best possible acceptance ratio, ensuring data confidentiality and maintaining low latency, and supporting a wide range of user requirements. Ref. [10] provides a presentation on the applications of machine learning (ML) and artificial intelligence (AI) to various network slicing solutions. The research documented a variety of ML and AI algorithms, in addition to their applications to various kinds of NS use-cases, such as resource management and mobility prediction. Ref. [11] conducted a research on the difficulties associated with slice admission and management. In addition to its other name, Network Slice Provisioning, Virtual Network Embedding (VNE) [12] is a paradigm that allows the physical resources of logical networks to be assigned to those networks.
Slice isolation and management are critical in network slicing because the processes provide the most effective optimal service provisioning for the requests. Many recent works have made use of advanced technologies to address slice isolation and management issues. According to the literature, solution techniques still require a high level of sophistication on the security, optimal resource allocation, and acceptance rate. In response to the issues identified in the literature, this study proposes an orchestration architecture that addresses slice isolation and network slicing management issues. The following are the primary contributions of the planned work:
1.
Creating a network orchestration framework for effective and easier network slicing by combining network isolation and management strategies;
2.
Preparing slice isolation strategy for the optimal resource allocation of Network Requests (NRs) in the Physical Infrastructure (PI);
3.
Proposing slice management strategy to enhance the performance of the created slices of PI by the introduction of dynamic provisioning concepts;
4.
Investigating the behavior of the proposed framework in a variety of physical infrastructure settings and NRs, as well as comparing the proposed strategy with existing methodologies.
The remainder of this article is structured as follows: Section 2 discusses the literature that is related; Section 3 provides a synopsis of the proposed system model and the mathematical background; and Section 4 discusses the proposed framework for orchestrating 5G mobile networks. The dynamic slicing of 5G mobile networks is discussed in Section 5, along with a case study, and Section 6 brings the work to an end by providing a proposal for further extension.

2. Related Works

2.1. Virtual Network Embedding Strategies

The topic of resource allocation through network embedding is the primary focus of the research presented in ref. [13]. This study proposed a topology-aware node mapping approach that utilized the Markov Random Walk Model to measure the capacity of the nodes and the joint link bandwidth between them. The greedy node mapping takes the ranking values from the steady state nodes into consideration. After that, the virtual links, whether they are splittable or not, are mapped to the substrate network using either the k-shortest path or the multicommodity flow method, depending on which is more appropriate. Based on the node degree and the clustering coefficient information, ref. [14] devised a heuristic VNE algorithm to deal with the VNE problem. Following the node ranking method, the greedy node mapping is implemented. As stated above, the k-shortest path is used in the link mapping stage. Instead of focusing on nodes and their immediate neighbors, this method only takes into account the resources of the nodes in its immediate vicinity. This results in a reduced utilization of the substrate network over time. In ref. [15], it was suggested that a network topology attribute and network resource-considered algorithm (VNE-NTANRC) were used to rank nodes by making connections between them based on five network attributes. The authors of ref. [16] propose an approach based on complex network theory to maximize resource utilization. Installing virtual network functions and then selecting link route options for the virtual network functions are both recommended steps in the technique.
The VIKOR technique was used to rank the nodes in ref. [17] among the different ways to make decisions based on more than one factor. Provisioning of physical and logical network nodes is the same as provisioning of virtual network nodes. When Floyd’s way of setting up links is used, the shortest possible route is given to the slice request nodes. In ref. [18], a delay time was predicted using stochastic network calculus (SNC), which takes into account both the volume of traffic and the availability of system resources. In addition, algorithms have been made and put into place to figure out the best way to divide up resources in order to meet the delay bound and the most traffic that can be handled. The authors in ref. [19] introduced an algorithm called Upper-tier First with Latency-bounded Overprovisioning Prevention (UFLOP) to optimize the capacity and traffic allocation in two-tier 5G sliced networks while also meeting the latency constraints of renters. This method looks at incoming traffic in the context of the services offered to tenants and the resources needed to provide resources, and then makes suggestions. In ref. [20], a method for service provisioning in RAN slicing was introduced to ensure that the QoS criteria, as well as the bandwidth and computing capacity needs, is met. This method is being used to cut down on the amount of bandwidth used for service provisioning. It was suggested by ref. [21] as a way to deal with scaling, monitoring, and combining of measured data at the slice level, which are problems that come up when monitoring the performance of network slices. This framework was made to deal with problems that come up when monitoring the performance of network slices, such as scalability, monitoring, and the aggregation of measured data at the slice level.

2.2. Fuzzy Based Strategies for Network Slicing

In recent times, decisions concerning matters pertaining to 5G mobile networks have been made using fuzzy logic and rule bases. In the paper [22], the authors developed an algorithm for an information security management system that was based on soft computing. They also implemented a prototype of an intrusion detection system (IDS) for a software-defined network. This IDS prototype consisted of a module for collecting and processing statistics as well as a fuzzy rules for making decisions. According to ref. [23], it is possible to manage user mobility using a dynamic fuzzy Q-Learning algorithm. System learning is used to generate fuzzy rules from the lack of existing fuzzy rules in order to achieve a balance between the signaling costs incurred by handover and the user experience affected by the call drop ratio. A study by ref. [24] looked at the implementation of fuzzy systems to address the problems of 5G mobile network resource optimization and the paradigm of SDN architecture development. The authors first discussed the various terms needed to understand 5G technologies, and then went on to analyze the feasibility of implementing fuzzy systems to telecommunications, particularly 5G technology and SDN architectures development. Resource allocation algorithm FUZZRA has been proposed in Ref. [25] by using fuzzy logic. According to FUZZRA, fuzzy logic rules are formulated based on multiple input variables and are used to allocate resources to various UEs. The parameters of the fuzzy system can be dynamically adjusted based on the network status to ensure optimal resource utilization and high QoS. The proposed strategy significantly increases resource utilization, improves information dissemination between various UEs, and increases network throughput. As a consequence of this, the service level agreement (SLA) parameter will be utilized as an input parameter for admission control in 5G wireless networks.
As recently as ref. [26] implemented a Fuzzy-based scheme to deal with user SLA issues, a new user was attempted to be connected to an appropriate slice using a set of slices that matched the required SLA. Reliability (Re), Availability (Av), Latency (La), and Traffic load are all taken into consideration as input parameters by the proposed scheme, which included the introduction of two models for an admission control mechanism. Ref. [27] presented a fuzzy-based scheme for evaluating Slice Priority (SP), taking into consideration the three parameters: Slice Traffic Volume (STV), Slice Interference from Other Slices (SIOS), and Slice Connectivity (SC). The findings of the scheme concluded that each of the considered parameters has its own unique impact on the SP. The SP parameter is increased when both STV and SC are moving in the positive direction; however, when SIOS is moving in the positive direction, the SP parameter is decreased.

3. System Model and Mathematical Background

3.1. Physical Infrastructure and Network Request Model

The undirected graph is used to represent both the physical infrastructure and network request model in the proposed work. G P I = ( N P I , E P I ) denotes a graph, where N P I denotes the number of nodes and E P I denotes the number of edges. Subsets for nodes and edges are also defined. The node subset includes CPU capacity and Security Level for each node, which are represented as C P U i P I and S L i P I , respectively, whereas the edge subset includes bandwidth, which is represented as B W i j P I . In the definitions, C P U i P I and S L i P I define the CPU capacity and the security level of the i-th node of the PI, and B W i j P I defines the bandwidth of the link connecting nodes ‘i’ and ‘j’ of PI.
A graph for the Network Request Model is defined as a graph G N R = ( N N R , E N R ) , where N N R denotes the number of requested nodes and E N R denotes the number of requested edges. Similar to the PI, the nodes and edges of NR have subsets N N R ( C P U i N R , S R i N R ) and E N R ( B W i j N R ) , respectively. In the definitions, C P U i N R and S L i N R define the CPU capacity and the security requirements of the i-th node of the NR, and B W i j N R defines the bandwidth requirement of the link connecting nodes ‘i’ and ‘j’ of NR.

3.2. Node Parameters

It is a well-known fact that the quality of each node in a network can be determined by examining the node information at the local and network levels. When determining the quality of a node, parameters such as its capacity, degree, available bandwidth, and proximity to the center of the network are the most important to consider. The mathematical expressions relating to the parameters are illustrated in the expressions below.
  • Capacity of a Node: Equation (1) defines the capacity of a node ‘i’ in the given network. Each node of a network is specified with the CPU capacity value.
    C N ( i ) = C P U i ; i N P I , N N R
  • Degree of a Node: It is determined by the number of adjacent links connected to any node ‘i’ in the given network. Equation (2) shows the expression for degree of a node.
    D N ( i ) = j E i j N ; i j & j N P I , N N R
    where E i j N is a binary variable; it returns 1 if there exists a connection between nodes ‘i’ and ‘j’ in the network, and 0 otherwise.
  • Available bandwidth of a node: It is determined by the sum of the bandwidth of each adjacent link connected to any node ‘i’ in the given network. Equation (3) shows the expression for determining the bandwidth of a node.
    B N ( i ) = j B i j N ; i j & j N P I , N N R
  • Closeness Centrality of a Node: Determined by the shortest route between any two nodes, which is used to determine the global importance of any node. As a result, a node’s centrality is increased in direct proportion to its distance from other nodes. Equation (4) shows the expression for determining the closeness centrality of any node in the network.
    L N ( i ) = { j L i , j } 1 ; i j & j N P I , N N R

3.3. Mathematical Model for Performance Measurement

For the purpose of this study, the network’s performance is evaluated using three metrics: average resource efficiency, average acceptance rate, as well as average bandwidth and CPU consumption.
  • Average Acceptance Rate: This metric is calculated by dividing the number of successful NRs by the number of unsuccessful NRs during the specified transmission time interval ( T m a x ) , which yields the direct performance measurement for the provided physical infrastructure.
    η A R = s N R t N R
    where sNR and tNR refer to the total number of successful and unsuccessful NRs in the specified time interval, respectively.
  • Average CPU and Bandwidth Utilization: The total CPU and bandwidth utilized by the successful NRs in the given transmission time interval is determined by,
    C P U u t i l i z e d = i = 1 s N R C P U N R ( i )
    B W u t i l i z e d = i = 1 s N R B W N R ( i )
  • Average Resource Efficiency: This metric is defined as the ratio of the amount of revenue generated to the amount of money spent on building the physical infrastructure. The revenue can be calculated by accurately calculating the amount of CPU and bandwidth used per NSR. The physical infrastructure provided by NSR determines the cost of investment. The following Equation (6) is used to calculate the network’s resource efficiency for the given transmission time interval ( T m a x ) .
    η R E = i = 1 s N R C P U N R ( i ) + B W N R ( i ) ( C P U N R ( i ) + B W N R ( i ) . L ( i ) )
    where C P U N R ( i ) and B W N R ( i ) refer to the total CPU and bandwidth requested by the i-th NR, respectively. L(i) refers the shortest path length utilized for i-th NR, and sNR refers the total number of successful NRs.

3.4. Objective Function and Constraints

Effective network slicing maximizes the physical network resource utilization while minimizing the slice provisioning costs. The provided security level, CPU capacity, and bandwidth are used to measure the slice provisioning cost. Accordingly, the cost of provisioning slices is minimized using the integer linear programming model with the constraints shown below.
Minimize,
k N N R i N P I x i k ( 1 + S L i P I ) ( C P U k N R ) + m E N R n E P I a n m B W m N R
subject to,
N i N R x i k = 1 ; N i N R N N R
N k P I x i k 1 ; N k P I N P I
x i k C P U k N R C P U i P I ; N i P I N P I ; N k N R N N R
x i k S R k N R S L i P I ; N i P I N P I ; N k N R N N R
N i j P I ( a i j k l a j i k l ) = x i k x i l ; N i P I N P I ; E k l N R E N R
E k l N R a i j k l B W ( E k l N R ) B W ( E i j P I ) ; E i j P I E P I
x i k ( 0 , 1 ) is a binary variable, where x i k = 1 indicates that N N R is served onto N P I , otherwise 0. a n m indicates whether the link ‘n’ of E P I hosts the request link ‘m’ of E N R . If a link presents then the a n m is 1, otherwise 0. Network providers use extra resources to ensure node security. Constraint (10) ensures that each request node is assigned to a physical node. Constraint (11) limits the number of nodes per physical node. The constraint on CPU capacity (12) ensures that the requested CPU does not exceed the available CPU capacity. Constraint (13) ensures each node’s security. Constraint (14) ensures that each slice link is assigned to a physical path, and all nodes along the path, with the exception of the beginning and ending nodes, see zero throughput. The constraint (15) ensures that the requested bandwidth does not exceed the available bandwidth.

4. Proposed Strategy for Dynamic Virtual Network Embedding (DVNE)

To embed network requests in the physical infrastructure, the proposed strategy makes use of the heuristic fuzzy for node mapping and the Dijkstra’s Algorithm for link mapping. Figure 2 provides the diagrammatic representation of the proposed strategy implemented for DVNE.

4.1. Node Mapping for DVNE

According to the literature, many strategies for node mapping have utilized the approach based on node ranking. Node rankings for the request and the physical infrastructure are prepared based on their respective node parameters. Because node parameters are different, recent techniques adopt multi-criteria decision making techniques for ranking. This proposed work employs the heuristic fuzzy ranking of request nodes and physical infrastructure for embedding. The membership functions for the respective node parameters are prepared using fuzzy, and the decision on the node’s position in the ranking is made using the decision fuzzy set value of each node. In this work, the membership functions are developed for CPU capacity, degree, BW, and closeness centrality.
  • Membership function for CPU capacity: This membership function is used to determine how close a node’s CPU capacity is to the maximum capacity of the cluster. The highest priority in the ranking is assigned to the member with the highest membership value. C P U m i n and C P U m a x are the ranges of CPU capacity that have been specified for the process.
    μ C N , i = 1 i f ( C N ( i ) C P U m a x ) C P U m a x C N ( i ) C P U m a x C P U m i n i f ( C P U m i n C N ( i ) < C P U m a x ) 0 i f ( C N ( i ) < C P U m i n )
  • Membership function for node degree: This membership function determines how close a node’s degree is to the node’s maximum degree. The degree range is determined using network information. The maximum limit ( D N m a x ) is determined by the node with the highest degree in the network, and the minimum limit ( D N m i n ) is determined by the node with the lowest degree in the network. As a result, a node with the highest degree in the network has the membership value ‘1’, while a node with the lowest degree in the network has the membership value ‘0’. The member with the highest membership value is given the highest priority in the ranking.
    μ D N , i = 1 i f ( D N ( i ) D N m a x ) D N m a x D N ( i ) D N m a x D N m i n i f ( D N m i n D N ( i ) < D N m a x ) 0 i f ( D N ( i ) < D N m i n )
  • Membership function for bandwidth: the available bandwidth of any node can be compared to the maximum bandwidth of the node using this membership function. This is similar to the way a node’s degree is determined by its location on the network. The maximum limit ( B N m a x ) is taken from the node that has the most bandwidth available in the network, and the minimum limit ( B N m i n ) is taken from the node that has the least bandwidth available. In this case, a node with the most bandwidth in the network is given the membership value of “1”, while a node with the least bandwidth is given the membership value of “0”. The member with the highest membership value is given the highest priority in the ranking.
    μ B N , i = 1 i f ( B N ( i ) B N m a x ) B N m a x B N ( i ) B N m a x B N m i n i f ( B N m i n B N ( i ) < B N m a x ) 0 i f ( B N ( i ) < B N m i n )
  • Membership function for closeness centrality: A node’s closeness centrality can be calculated using this membership function by comparing it to the node in an associated network with the highest closeness centrality. The range for the closeness centrality is selected from the network information in the same way as the degree and bandwidth of a node. After calculating the closeness centrality of every node in a network, the upper and lower bounds (( L N m a x ) and ( L N m i n )) are immediately determined. This means that the network’s most central node receives the membership value ‘1’, while the network node with the lowest closeness centrality receives the membership value ‘0’. Priority is given to the most valuable member in terms of membership value when ranking.
    μ L N , i = 1 i f ( L N ( i ) L N m a x ) L N m a x L N ( i ) L N m a x L N m i n i f ( L N m i n L N ( i ) < L N m a x ) 0 i f ( L N ( i ) < L N m i n )
With the help of fuzzy maximum imperative, the decision fuzzy value for each individual node in a network is calculated from the membership values. Once the imperative values of each node of the physical infrastructure and service request network have been established, the node ranking process can begin. It is necessary to arrange the nodes in a non-increasing order of fuzzy decision values in order to see the entire network. For each network, the nodes are ranked and stored in a fuzzy decision array (FDA). During node ranking, the highest priority is given to the maximum value of the fuzzy decision. The following is the equation that corresponds to the fuzzy decision set for any node in the network.
μ D , i = m a x ( μ C N , i , μ D N , i , μ B N , i , μ L N , i )
After the arrival of the fuzzy decision arrays of both networks, the nodes of the service request network are mapped into the physical infrastructure, which is then completed. Therefore, the highest ranked node of the service request network has been embedded into the highest ranked node of the physical infrastructure. Algorithm 1 describes in detail the process of node mapping using fuzzy logic.
Algorithm 1 Node mapping through FDA
  1:
Input: G P I ( t ) , G N R ( t )
  2:
Output: G P I ( t ) , s N R
  3:
Calculate μ C N , μ D N , μ B N μ L N ; N P I ( t ) ϵ G P I ( t )
  4:
Prepare F D A P I ( t )   using   μ D
  5:
Calculate μ C N , μ D N , μ B N μ L N ; N N R ( t ) ϵ G N R ( t )
  6:
Prepare F D A N R ( t )   using   μ D
  7:
Set aCount = 0
  8:
for each node j of F D A N R ( t )  do
  9:
   if  ( F D A N R ( t ) e m p t y )  then
10:
     for each node k of F D A P I ( t )  do
11:
        if constraints (10)–(15) satisfied then
12:
          allocate N P I ( t , k ) to N N R ( t , j )
13:
          increment aCount
14:
           C P U N R ( t ) = C P U N R ( t ) + C P U j N R
15:
           B W N R ( t ) = B W N R ( t ) + B W j N R
16:
        else
17:
          increment k
18:
        end if
19:
     end for
20:
   end if
21:
end for
22:
if N N R ( t ) a C o u n t then
23:
   increment sNR
24:
end if
25:
return   G P I ( t )

4.2. Link Mapping for DVNE

Once the service request nodes have been embedded in the physical network nodes, the shortest path connecting all of the embedded nodes in the physical network must be determined. For NSR, the shortest route may not always be the best option. Some of the links in the identified shortest path may be used by the current NSRs that are in service. Therefore, finding all possible paths connecting nodes and arranging them in a non-decreasing order with respect to the length of each path is absolutely essential. Conventional methods such as breadth-first search and k-shortest path algorithms have been used many times in the past to find the shortest path connecting all the embedded nodes. The shortest path algorithm based on Dijkstra’s algorithm is utilized in this proposed DVNE strategy. For every N N R ( t ) , this process seeks to find all possible paths from N i N R to N j N R embedded in N P I , based on the available links in the network. Nodes that have been ranked high in the previous node selection process are used as target nodes for subsequent node mapping processes, which are carried out using Dijkstra’s algorithm (Algorithm 2).

4.3. DVNE

The application of fuzzy-based node mapping in conjunction with DA-based link mapping is being done in order to achieve the best possible optimal embedding of nodes for the NR in PI. This combined process assigns a node to each of the NR nodes that have been received up to the maximum arrival time of ( T m a x ) and creates a link between each of the nodes in the network. The rank array and the path array of the physical infrastructure are both kept up to date in accordance with the life time of the NR that has been received. This allows for the determination of the provisioning that is both the most appropriate and the most optimal for the NR that is yet to arrive. Therefore, dynamic NR allocation in a physical infrastructure will become more effective and efficient as a result of this.
Algorithm 3 depicts the order in which the events take place during the entirety of the solution process, which allots resources for NRs for the longest possible amount of time ( T m a x ) . The success rate, the efficient use of resources, and the consumption of CPU and bandwidth are the three primary metrics that are considered when evaluating the effectiveness of the process.
Algorithm 2 Link mapping through DA
  1:
Input: G P I ( t ) and FDA
  2:
Output: L A
  3:
for all u node in F D A  do
  4:
   for all l node in G P I ( t )  do
  5:
       dist[l]<- INFINITY
  6:
       prev[l]<- UNDEFINED
  7:
       add l to Q
  8:
   end for
  9:
   dist[u] <- θ
10:
   while Q ≠ empty do
11:
       u <- vertex in Q with min dist[u]
12:
       remove u from Q
13:
       for each neighbor l of u still in Q do
14:
          alt <- dist[u]+Graph.Edges(u,l)
15:
          if alt < dist[v] then
16:
            dist[v] <- alt
17:
            prev[v] <- u
18:
          end if
19:
       end for
20:
   end while
21:
   L(t) = dist[]
22:
end for
Algorithm 3 DVNE
  1:
Input: G P I , T m a x , t = 0
  2:
Output: VNE
  3:
G P I (0) <- G P I
  4:
set C P U m a x , C P U m i n , D N m a x , D N m i n , B N m a x , B N m i n , L N m a x , L N m i n as 0
  5:
for t< T m a x  do
  6:
   Calculate C P U m a x , C P U m i n , D N m a x , D N m i n , B N m a x , B N m i n , L N m a x , L N m i n of G P I (t)
  7:
    Get NR(t)
  8:
   Calculate C P U m a x , C P U m i n , D N m a x , D N m i n , B N m a x , B N m i n , L N m a x , L N m i n of G N R (t)
  9:
   Call Algorithm 1
10:
   Call Algorithm 2
11:
   for each path p do
12:
       if ( ( p e m p t y ) constraints (10)–(15) satisfied) then
13:
          do link mapping in G P I ( t )
14:
          break
15:
       else
16:
          increment p
17:
       end if
18:
   end for
19:
   Calculate μ A R , C P U u t i l i z e d , B W u t i l i z e d , μ R E
20:
end for

5. Simulation Evaluation

5.1. Test Case Parameters

The proposed work is carried out on physical infrastructure with three distinct resource capacities. In addition, this is implemented based on the various numbers of NRs that are received within the allotted amount of time. The implementation of the suggested strategy is performed under two distinct operational conditions: (i) static provisioning and (ii) dynamic provisioning. These operating conditions are differentiated from one another based on the retention of resources in accordance with the life time of the requests. The efficiency of the use of resources, the acceptance rate, and the utilization of both CPU and BW are the criteria that are used to assess the proposed algorithm’s performance. Table 1 lists the various parameters of physical infrastructure and NR that are taken into consideration for the implementation.

5.2. Simulation Results

5.2.1. Static Provisioning

In accordance with the static provisioning, it is the presumption that the life time of the requests is considered to be infinite. To put it another way, the PI resources that are embedded within the NR are not made available for release once the process is complete. When determining values for the remaining parameters of physical infrastructure and network request, the ranges that have been provided against them are taken into account. In addition, it is presumed that both NR and physical infrastructure can be segmented as eMBB, uRLLC, and mMTC, respectively. The request to provision in physical infrastructure is sent to the VNF manager in batches consisting of a single type of slice at a time. The strategy that has been proposed ensures that nodes and links are embedded for the NRs that have been requested by optimally allocating the resources of PI slices to NSR slices. This strategy is evaluated by taking into account the number of NSR nodes that fall into a variety of categories, such as 10, 20, and 30, within the context of 100, 200, and 300 nodes that make up the physical infrastructure.
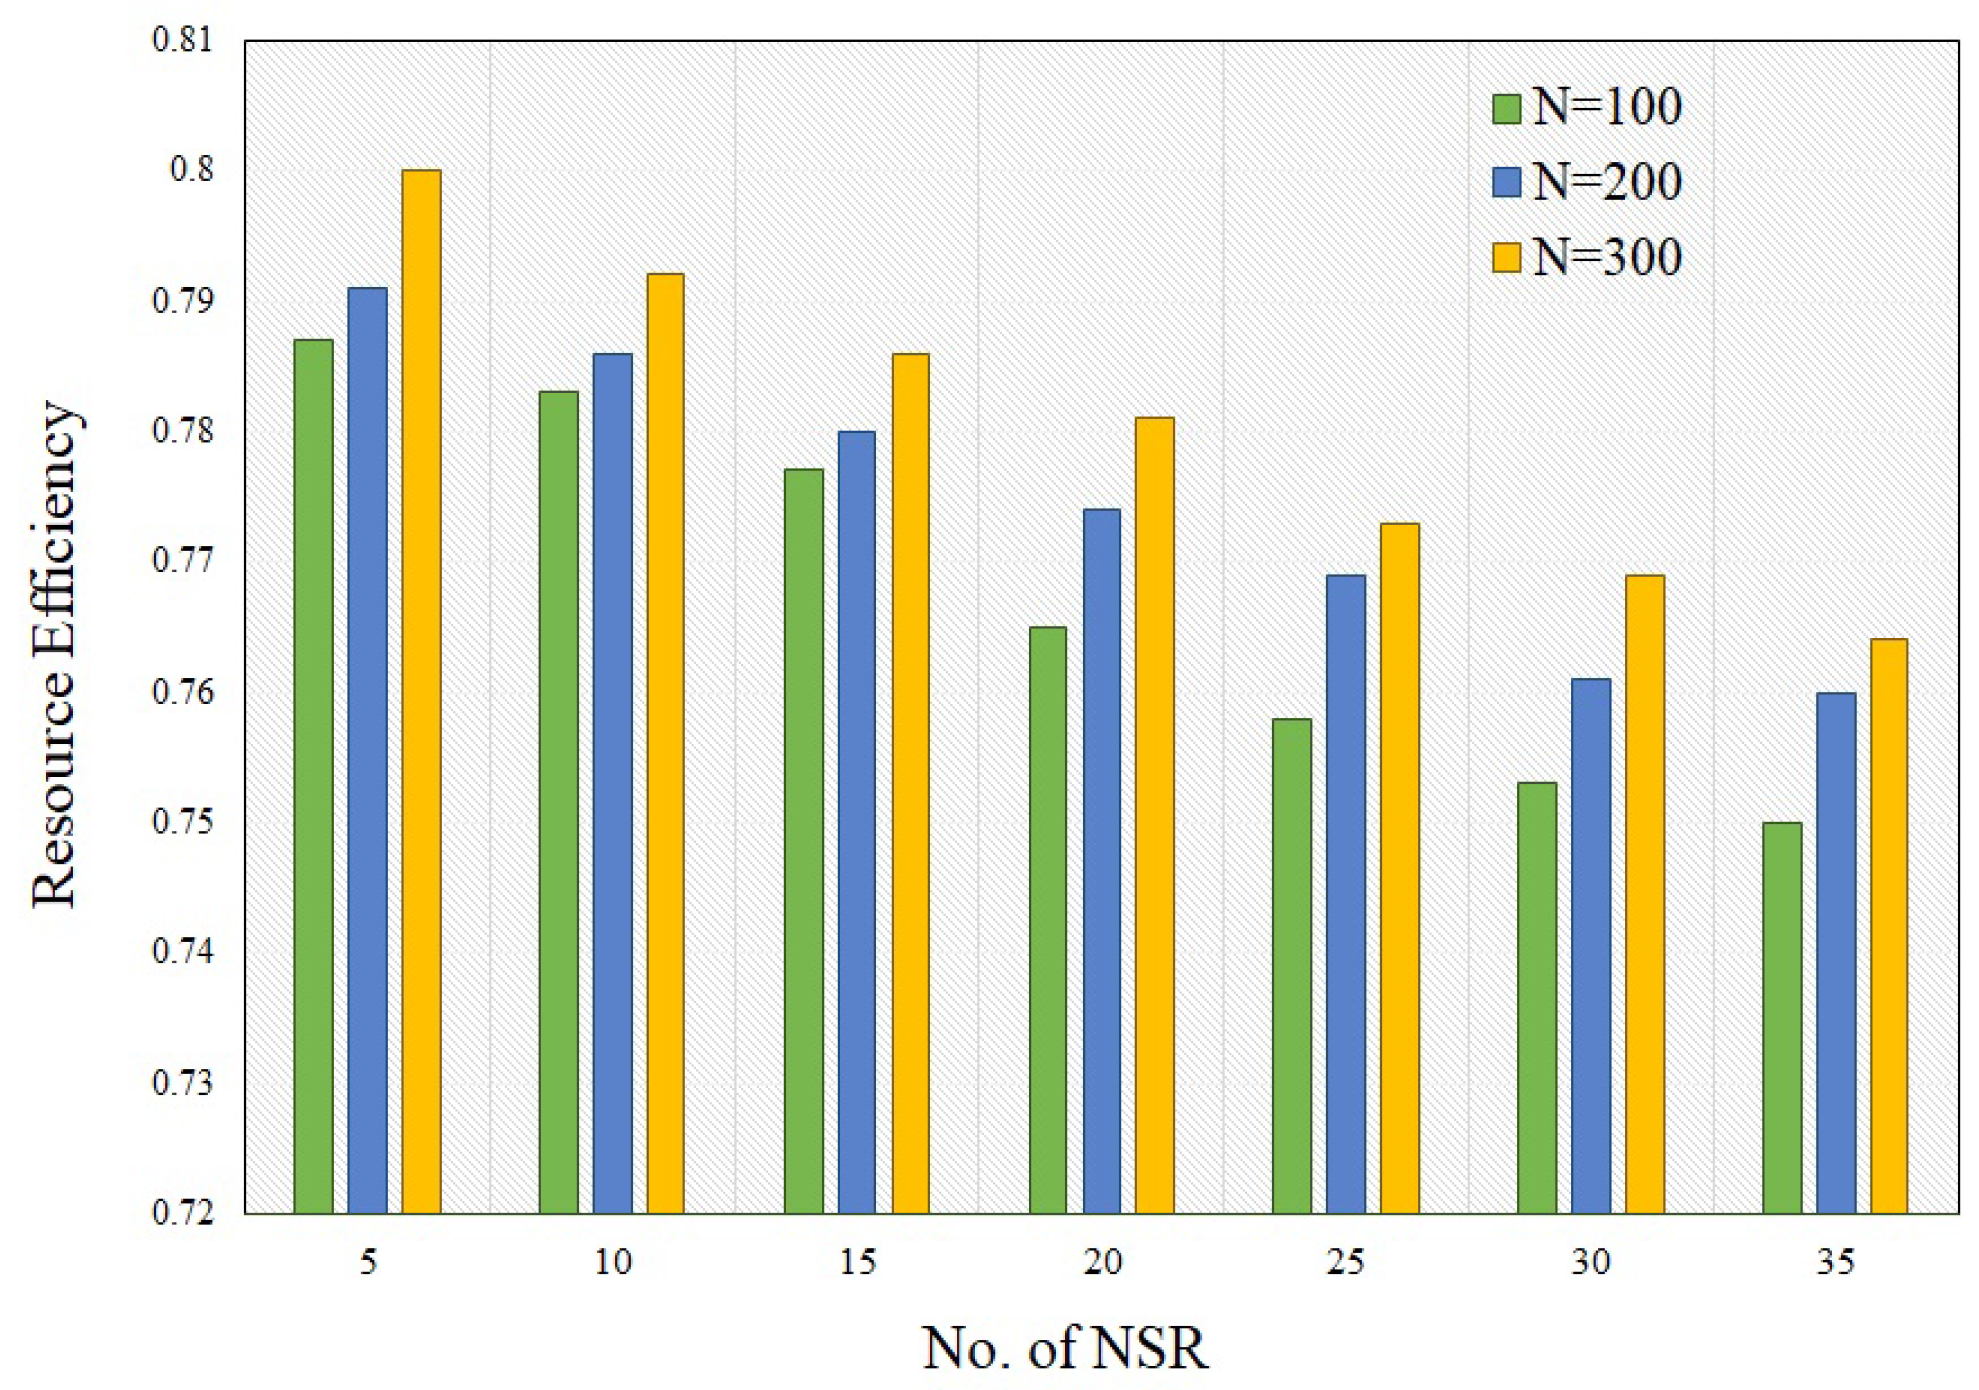
  • Average Resource Efficiency: Figure 3 depicts the resource efficiency that is achieved under a variety of operational conditions for the system. In terms of the overarching observation regarding resource efficiency and NRs, Figure 3 demonstrates that the resource efficiency of the network decreases as the number of NRs increases, whereas the efficiency improves with the number of nodes in the physical infrastructure. An increased number of nodes in a network will, as demonstrated by the resource efficiency equation, result in a shorter overall length of the shortest route, which in turn will lead to improved resource utilization. Additionally, because of the rise in the number of NRs, it is necessary to provide additional nodes that have adequate CPU capacity and bandwidth. According to Figure 3, the proposed method achieves a resource efficiency of 0.783, 0.765, and 0.753 for NRs 10, 20, and 30, respectively, when applied to an infrastructure with a total of 100 nodes. In addition, the efficiency of the resource improves as the number of nodes increases to 200 and 300, reaching a maximum of 0.8 under 5 NRs for a physical resource that has 300 nodes, as shown in Figure 3.
  • Average Acceptance Ratio: NRs ranging from 5 to 35 are used in this investigation with the suggested method for calculating the acceptance ratio. The results obtained after successful execution of the algorithm under a variety of different conditions pertaining to the physical infrastructure are displayed in Figure 4. Despite the fact that the number of physical nodes is growing, the acceptance ratio will decrease as the total number of requests (NR) increases. Because there are now more nodes, a larger proportion of the population has come around to accepting it. The acceptance ratio increases concurrently with the increase in number of nodes of physical infrastructure. In Figure 4, the proposed method achieves a 100% acceptance rate when receiving 5 NRs, regardless of the number of nodes in its PI. In addition, Figure 4 shows that the requesting service for 35 NRs in PI with 100 nodes results in a poor acceptance rate of 0.4%.
  • Average CPU and Bandwidth utilization: The amount of CPU and bandwidth used within an infrastructure consisting of 100, 200, and 300 nodes is also measured with a variety of request counts. The obtained results can be seen in Figure 5, which are categorized according to the number of PI nodes and total NR. The proposed system is capable of serving a maximum of 7265 CPUs and a minimum of 1236 CPUs, as well as having a maximum and minimum utilization of 21,186 and 4628 BW when operating under a PI that is equipped with 100 and 300 nodes, respectively.

5.2.2. Dynamic Provisioning

According to dynamic provisioning, the life times of the requests are chosen at random within the range that is specified in Table 1. In addition, the resources that are occupied by embedded requests in the physical infrastructure are released once the life time of the embedded request has passed, which retains the resources for requests that will be made in the future. The values of all other parameters for PI and request, as well as the assumptions, are made as in the previous case. This strategy is also evaluated by taking into account the number of NR nodes that fall into various categories, such as 10, 20, and 30 within the context of 100, 200, and 300 nodes that make up the physical infrastructure. Dynamic provisioning’s utility is demonstrated by comparing the results with those of static provisioning’s resource efficiency, acceptance rate, CPU, and bandwidth consumption.
  • Average resource efficiency: It is understandable that resource efficiency is measured in terms of the availability and utilization of the resources available to a given project. Static and dynamic provisioning yield nearly identical resource efficiency when using the proposed approach. Nodes in the PI and the number of requests they receive have an impact on the value, which varies with the number of nodes and requests. Figure 6 illustrates the proposed approach’s resource efficiency under both static and dynamic provisioning.
  • Average acceptance ratio: When dynamic provisioning is carried out through the proposed strategy, it stands to reason that the acceptance ratio will increase. This is because the occupied resources will be freed up depending on how long the existing requests will remain active, so it is logical that this will cause the increase. Figure 7 provides a visual representation of the acceptance ratio in relation to a selection of possible infrastructure provision scenarios. According to the data, dynamic provisioning results in a greater improvement in the acceptance ratio, with a maximum and minimum percentage improvement of 37% and 19% under the PI equipped with 100 nodes and 300 nodes, respectively. This represents a significant leap from the previous level of improvement. It is abundantly clear from the findings that the greatest percentage of improvement can be accomplished when the network operates with the fewest possible resources.
  • Average CPU and bandwidth utilization: Figure 8 illustrates the dynamic provisioning and shows the number of CPUs that are served as well as the bandwidth that is utilized. According to the figure, the provisioning chosen allows for the highest possible utilization of both the CPU and the bandwidth within the context of the system conditions. As with static provisioning, CPU and bandwidth utilization through dynamic provisioning increases as infrastructure and the number of requests increase.

5.2.3. Discussion

This section demonstrates the effectiveness of the proposed algorithm by comparing the obtained results with the literature, specifically NNR [15], CN [16], and VIKOR [17]. It is presumable that the dynamic provisioning service for network requests is made available to all of the proposed algorithms. When the PI is outfitted with 300 nodes and is responsible for catering to a wide variety of network requests, resource efficiency and acceptance rate are taken into consideration for the comparison. The performance of the various algorithms is illustrated in Figure 9, which is organized according to a variety of categories.
It is clear from Figure 9a that the CN algorithm has the lowest throughput of any and all of the other algorithms when they are combined. VIKOR NNR and DVNE all outperformed CN in terms of performance. When there are 300 nodes and 30 NSRs, an efficiency of 0.753 is recorded. The proposed method for calculating the acceptance ratio is evaluated using NRs in the range of 5 to 35. The life-spans of the NRs are picked at random from a range that has been determined in advance. The results obtained after the algorithms have been successfully run under the conditions of a physical infrastructure consisting of 300 nodes are displayed in Figure 9b. The acceptance ratio drops when the total number of NR points is increased. On the other hand, when NR lifespans are decreased, acceptance ratios tend to increase along with them. A maximum acceptance ratio of 0.98 can be accomplished with the proposed method, while a minimum acceptance ratio of 0.7 can be accomplished with 35 NRs. The NNR algorithm is ranked in second place because it produces results that are on par with those produced by the DVNE algorithm. When it comes to allocation of network resources using the CN and VIKOR approaches, the lowest acceptance ratios are 0.68 and 0.66 for 35 NRs under available nodes, respectively. These numbers are based on the number of nodes.
To further validate the performance of the proposed algorithm, in addition to resource efficiency and acceptance ratio, the time required by each of the various algorithms to finish the task is analyzed and compared. As can be seen in Figure 10, a comparison of the execution times for provisioning while using various NRs is performed. The amount of time required to carry out the algorithmic procedures grows in direct proportion to the total number of NRs and available nodes in the physical infrastructure. The time needed to complete the resource allocation algorithm developed by DVNE is significantly greater than that required by the other two algorithms under any and all conditions of the operation.
When a physical infrastructure consists of 100 nodes, it takes fewer than 10 milliseconds to serve NRs with values ranging from 5 to 35. In addition, the same number of NRs served on the PI with 300 nodes requires a response time that is only slightly longer than 10 milliseconds. When compared with the SA approach’s execution time, the VIKOR approach’s execution time is significantly faster. The amount of extra time needed to finish a task when using the SA approach can range anywhere from 100 ms to 1000 ms.

6. Conclusions

In the course of this research, an approach to a solution was developed for efficient network slicing within the context of a 5G mobile network environment. All aspects of the deployment plan, including the NRs and the physical infrastructure, were modeled. The proposed strategy takes into account the facets of network slicing that are regarded as being of the utmost significance, namely the isolation of slices and their management. The DVNE scheme utilizes heuristic fuzzy for node allocation and Dijkstra’s algorithm for link establishment. The proposed scheme, which was responsible for dynamic provisioning, also managed the slices themselves and handled slice management. The proposed strategies are evaluated under a wide variety of network operating conditions, each of which has its own unique PI and NSR values. In order to evaluate the effectiveness of network slicing, we looked at resource efficiency, acceptance ratio, CPU/BW utilization, and execution time. As a result of including constraints in the resource allocation process, concerns about the NSRs’ minimal SLA and security have been addressed. The proposed work can be expanded to incorporate a higher level of SLA and security concerns. Additionally, it can be expanded to take into account the portability of user equipment and the management of its energy consumption.

Author Contributions

Conceptualization, S.T. and I.-H.R.; methodology, S.T. and V.S.; investigation, S.T. and V.S.; writing—original draft preparation, S.T.; writing—review and editing, H.-G.J. and I.-H.R.; supervision, I.-H.R. All authors have read and agreed to the published version of the manuscript.

Funding

This work was supported by the National Research Foundation of Korea (NRF) grant funded by the Korea government (MSIT) (No. 2021R1A2C2014333).

Conflicts of Interest

The authors declare no conflict of interest.

References

  1. Henry, S.; Alsohaily, A.; Sousa, E.S. 5G is real: Evaluating the compliance of the 3GPP 5G new radio system with the ITU IMT-2020 requirements. IEEE Access 2020, 8, 42828–42840. [Google Scholar] [CrossRef]
  2. Jain, A.; Lopez-Aguilera, E.; Demirkol, I. User association and resource allocation in 5G (AURA-5G): A joint optimization framework. Comput. Netw. 2021, 192, 108063. [Google Scholar] [CrossRef]
  3. Alliance, N. Description of network slicing concept. NGMN 5G P 2016, 1, 1–11. [Google Scholar]
  4. Zhang, H.; Liu, N.; Chu, X.; Long, K.; Aghvami, A.H.; Leung, V.C. Network slicing based 5G and future mobile networks: Mobility, resource management, and challenges. IEEE Commun. Mag. 2017, 55, 138–145. [Google Scholar] [CrossRef]
  5. 3GPP. Study on Management and Orchestration of Network Slicing for Next Generation Network; 3GPP: Valbonne, France, 2017. [Google Scholar]
  6. Ordonez-Lucena, J.; Ameigeiras, P.; Lopez, D.; Ramos-Munoz, J.J.; Lorca, J.; Folgueira, J. Network slicing for 5G with SDN/NFV: Concepts, architectures, and challenges. IEEE Commun. Mag. 2017, 55, 80–87. [Google Scholar] [CrossRef] [Green Version]
  7. Subedi, P.; Alsadoon, A.; Prasad, P.; Rehman, S.; Giweli, N.; Imran, M.; Arif, S. Network slicing: A next generation 5G perspective. EURASIP J. Wirel. Commun. Netw. 2021, 2021, 102. [Google Scholar] [CrossRef]
  8. Chagdali, A.; Elayoubi, S.E.; Masucci, A.M. Slice Function Placement Impact on the Performance of URLLC with Multi-Connectivity. Computers 2021, 10, 67. [Google Scholar] [CrossRef]
  9. Alotaibi, D. Survey on Network Slice Isolation in 5G Networks: Fundamental Challenges. Procedia Comput. Sci. 2021, 182, 38–45. [Google Scholar] [CrossRef]
  10. Sohaib, R.M.; Onireti, O.; Sambo, Y.; Imran, M.A. Network Slicing for Beyond 5G Systems: An Overview of the Smart Port Use Case. Electronics 2021, 10, 1090. [Google Scholar] [CrossRef]
  11. Ojijo, M.O.; Falowo, O.E. A survey on slice admission control strategies and optimization schemes in 5G network. IEEE Access 2020, 8, 14977–14990. [Google Scholar] [CrossRef]
  12. Chahbar, M.; Diaz, G.; Dandoush, A.; Cérin, C.; Ghoumid, K. A comprehensive survey on the e2e 5g network slicing model. IEEE Trans. Netw. Serv. Manag. 2020, 18, 49–62. [Google Scholar] [CrossRef]
  13. Cheng, X.; Su, S.; Zhang, Z.; Wang, H.; Yang, F.; Luo, Y.; Wang, J. Virtual network embedding through topology-aware node ranking. ACM SIGCOMM Comput. Commun. Rev. 2011, 41, 38–47. [Google Scholar] [CrossRef]
  14. Zhang, P.; Yao, H.; Liu, Y. Virtual network embedding based on the degree and clustering coefficient information. IEEE Access 2016, 4, 8572–8580. [Google Scholar] [CrossRef]
  15. Cao, H.; Yang, L.; Zhu, H. Novel node-ranking approach and multiple topology attributes-based embedding algorithm for single-domain virtual network embedding. IEEE Internet Things J. 2017, 5, 108–120. [Google Scholar] [CrossRef]
  16. Guan, W.; Wen, X.; Wang, L.; Lu, Z.; Shen, Y. A service-oriented deployment policy of end-to-end network slicing based on complex network theory. IEEE Access 2018, 6, 19691–19701. [Google Scholar] [CrossRef]
  17. Li, X.; Guo, C.; Gupta, L.; Jain, R. Efficient and secure 5G core network slice provisioning based on VIKOR approach. IEEE Access 2019, 7, 150517–150529. [Google Scholar] [CrossRef]
  18. Xu, Q.; Wang, J.; Wu, K. Learning-based dynamic resource provisioning for network slicing with ensured end-to-end performance bound. IEEE Trans. Netw. Sci. Eng. 2018, 7, 28–41. [Google Scholar] [CrossRef]
  19. Chien, H.T.; Lin, Y.D.; Lai, C.L.; Wang, C.T. End-to-end slicing with optimized communication and computing resource allocation in multi-tenant 5G systems. IEEE Trans. Veh. Technol. 2019, 69, 2079–2091. [Google Scholar] [CrossRef]
  20. Sun, Y.; Qin, S.; Feng, G.; Zhang, L.; Imran, M.A. Service provisioning framework for RAN slicing: User admissibility, slice association and bandwidth allocation. IEEE Trans. Mob. Comput. 2020, 20, 3409–3422. [Google Scholar] [CrossRef]
  21. Mekki, M.; Arora, S.; Ksentini, A. A Scalable Monitoring Framework for Network Slicing in 5G and Beyond Mobile Networks. IEEE Trans. Netw. Serv. Manag. 2021, 19, 413–423. [Google Scholar] [CrossRef]
  22. Dotcenko, S.; Vladyko, A.; Letenko, I. A fuzzy logic-based information security management for software-defined networks. In Proceedings of the 16th International Conference on Advanced Communication Technology, Pyeongchang, Korea, 16–19 February 2014; pp. 167–171. [Google Scholar]
  23. Wu, J.; Liu, J.; Huang, Z.; Zheng, S. Dynamic fuzzy Q-learning for handover parameters optimization in 5G multi-tier networks. In Proceedings of the International Conference on Wireless Communications & Signal Processing (WCSP), Nanjing, China, 15–17 October 2015; pp. 1–5. [Google Scholar]
  24. Albarracin-Sanchez, L.F.; Puerto-Leguizamón, G.A. Fuzzy systems: An approach to 5G networks under the software defined network paradigm. Rev. Científica 2018, 1, 96–110. [Google Scholar] [CrossRef]
  25. Zhang, M.; Dou, Y.; Chong, P.H.J.; Chan, H.C.; Seet, B.C. Fuzzy Logic-Based Resource Allocation Algorithm for V2X Communications in 5G Cellular Networks. IEEE J. Sel. Areas Commun. 2021, 39, 2501–2513. [Google Scholar] [CrossRef]
  26. Ampririt, P.; Qafzezi, E.; Bylykbashi, K.; Ikeda, M.; Matsuo, K.; Barolli, L. FSSLA: A Fuzzy-based scheme for slice service level agreement in 5G wireless networks and its performance evaluation. J. High Speed Netw. 2022, 28, 47–64. [Google Scholar] [CrossRef]
  27. Ampririt, P.; Qafzezi, E.; Bylykbashi, K.; Ikeda, M.; Matsuo, K.; Barolli, L. A Fuzzy-Based Scheme for Slice Priority Assessment in 5G Wireless Networks. In Proceedings of the International Conference on Advanced Information Networking and Applications, Sydney, Australia, 13–15 April 2022; pp. 651–661. [Google Scholar]
Figure 1. 5G network slicing architecture.
Applsci 12 06942 g001
Figure 2. Proposed strategy for dynamic network embedding.
Applsci 12 06942 g002
Figure 3. Average resource efficiency of static provisioning.
Applsci 12 06942 g003
Figure 4. Average acceptance ratio of static provisioning.
Applsci 12 06942 g004
Figure 5. Resource utilization of static provisioning. (a) CPU utilization, (b) bandwidth utilization.
Applsci 12 06942 g005
Figure 6. Resource efficiency of dynamic provisioning: (a) 100 nodes, (b) 200 nodes, (c) 300 nodes.
Applsci 12 06942 g006
Figure 7. Acceptance ratio of dynamic provisioning: (a) 100 nodes, (b) 200 nodes, (c) 300 Nodes.
Applsci 12 06942 g007
Figure 8. Resource utilization of DVNE. (a) CPU used, (b) bandwidth used.
Applsci 12 06942 g008
Figure 9. Performance results. (a) Resource efficiency, (b) acceptance ratio.
Applsci 12 06942 g009
Figure 10. Execution time of DVNE with other algorithms.
Applsci 12 06942 g010
Table 1. Simulation parameters.
Physical Infrastructure
DefinitionsDescriptionsRange
N P I Number of physical nodes100, 200, 300
C P U P I Distribution of CPU capacity for each node in unitU[20,50]
B W P I Distribution of bandwidth for each link in unitU[20,50]
S A P I Distribution of available security level for each node in in real number(0–1)
Network Request
DefinitionsDescriptionsRange
T N R Total number of NRs arrived in the time frameU[5,35]
N N R Distribution of nodes for each NSR20
C P U N R Distribution of CPU capacity requirement for each node of a NRU[5,25]
B W N R Distribution of bandwidth requirement for each link of a NRU[5,25]
S R N R Distribution of required security level for each node in real number(0–0.5)
L T N R Time duration of each NRT[10,35]
Publisher’s Note: MDPI stays neutral with regard to jurisdictional claims in published maps and institutional affiliations.

