
Assessment of Cracking in Masonry Structures Based on the Breakage of Ordinary Silica-Core Silica-Clad Optical Fibers


Abstract
:1. Introduction
1.1. Earthquakes: A Need for Rapid Assessment of Structural Damage
1.2. Methods for Detecting Damage to Civil Engineering Structures
1.3. Cracking of Load-Bearing Structural Elements
1.4. Optical Fiber Breakage as an Indication of Cracking of Structural Elements
- -
- First, the optical coupling between the two parts of a broken fiber depends not only on their axial displacement but also on many random factors, including the angle between the crack and the fiber axis, the shear displacement of the two parts, and the roughness of their end faces. Therefore, signal loss cannot be uniquely related to the expansion of the crack.
- -
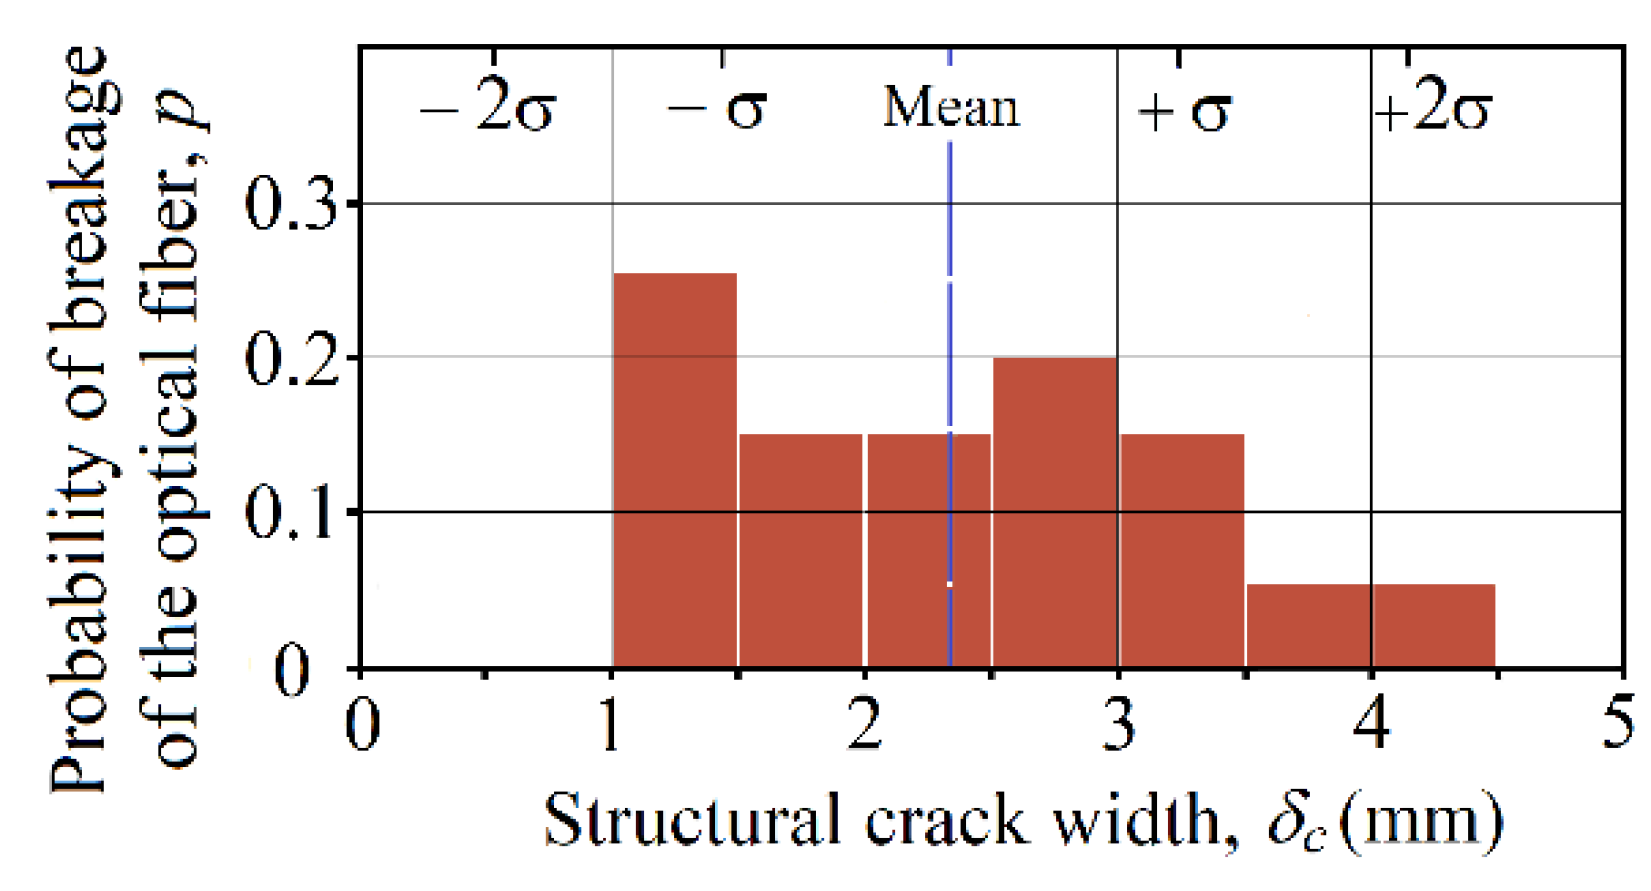
- Second, optical fibers, as a brittle material, break at slightly different structural crack widths each time (this property is discussed in detail in the following sections).
- -
- Third, the pioneering work did not demonstrate a practical cost-effective implementation of this method. These might be the three main reasons as to why it has never been used to detect structural damage in buildings.
1.5. Ultimate Strength of Optical Fibers
1.6. The Authors’ Previous Research
1.7. Objectives
2. Materials and Methods
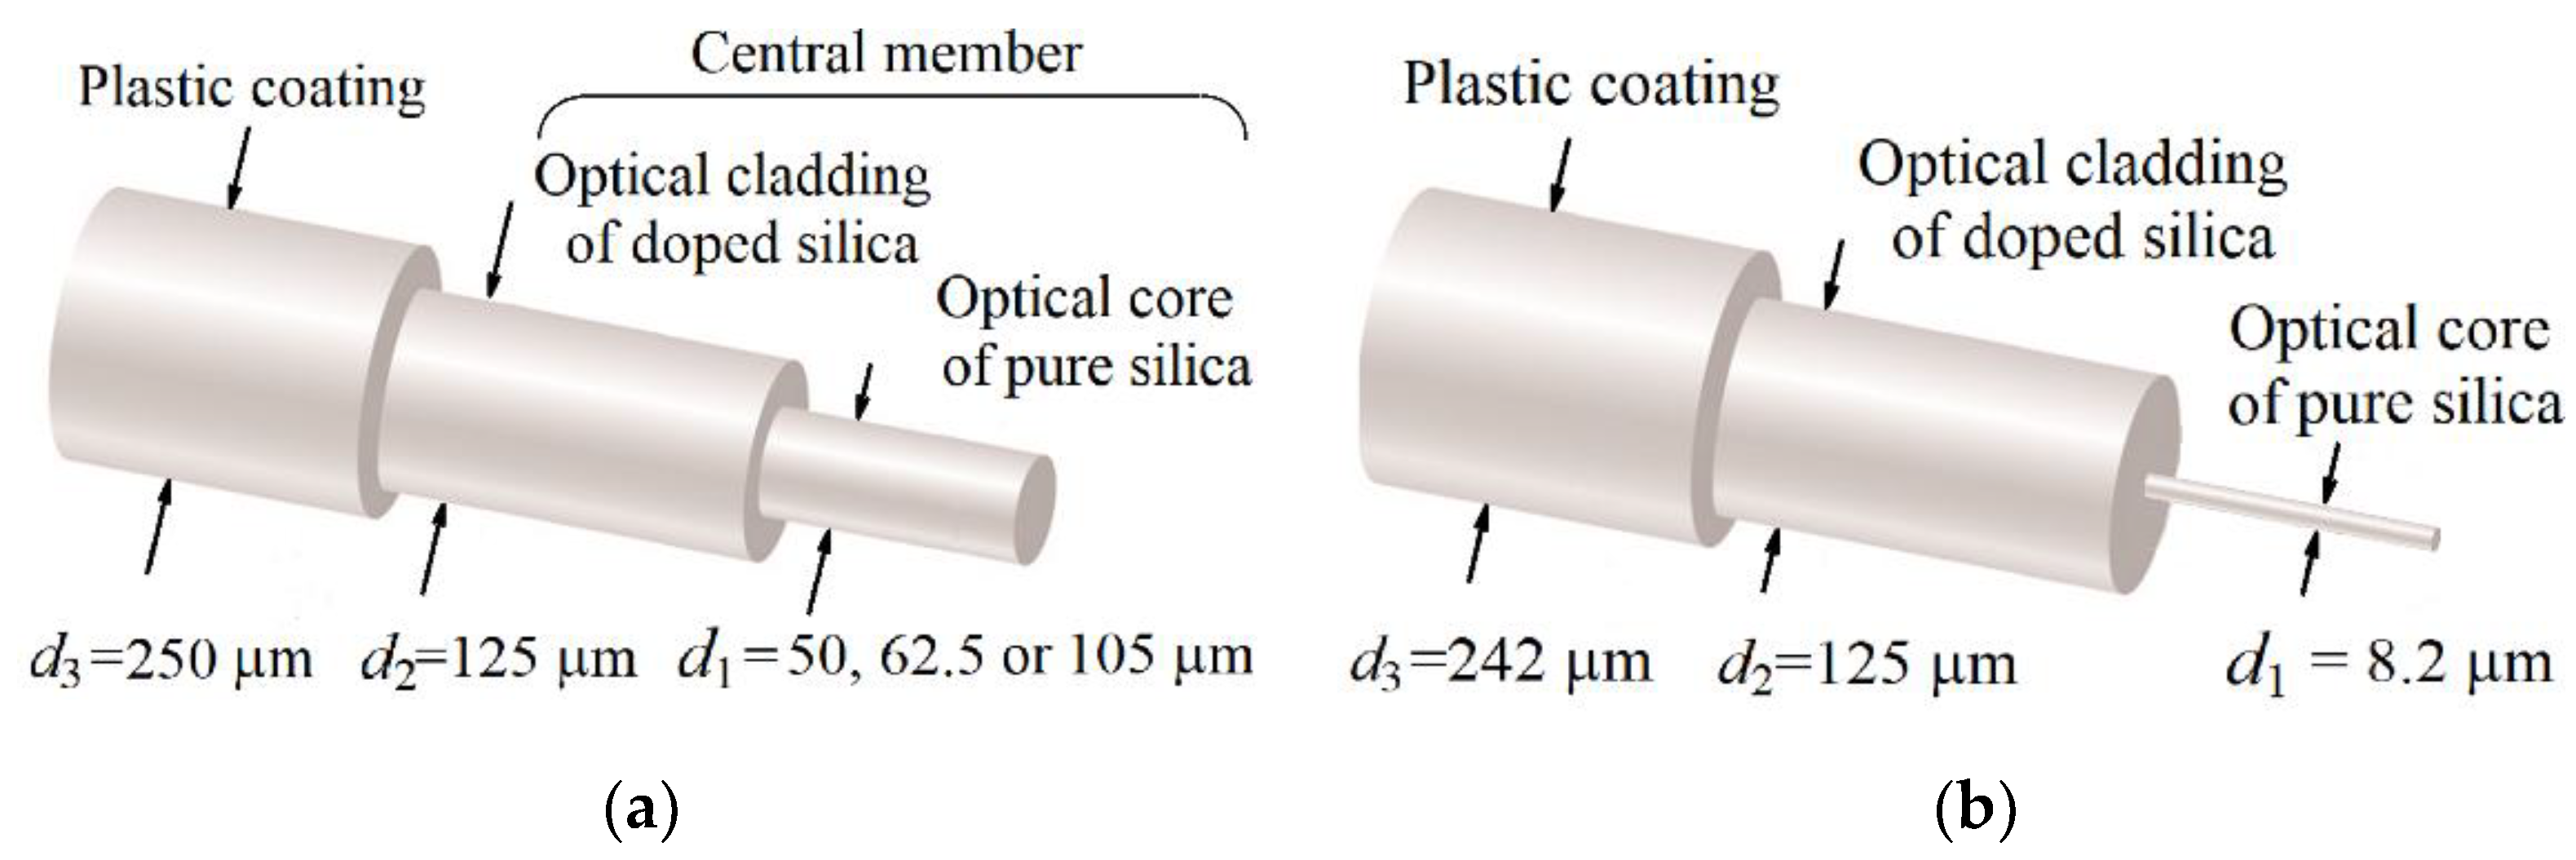
2.1. Choosing the Right Optical Fiber
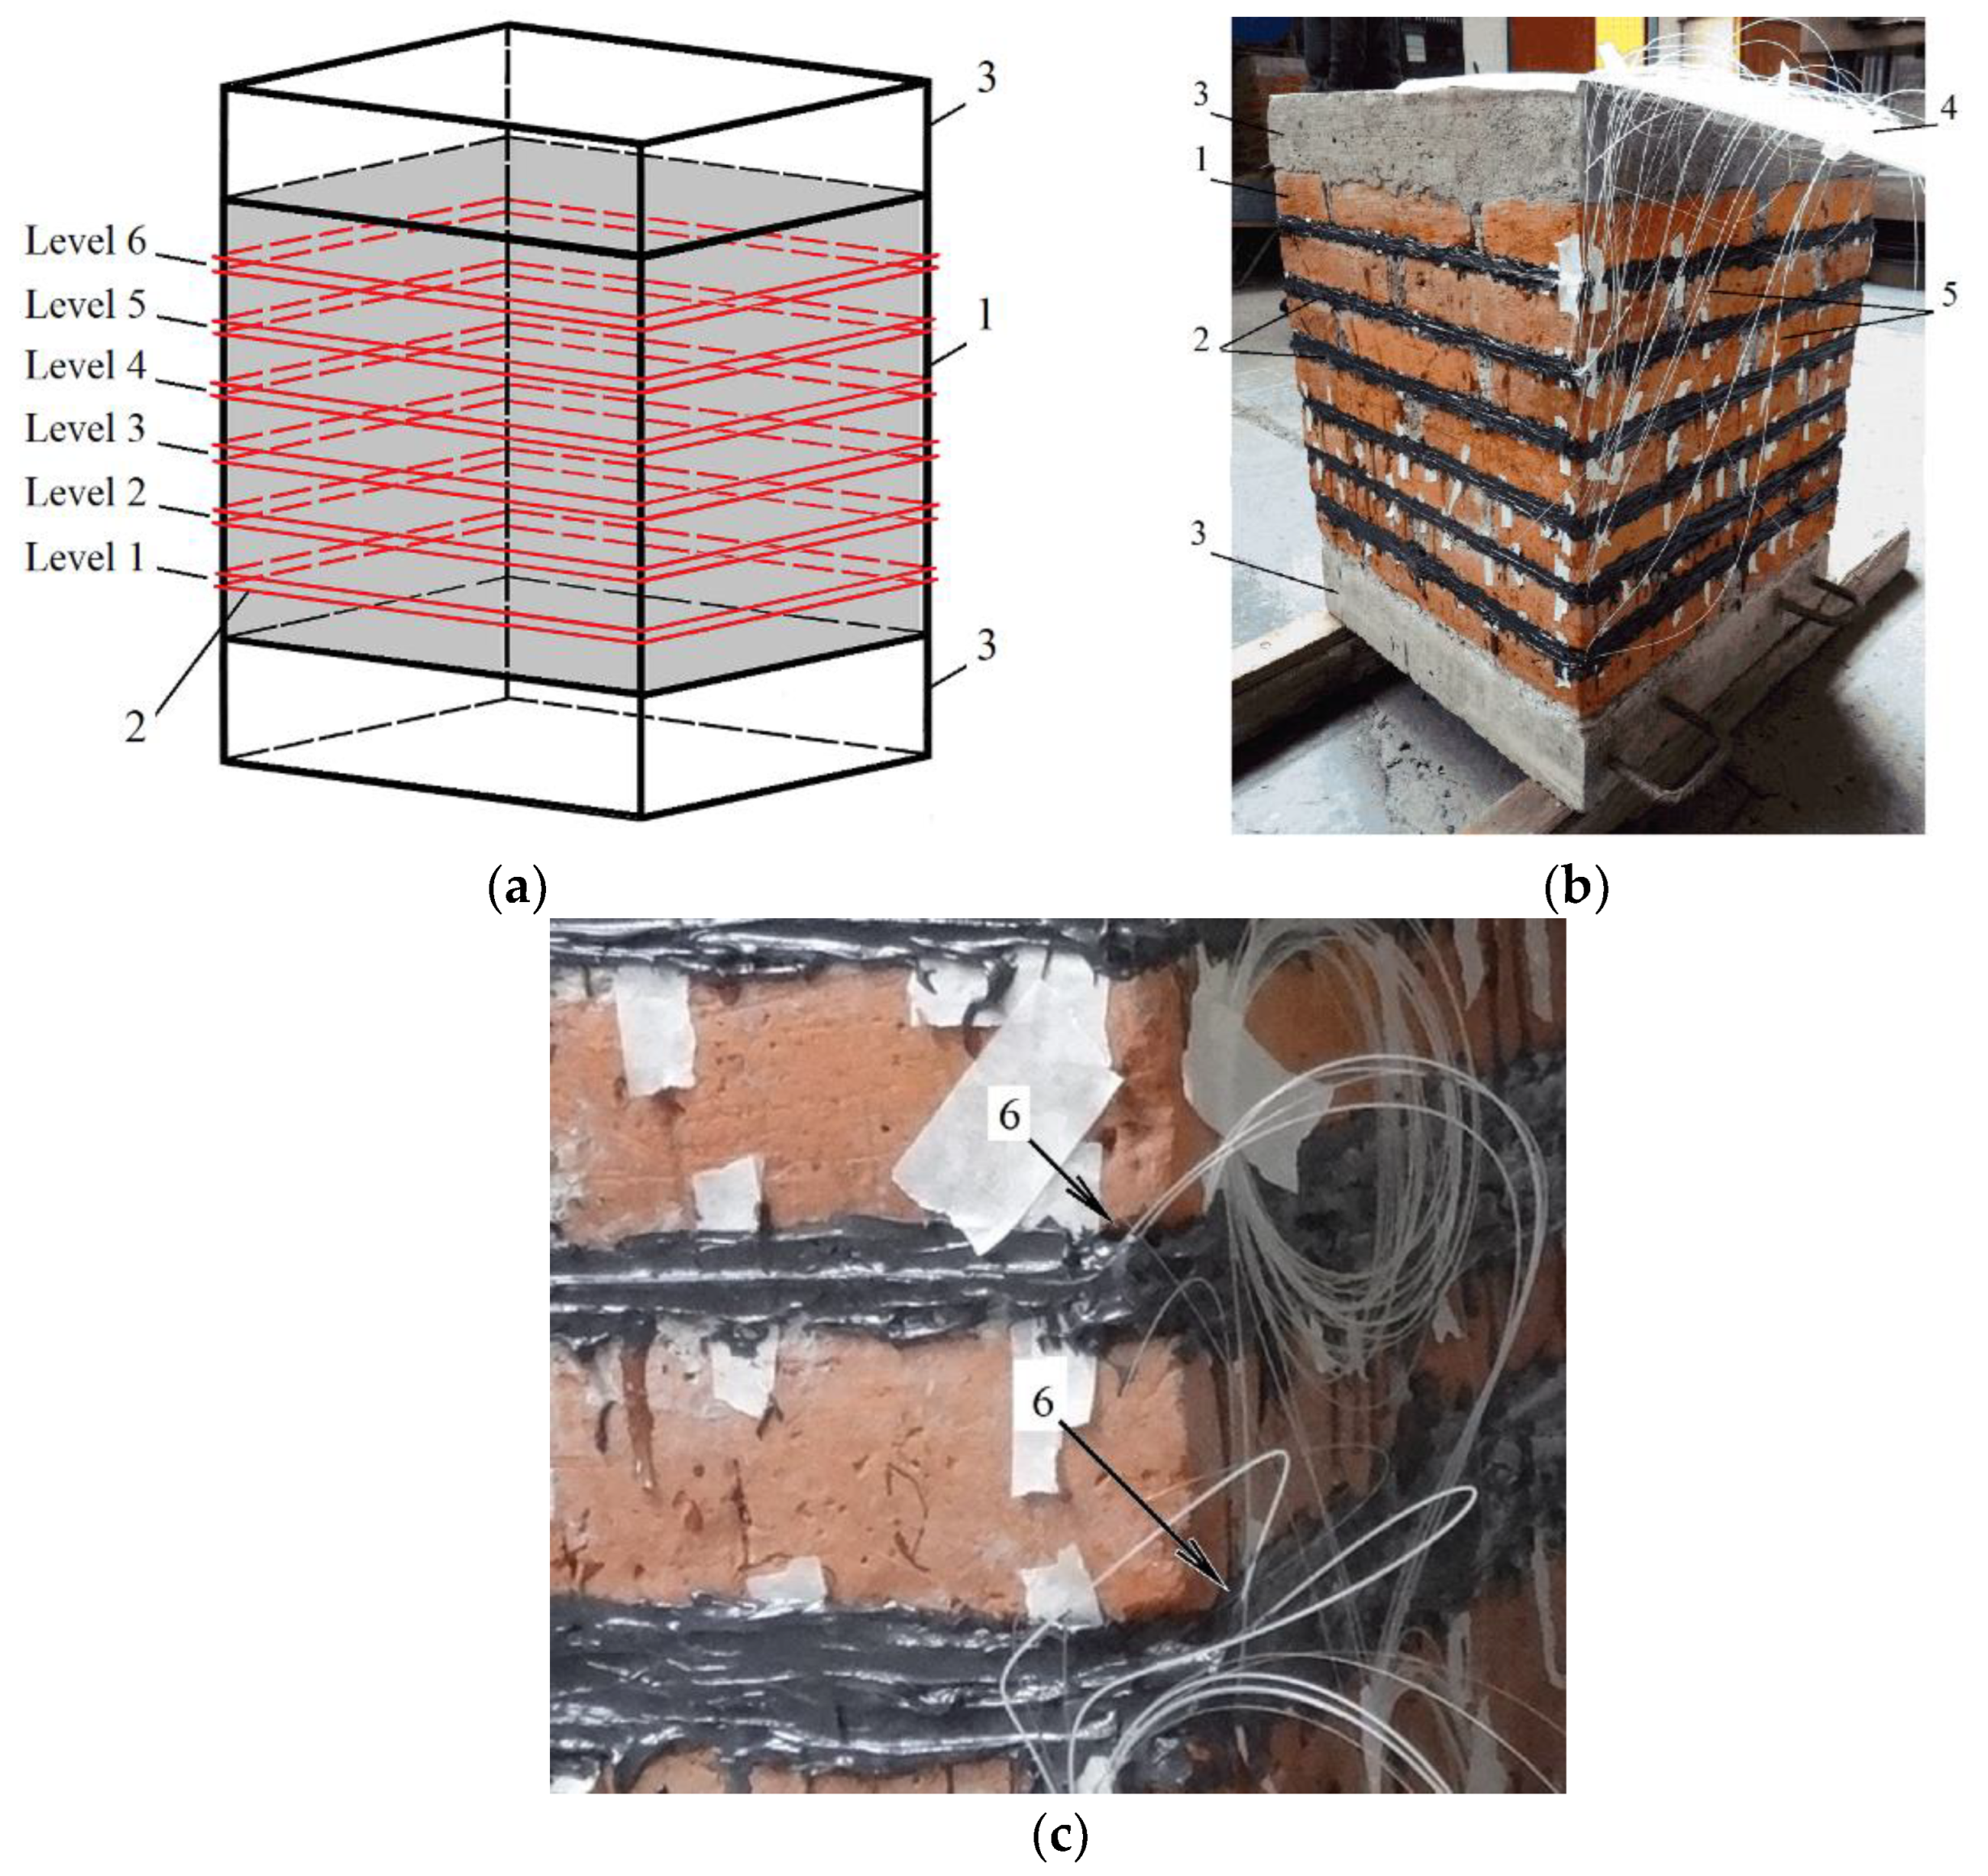
2.2. Test Specimen
2.3. Optical Fiber Array
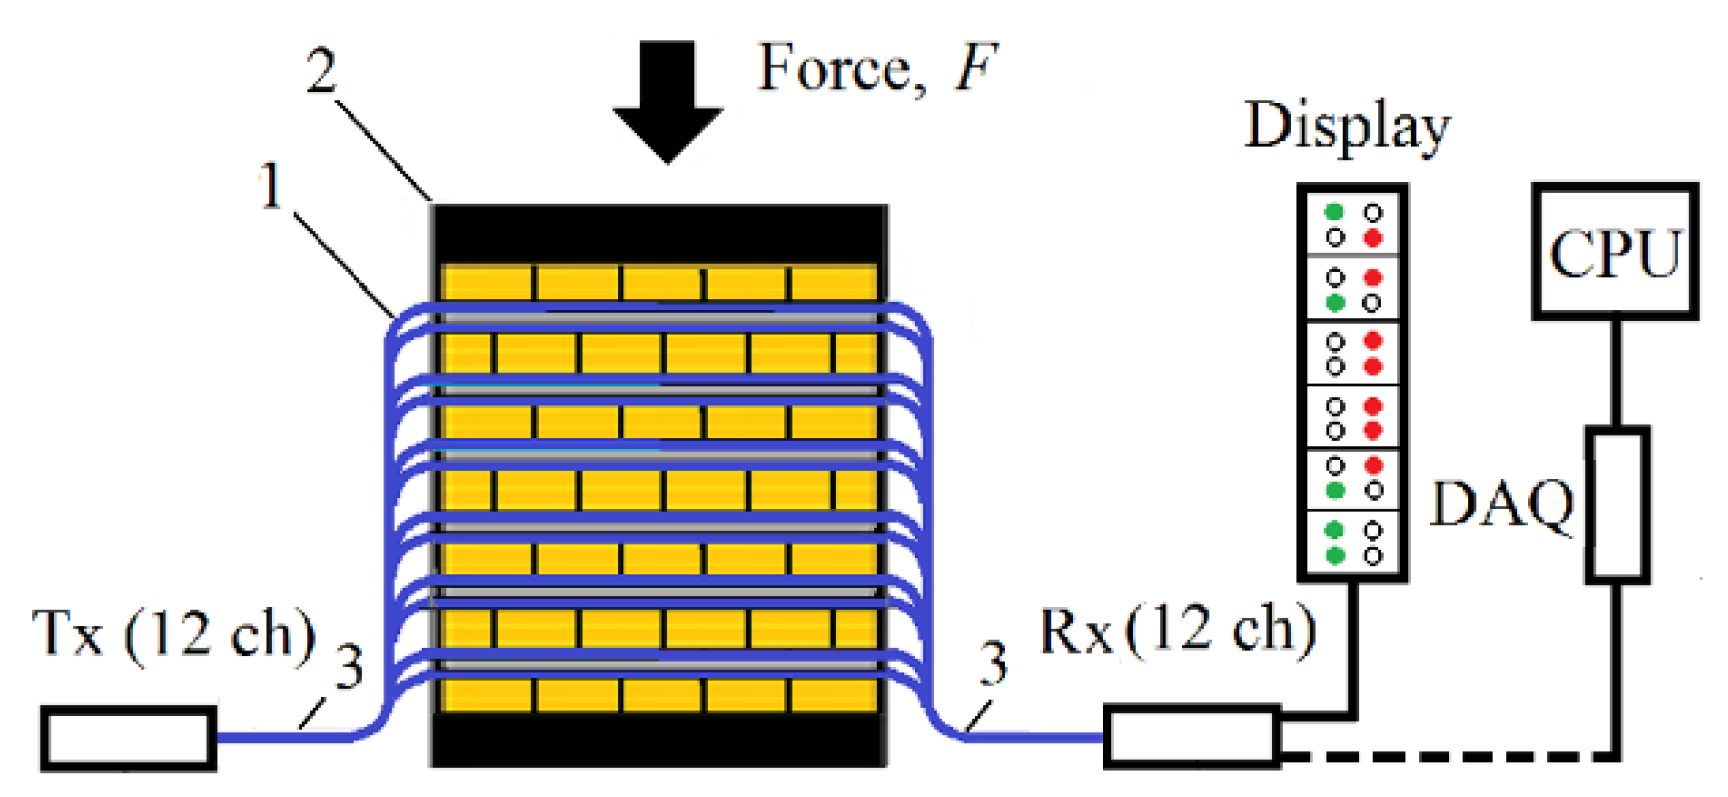
2.4. Opto-Electronic Monitoring System
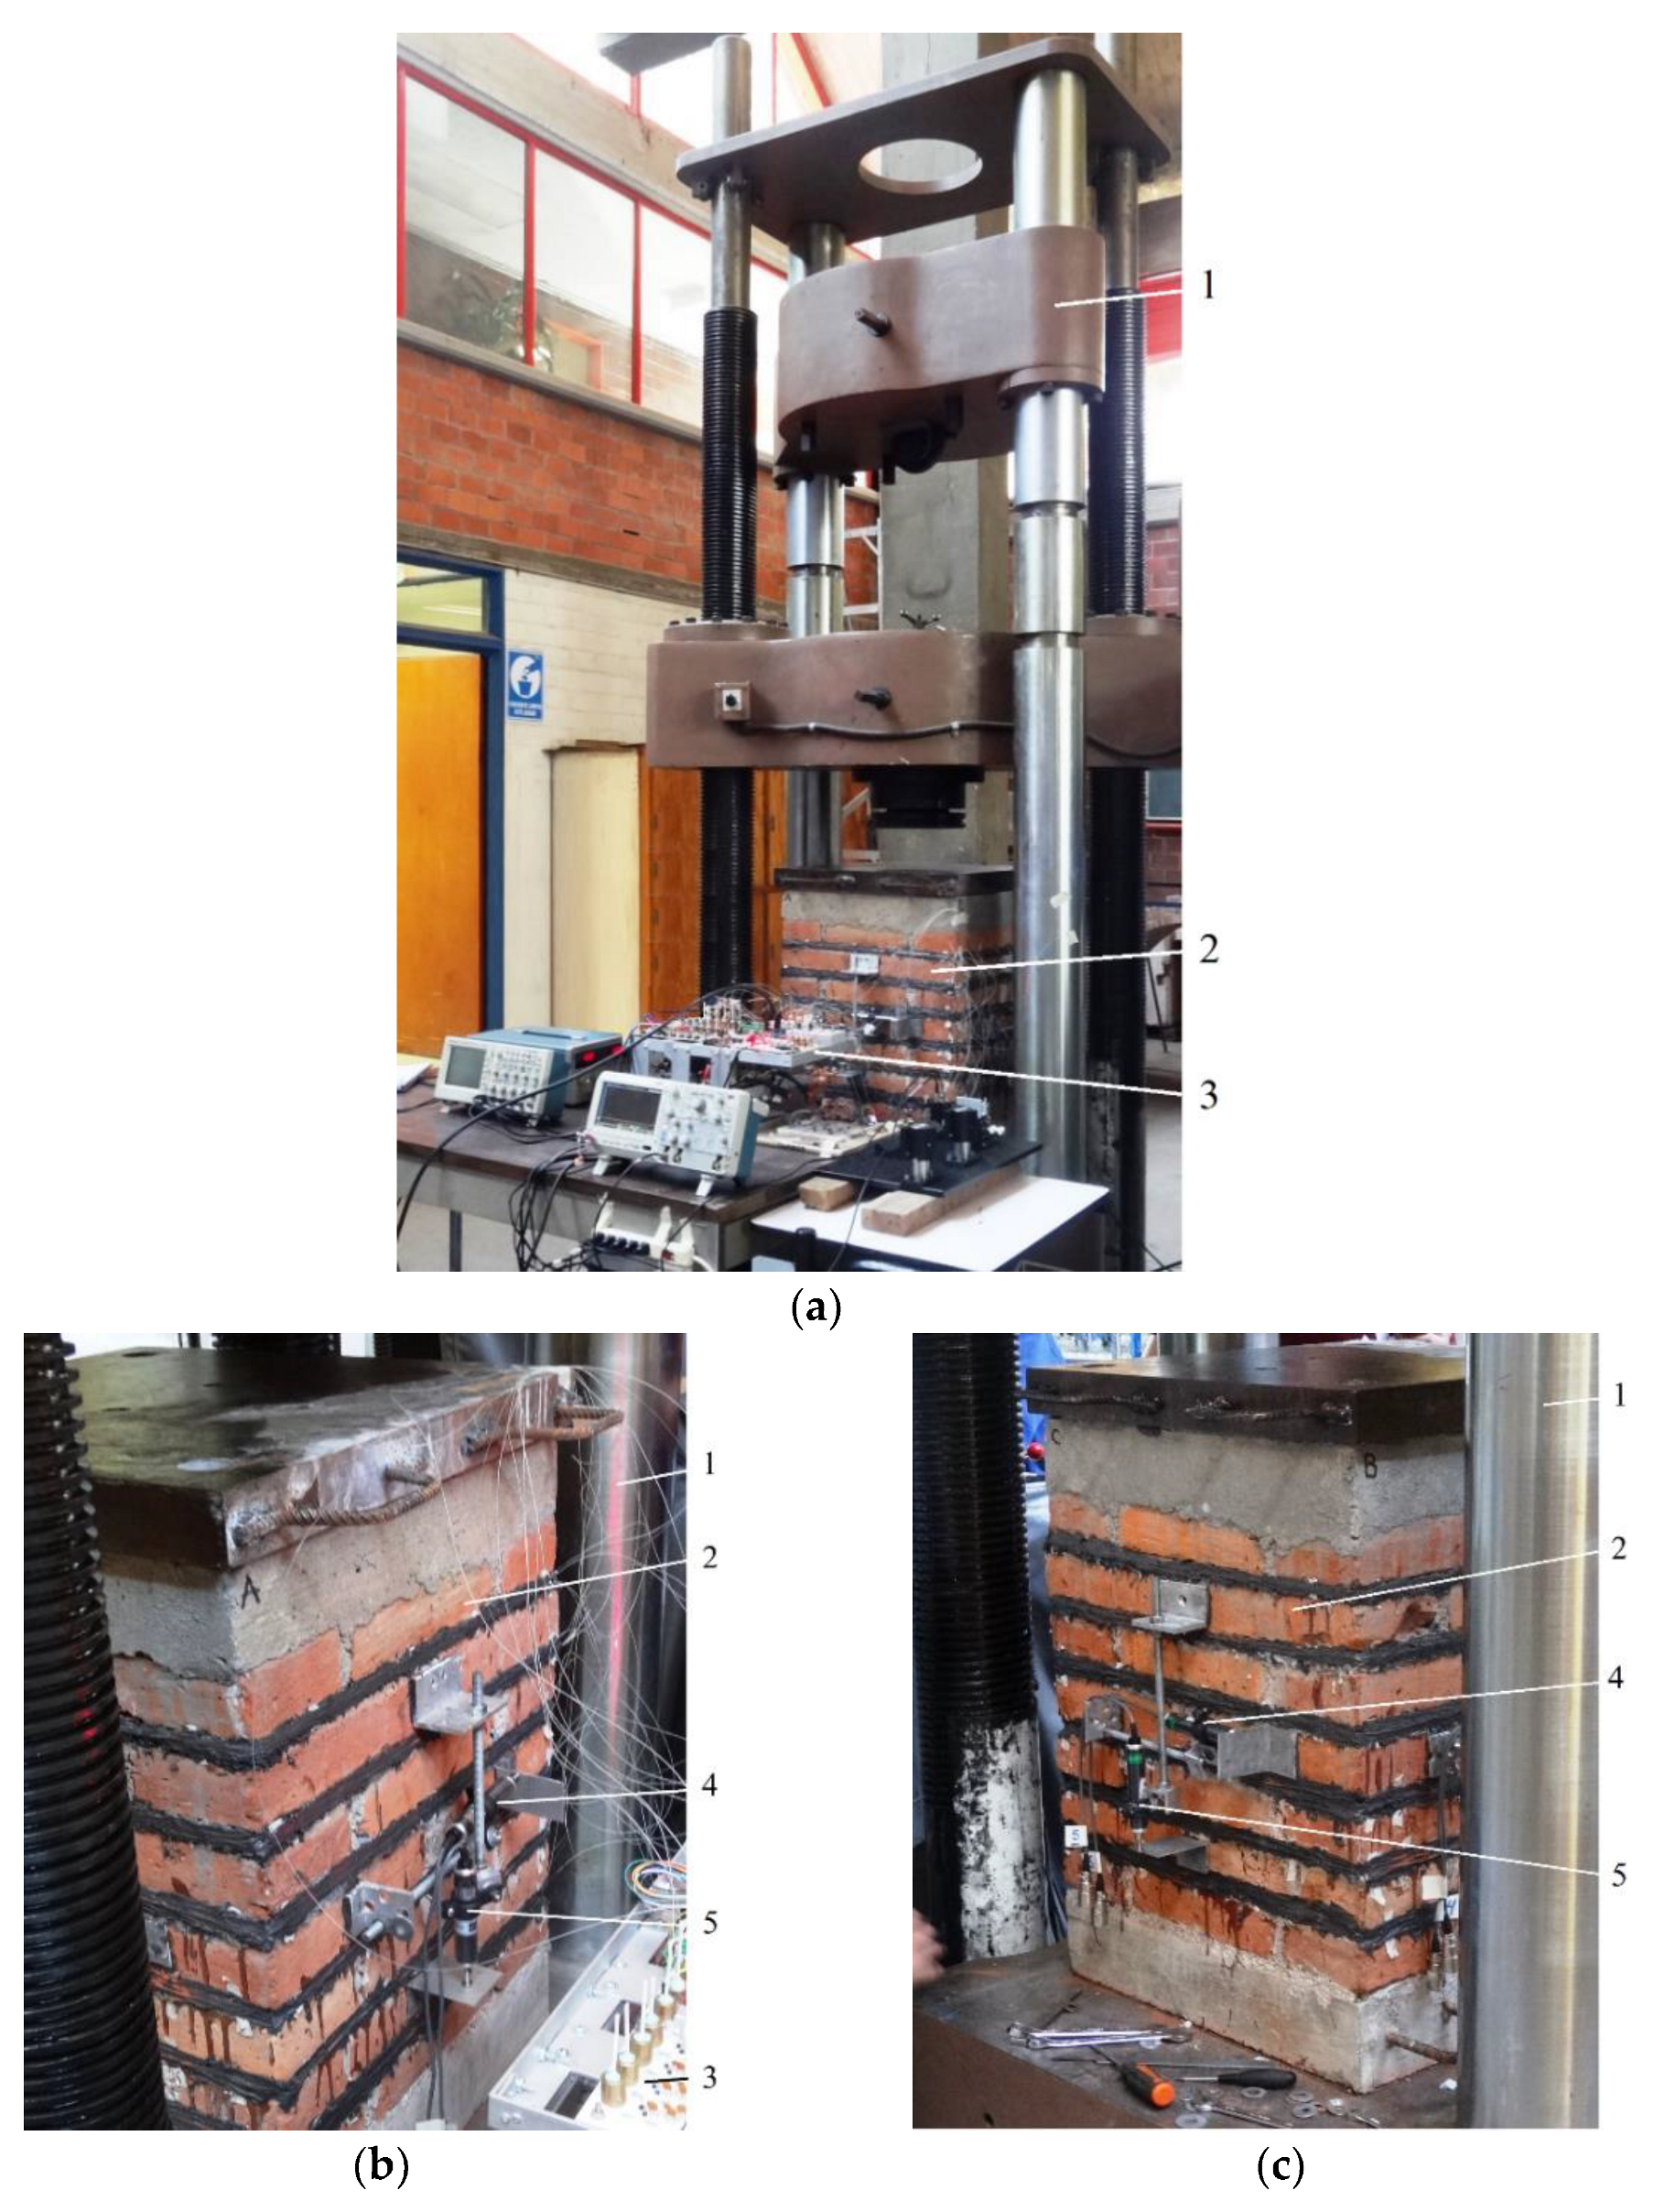
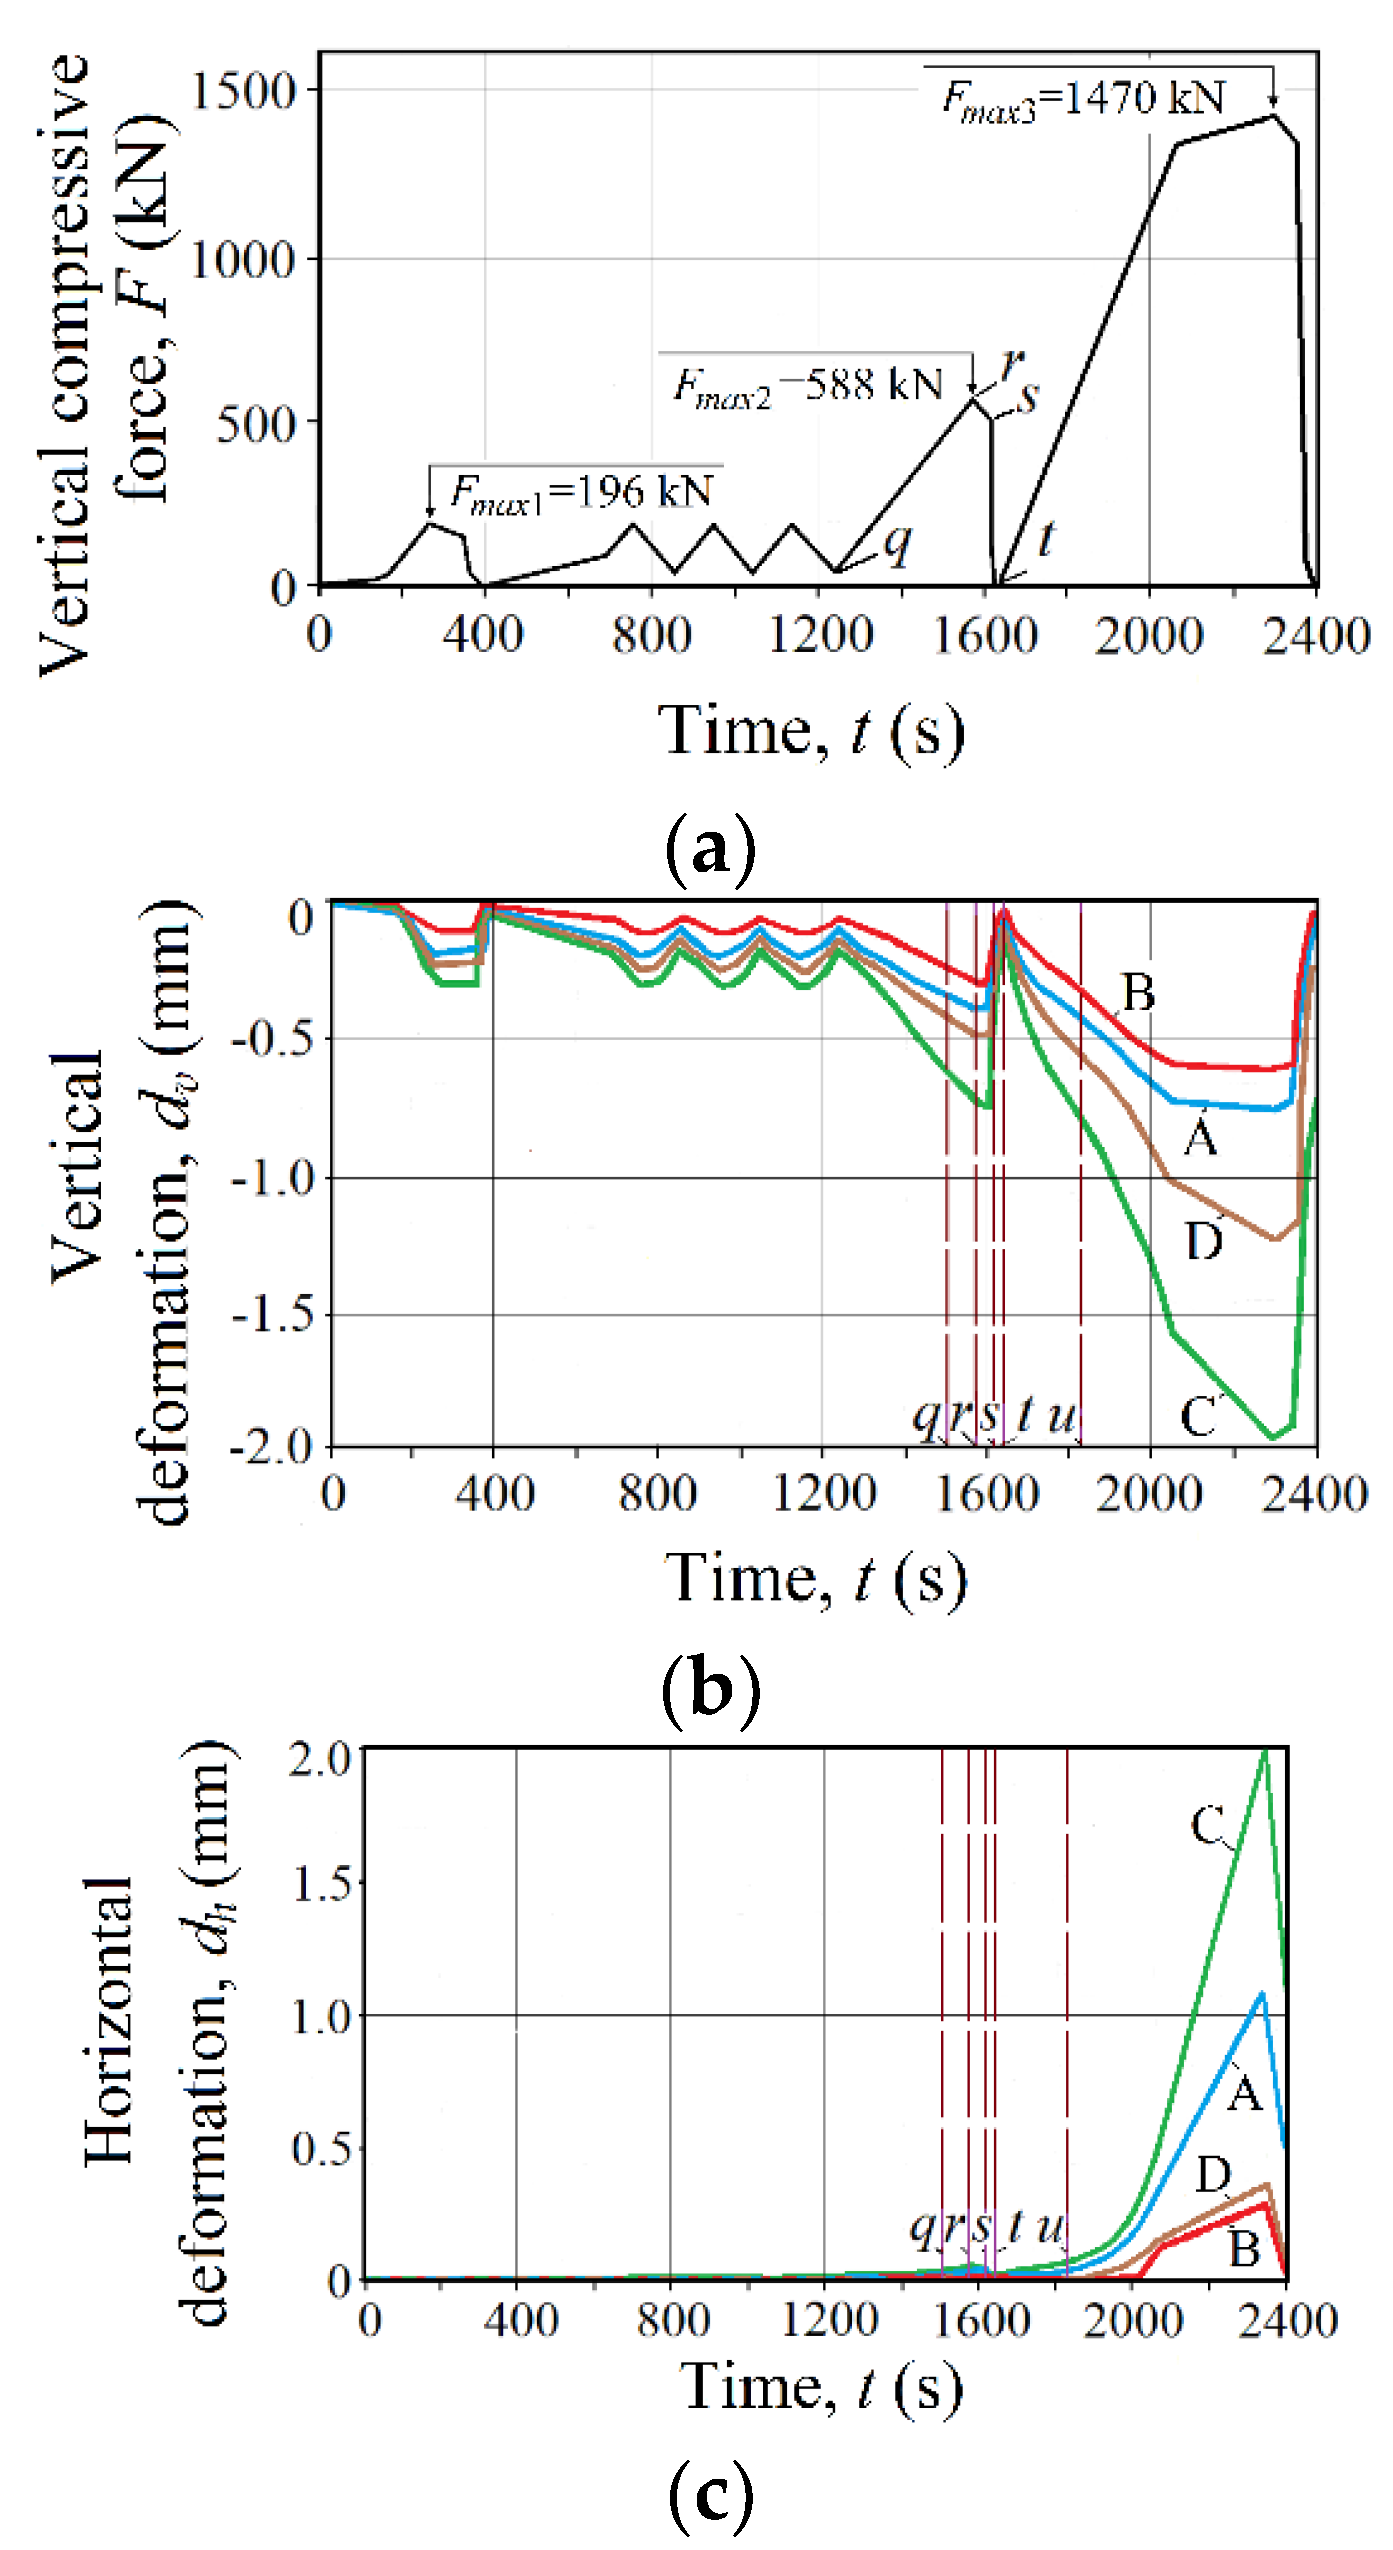
2.5. Structural Load Test
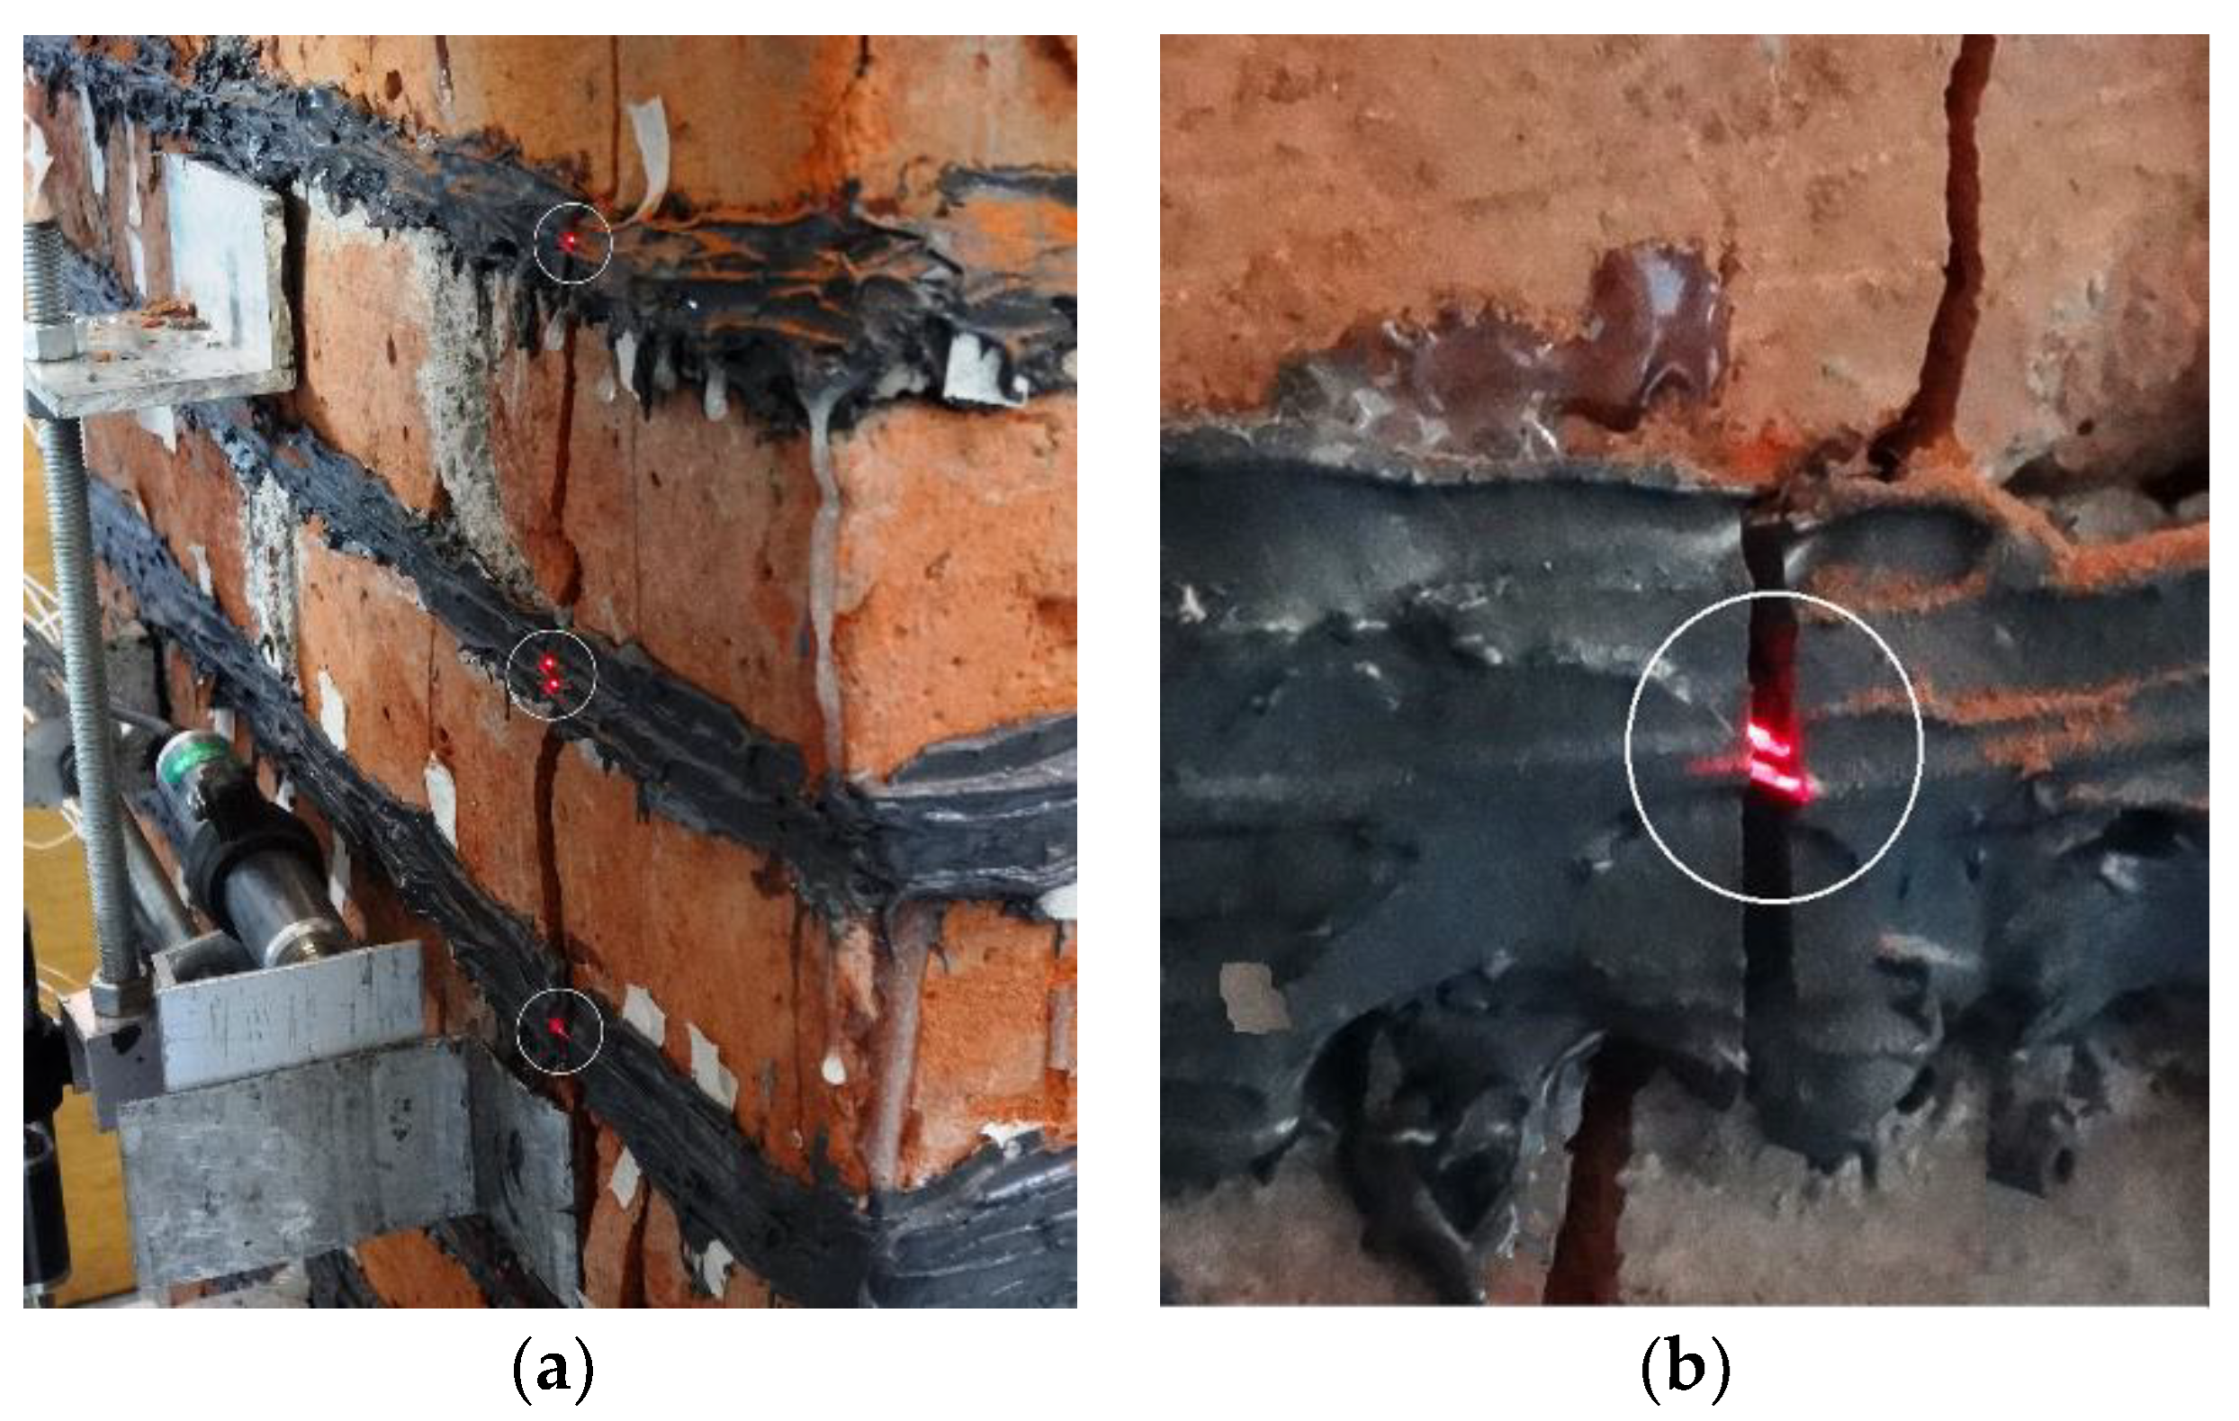
3. Results
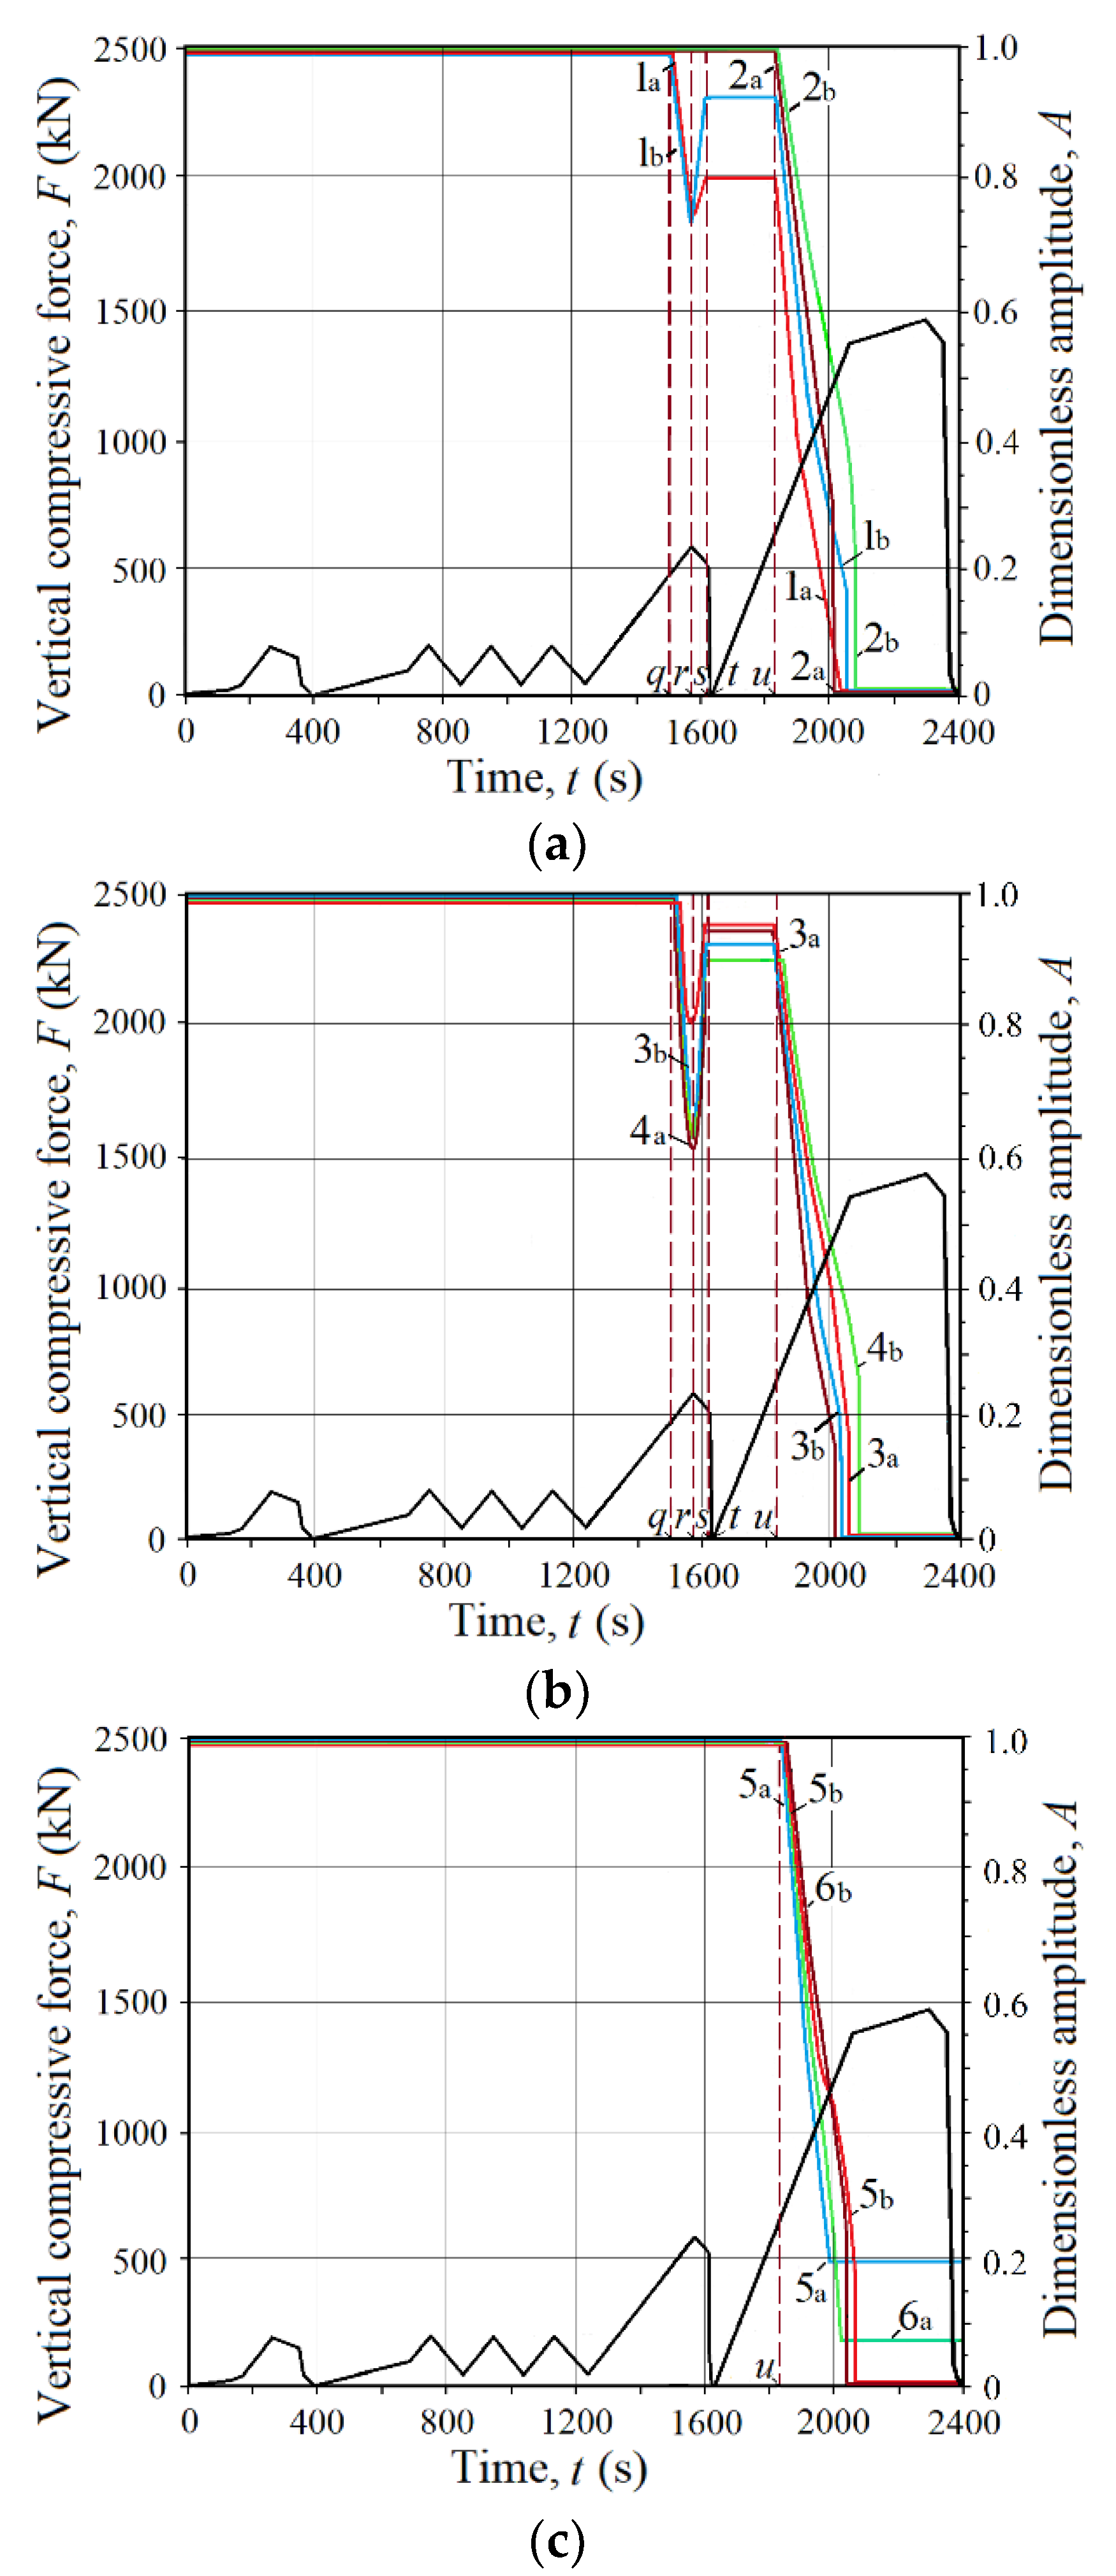
3.1. Data Overview
3.2. Statistical and Probabilistic Evaluation
4. Discussion
- -
- The use of ordinary optical fibers of silica without any built-in special sensing elements, such as gratings and tapers. This contributes to the low cost of the optical fiber detector array.
- -
- The use of multi-mode optical fibers rather than single-mode optical fibers. Multi-mode optical fibers have a large core diameter, which allows the use of inexpensive and reliable LEDs instead of expensive and delicate semiconductor lasers needed to efficiently launch light into the small diameter core of single-mode optical fibers.
- -
- The use of optical fibers with their original polymer coating. The removal of the polymer coating used in the manufacture of FBGs with subsequent recoating compromises the strength of the optical fiber. Keeping the original coating intact contributes to the long service life and reliability of optical fibers.
- -
- The use of a sufficiently large number of optical fibers in the crack detection array. This makes it possible to reliably detect structural cracks of a certain width.
- -
- The use of a binary conversion and interpretation of the optical signals.
- -
- The use of time division multiplexing (TDM) to monitor the optical transmission of all fibers of the crack detection array. TDM is much simpler and cheaper than the optical spectral multiplexing used in distributed FBG and OFDR sensors.
5. Conclusions
Author Contributions
Funding
Informed Consent Statement
Acknowledgments
Conflicts of Interest
References
- Jiang, Y.; Yuan, Y. Emergency logistics in a large-scale disaster context: Achievements and challenges. Int. J. Environ. Res. Pub. Health 2019, 5, 779. [Google Scholar] [CrossRef] [PubMed] [Green Version]
- Patrick, J. Haiti earthquake response: Emerging evaluation lessons. Eval. Insights 2011, 1, 1–14. Available online: https://alnap.org/help-library/haiti-earthquake-response-emerging-evaluation-lessons (accessed on 12 April 2022).
- Ruiz-Sandoval, M.E.; Rivera, E.; Fernandez-Sola, L.R. Mexico’s earthquake: Description, effects, and reconstruction. A particular case. In Proceedings of the International Conference on Critical Thinking in Sustainable Rehabilitation and Risk Management of the Built Environment, Iași, Romania, 7–9 November 2019; CRIT-RE-BUILT 2019. Rotaru, A., Ed.; Springer: Berlin/Heidelberg, Germany, 2019; pp. 47–57. [Google Scholar] [CrossRef]
- Tena-Colunga, A.; Hernandez-Ramirez, H.; Godinez-Dominguez, E.A.; Perez-Rocha, L.E.; Grande-Vega, A.; Urbina-Californias, L.A. Seismic behavior of buildings in Mexico City during the 2017 Puebla–Morelos earthquake. Asian J. Civ. Eng. 2021, 4, 649–675. [Google Scholar] [CrossRef]
- Stepinac, M.; Lourenço, P.B.; Atalić, J.; Kišiček, T.; Uroš, M.; Baniček, M.; Šavor Novak, M. Damage classification of residential buildings in historical downtown after the ML5.5 earthquake in Zagreb, Croatia in 2020. Int. J. Disast. Risk Reduct. 2021, 56, 102140. [Google Scholar] [CrossRef]
- Lamego, P.; Lourenço, P.B.; Sousa, M.L.; Marques, R. Seismic vulnerability and risk analysis of the old building stock at urban scale: Application to a neighborhood in Lisbon. Bull. Earthq. Eng. 2017, 7, 2901–2937. [Google Scholar] [CrossRef]
- Giordano, P.F.; Iacovino, C.; Quqa, S.; Limongelli, M.P. The value of seismic structural health monitoring for post-earthquake building evacuation. Bull. Earthq. Eng. 2022. [Google Scholar] [CrossRef]
- Pinto, J.; Gülten, G.; Vieira, J.; Meltem, V.; Varum, H.; Bal, I.E.; Costa, A. Save the Tabique Construction. In Structural Rehabilitation of Old Buildings; Costa, A., Guedes, J., Varum, H., Eds.; Springer: Berlin/Heidelberg, Germany, 2014. [Google Scholar] [CrossRef]
- Pinto, J.; Cunha, S.; Soares, N.; Soares, E.; Cunha, V.M.C.F.; Ferreira, D.; Sá, A.B. Earth-based render of tabique walls—An experimental work contribution. Int. J. Archit. Herit. 2016, 2, 185–197. [Google Scholar] [CrossRef] [Green Version]
- Karic, A.; Atalić, J.; Kolbitsch, A. Seismic vulnerability of historic brick masonry buildings in Vienna. Bull. Earthq. Eng. 2022, 20, 4117–4145. [Google Scholar] [CrossRef]
- Hendry, E.A.W. Masonry walls: Materials and construction. Constr. Build. Mat. 2001, 8, 323–330. [Google Scholar] [CrossRef]
- Brownjohn, J.M.W. Structural health monitoring of civil infrastructure. Phil. Trans. R. Soc. Lond. A Math. Phys. Eng. Sci. 2007, 1851, 589–622. [Google Scholar] [CrossRef] [Green Version]
- Glisic, B.; Inaudi, D.; Casanova, N. SHM process as perceived through 350 projects. Proc. SPIE 2010, 7648, 26. [Google Scholar] [CrossRef] [Green Version]
- Goldfeld, Y.; Quadflieg, T.; Ben-Aarosh, S.; Gries, T. Micro and macro crack sensing in TRC beam under cyclic loading. J. Mech. Mat. Struct. 2017, 5, 579–601. [Google Scholar] [CrossRef]
- Cigada, A.; Corradi Dell’Acqua, L.; Mörlin Visconti Castiglione, B.; Scaccabarozzi, M.; Vanali, M.; Zappa, E. Structural health monitoring of an historical building: The main spire of the duomo di Milano. Int. J. Archit. Herit. 2017, 4, 511–518. [Google Scholar] [CrossRef]
- Ramos, L.; Marques, L.; Loureno, P.; DeRoeck, G.; Campos-Costa, A.; Roque, J. Monitoring historical masonry structures with operational modal analysis: Two case studies. Mech. Syst. Signal Proc. 2010, 5, 1291–1305. [Google Scholar] [CrossRef] [Green Version]
- Ubertini, F.; Comanducci, G.; Cavalagli, N. Vibration-based structural health monitoring of a historic bell-tower using output-only measurements and multivariate statistical analysis. Struct. Health Monit. 2016, 4, 438–457. [Google Scholar] [CrossRef]
- Godínez-Domínguez, E.A.; Tena-Colunga, A.; Perez-Rocha, L.E.; Archundia-Aranda, H.I.; Gomez-Bernal, A.; Ruiz-Torres, R.P.; Escamilla-Cruz, J.L. The September 7, 2017 Tehuantepec, Mexico, earthquake: Damage assessment in masonry structures for housing. Int. J. Disast. Risk Reduct. 2021, 56, 102123. [Google Scholar] [CrossRef]
- Senaldi, I.; Magenes, G.; Ingham, J.M. Damage assessment of unreinforced stone masonry buildings after the 2010–2011 Canterbury earthquakes. Int. J. Archit. Herit. 2014, 5, 605–627. [Google Scholar] [CrossRef]
- Palmisano, F. Rapid diagnosis of crack patterns of masonry buildings subjected to landslide-induced settlements by using the load path method. Int. J. Archit. Herit. 2014, 4, 438–456. [Google Scholar] [CrossRef]
- Yosef, L.; Goldfeld, Y. Smart self-sensory carbon-based textile reinforced concrete structures for structural health monitoring. Struct. Health Monit. 2020. [Google Scholar] [CrossRef]
- Bao, X.; Chen, L. Recent progress in distributed fiber optic sensors. Sensors 2012, 7, 8601–8639. [Google Scholar] [CrossRef] [Green Version]
- Ferdinand, P. The Evolution of Optical Fiber Sensors Technologies during the 35 Last Years and Their Applications in Structure Health Monitoring. In Proceedings of the EWSHM-7th European Workshop on Structural Health Monitoring, Nantes, France, 8–11 July 2014; pp. 914–929. Available online: https://hal.inria.fr/hal-01021251 (accessed on 10 April 2022).
- Ye, X.W.; Su, Y.H.; Han, J.P. Structural health monitoring of civil infrastructure using optical fiber sensing technology: A comprehensive review. Sci. World J. 2014, 2014, 652329. [Google Scholar] [CrossRef] [PubMed] [Green Version]
- Barrias, A.; Casas, J.R.; Villalba, S. A review of distributed optical fiber sensors for civil engineering. Sensors 2016, 5, 748. [Google Scholar] [CrossRef] [PubMed] [Green Version]
- Wu, T.; Liu, G.; Fu, S.; Xing, F. Recent progress of fiber-optic sensors for the structural health monitoring of civil infrastructure. Sensors 2020, 16, 4517. [Google Scholar] [CrossRef] [PubMed]
- Bado, M.F.; Casas, J.R. A review of recent distributed optical fiber sensors applications for civil engineering structural health monitoring. Sensors 2021, 5, 1818. [Google Scholar] [CrossRef]
- Tang, F.; Zhou, G.; Li, H.N.; Verstrynge, E. A review on fiber optic sensors for rebar corrosion monitoring in RC structures. Constr. Build. Mat. 2021, 313, 125578. [Google Scholar] [CrossRef]
- Kapogianni, E.; Kalogeras, I.; Psarropoulos, P.; Michalopoulou, D.; Eleftheriou, V.; Sakellariou, M. Suitability of optical fibre sensors and accelerographs for the multi-disciplinary monitoring of a historically complex site: The case of the Acropolis circuit wall and hill. Geotech. Geol. Eng. 2019, 37, 4405–4419. [Google Scholar] [CrossRef]
- Bellagamba, I.; Caponero, M.; Mongelli, M. Using fiber-optic sensors and 3D photogrammetric reconstruction for crack pattern monitoring of masonry structures at the Aurelian Walls in Rome, Italy. WIT Transact. Build. Env. 2019, 191, 457–465. [Google Scholar] [CrossRef]
- Cocking, S.; Thompson, D.; DeJong, M. Comparative evaluation of monitoring technologies for a historic skewed masonry arch railway bridge. In Proceedings of the International Conference on Arch Bridges, Porto, Portugal, 2–4 October 2019; Arêde, A., Costa, C., Eds.; Springer: Cham, Switzerland, 2019; Volume 11, pp. 439–446. [Google Scholar] [CrossRef]
- Alexakis, H.; Lau, F.D.H.; DeJong, M.J. Fibre optic sensing of ageing railway infrastructure enhanced with statistical shape analysis. J. Civ. Struct. Health Monit. 2021, 11, 49–67. [Google Scholar] [CrossRef]
- Acikgoz, S.; Fidler, P.R.A.; Pascariello, M.N.; Kechavarzi, C.; Bilotta, E.; DeJong, M.J.; Mair, R.J. A fibre-optic strain measurement system to monitor the impact of tunnelling on nearby heritage masonry buildings. Int. J. Archit. Herit. 2021. [Google Scholar] [CrossRef]
- Berrocal, C.G.; Fernandez, I.; Bado, M.F.; Casas, J.R.; Rempling, R. Assessment and visualization of performance indicators of reinforced concrete beams by distributed optical fibre sensing. Struct. Health Monitor. 2021, 6, 3309–3326. [Google Scholar] [CrossRef]
- Berrocal, C.G.; Fernandez, I.; Rempling, R. Crack monitoring in reinforced concrete beams by distributed optical fiber sensors. Struct. Infrastruct. Eng. 2021, 1, 124–139. [Google Scholar] [CrossRef] [Green Version]
- Wu, J.; Liu, H.; Yang, P.; Tang, B.; Wei, G. Quantitative strain measurement and crack opening estimate in concrete structures based on OFDR technology. Opt. Fib. Technol. 2020, 60, 102354. [Google Scholar] [CrossRef]
- Brault, A.; Hoult, N. Monitoring reinforced concrete serviceability performance using fiber-optic sensors. ACI Struct. J. 2019, 1, 57–70. [Google Scholar] [CrossRef]
- Rodriguez, G.; Casas, J.R.; Villaba, S. Cracking assessment in concrete structures by distributed optical fiber. Smart Mat. Struct. 2015, 24, 035005. [Google Scholar] [CrossRef] [Green Version]
- Chen, R.; Zaghloul, M.A.S.; Yan, A.; Li, S.; Lu, G.; Ames, B.C.; Zolfaghari, N.; Bunger, A.P.; Li, M.J.; Chen, K.P. High resolution monitoring of strain fields in concrete during hydraulic fracturing processes. Opt. Express 2016, 4, 3894. [Google Scholar] [CrossRef]
- Verstrynge, E.; De Wilder, K.; Drougkas, A.; Voet, E.; Van Balen, K.; Wevers, M. Crack monitoring in historical masonry with distributed strain and acoustic emission sensing techniques. Const. Build. Mat. 2018, 162, 898–907. [Google Scholar] [CrossRef]
- Chan, T.H.T.; Yu, L.; Tam, H.Y.; Ni, Y.Q.; Liu, S.Y.; Chung, W.H.; Cheng, L.K. Fiber Bragg grating sensors for structural health monitoring of Tsing Ma bridge: Background and experimental observation. Eng. Struct. 2006, 5, 648–859. [Google Scholar] [CrossRef]
- Liu, H.B.; Zhang, Q.; Zhang, B.H. Structural health monitoring of a newly built high-piled wharf in a harbor with fiber Bragg grating sensor technology: Design and deployment. Smart Struct. Syst. 2017, 2, 163–173. [Google Scholar] [CrossRef]
- Rodriguez, M.; Castrillon, E. Manual de Evaluacion Postsismica de la Seguridad Estructural de Edificaciones; Informe No. 569; Instituto de Ingenieria, UNAM: Mexico City, Mexico, 1995; Available online: https://datosabiertos.unam.mx/IINGEN:RUSI:569 (accessed on 10 April 2022).
- Federal Emergency Management Agency. FEMA P-154 Rapid Visual Screening of Buildings for Potential Seismic Hazards: A Handbook, 3rd ed.; Federal Emergency Management Agency: Washington, DC, USA, 2015. Available online: https://fema.gov/sites/default/files/2020-07/fema_earthquakes_rapid-visual-screening-of-buildings-for-potential-seismic-hazards-supporting-documentation-third-edition-fema-p-155.pdf (accessed on 12 April 2022).
- Building Research Establishment. Assessment of Damage in Low-Rise Buildings with Particular Reference to Progressive Foundation Movement; Digest 251; Building Research Establishment: Watford, UK, 1990; ISBN 978-0-85125-461-6. [Google Scholar]
- Hale, K.F.; Hockenhuli, B.S.; Christodoulou, G. The application of optical fibers as witness devices for the detection of plastic strain and cracking. Strain 1980, 4, 150–154. [Google Scholar] [CrossRef]
- Crane, R.M.; Macander, A.B.; Gagorik, J. Fiber optics for a damage assessment system for fiber reinforced plastic composite structures. In Review of Progress in Quantitative Nondestructive Evaluation. Library of Congress Cataloging in Publication Data, Vol 2A; Thompson, D.O., Chimenti, D.E., Eds.; Springer: Boston, MA, USA, 1983; pp. 141–1430. [Google Scholar] [CrossRef] [Green Version]
- Balageas, D.; Bourasseau, S.; Dupont, M.; Bocherens, E.; Dewynter-Marty, V.; Ferdinand, P. Comparison between non-destructive evaluation techniques and integrated fiber optic health monitoring systems for composite sandwich structures. J. Intell. Mat. Syst. Struct. 2000, 6, 426–437. [Google Scholar] [CrossRef]
- Romaniuk, R. Tensile Strength of Tailored Optical Fibers. Opto-Electron. Rev. 2000, 2, 101–116. Available online: https://citeseerx.ist.psu.edu/viewdoc/download?doi=10.1.1.474.6168&rep=rep1&type=pdf (accessed on 10 April 2022).
- Matusewicz, M.A.; Wójcik, J.; Mergo, P.; Walewski, A. Mechanical strength of photonic crystal fibres. Photon. Lett. Pol. 2010, 1, 19–21. [Google Scholar] [CrossRef]
- Todinov, M.T. The cumulative stress hazard density as an alternative to the Weibull model. Int. J. Solid. Struct. 2010, 24, 3286–3296. [Google Scholar] [CrossRef] [Green Version]
- Antunes, P.; Lima, H.; Monteiro, J.; Andre, P.S. Elastic constant measurement for standard and photosensitive single mode optical fibres. Microw. Opt. Technol. Lett. 2008, 9, 2467–2469. [Google Scholar] [CrossRef]
- Backes, H.P. Tensile Strength of Masonry. In Proceedings of the 7th International Brick Masonry Conference, Melbourne, Australia, 17–20 February 1985; pp. 779–790. Available online: https://hms.civil.uminho.pt/ibmac/1985/779.pdf (accessed on 12 April 2022).
- Shena, W.; Wanga, X.; Xua, L.; Zhao, Y. Strain transferring mechanism analysis of the substrate-bonded FBG sensor. Optik 2018, 154, 441–452. [Google Scholar] [CrossRef]
- Wang, H.; Jiang, L.; Xiang, P. Improving the durability of optical fiber sensor based on strain transfer analysis. Opt. Fib. Technol. 2018, 1, 97–104. [Google Scholar] [CrossRef]
- Wang, H.; Jiang, L.; Xiang, P. Priority design parameters of industrialized optical fiber sensors in civil engineering. Opt. Laser Technol. 2018, 100, 119–128. [Google Scholar] [CrossRef]
- Wang, H.; Jiang, L.; Xiang, P. Strain transfer theory of industrialized optical fiber-based sensors in civil engineering: A review on measurement accuracy, design, and calibration. Sens. Actuators A Phys. 2019, 285, 414–426. [Google Scholar] [CrossRef]
- Alj, I.; Quiertant, M.; Khadour, A.; Grando, Q.; Terrade, B.; Renaud, J.C.; Benzarti, K. Experimental and numerical investigation on the strain response of distributed optical fiber sensors bonded to concrete: Influence of the adhesive stiffness on crack monitoring performance. Sensors 2020, 18, 5144. [Google Scholar] [CrossRef]
- Khotiaintsev, S.; Beltran-Hernandez, A.; Gonzalez-Tinoco, J.E.; Guzman-Olguin, H.; Aguilar-Ramos, G. Structural health monitoring of concrete elements with embedded arrays of optical fibers. In Proceedings of the Health Monitoring of Structural and Biological Systems 2013, San Diego, CA, USA, 10–14 March 2013; Volume 8695, pp. 267–272. [Google Scholar] [CrossRef]
- Gonzalez-Tinoco, J.E.; Gomez-Rosas, E.R.; Guzman-Olguin, H.; Khotiaintsev, S.; Zuñiga-Bravo, M.A. Monitoring of transverse displacement of reinforced concrete beams under flexural loading with embedded arrays of optical fibers. In Proceedings of the Structural Health Monitoring and Inspection of Advanced Materials, Aerospace, and Civil Infrastructure 2015, San Diego, CA, USA, 8–12 March 2015; Volume 9437, pp. 155–161. [Google Scholar] [CrossRef]
- Gonzalez-Tinoco, J.E.; Martinez-Gonzalez, D.M.; Miron-Carrasco, J.; Khotiaintsev, S.; Guzman-Olguin, H.J.; Lopez-Bautista, M.C.; Sanchez-Ramirez, A.R. Specialized optical fibre sensor array for structural damage detection. In Proceedings of the 2016 10th International Symposium on Communication Systems, Networks and Digital Signal Processing (CSNDSP), Prague, Czech Republic, 20–22 July 2016; IEEE: Piscataway, NJ, USA, 2016. [Google Scholar] [CrossRef]
- Hurtado-De Mendoza-Lopez, A.; Khotiaintsev, S.; Guzman-Olguin, H.J.; Reyes, D.A.H.; Lopez-Mancera, J.A.; Zuniga-Bravo, M. Application of fiber optic light guides with quartz core and cladding and plastic coating as indicators of the emergence of cracks in brickwork. J. Opt. Technol. 2020, 2, 132–136. [Google Scholar] [CrossRef]
- TIA-455-28 FOTP-28; Measuring Dynamic Strength and Fatigue Parameters of Optical Fibers by Tension. Telecommunications Industry Association: Arlington, VA, USA, 1999. Available online: https://standards.globalspec.com/std/734963/tia-455-28 (accessed on 11 April 2022).
- Gonzalez-Tinoco, J.E.; Khotiaintsev, S.; Lopez-Bautista, M.C.; Timofeyev, V.I.; Vountesmery, Y.V. Arrays of optical fibers as detectors of cracks in brick structural elements. In Proceedings of the 2018 IEEE 38th International Conference on Electronics and Nanotechnology (ELNANO), Kyiv, Ukraine, 24–26 April 2018; pp. 717–720. [Google Scholar] [CrossRef]
- Glaesemann, G.S.; Dainese, P.; Edwards, M.; Dhliwayo, J. The Mechanical Reliability of Corning Optical Fiber in Small Bend Scenarios; WP1282; Corning: Glendale, AZ, USA, 2007; Available online: https://www.corning.com/media/worldwide/coc/documents/Fiber/white-paper/wp1282.pdf (accessed on 10 April 2022).
- Hines, W.W.; Montgomery, D.C.; Goldsman, D.M.; Borror, C.M. Probability and Statistics in Engineering, 4th ed.; John Wiley & Sons Inc.: Hoboken, NJ, USA, 2003; 655p, ISBN 0-471-24087-7. [Google Scholar]
- Aguilar Espinosa, A.A.; Fellows, N.A.; Durodola, J.F.; Fellows, L.J. Development of numerical model for the determination of crack opening and closure loads, for long cracks. Fatigue Fract. Eng. Mat. Struct. 2017, 4, 571–585. [Google Scholar] [CrossRef]
- Ramachandra, S.; Durodola, J.F.; Fellows, N.A.; Gerguri, S.; Thite, A. Experimental validation of an ANN model for random loading fatigue analysis. Int. J. Fatigue 2019, 126, 112–121. [Google Scholar] [CrossRef]
- Hersent, O.; Boswarthick, D.; Elloumi., O. The Internet of Things: Key Applications and Protocols; John Wiley & Sons Inc.: Hoboken, NJ, USA, 2012; 376p, ISBN 978-1-11999-435-0. [Google Scholar]


| Number of Optical Fibers of the Detection Array | The Range of Crack Width in Which the Fiber Break Occurs, ∆δc (mm) | ||||
|---|---|---|---|---|---|
| n | 1–1.5 (p = 0.167) | 1–2 (p = 0.333) | 1–3 (p = 0.583) | 1–4 (p = 0.833) | 1–5 (p = 1.0) |
| Probability that at least one fiber of an array of n optical fibers breaks, P1 | |||||
| 1 | 0.167 | 0.333 | 0.583 | 0.833 | 1.0 |
| 2 | 0.306 | 0.556 | 0.826 | 0.972 | 1.0 |
| 4 | 0.518 | 0.802 | 0.970 | >0.999 | 1.0 |
| 6 | 0.665 | 0.912 | 0.995 | >0.999 | 1.0 |
| 8 | 0.767 | 0.961 | >0.999 | >0.999 | 1.0 |
| 10 | 0.838 | 0.983 | >0.999 | >0.999 | 1.0 |
| 12 | 0.888 | 0.992 | >0.999 | >0.999 | 1.0 |
Publisher’s Note: MDPI stays neutral with regard to jurisdictional claims in published maps and institutional affiliations. |
© 2022 by the authors. Licensee MDPI, Basel, Switzerland. This article is an open access article distributed under the terms and conditions of the Creative Commons Attribution (CC BY) license (https://creativecommons.org/licenses/by/4.0/).
Share and Cite
Khotiaintsev, S.; Timofeyev, V. Assessment of Cracking in Masonry Structures Based on the Breakage of Ordinary Silica-Core Silica-Clad Optical Fibers. Appl. Sci. 2022, 12, 6885. https://doi.org/10.3390/app12146885
Khotiaintsev S, Timofeyev V. Assessment of Cracking in Masonry Structures Based on the Breakage of Ordinary Silica-Core Silica-Clad Optical Fibers. Applied Sciences. 2022; 12(14):6885. https://doi.org/10.3390/app12146885
Chicago/Turabian StyleKhotiaintsev, Sergei, and Volodymyr Timofeyev. 2022. "Assessment of Cracking in Masonry Structures Based on the Breakage of Ordinary Silica-Core Silica-Clad Optical Fibers" Applied Sciences 12, no. 14: 6885. https://doi.org/10.3390/app12146885